What is Bandwidth Monitor?
Introduction
Bandwidth Monitor is an add-on software to WOCU-Monitoring, specifically for bandwidth measurement in complex network environments, which checks the transmission quality on different connection streams from a centralised server and several unattended remote probes.
Bandwidth Monitor simplifies the monitoring of all network traffic and the amount of data transferred, allowing you to certify agreed bandwidths for different remote sites and generate reports with the results obtained.
Measuring bandwidth usage is key to improving network management. This is why it is recommended to monitor point-to-point traffic as a preliminary step to network monitoring with WOCU-Monitoring.
This union enhances the capabilities and benefits of both solutions, offering a comprehensive overview of the flows and operability of your network environment.
Main functions
✓ Distributed architecture
Traffic testing is performed between a central server with a fixed location and known IP address and several client devices, portable and reusable for testing in different locations.
✓ Unattended installation
The probe installation is unattended, obtains a network address automatically with connectivity to the central server and runs the configured software.
✓ Remote device identification
Client hosts have a serial number visible on the host box. This serial number is used to identify the host in the user interface.
✓ API REST
An API Rest is provided to consult information related to the tests carried out. In this way we facilitate the integration of any tool that wants to consume the generated reports.
✓ Complex environments and fault detection
Bandwidth measurement tests in complex environments, using different connection flows to flood possible paths and detecting potential faults and loops in the network.
✓ Interface for testing
All user operations to perform the tests are done through a web application served by the central server. It is not necessary to connect to the client hosts.
TCP and UDP protocol
Bandwidth Monitor performs bandwidth tests using both TCP protocol and UDP protocol. The latter is particularly interesting as it allows to obtain jitter and packet loss values (unlike TCP).
The main difference between TCP and UDP is that TCP uses processes to verify the correct sending of packets to the receiver, whereas with UDP packets are sent without any verification, but with the advantage of being faster.
If testing over TCP is not possible because of the need to have jitter and latency values, the use of the WOCU-Monitoring tool is recommended after the fact, which supports monitoring and supervision of these parameters for a wide variety of network hosts.
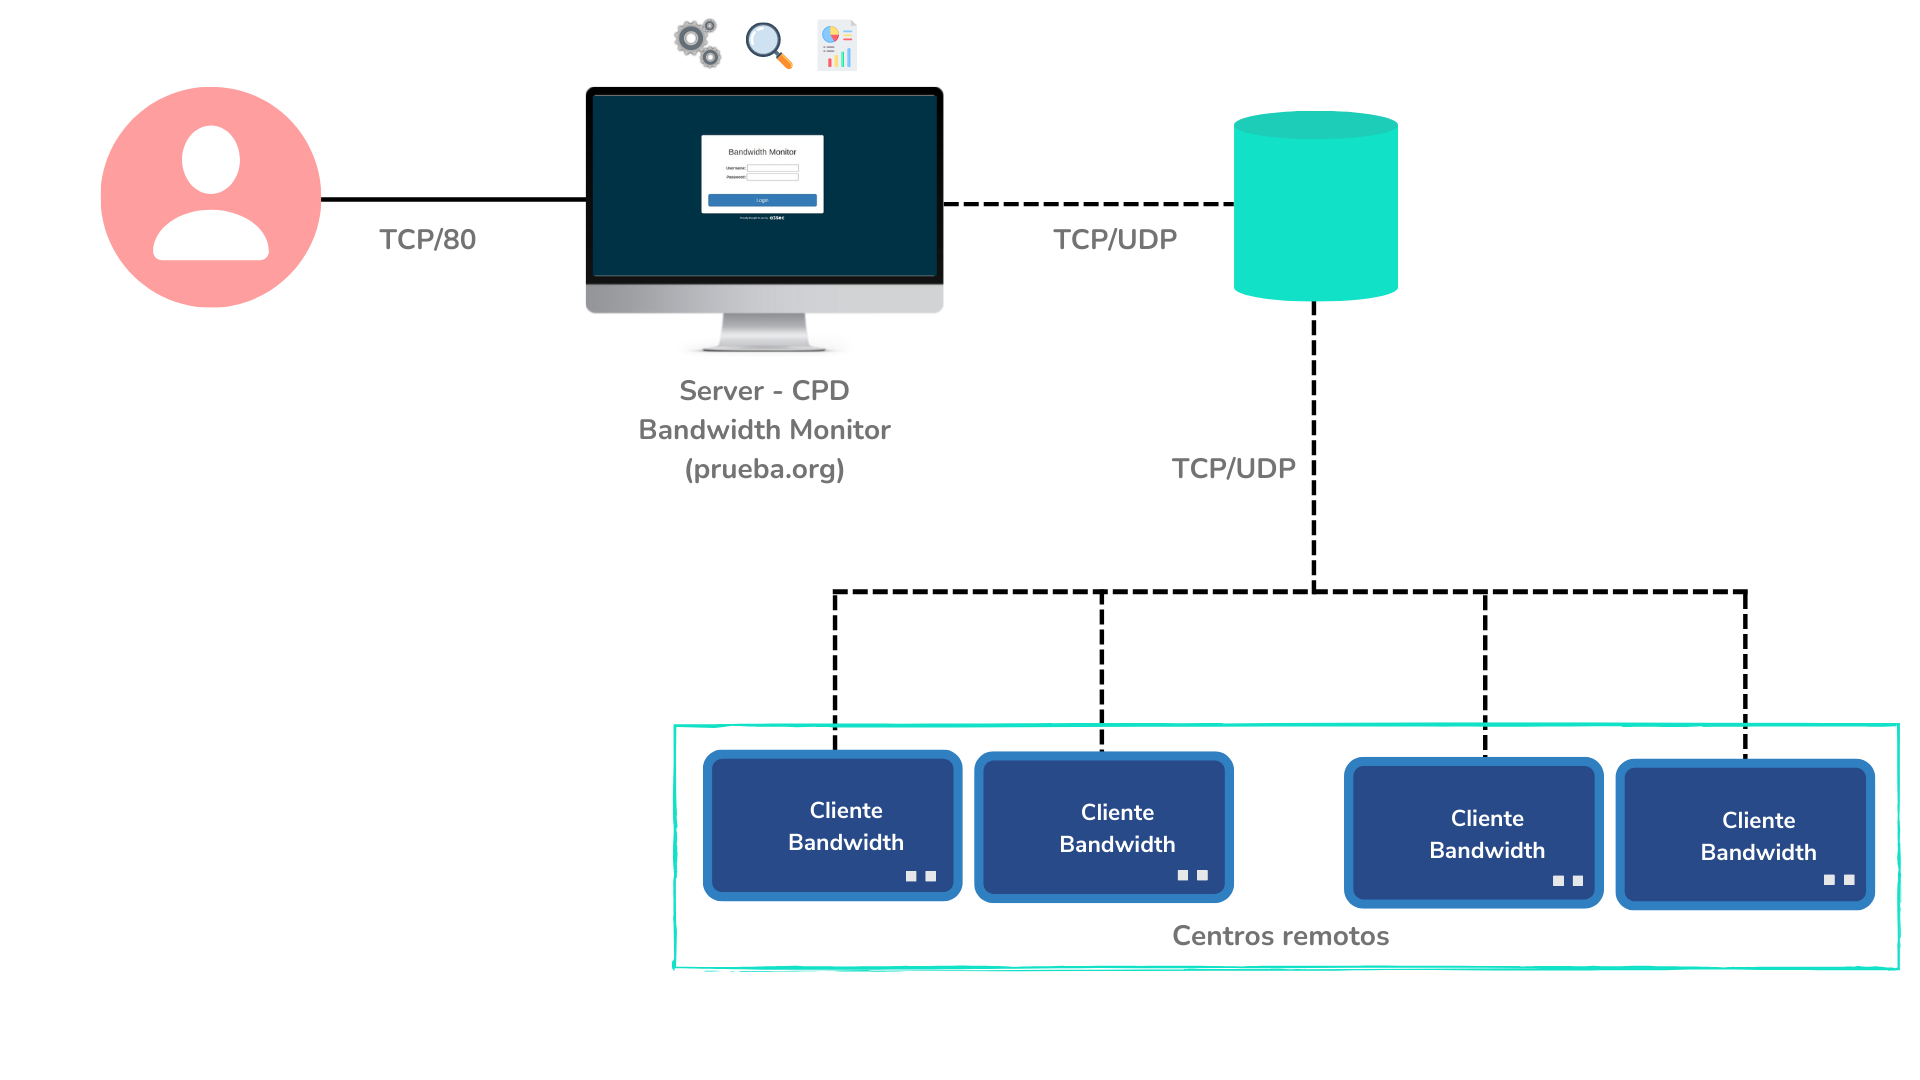
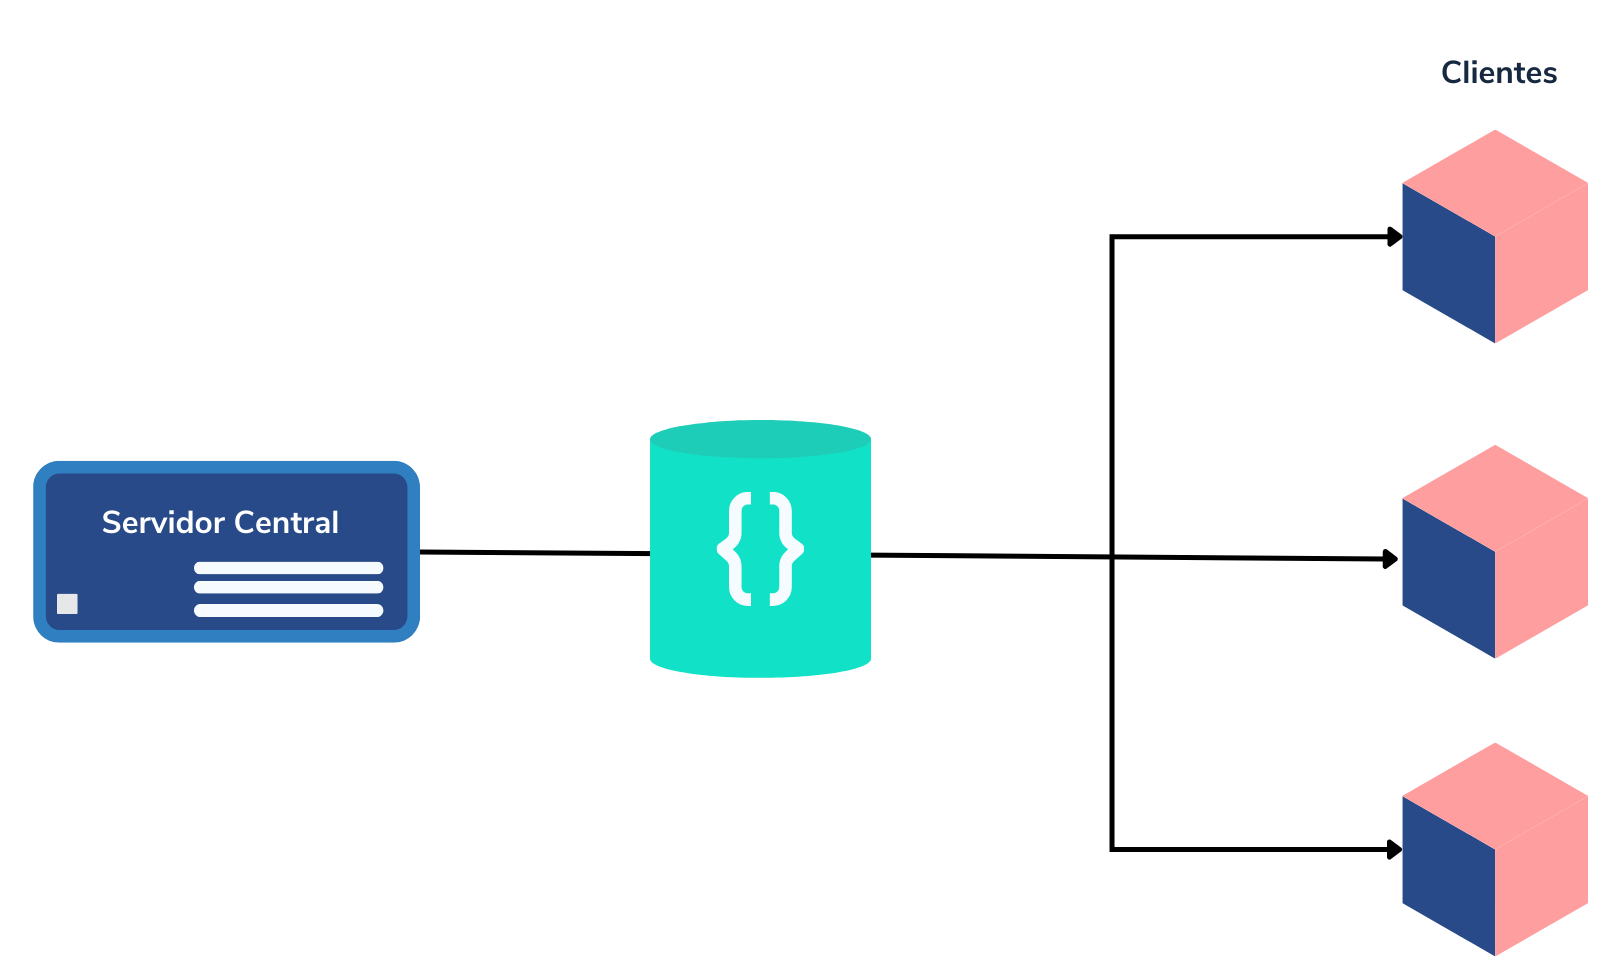
Architecture
Traffic tests are carried out between:
A central server with a fixed location and known IP address.
Several client hosts, portable and reusable for testing in different locations.
Client host installation
It is unattended, obtains a network address automatically with connectivity to the central server and runs the configured software.
Client hosts have a serial number visible on the host box. This serial number is used to identify the host in the user interface.
All user operations to perform the tests are done through a web application served by the central server, it is not necessary to connect to the client hosts.
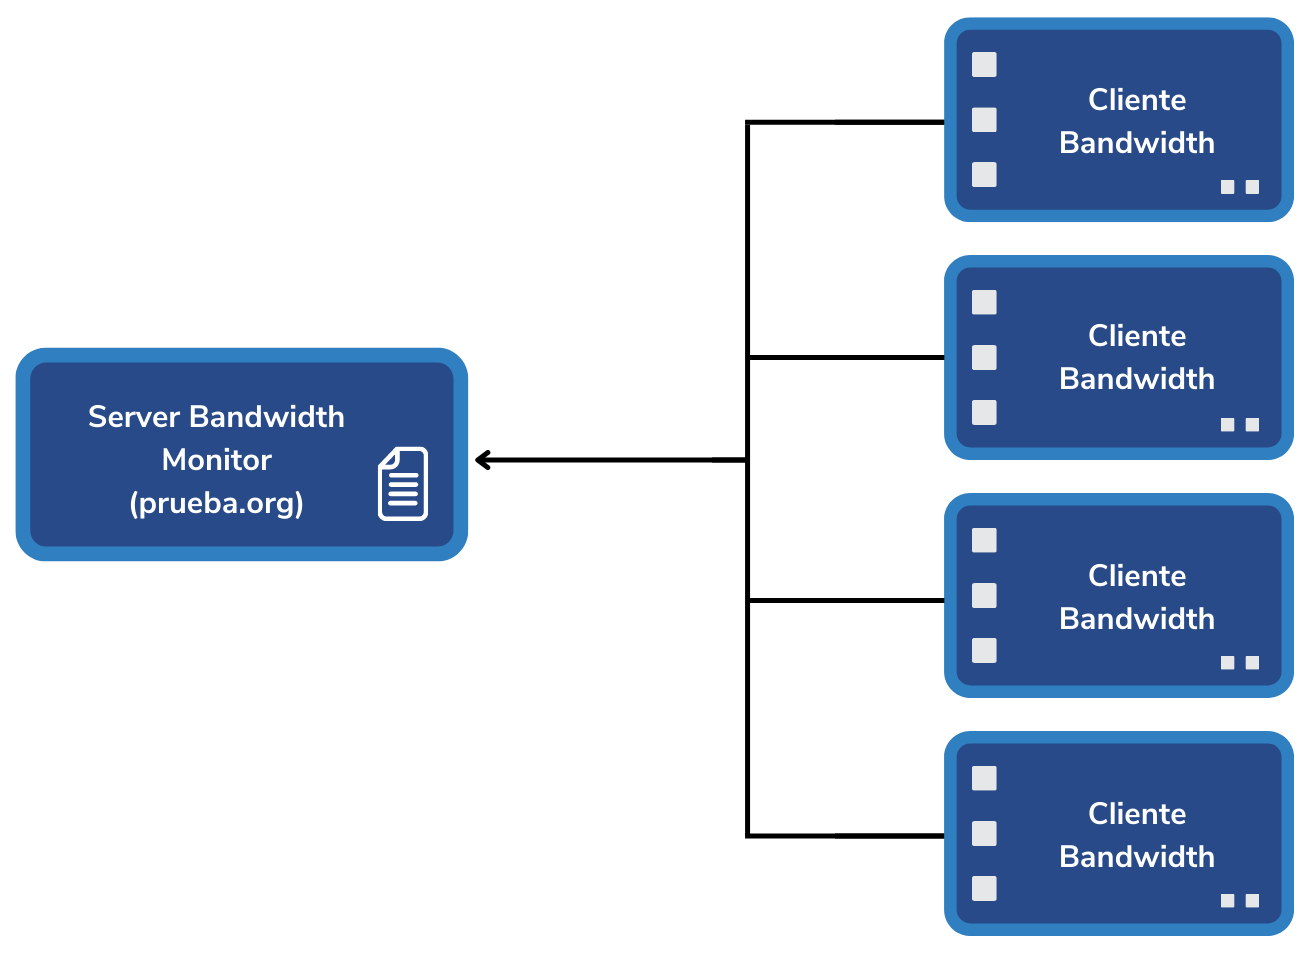
Flow and operations
Client hosts send a
keep-alivesignal every N seconds to the central server.The central server maintains a table with the hosts connected at any given time.
Tests are performed only against inventoried and connected hosts.
Inventoried but disconnected hosts are shown in historical mode.
The central server schedules the jobs by storing them in a backend accessible by the client hosts.
Each client host looks for a queue of messages with the name equal to its identifier in the backend of jobs.
The central server gets the results of the backend itself when the workers have finished their execution.
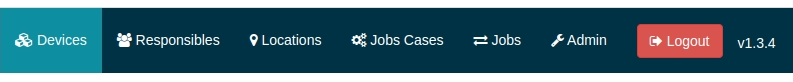
Components
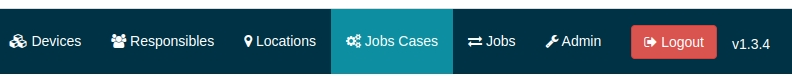
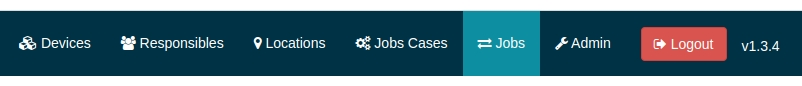
The main menu is available at the top of the interface and will remain accessible as the user navigates through the different modules of the application.

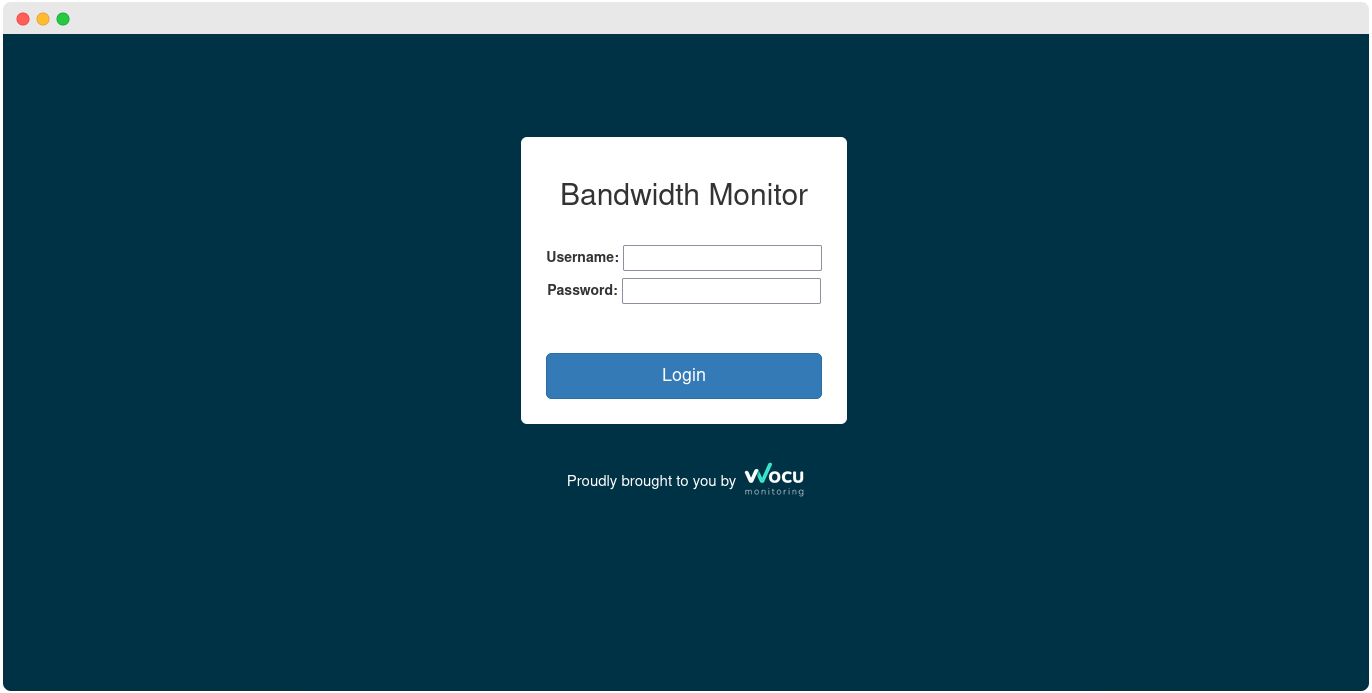
Login
Access to the tool through the web portal.
The first step to operate the tool is to enter your username and password. Then click on the Log in button to access Bandwidth Monitor.
Note
Contact your administrator to set up new users on the platform.
Devices
Detection and inventory of client hosts.
Hosts connected for the first time appear in the Discovered Hosts table and those already inventoried and managed in the application appear in the Inventory Hosts table.
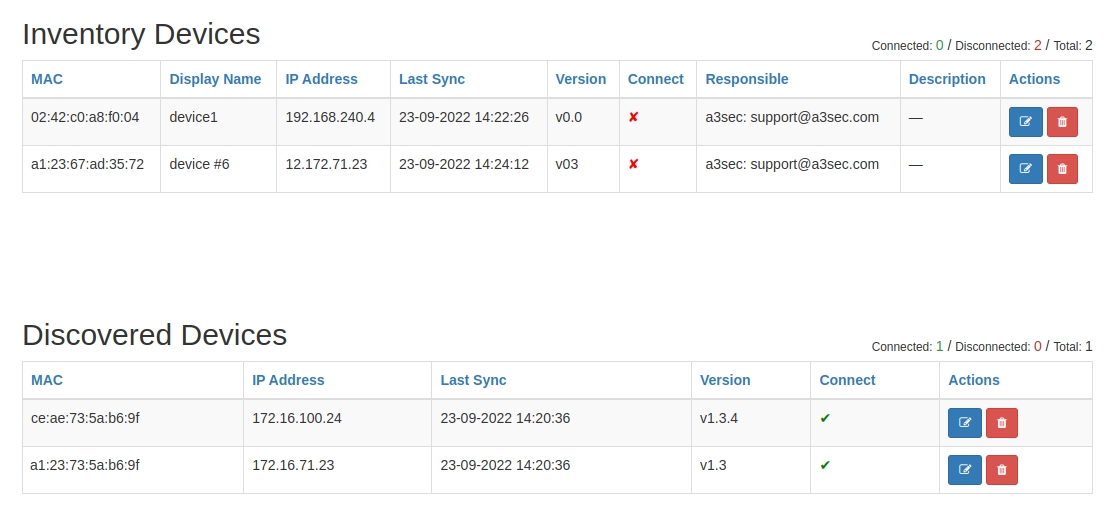
In addition, version compatibility with the hosts is checked.
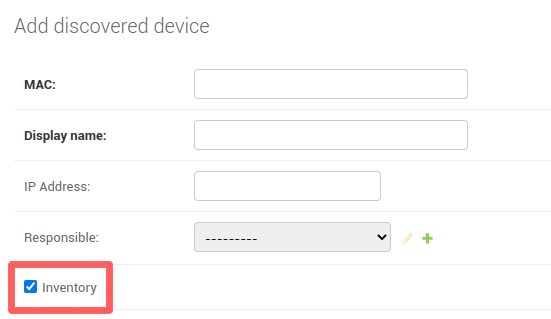
If we want to run bandwidth measurements using the discovered generator, it is necessary to inventory it by clicking on the Inventory attribute.
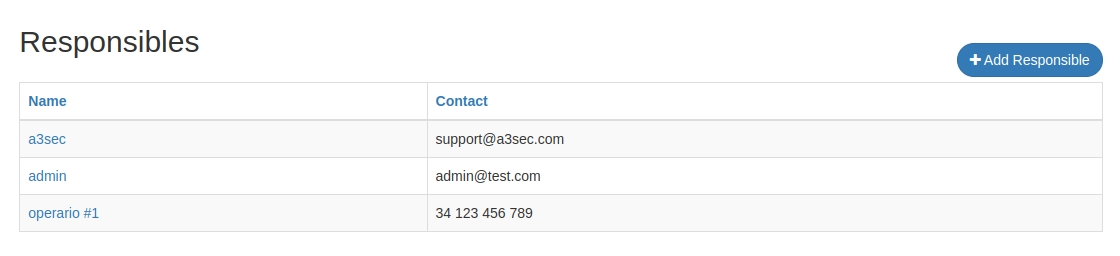
Responsibles

Space for all users associated with the managed hosts.
Hosts can be assigned to a responsible person with a contact number.
Locations

List of locations associated with the implemented traffic tests.
Measurement tests are always associated with a location, as the generators are mobile and can be used to obtain measurements at different locations.
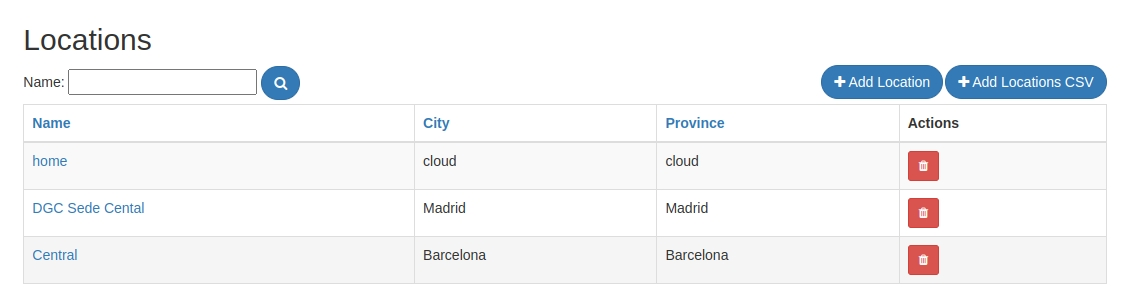
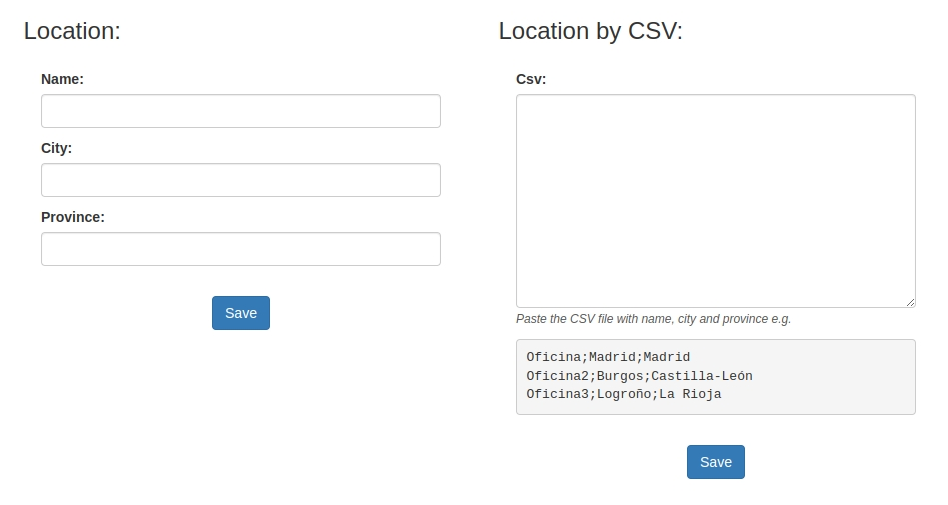
Locations can be added manually one by one or by copying a CSV file into a form.
Job cases
A Job Case is a definition of the parameters of a measurement test. They are templates that can be reused in any job.
The system, by default, only allows Job Cases to be defined by Administrator users.
The following fields can be specified in the traffic test settings:
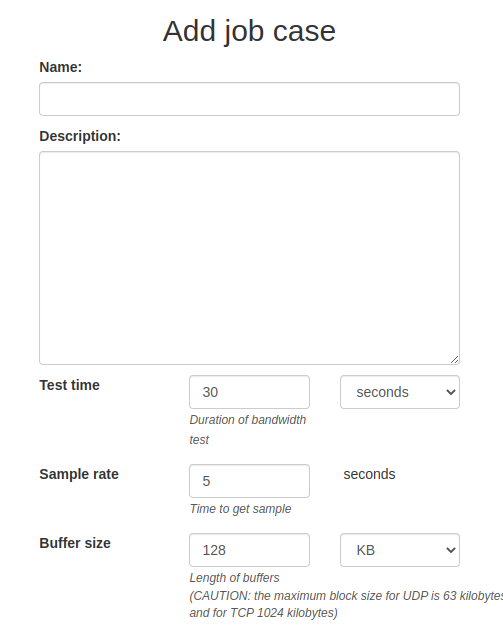
Name: name of the measurement test.
Description: additional information on the test.
Test time: duration of the test. Note that if multiple traffic flows are specified, half the time shall be used for one flow and half the time for the other.
Sample rate: results will be grouped by the defined time interval.
Buffer size: size of the buffer used for measurements. In TCP it is limited to
1024KBmaximum, while in UDP it is limited to63KB.
Instance definition
N instances can be defined for each measurement test. The parameters of each instance are:
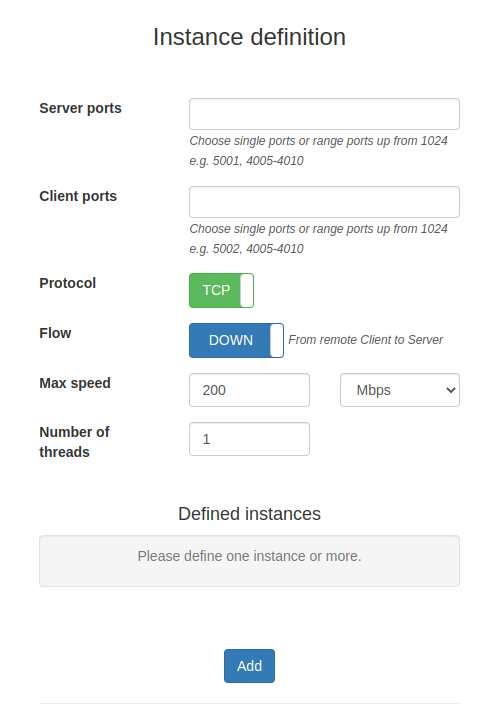
Server ports and Client ports: ports used for measurement. At least as many ports shall be configured as instances are defined.
Protocol: TCP o UDP.
Flow: Upstream (del servidor al cliente) y Downstream (del cliente al servidor).
Max Speed: maximum bandwidth of each instance.
Number of threads: instance multiplier, useful if you want to launch N equal instances.
Jobs
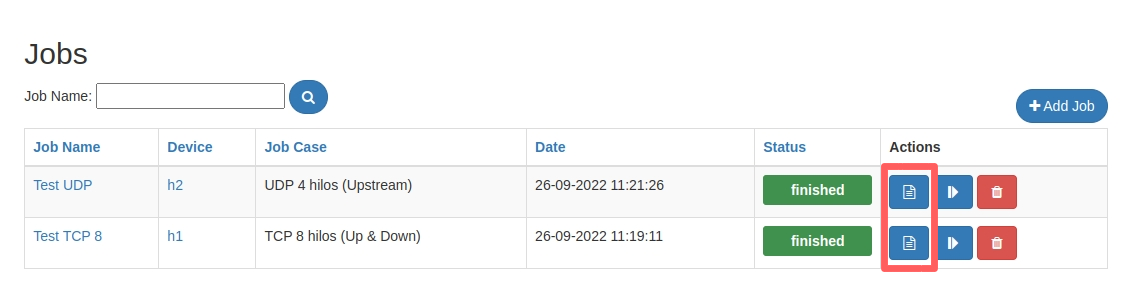
Epicentre for the execution of traffic tests and visualisation of results. Tests already completed and those currently in progress are shown.
To launch a bandwidth measurement test, the following parameters need to be specified:
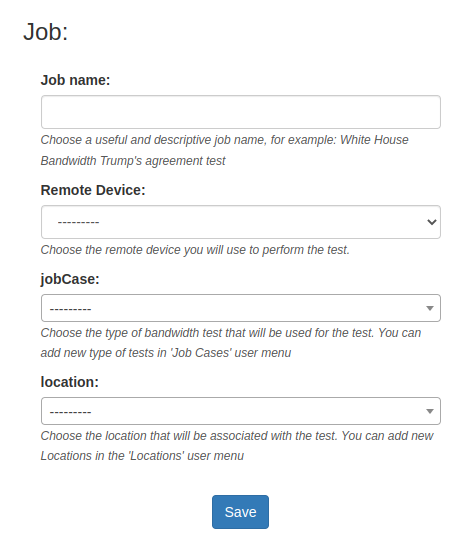
Job name: descriptive name for the test
Remote Host: Remote host used for the test
Job Case: template with the configuration to be used for the test
Job Location: location associated with the test
A results report is then generated for each completed test. To see your details, click on the Report button.
In addition, another identical test can be created using the Rerun button.
Reporting
The reports are a very effective tool that allows a simple and organised analysis of information through an easy and adaptable configuration.
The results are presented graphically in the form of line graphs: total bandwidth, average bandwidth per stream and bandwidth of each stream. And they can be exported in PDF format and generate a flat result (RAW).
As an example, the following technical test information is shown:
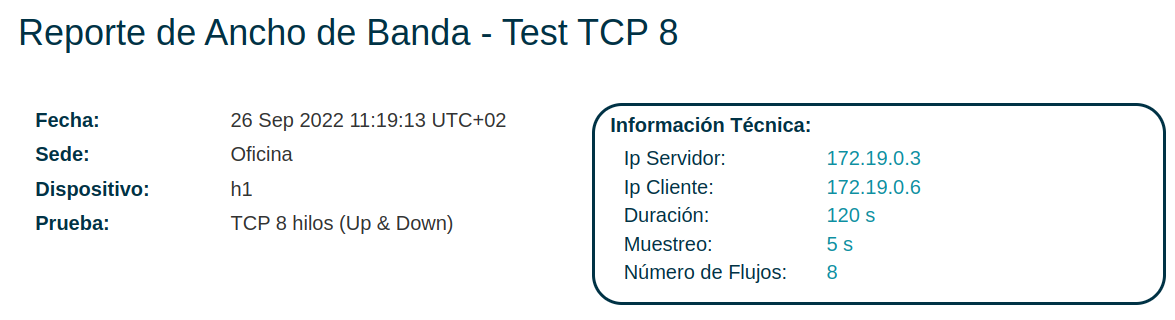
Date on which the test was performed.
Location over which the test was conducted.
Remote host used for testing.
Responsible or contact person for the test.
Type of test performed.
IP addressing.
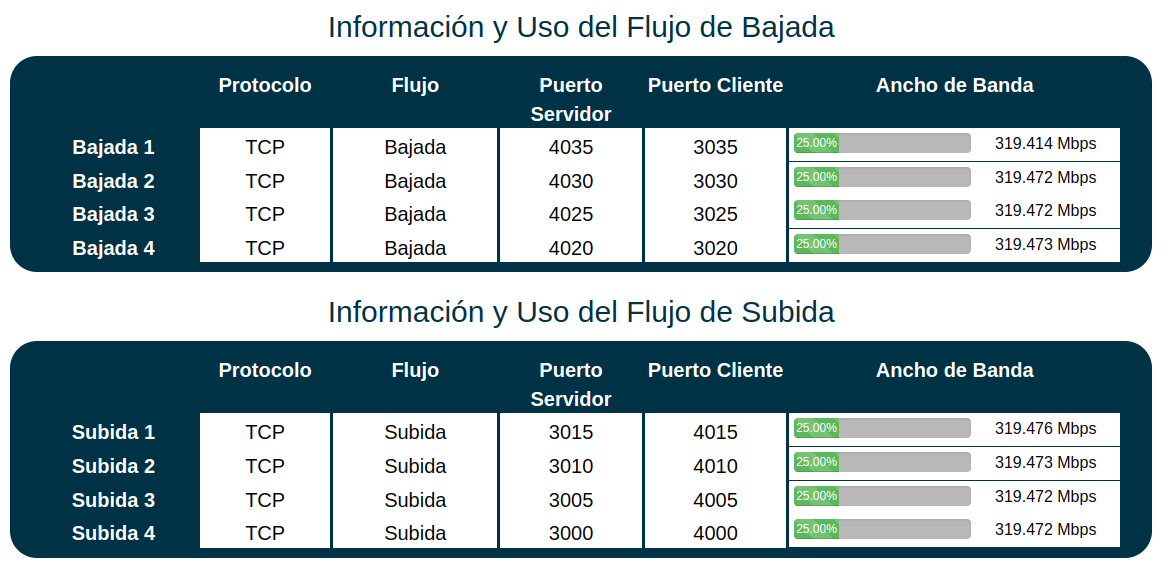
On the other hand, Upstream and Downstream flows are detailed: protocol, ports used, percentage of usage per flow, bandwidth per flow.
Graph obtained for a test with 8 TCP flows with 1.278 Gbps of peak traffic:
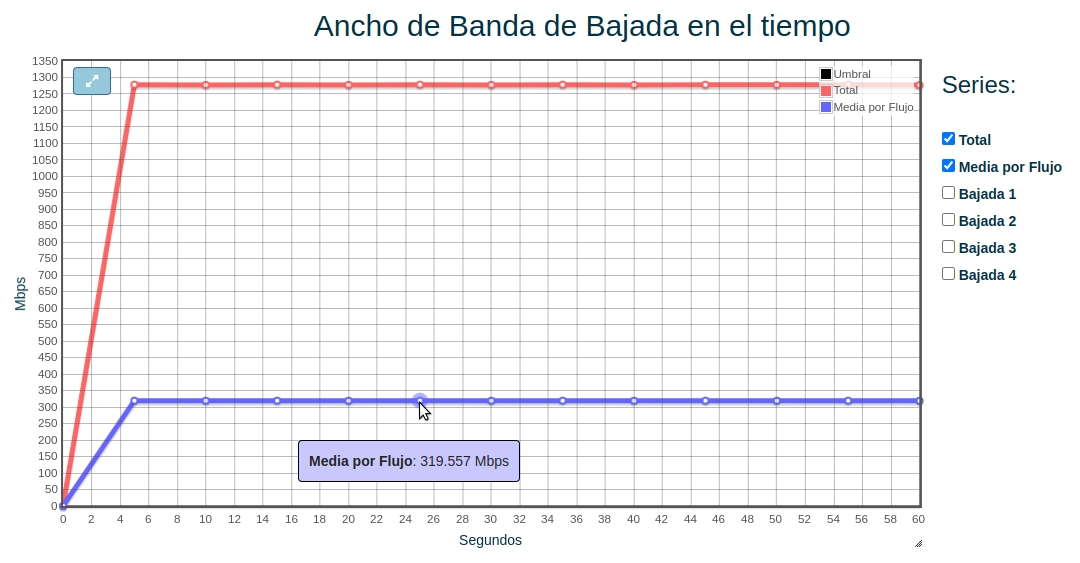
Full web length
Average bandwidth of flows
Bandwidth of each stream
Information regarding UDP transmission problems:
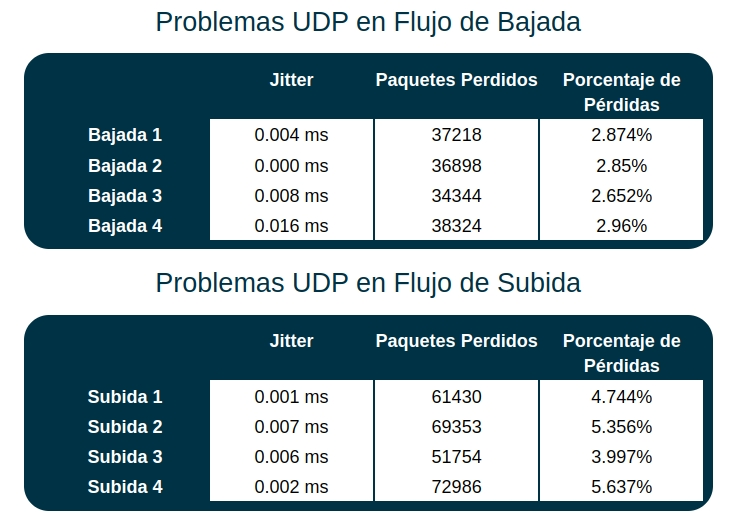
UP & DOWN Flows
Jitter
Lost parcels
% of losses
Integrations
Bandwidth Monitor provides an API Rest to which information related to the tests performed can be consulted. In this way, it can be integrated with any tool that consumes the information served by this API.
The following information is currently available:
Reports by headquarters.
Reports per host.
Any object in the data model (inventoried hosts, job cases, jobs performed, reports, etc.).
Operation
Installation of the probes
We will start with the RJ45 network cable against the port shown in the picture:
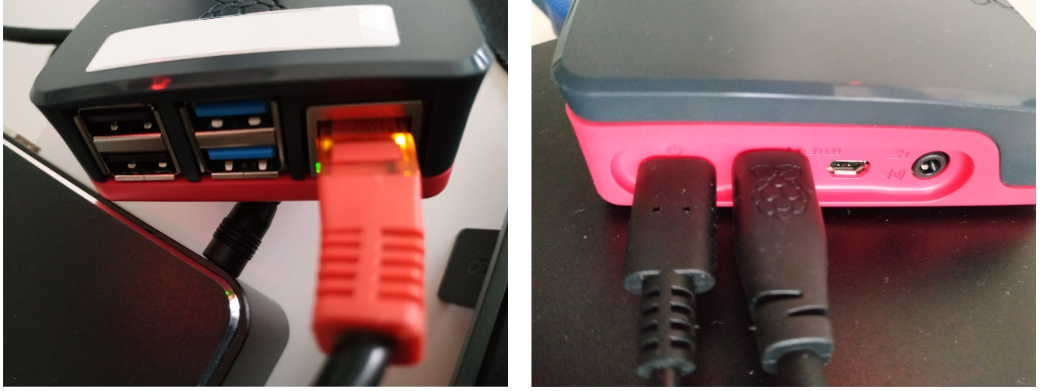
Once we have the network cable connected, we will connect the host to the power supply and switch it on.
When both lights are stable, it means that the host is started and working properly.
Once connected and running, it should be viewable from the Hosts section with its associated
MAC Addressparameter.Connected probes shall appear for the first time in the Discovered Hosts table and those already inventoried in the Inventory Hosts table.
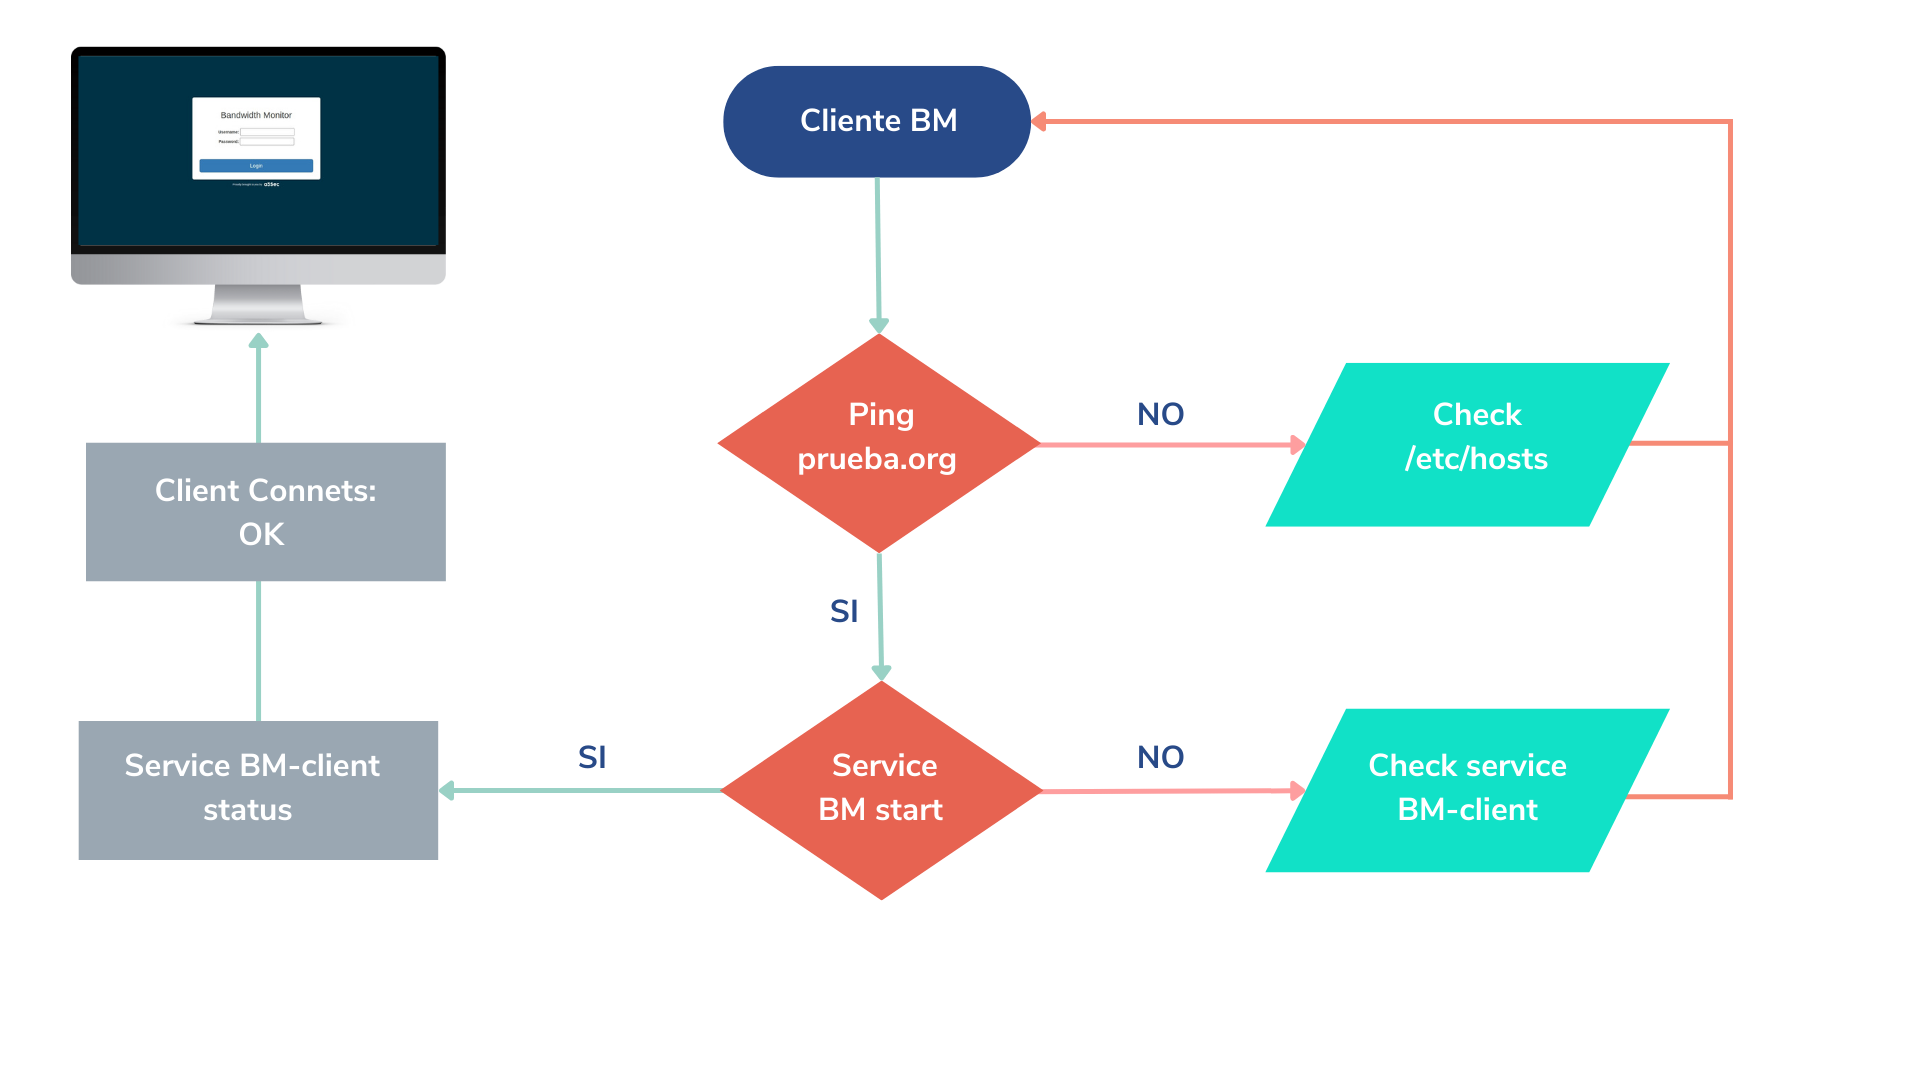
Connectivity validation
Once the probe is installed, you should be able to view it from the Bandwidth Monitor website. If not, we must review the flow, taking into account that one of the premises for the implementation is the DNS resolution to the internal domain prueba.org (IP of the central server) from the probes.
Through IP auto-assignment (via DHCP), the probes must be configured to communicate to test.org. Configuration to be set by the client on the communication hosts (router).