Release Notes 64
Publication Date: 29/04/2025
This document provides a detailed summary of the new features, functionalities, improvements, and fixes integrated into version 63 of WOCU-Monitoring. With this update, we address the requests and suggestions of our users, while aligning with current market trends and needs.

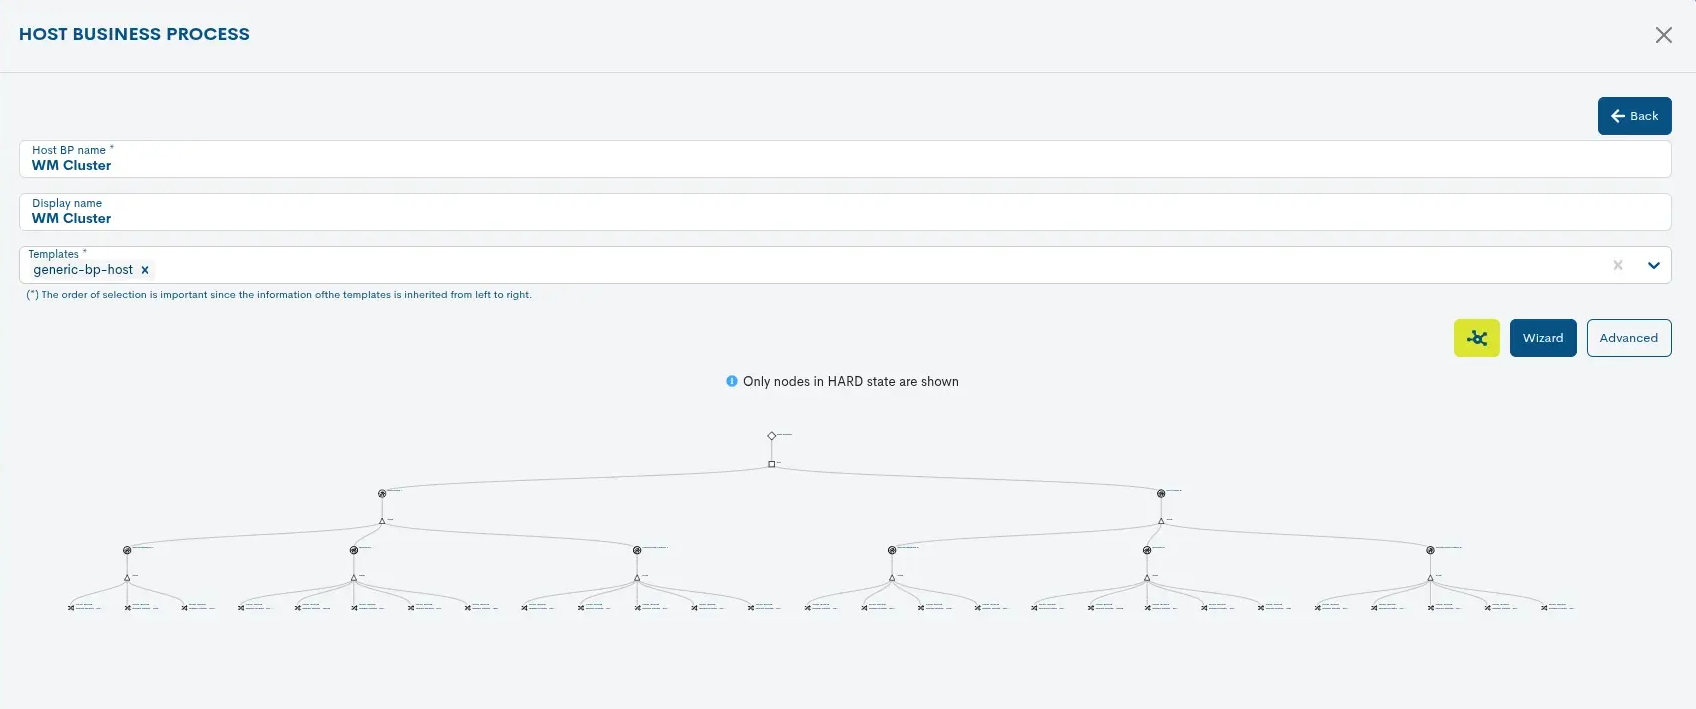
1. Business Process Preview Capability
During the creation and editing of Business Processes, a new interactive space called BP Trace Preview has been incorporated, allowing real-time visualization of the logical structure of the process under construction.
This preview is generated from the previously defined Business Rule, displaying the dependencies among the various assets that will be part of the process.
As the rule is still in the editing phase, the depicted tree acts as a dynamic draft. Its content is updated automatically according to the changes made within the Wizard module, providing the user with a visually useful tool to validate the logic of the process before its final confirmation.
2. Evolution of BP Traces: New Design and Functional Improvements
The BP Trace component has been revamped to include the following improvements:
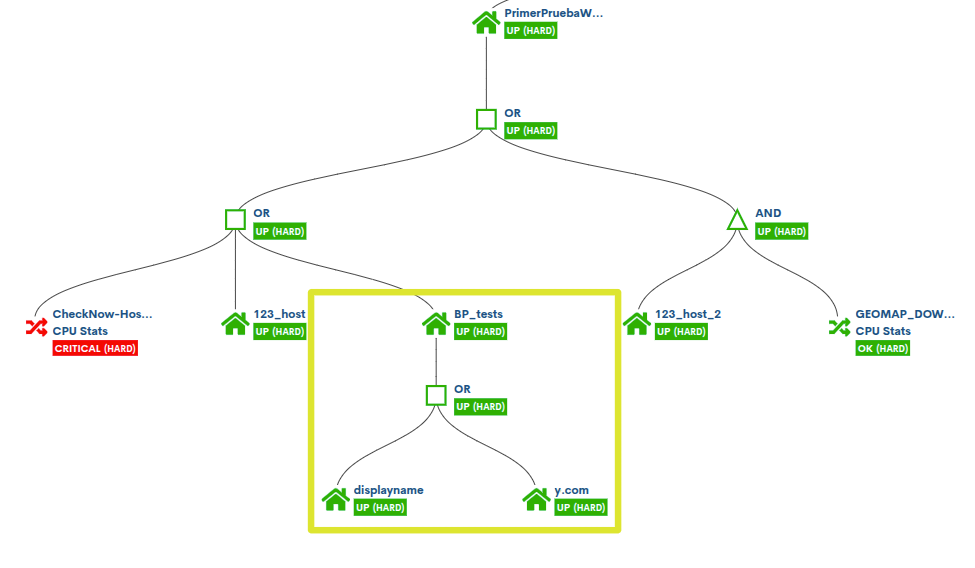
Icons by Asset Type in the Nodes
Each node in the BP Trace tree now includes representative icons for the asset type (instead of geometric shapes), aligned with those used throughout the rest of the application. This enables quicker and more accurate identification of the elements that make up the structure, enhancing overall visual comprehension.
Additional Information in Represented Assets
When hovering over a node corresponding to a device or service, a pop-up window appears displaying updated information about its current operational status and monitoring checks performed on it.
This functionality allows access to key data without leaving the tree view.
Representation of Nested Business Processes
The ability to represent nested Business Processes has been added, that is, processes that contain other processes as part of their structure, allowing for a comprehensive visualization of more complex hierarchical relationships.
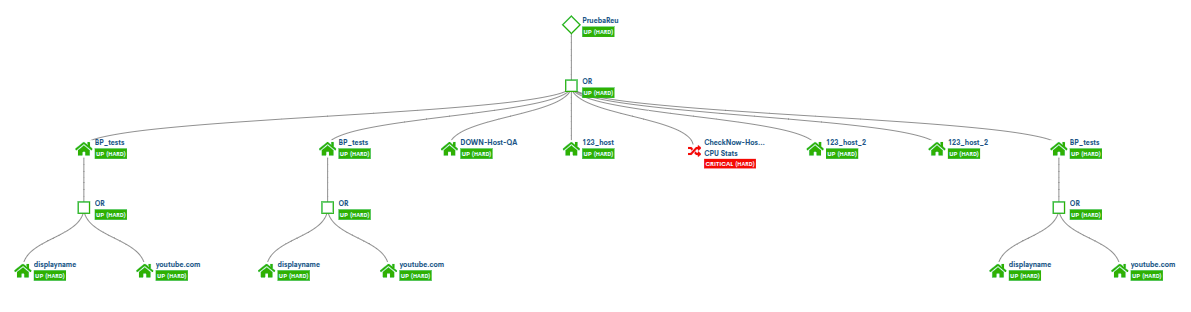
Visual Optimization of Large Trees
To improve readability in trees with many nodes at the same hierarchical level,a new horizontal layout format has been implemented, replacing the previously used cascading design.
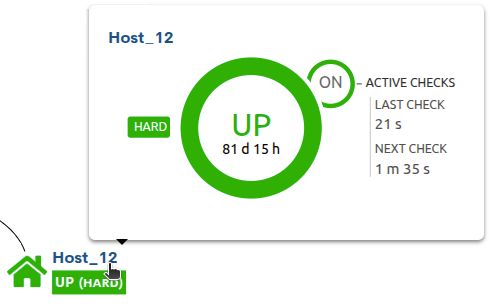
3. New tooltip for Hosts and Services
When hovering the cursor over any Device or Service in the application, a pop-up window appears displaying updated information about its current operational status and the monitoring checks performed on it.
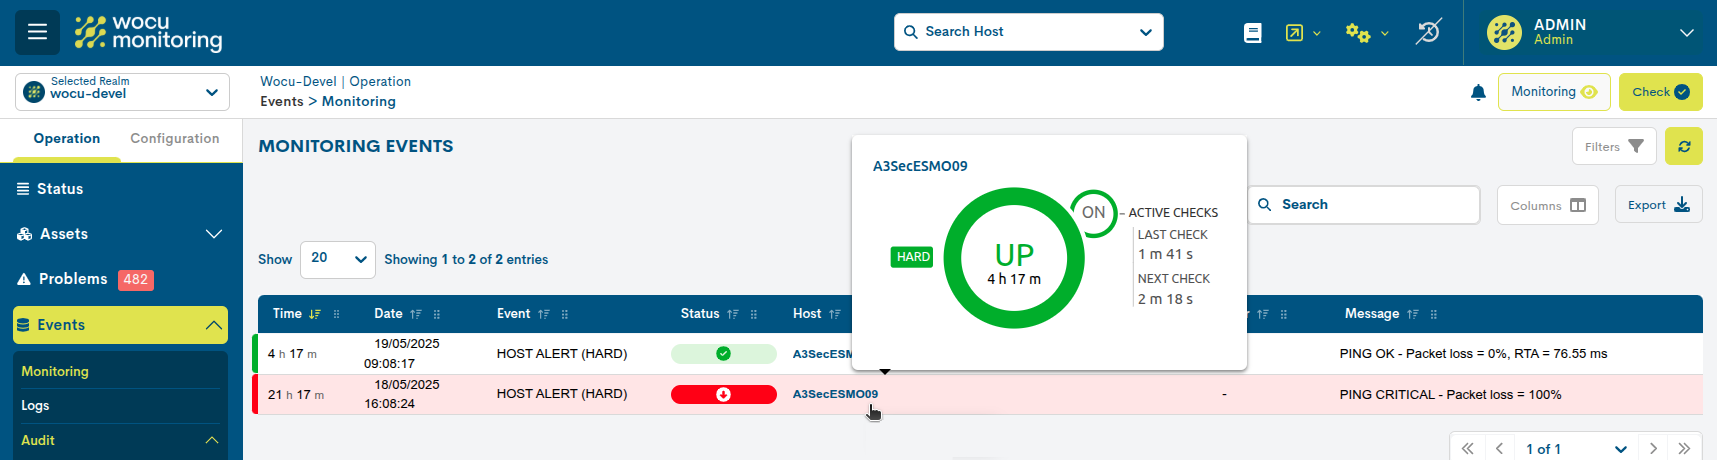
With this integration, it is no longer necessary to navigate to the asset’s detail view to access the following key data:
- ✓ Current monitoring status and duration
Within the central circle, the following is indicated: the status recorded by the device and how long it has been in that state.
- ✓ Monitoring Check: Active Checks/ Next Check
The small circle ON/OFF indicates whether active checks are enabled. The Next Check label shows the time remaining until the next scheduled verification.
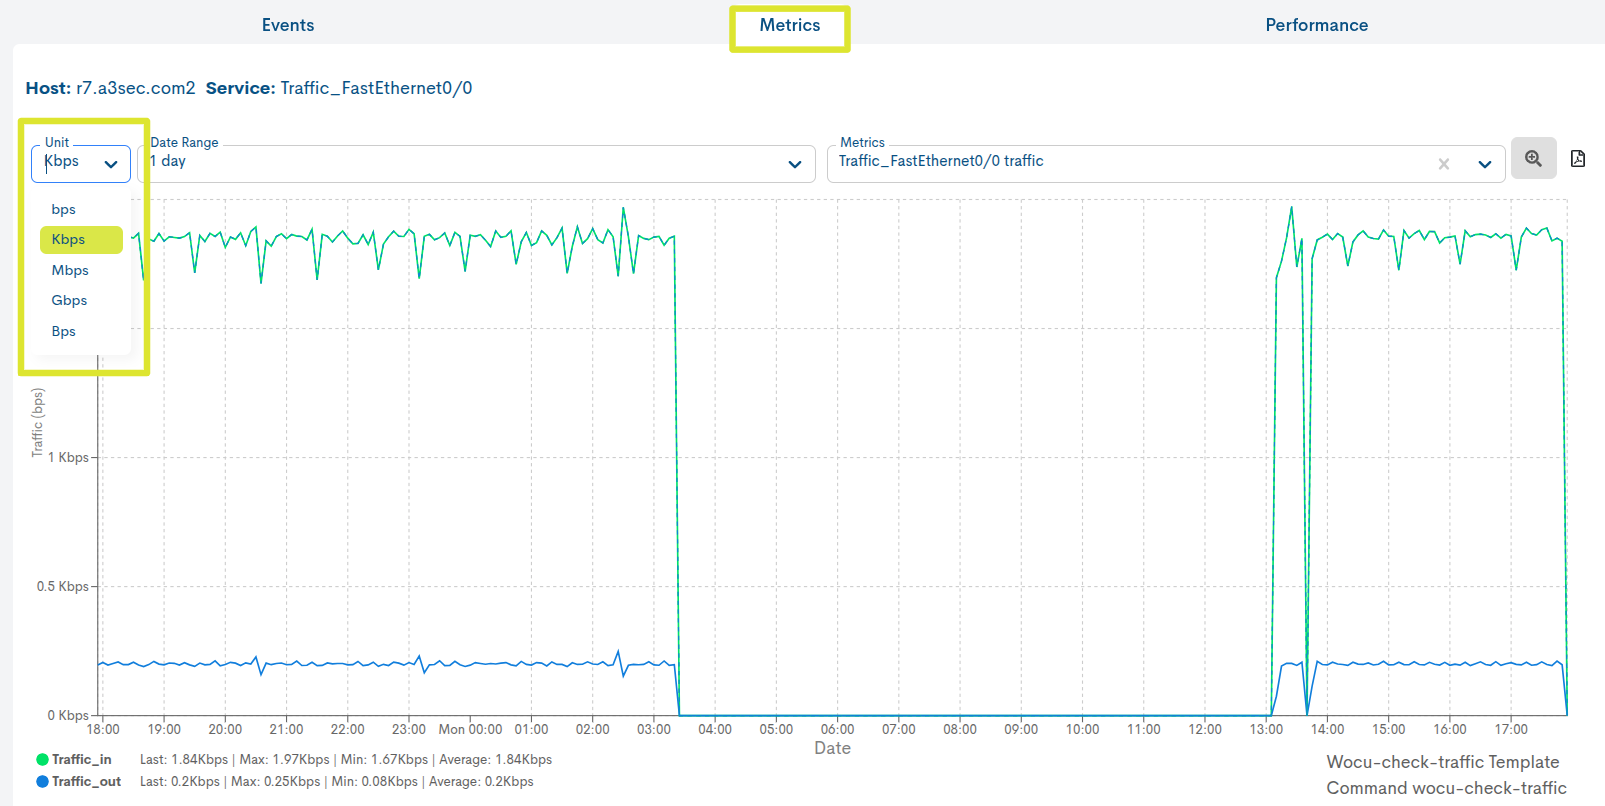
4. Metric Unit Conversion Capability
Thanks to the new Unit selector present in the Metrics charts, the user is now able to change and model the unit type of the values obtained for a specific metric.
The unit conversion is immediate, therefore, when selecting one of the available units (ms, %, B, Kbps-Gbps), the chart updates adjusting the scales without the need to reload the page.
5. Data Retention and Aggregation in InfluxDB
With the aim of optimizing the storage and visualization of historical metrics, a new feature has been incorporated that emulates the aggregation behavior previously offered by PNP4Nagios.
Although PNP4Nagios has not been used since previous versions, it was necessary to efficiently retain old data; therefore, a configurable mechanism for retention and aggregation of metrics in InfluxDB has been implemented.
This improvement allows:
Define a custom retention policy per database, establishing the period after which the original data is discarded.
Automatically apply an aggregation after the expiration of said retention, preserving the historical data in a summarized form (downsampled) and significantly reducing the disk space occupied.
This functionality ensures more efficient storage management without compromising performance or the availability of historical information.
6. New aggregation view for Cisco Meraki
This functionality ensures more efficient storage management without compromising performance or the availability of historical information.
In particular, the view corresponding to the platform Meraki has been improved and optimised to provide a more efficient and detailed experience. This new view provides centralised, real-time monitoring of the operational status of devices and managed services via Cisco Meraki, allowing operators to:
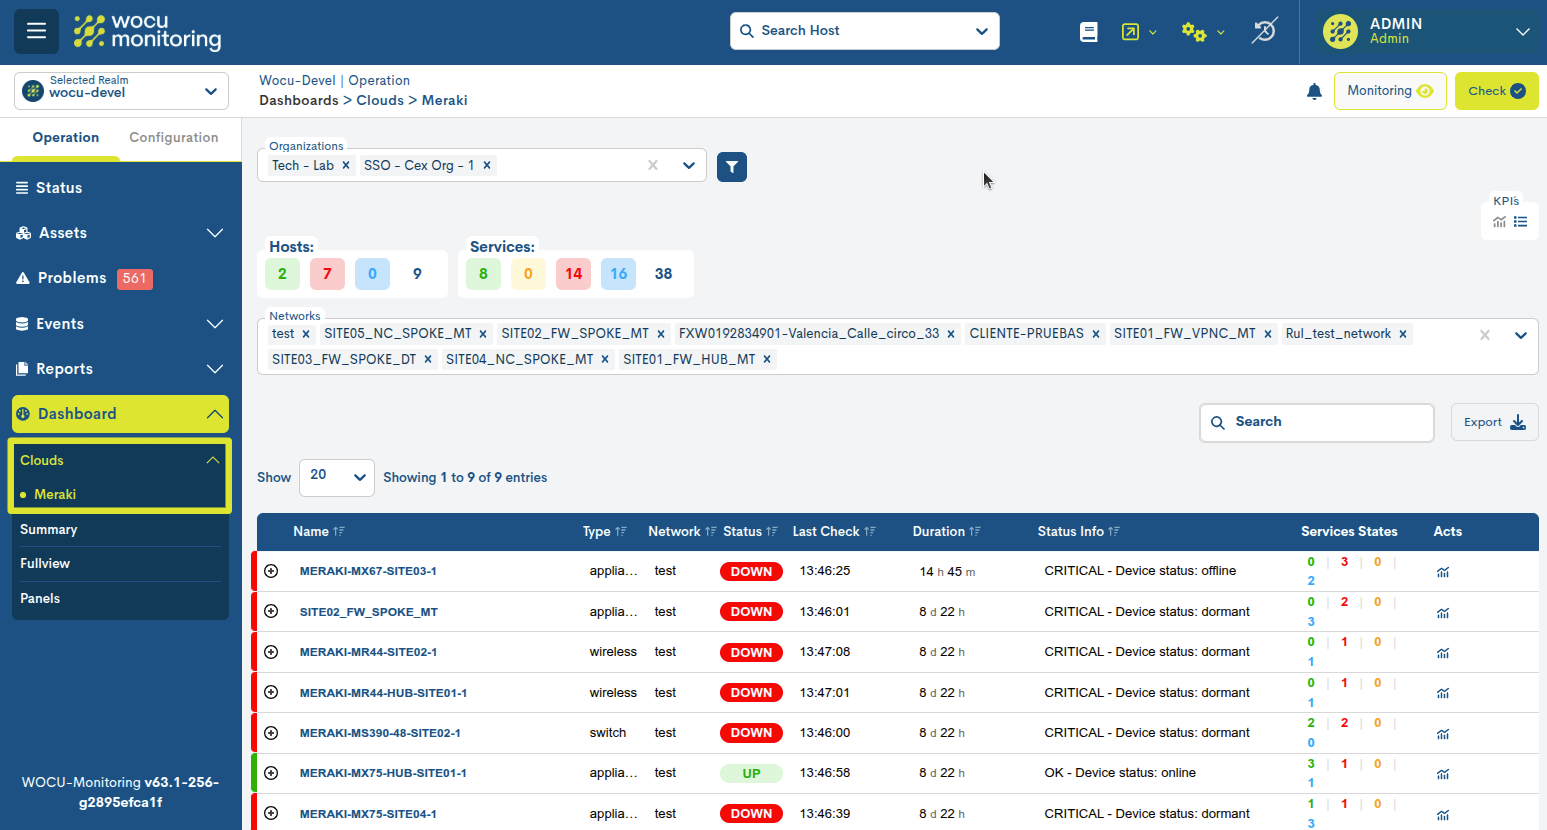
Immediately visualize the status, availability, and performance of the entire distributed infrastructure (according to the selected Organizations and Networks).
Identify the most recent issues and their impact through visual indicators (KPIs and dynamic tables).
Check the status of each device and its associated services, differentiating various types such as appliances, switches, and wireless.
Track downtime and operational checks per device.
This phase represents an important step towards the integration of cloud platforms, allowing for more automated monitoring of devices managed in the cloud.
7. Improvements in Detection and Response to Massive Outages in WOCU-Monitoring
A new functionality has been developed and implemented in the monitoring engine, aimed at detecting and processing its internal systems in the event of massive failures affecting all monitored assets.
Thanks to this improvement, the system is able to identify when a widespread infrastructure outage is reported, which allows for quick identification of possible critical incidents. This new detection logic optimizes the platform’s ability to respond to large-scale events.
With this, WOCU-Monitoring becomes noticeably more resilient and efficient against global interruptions, strengthening its reliability in high-impact scenarios.
Other Improvements and Fixes
Every new version is full of small changes, fixes, and optimizations worth highlighting briefly. Here are the most notable ones in this version:
When clicking on a section of the sidebar menu, its content will update automatically.
New validations have been added to the creation form of Passive Services en Pending, which improves data consistency and prevents configuration errors.
CSV/JSON export of the Hosts table has been improved, as it now respects the rows selected by the user, allowing for a more precise and personalized export.
A bug related to the bulk selection of rows in tables has been fixed,which prevented it from working correctly in certain scenarios.
Now the creation form of a Scheduler in GConf is cleared when you create one.
Updated software
As always, other pieces of software have been incorporated and updated in this new version of WOCU-Monitoring:
Software |
Previous version |
Current version |
Observations |
|---|---|---|---|
haproxy |
None |
2.9.10 |
|
wocu-agents |
None |
1.0.0-1 |
https://docs.wocu-monitoring.com/es/docs/setup/4_12_agent.html |
About WOCU-Monitoring
WOCU-Monitoring is a multipurpose monitoring tool that integrates the latest Open Source technologies for monitoring, visualization, metric graphing, and log management, providing broad visibility into the status and availability of network elements, servers, databases, and workstations (among others) using custom Monitoring Packs.
In addition to the Free version, the Enterprise version of WOCU-Monitoring allows the deployment of thousands of IP devices in a distributed environment, with customizations tailored to each client’s infrastructure.