Release Notes 65
Publication Date: 03/07/2025
This document provides a detailed summary of the new features, functionalities, improvements, and fixes included in version 65 of WOCU-Monitoring. With this update, we address the requests and suggestions of our users, while also aligning with current market trends and needs.
1. Automatic Conversion of Metric Units
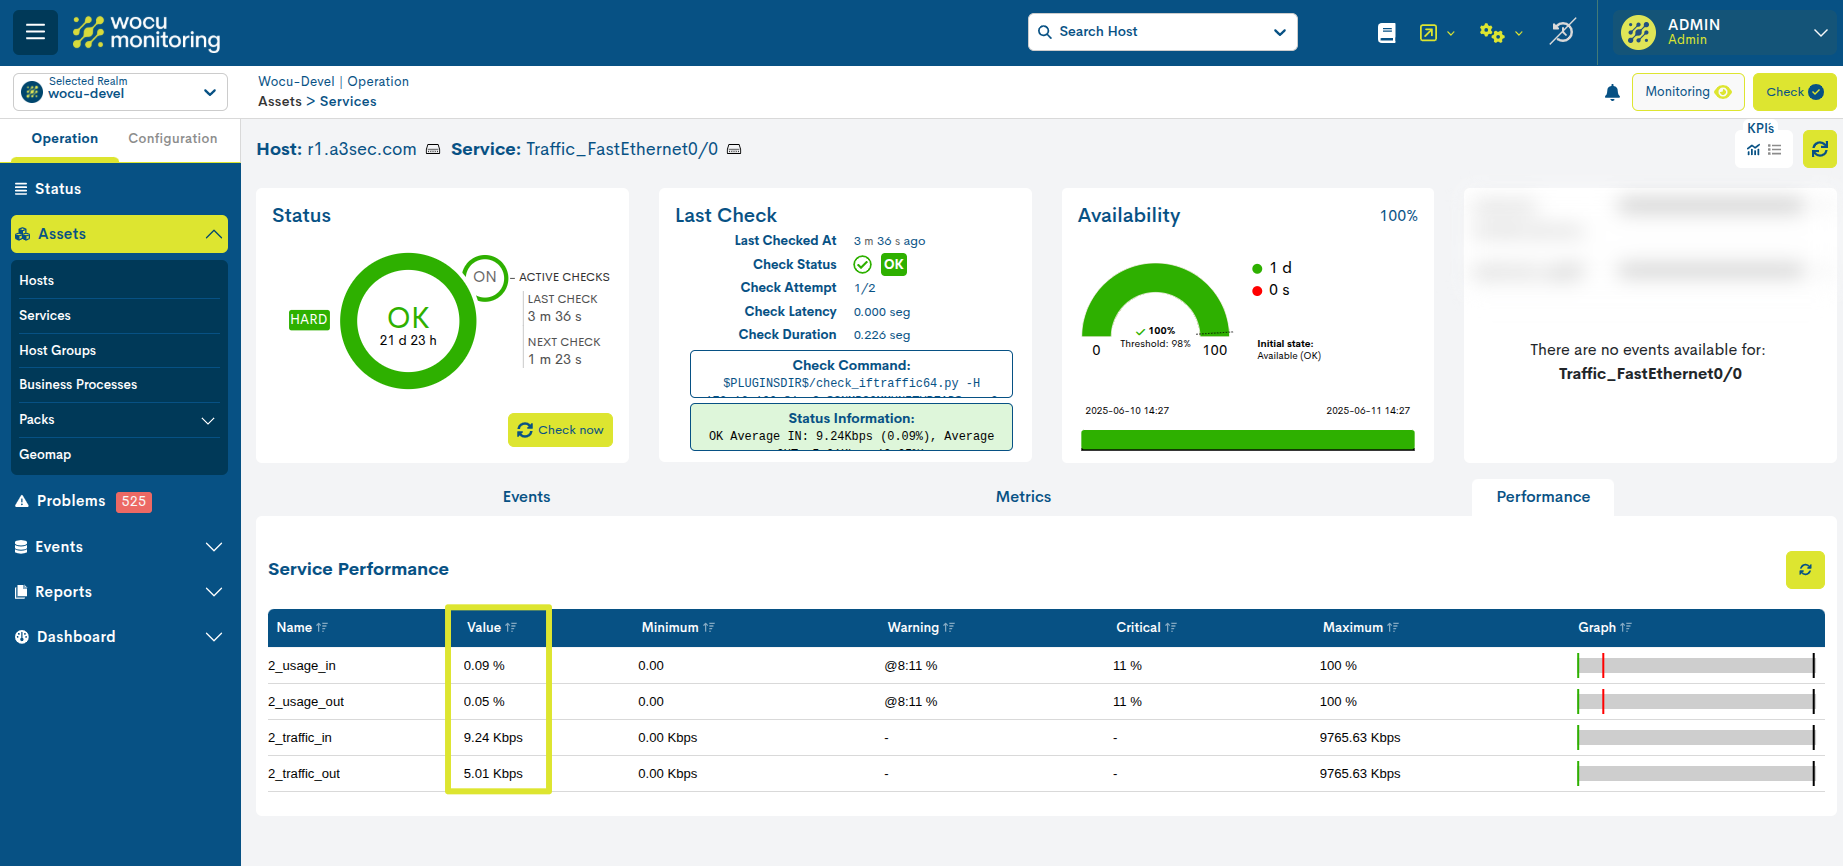
A key improvement has been incorporated into the visualization of service metrics available in the Performance view. Now, all metrics that include measurable units (such as bps, bytes, ms, etc.) benefit from automatic unit conversion.
Previously, each metric was displayed with the fixed unit defined by the data source. With this improvement, an automatic calculation is applied to transform units into more practical and readable ones (e.g., from bps to Kbps, or from ms to s), eliminating the need for manual conversions, as the values are now presented in their converted form by default.
As a result, the same cell in the Value column may display different units at different times. This is because the system automatically assigns the most suitable unit based on the recorded value. For example, a metric might appear in Kbps one day and in Mbps another, depending on increased resource usage. This adaptation is both dynamic and automatic.
2. New Summary View for KPI Visualization
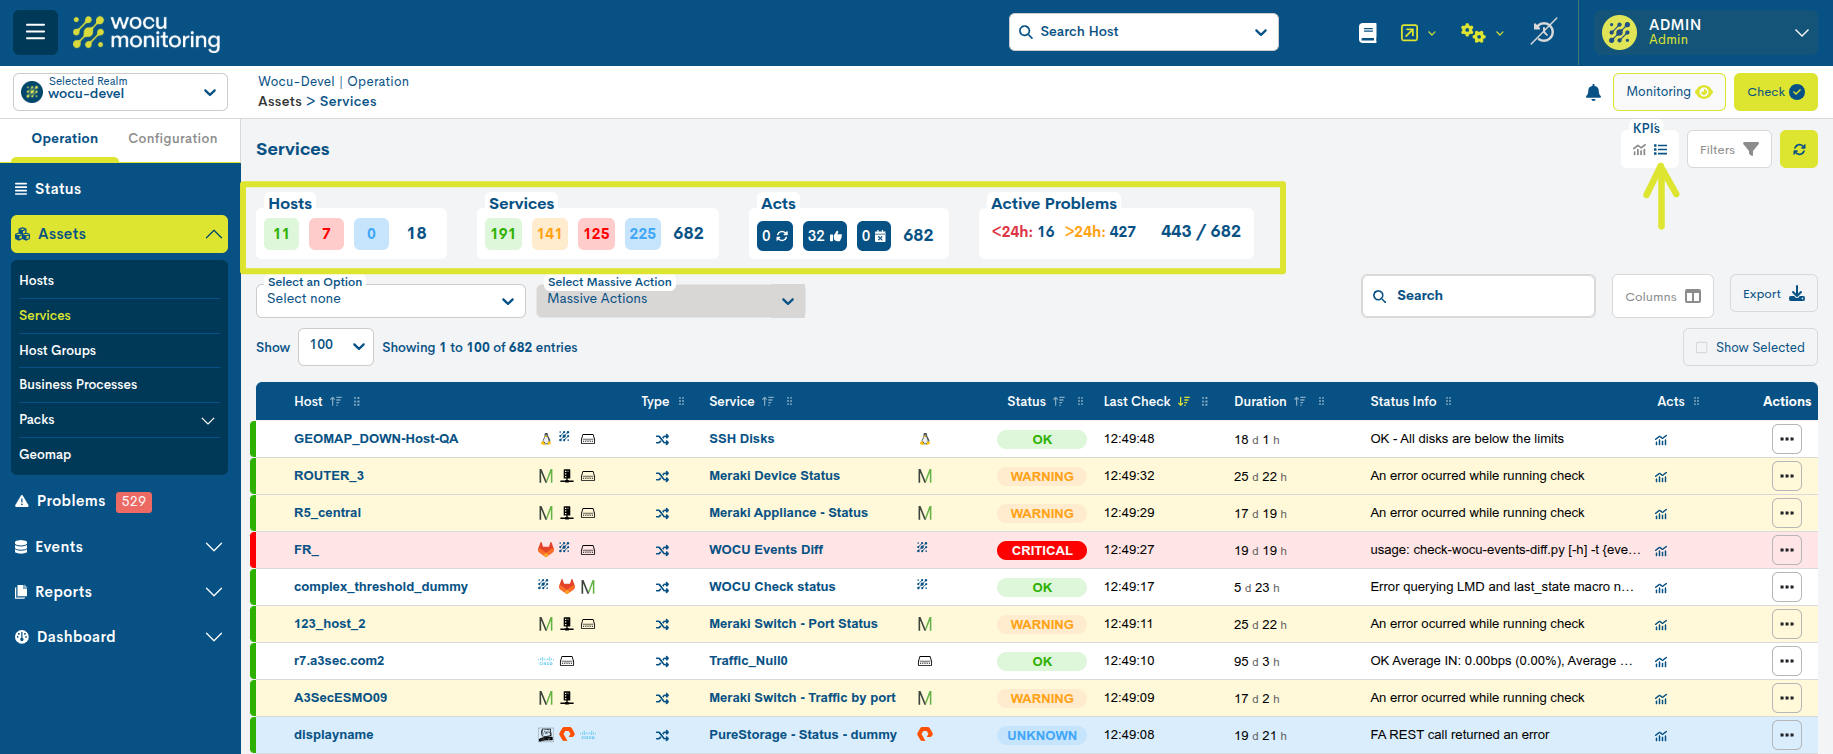
The new Summary view has been designed and implemented within the KPI`S visualization block.
With this new, more compact format, visual space is reduced without sacrificing the readability of key performance indicators or the overall operational status of monitored assets. As a result, the user can now toggle between Full view and Summary view using switch controls, or even hide the entire block if desired.
This integration is now available in the following views:
3. New Fields Available for Display in Various Tables
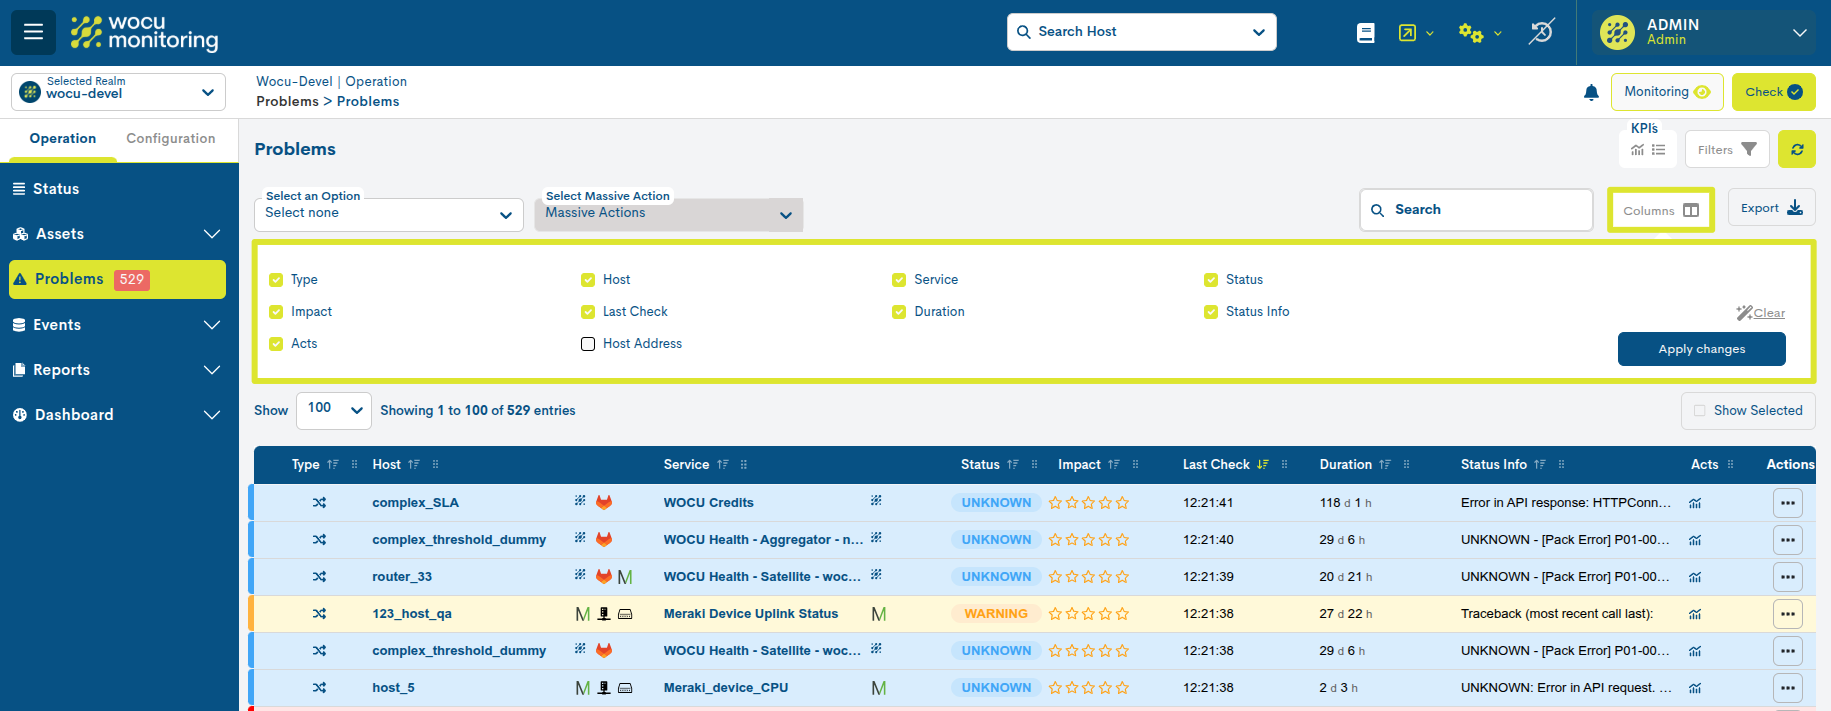
New fields have been enabled for display as columns in certain application tables. Using the Columns feature, users can customize the data table according to their interests or context of use by selecting which columns to show or hide.
This integration offers greater flexibility to access only the necessary information in each case.
The new available fields are:
Poller tag in Hosts Inventory.
Host_address in Problems, Services Inventory and Packs Configuration Issues.
Poller tag and Address in Hosts.
4. Filtering Assets via KPIs
In this version, it is now possible to filter assets by their operational status directly from the KPIs, both in the Full View and the Summary view.
Its operation is very simple: the status KPIs act as interactive filters, so when clicking on one of the monitoring states, the table will automatically update to show or hide only the assets that correspond to that state.
When one or more states are disabled, the corresponding buttons will be grayed out to visually indicate they are inactive. To re-enable a previously disabled state, simply click on it again to reactivate it.
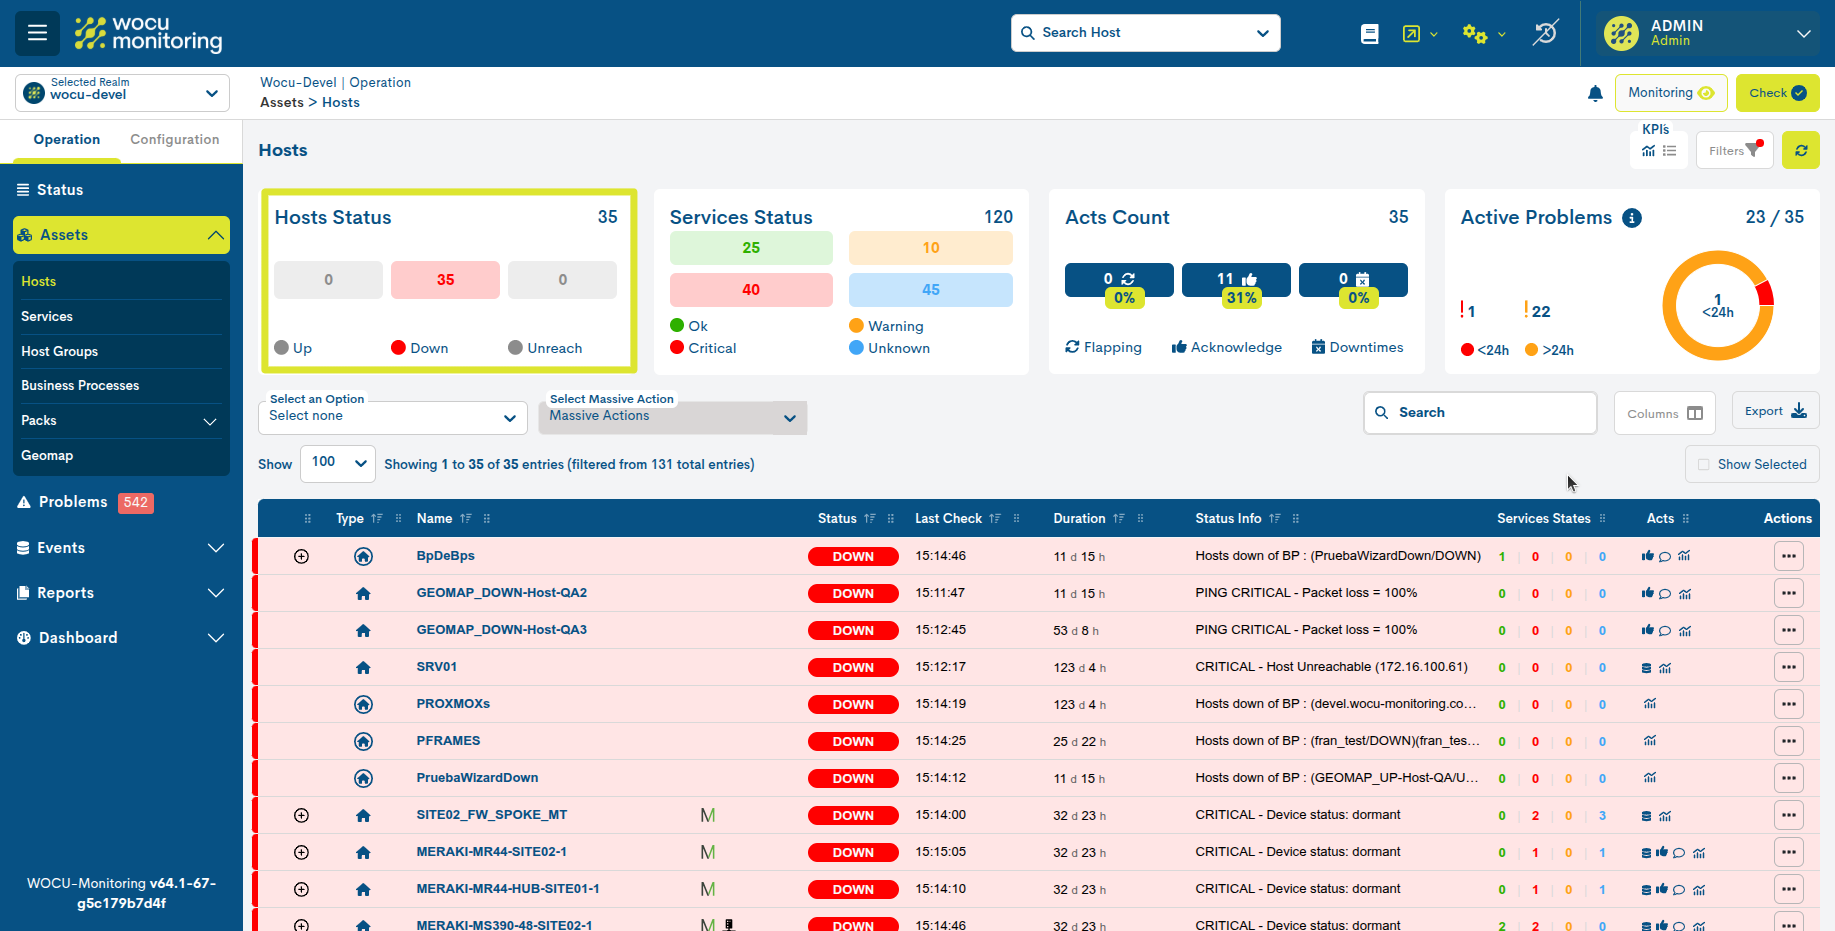
The KPIs that include this function are:
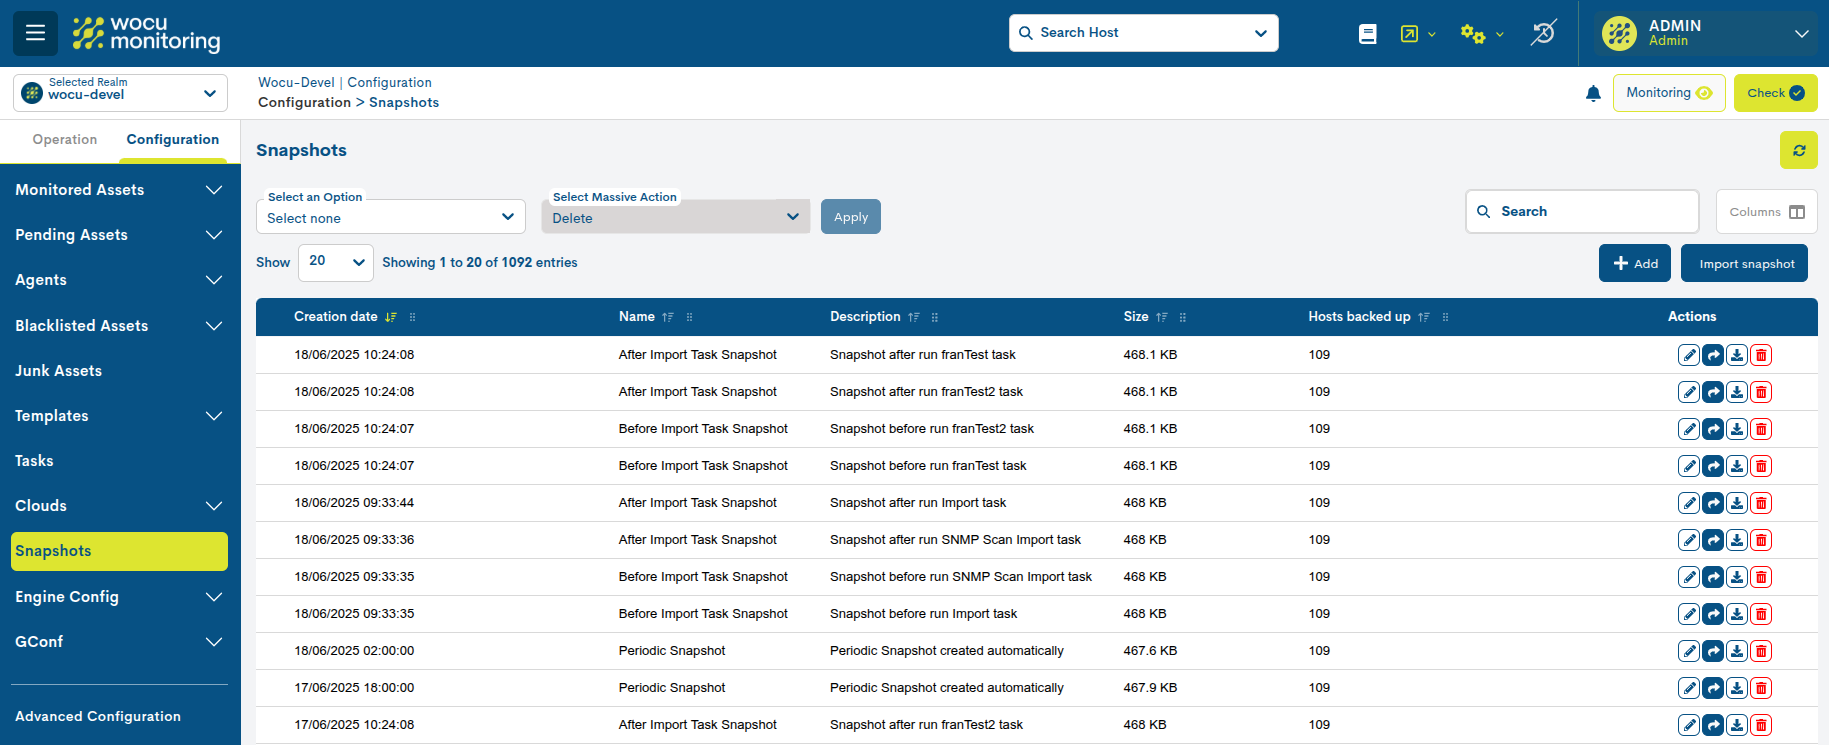
5. Implementation of Automatic and Customizable Snapshots
An automatic Snapshots system has been incorporated, providing greater flexibility and control in backup management. Now, it is possible to configure snapshots to be created only when configuration changes are detected, through the new parameter create_backup_only_on_changes.
Additionally, it is possible to set the maximum number of snapshots to retain (max_prediodic_backups) and the interval between executions (backup_interval), using simple formats such as 10m, 2h, or 24h. This enhancement facilitates automation and optimization of backup storage, reducing the need for manual intervention.
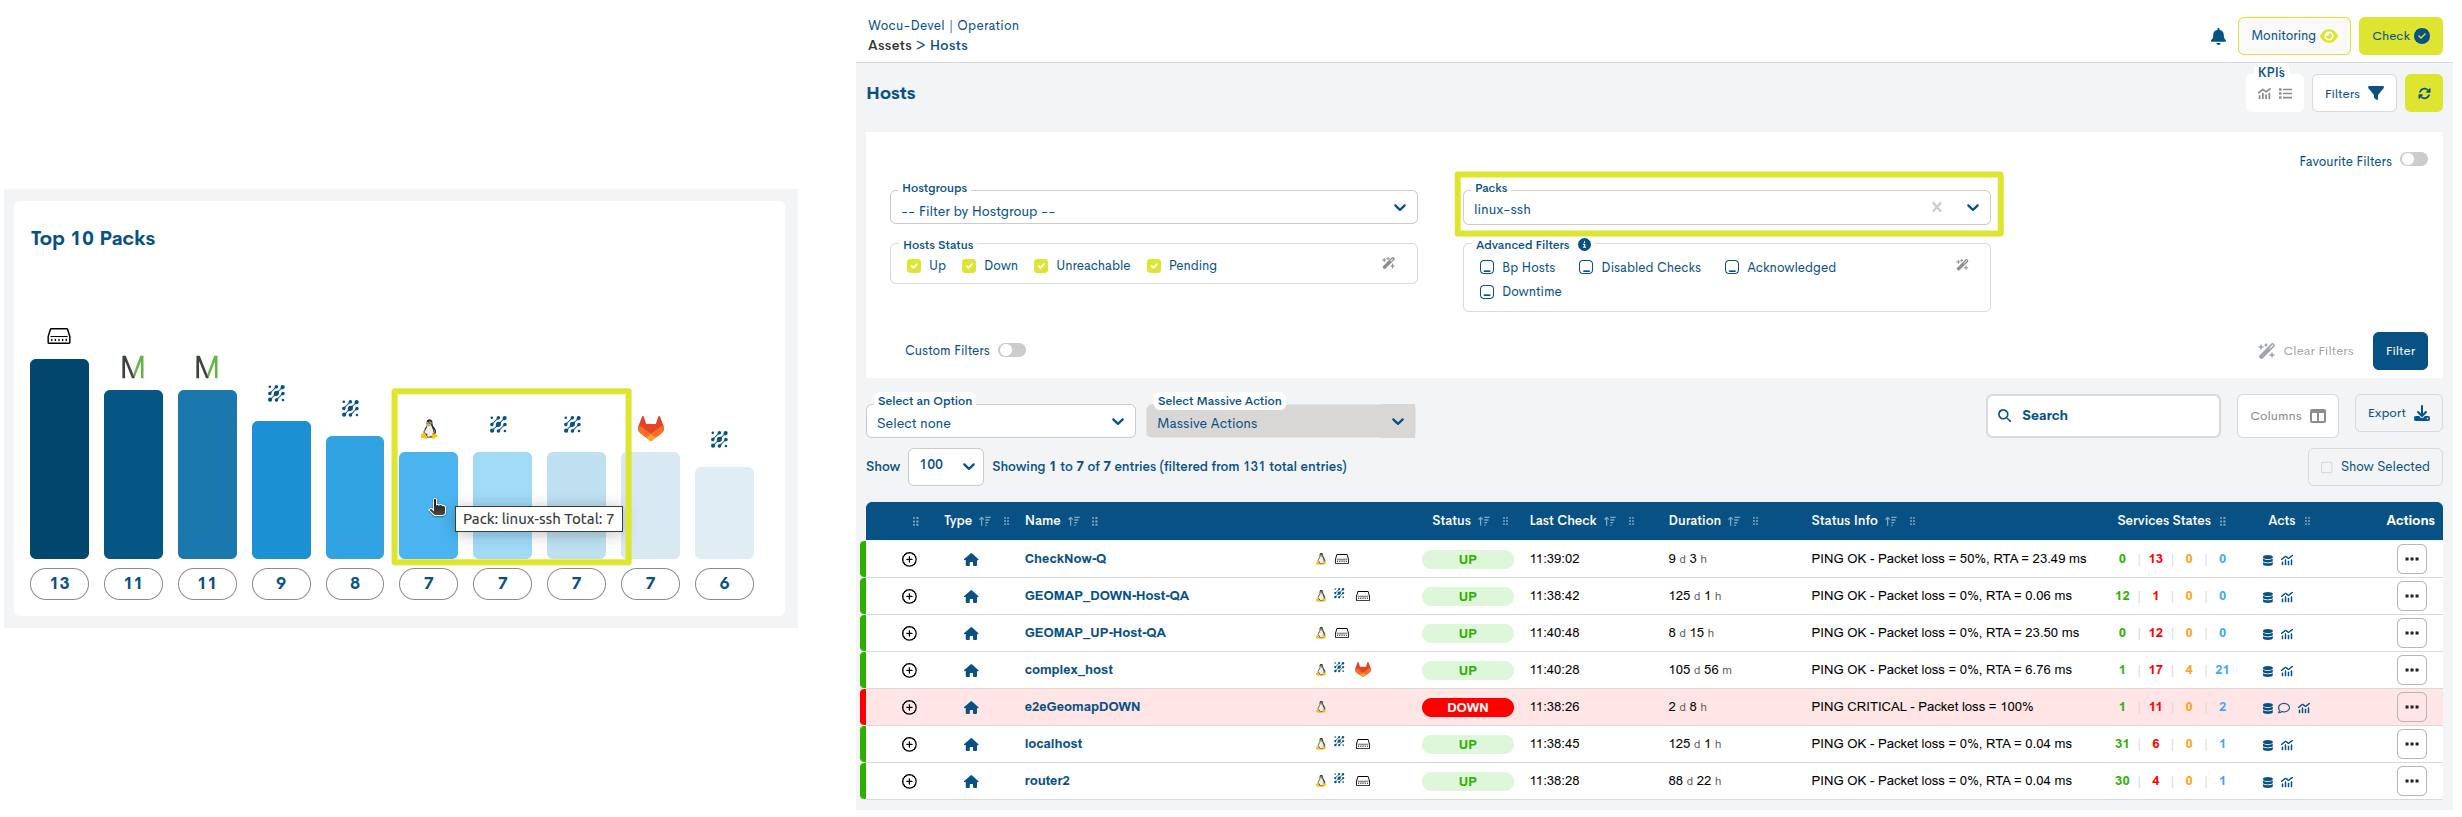
6. Optimization of the Top Packs Widget
The Top Packs widget, which displays the `Packs de Monitorización<https://wocu-monitoring.com/integrations/>`_with the greatest presence and most usage in WOCU-Monitoring through a bar chart, has been optimized in its two locations:
In the Status view, this widget functions as a filter. When the user clicks on a specific bar, they are redirected to the Hosts Inventory, where only the list of devices configured with that particular pack will be displayed. The Filter by Monitoring Packs will also log this pack.
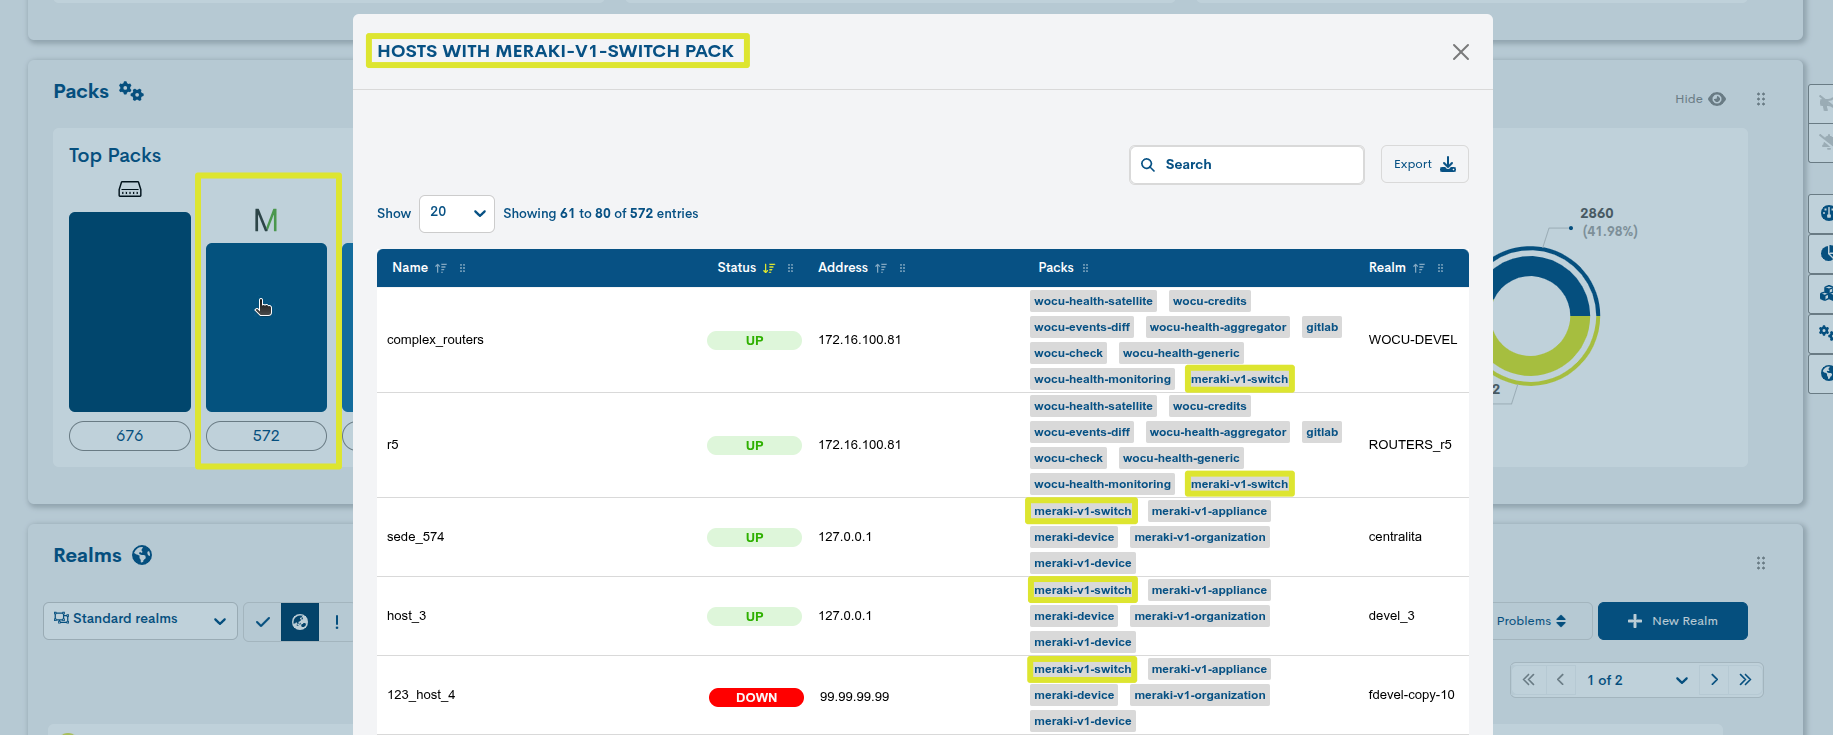
In the Home, when clicking on one of the bars in the widget, a new view will open listing the devices that have that specific pack included in their configuration.
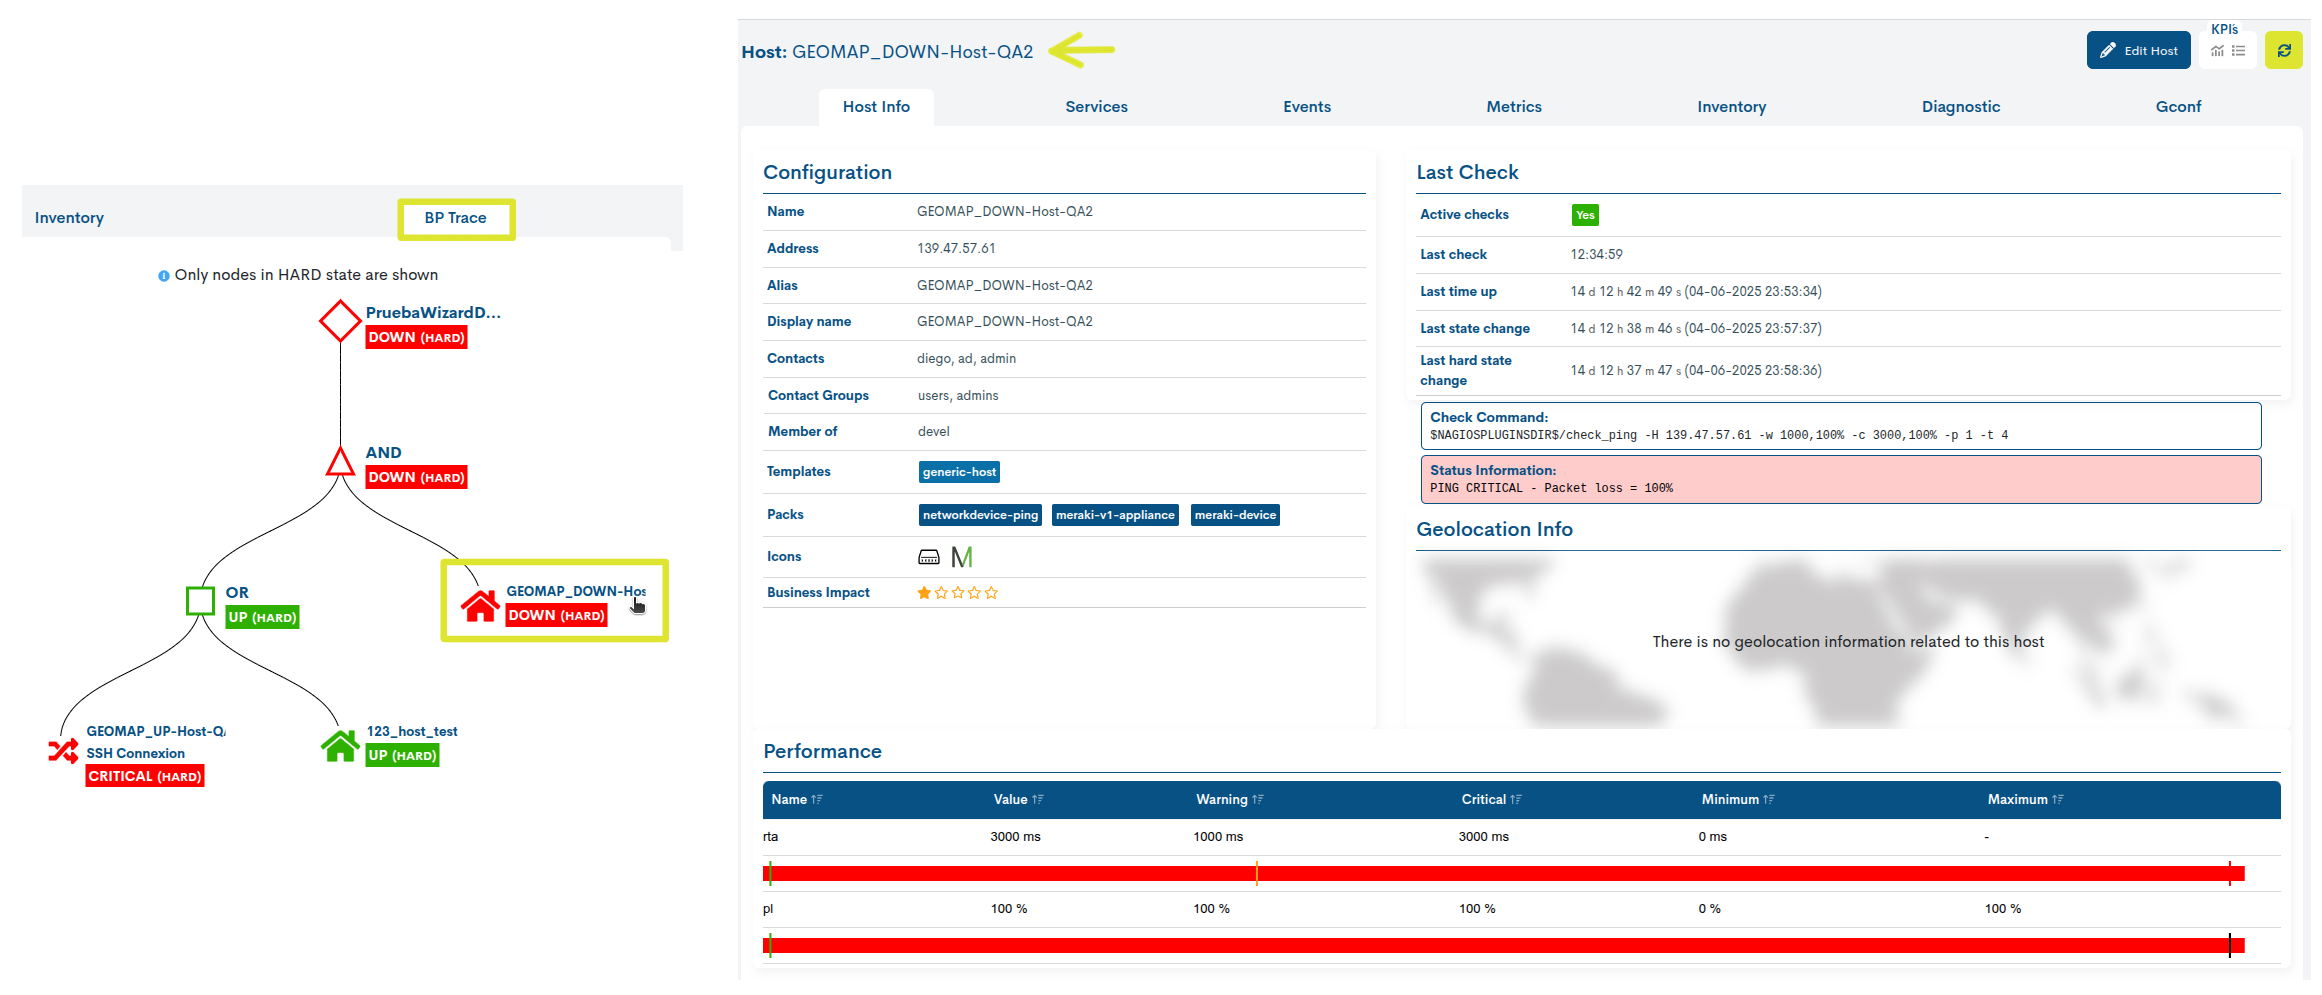
7. New Redirection Function via Interactive Nodes
This version introduces a new feature to the BP Trace component, aimed at achieving smoother and more contextual navigation within the represented technological infrastructure.
Now, when clicking on the name of a node corresponding to a device or service, the system automatically redirects the user to its Vista de detalle, where detailed data about the selected element is presented, such as its current status, performance metrics, event history, associated configuration, and any relevant alerts.
8. Fixes and Improvements in WOCU-Agent
In this version, various optimizations and fixes have been implemented in the WOCU-Agent component.
For the agent on Linux, an issue with the execution of the uninstall script has been resolved, as well as a bug related to the automatic removal of obsolete files. Additionally, unnecessary files are now removed during the uninstallation process, thereby improving system cleanup.
For the Windows agent, an error occurring when running the setup.bat file from PowerShell has been fixed. Additionally, an issue that prevented log entries from being saved during the agent’s normal operation has been resolved. As an additional improvement, a silent/assisted mode has been incorporated to facilitate automated installation.
Additionally, the ability to configure the execution interval per plugin has been added, offering greater flexibility and customization in monitoring tasks.
Finally, the WOCU-Agent installer now includes the license and README files, providing greater transparency and information to the user.
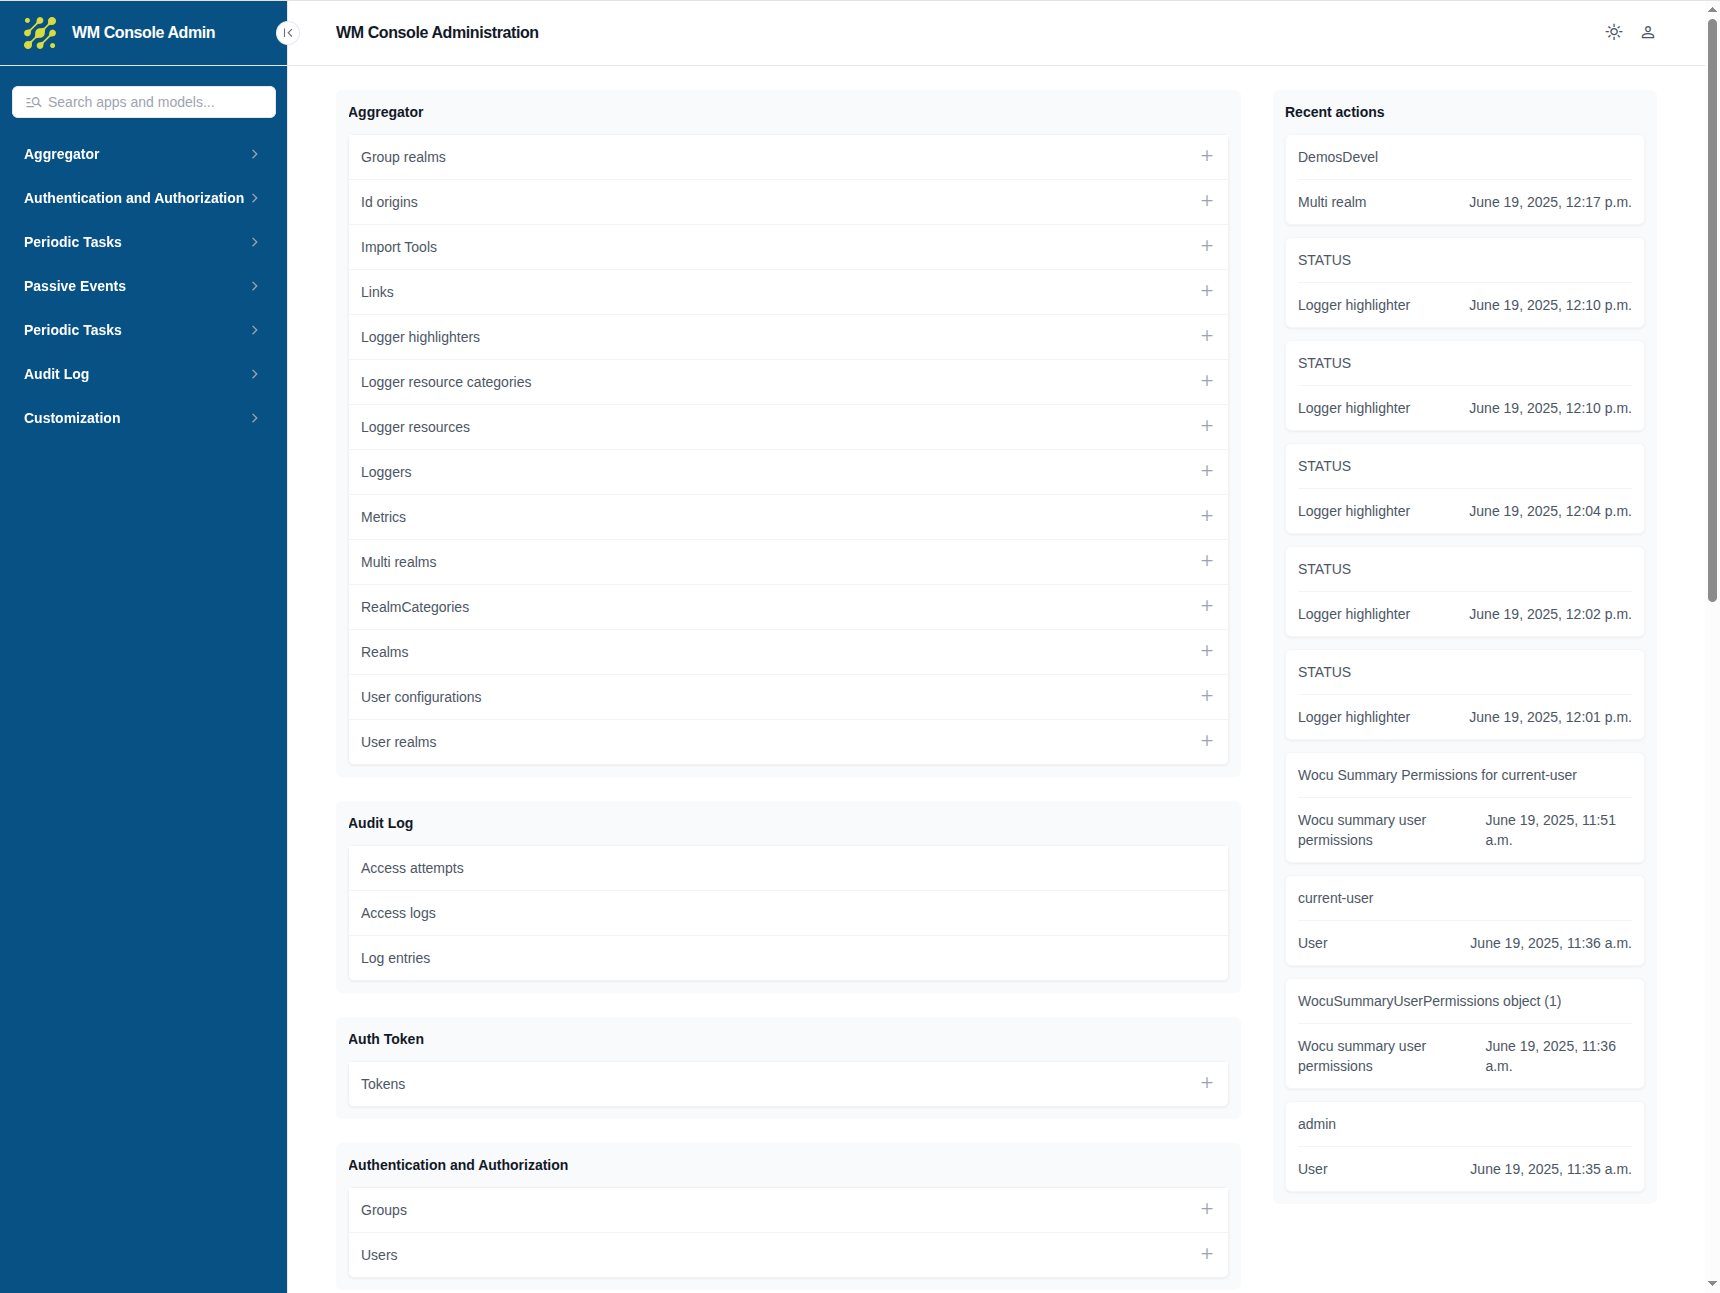
9. New Theme in the Administration Module
A complete refactoring of the visual theme of the WOCU-Monitoring Administration Module has been carried out.
The new interface adopts a style and design similar to the application, offering a more consistent and familiar experience for the operator. This improvement simplifies navigation and daily management while maintaining the familiar usage logic.
10. Improvements in Traceability and Task Visualization in Gconf
The following are the new developments implemented in the GConf:
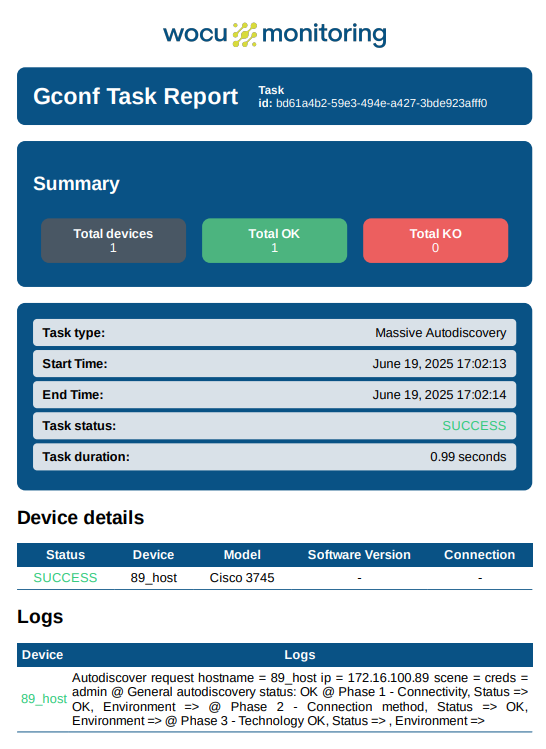
Task Reporting System in Gconf
New function to download the Gconf Task Report in PDF format for a specific executed task. The report includes a general summary of the execution status, start and end times, involved devices, detailed results per device, and the logs corresponding to the process.
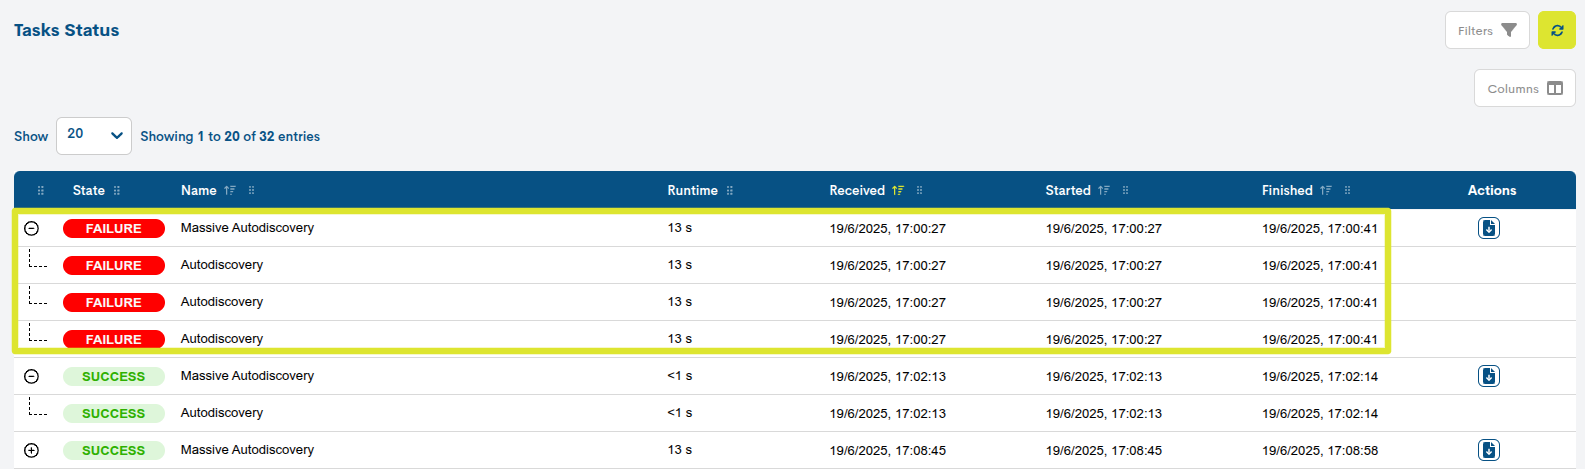
Expandable Subtasks in Bulk Tasks
A dropdown has been added to the Task status list for Massive tasks that generate multiple subtasks. By clicking the expand icon (+), all associated subtasks are hierarchically displayed, including their individual status, name, execution time, and timestamps (start and end).
This improvement allows for a more organized and detailed visualization of the progress and results of bulk tasks.
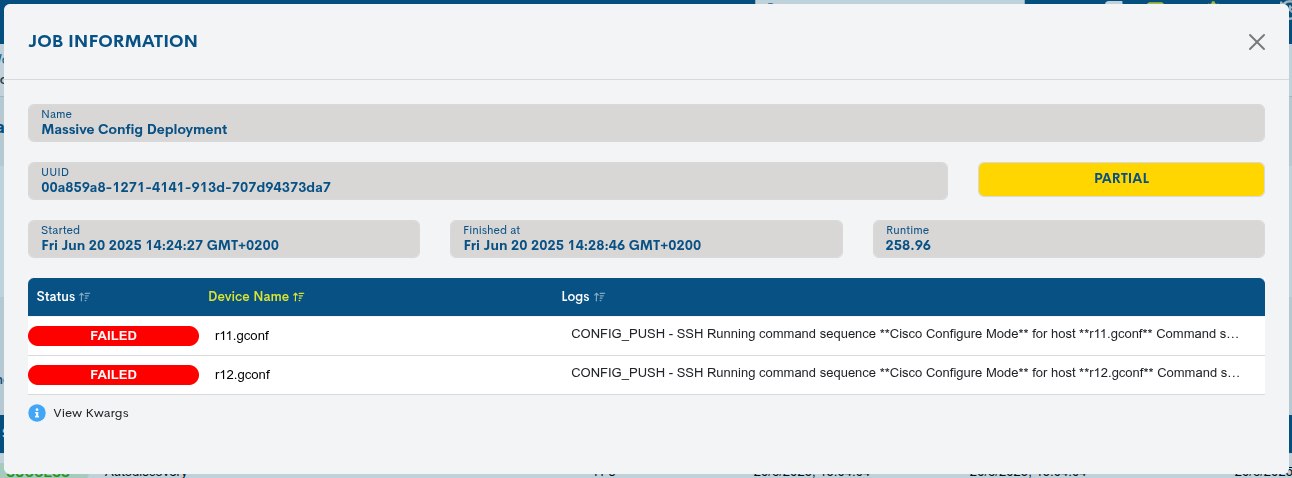
Update of the Job Information View
The Vista Job Information has been redesigned to offer a more readable and structured visualization. This table displays the execution status, device name, generated logs, and, depending on the task type, additional contextual information.
Improvement in the Logging System for Celery Processes
The logging system has been expanded to also include internal Celery processes, allowing for more comprehensive traceability and more precise diagnosis of background tasks.
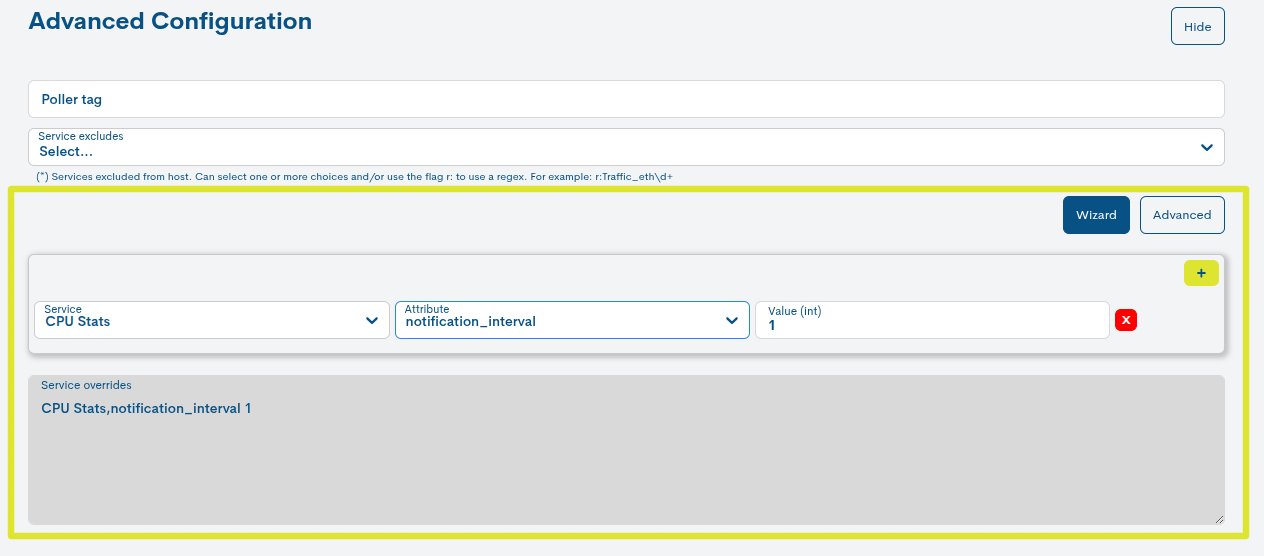
11. New Wizard for Configuring the Service Override Attribute
The new Service Override wizard allows modifying specific monitoring service configurations without affecting the global configuration. Through a new guided interface, it is possible to customize services according to the specific context, saving time and reducing potential errors caused by manual configurations.
This new system offers three selectors:
Service: allows selecting the monitoring service to which the override should be applied.
Attribute: allows selecting which service attribute you want to override.
Value: allows defining the new value for the selected attribute.
This wizard is now available in:
12. Monitoring Packs
Check out our catalog of Monitoring Packs at the following link.
Fortimanager-api
A pack has been created to obtain status information and performance metrics of Fortinet <https://www.fortinet.com/> devices managed by a Fortimanager. The pack queries the Fortimanager API where the Fortinet <https://www.fortinet.com/> devices are registered.
The pack includes discovers to display all devices managed by the Fortimanager, allowing you to choose which ones you want to monitor.
The services included in the pack are:
Device Status: Monitors the status of managed devices.
Device Resources Usage: Retrieves resource usage of the managed devices.
Device SDWAN SLA: Retrieves SLA metrics of the SDWAN interfaces of the managed devices.
Device SDWAN Traffic: Retrieves the traffic handled by the SDWAN interfaces of the managed devices.
Device IPSEC Tunnels Stats: Retrieves statistics of the IPSEC tunnels configured on the managed devices.
Status: Checks the status of Fortimanager itself.
Fortianalyzer-api
A pack has been developed to obtain events and alerts present on a Fortianalyzer device.
The pack queries the Fortianalyzer API, which receives logs and events from Fortinet <https://www.fortinet.com/> devices.
The pack includes discovers to display the Adoms (Administrative Domains) present in the Fortianalyzer configuration, allowing you to choose which one(s) to monitor from WOCU-Monitoring.
The services included in the pack are:
Alert Events: Retrieves active alerts by Adoms.
Performance: Monitors the performance of the Fortianalyzer.
Status: Monitors the status of the Fortianalyzer.
Other improvements and fixes
Every new version is filled with small changes, fixes, and optimizations worth briefly highlighting. Below is a list of the most notable ones in this version:
New export options in CSV and JSON formats in the View Job Information.
A data loading spinner has been added to the Cloud view.
A reading error in the traceback output of the View Job Information and in the nested filters of Other Log Events (Logs) has been fixed.
The edit action for a Business Process now works correctly again, after fixing an error that prevented the corresponding form from being displayed.
The monitoring status color for Pending has been restored in some application widgets.
A bug has been fixed in the Monitoring view within a BP Host where an empty but clickable cell appeared in the Services column when no services were associated, causing an error upon interaction. Now, the button is not rendered if no services are available.
Fixed an error caused by the implementation of the aggregated database in InfluxDB. This occurred because the retention parameter was not being passed correctly, which caused errors when generating these graphs.
The metric report generation actions in PDF format are operational again in the Hosts Inventory, Services Inventory and Problems.
Software actualizado
As always, other software components have been added and updated in this new version of WOCU-Monitoring:
Software |
Previous version |
Current version |
Remarks |
|---|---|---|---|
Grafana |
10.0.13 |
11.6.2 |
https://grafana.com/security/security-advisories/cve-2025-3580/ |
About WOCU-Monitoring
WOCU-Monitoring is a multipurpose monitoring tool that integrates the latest Open Source technologies for monitoring, visualization, metric graphing, and log management, providing broad visibility into the status and availability of network elements, servers, databases, and workstations (among others) using custom Monitoring Packs.
In addition to the Free version, the Enterprise version of WOCU-Monitoring allows the deployment of thousands of IP devices in a distributed environment, with customizations tailored to each client’s infrastructure.