Release Notes 0.33
The following are the new features of the 0.33 version of WOCU Monitoring.
A great deal of work has been done on the stability of the solution, gaining performance in queries to data backends, in order to obtain a better user experience and to support Realms with a greater number of Hosts.
On the other hand, important visual changes have also been made to the interface, such as the grouping of the Problems tab on a single page or the display of performance metrics from the Host and Service Detail Views.
And last but not least, the scheduling of reports has been implemented, allowing their execution on the date defined by the user and the notification of the results.
Information
Unlimited registrations in Top Hosts report
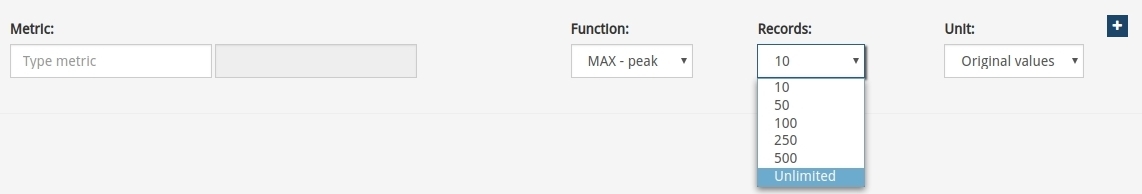
An improvement has been introduced in the Top Hosts report allowing the user to list the whole set of records obtained in the result of the report execution. In this way, we solve the problem of not being able to see all the metrics of large Realms in the same document.
Note
More information can be found at: Top Hosts Reports.
Multimetrics Report: new 95th Percentile function
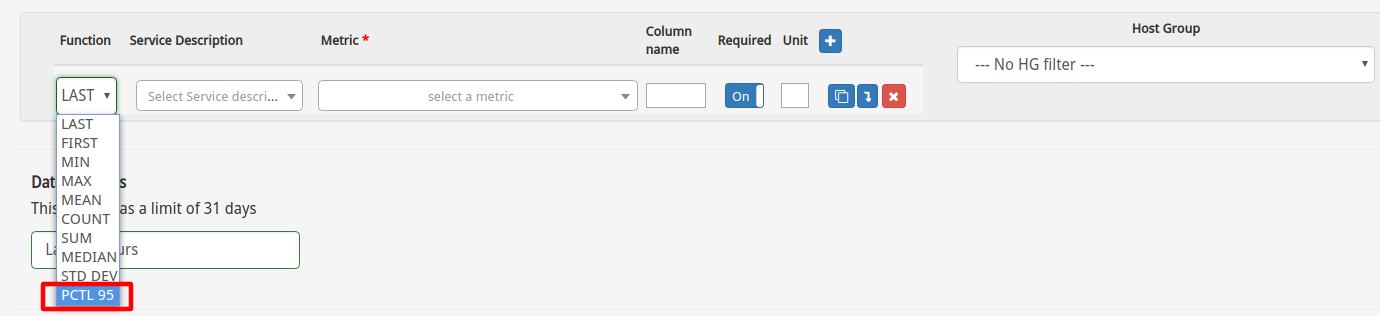
The 95th percentile function has been added to the Multimetrics Reports. The 95th percentile function consists of obtaining the maximum value of a sample but eliminating the top 5% of the highest values, thus obtaining more normalised results by eliminating the maximum peaks of the sample. The application of the 95th percentile is a somewhat widespread consensus in the industry for the calculation of bandwidth reports.
In future versions, when choosing the percentile function, it will be possible to modify the value taken by the percentile function. In this version it will default to a value of 95.
Scheduling of reports
In order to automate WOCU’s reporting operations, the possibility of scheduling reports has been added. The reports, due to the large amount of information they extract from the different backends and the intense computational capacity to process the data, require a lot of time to generate them. Until now, a report could only be generated when an operator created the report and launched it, and had to wait a considerable period of time to get the result. Now, with this new functionality, it is possible to schedule the launch of a report on a certain date and with a certain periodicity. This makes it possible, for example, to launch a report every day at 00:00 h., so that when the operator enters his workstation in the morning, it will already have been generated. In addition, the programming flexibility is very wide and can be adapted to almost any need.
Screenshots of this new functionality are shown below:
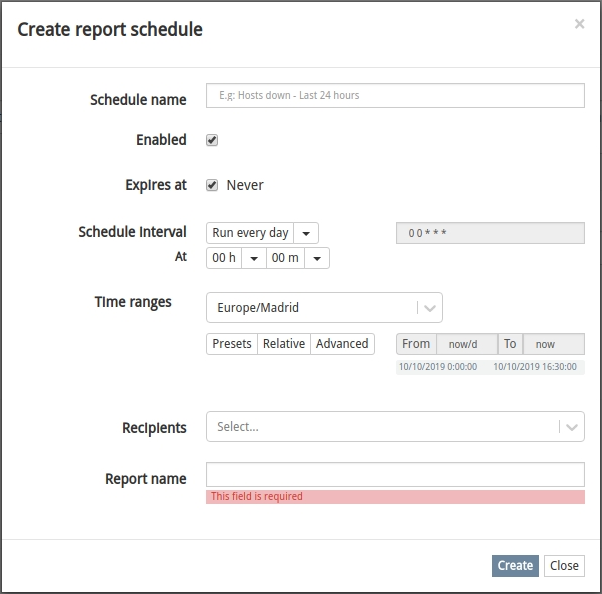
Form for creating/modifying a report schedule:
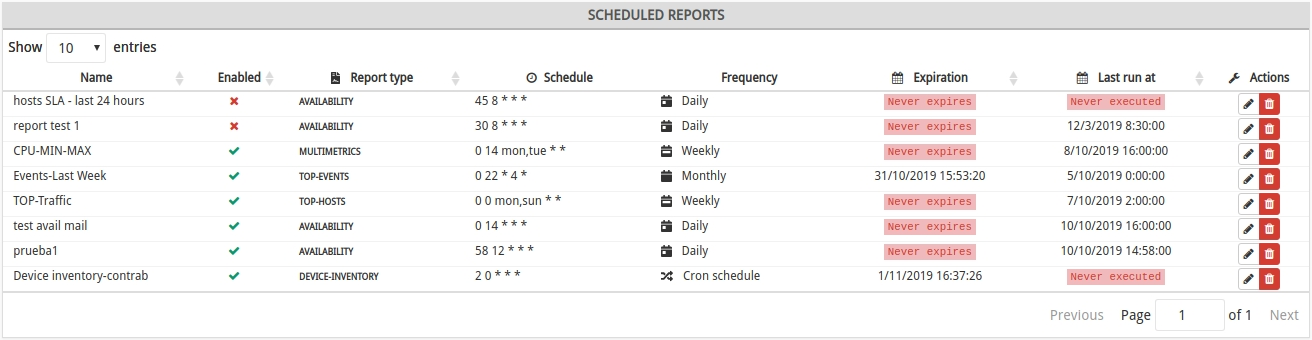
List of report scheduling:
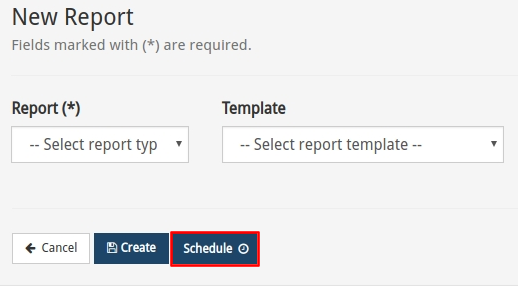
Creation of report schedules:
In the section where the reports are listed, specifically in the actions, a button has been added to schedule that report.
In the form for creating a report, a new button has been added to schedule the report with the configuration that has been determined.
Note
More information can be found at: Scheduling.
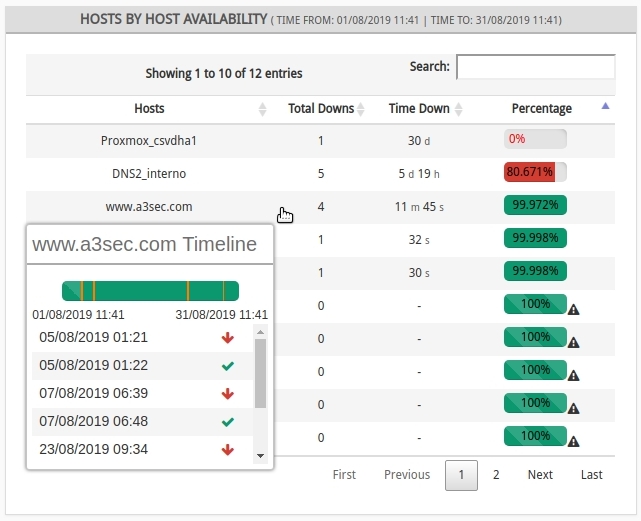
Link to Host and Service modes in Availability reports
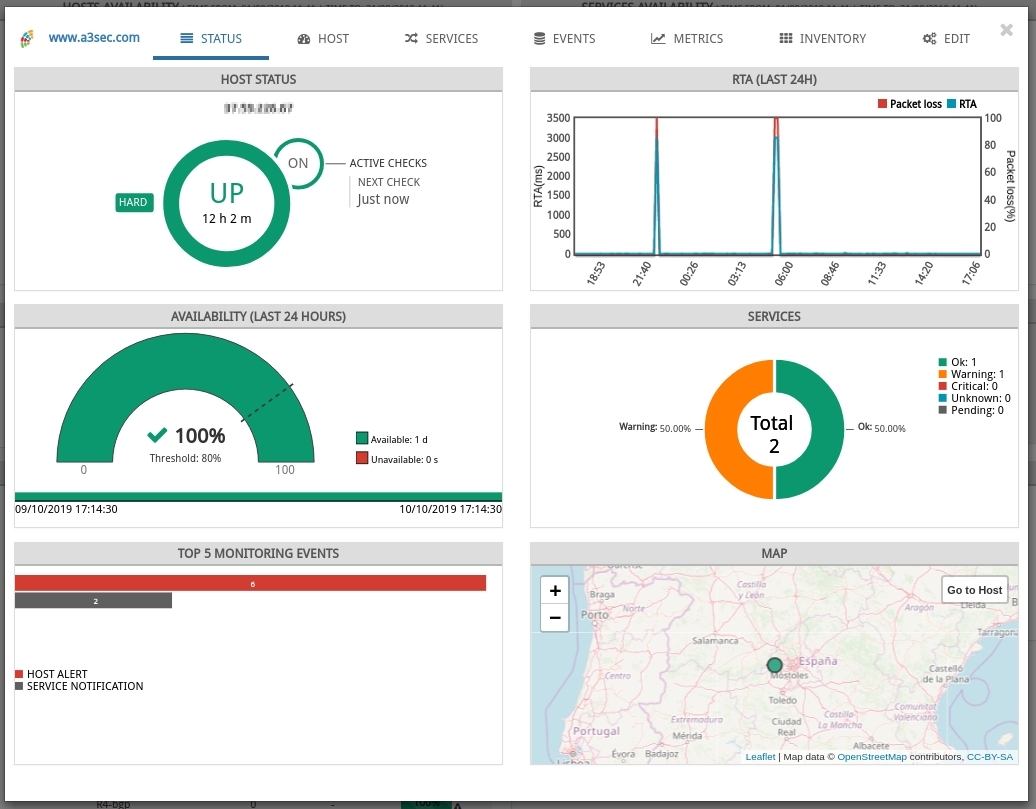
A link has been added to each entry in the Hosts and Services table of the Availability Report, which redirects the user to the Hosts or Services modal (detail view) respectively.
Clicking on a Host registration opens its corresponding modal:
Note
More information can be found at: Hosts by host Availability.
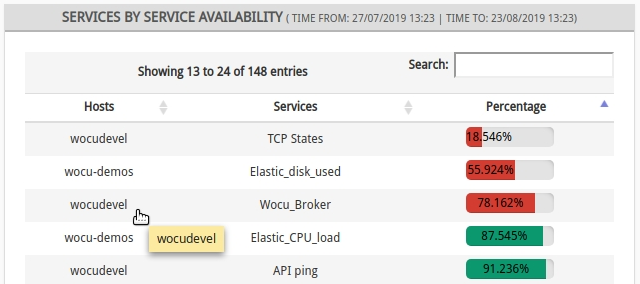
Clicking on a Service registration opens its corresponding modal:
Note
More information can be found at: Services by service Availability.
Discovery tasks
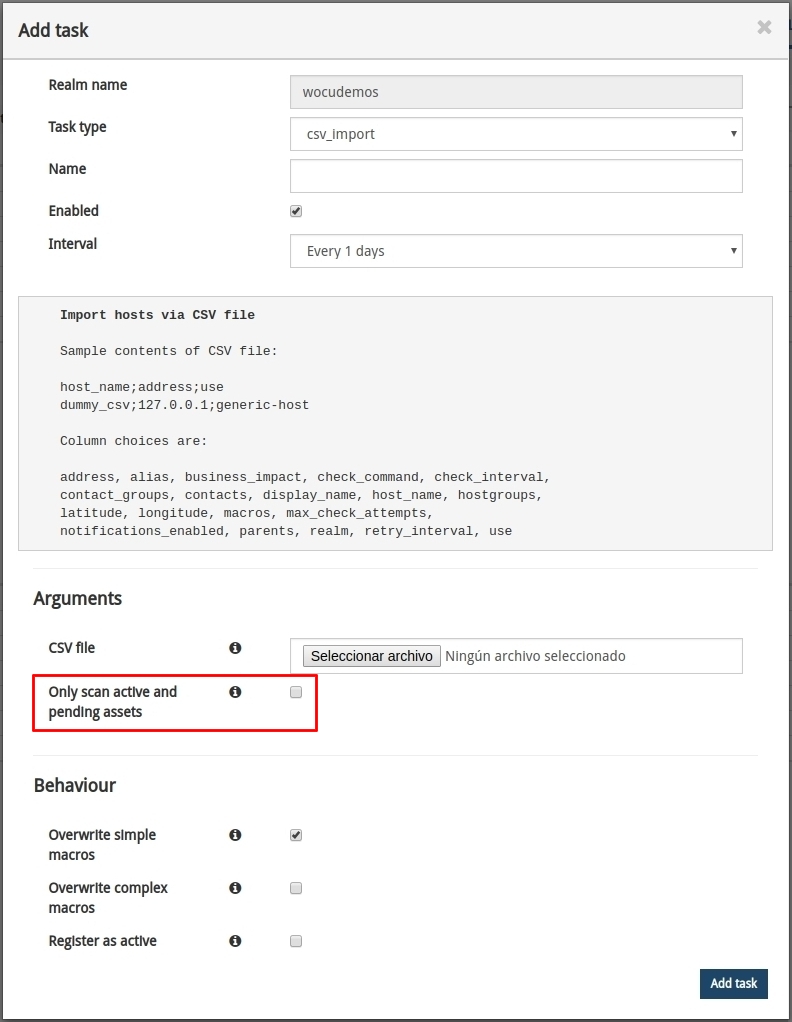
New configuration field in CSV import task
In order to keep WOCU’s Host information complete and up to date, the field Only scan active and pending assets has been added to the CSV_Import task.
Enabling this option will proceed to data enrichment only for Hosts present in the active and pending databases, excluding from the import all other Hosts that are not present in these databases.
Note
More information can be found at: CSV_Import task.
Monitoring packs
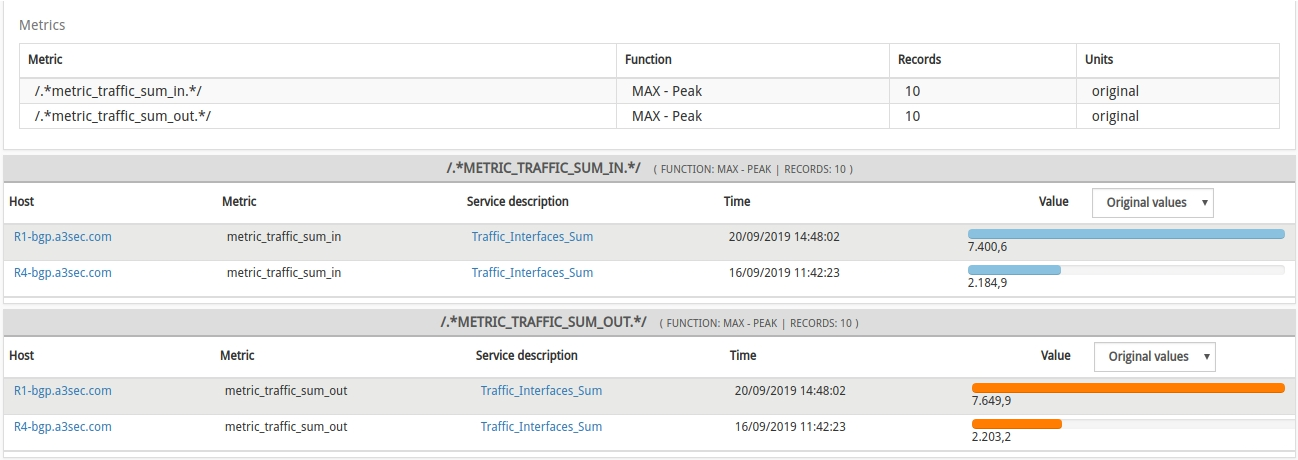
Pack networkdevice-traffic-sum
A new pack called Networkdevice-traffic-sum has been created to display the sum of traffic carried by a group of interfaces on the same host. The values returned are the sums of the incoming and outgoing throughput rates of all interfaces that satisfy the filtering rule. The filtering rule consists of a regular expression that is applied to the name (ifDescr) of the interfaces of the Host to which the pack is applied.
The pack is especially useful to obtain the Top Traffic Reports per Host rather than per separate interface.
WOCU internal configuration
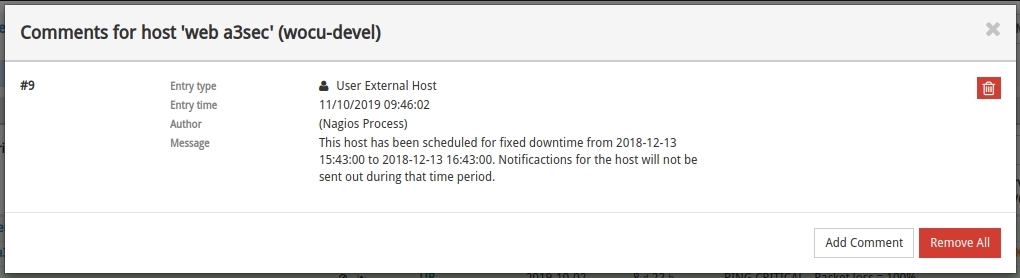
Requests for comments and downtimes on demand
The comment and downtimes information associated with the monitored Assets were obtained using the same Asset request. For the monitoring backend this meant making three queries to three different tables: Hosts, Comments and Downtimes, each time Asset information was queried.
It has been implemented to obtain this information on demand, so that an initial query to the Hosts table, brings summary information on comments and downtimes, without the need to attack the other two tables. It is at the moment of obtaining extended information when it is asked for these tables (Comments and Downtimes), gaining in performance and avoiding queries in the normal course of monitoring.
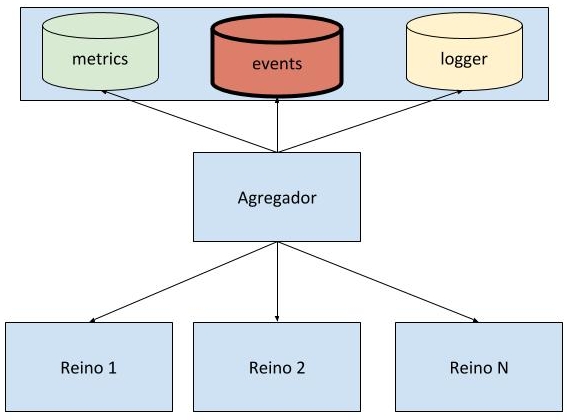
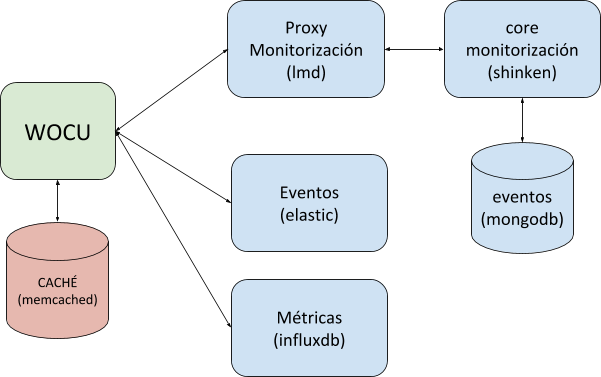
Centralised database for monitoring events
In the previous release, an architectural change was introduced to use a centralised Mongodb-based backend for the storage and management of all monitoring events generated by the infrastructure monitored by WOCU. This change was experimental in version 0.32 and had to be applied manually by the administrator. The increase in performance and reliability obtained has been such an improvement that for this version the architecture change is to use Mongodb by default in all installations.
Internal cache improvements for data requests
The internal data request caching system has been substantially improved, so that requests that use dates as arguments are also cached. This dramatically improves the user experience in deployments with many users, as equivalent requests made by different sessions will get the cached data instead of the backends of data (logs, metrics, events), even if the requests are made by different users. The cache expiration time is fully configurable.
Internal monitoring of platforms
In order to increase the visibility of the monitoring servers, we have extended the installation of the internal Collectd daemon to all the components of the platform. In this way we will be able to generate performance graphs of all monitoring equipment automatically.
Improvements in the loading time of configurations
The way the monitoring engine reads and checks configurations (applying WOCU-Check) has been optimised to significantly reduce loading times.

If you encounter a situation where the configuration upload takes longer than a minute, please contact us at <support@a3sec.com> so that our support team can try to further optimise the process.
Upgraded software
Numerous pieces of software integrated in WOCU have been updated:
Software |
Previous version |
Current version |
Remarks |
|---|---|---|---|
lmd |
1.3.5 |
1.4.3 |
Fixes problems with shinken-specific columns. |
nginx |
1.9.14 |
1.14.2 |
Mitigates the following vulnerabilities: CVE-2016-2183, CVE-2014-3566, CVE-2011-3389, CVE-2015-4000. |
mongodb |
3.0.7 |
3.4.18 |
Switch to “WiredTiger” storage engine saving disk space. |
mongodb |
5.1.5 |
5.2.3 |
Mitigates the following vulnerabilities: CVE-2018-15727. |
API
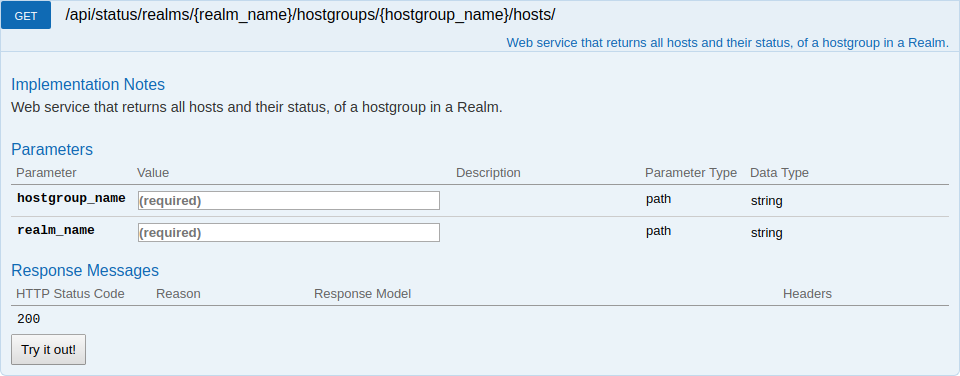
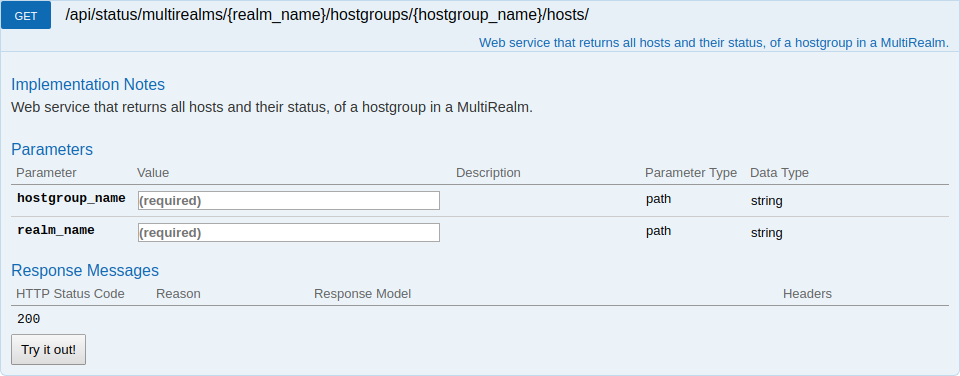
Rest API enhancements for queries by Hostgroups.
Two new endpoints have been added to the WOCU API, as a continuation of the work to facilitate the integration of other tools. These new endpoints allow querying the status of Hosts belonging to a Hostgroup in a Realm or multi-realm.
Asset configuration
Support for FQDN addresses in Address field of Hosts
The possibility to use names in the configuration of the Address field of any Host has been added. This makes it easier to monitor Assets referenced by name instead of IP address.
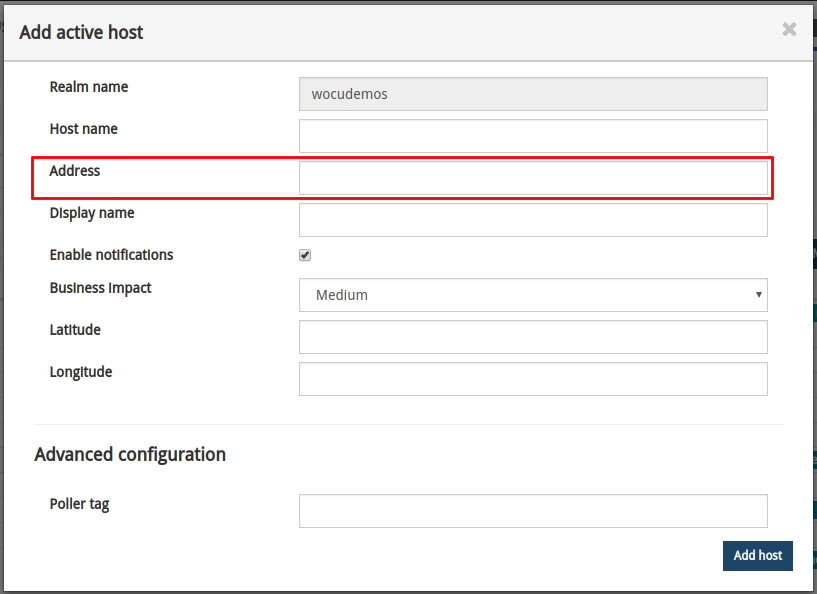
Note
More information can be found at Add Host.
Configuration of BP Hosts in Hostgroups.
A new field has been added to the Hostgroup registration form, which allows you to define which Business Process Hosts (BP Hosts) are going to be part of a specific group.
The old Members field has been replaced by Host_members and a new Bp_members field has been added to allow BP Hosts to be configured. In practice, Shinken interprets a single Members field which is equivalent to the union of the elements in Host_members and Bp_members.
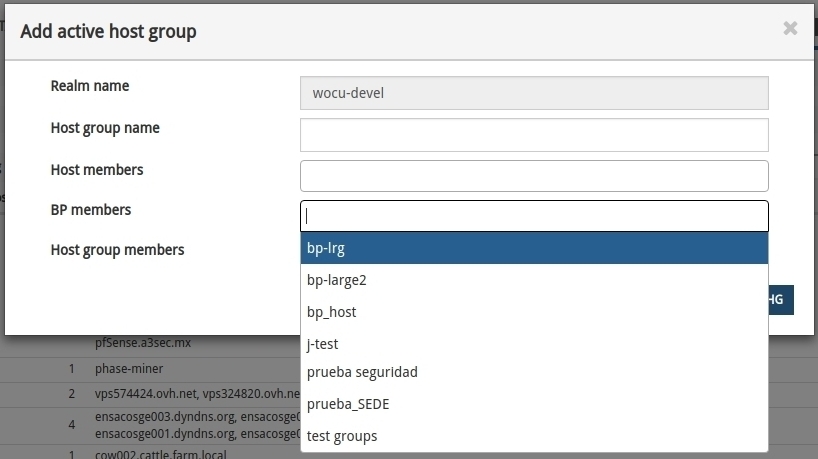
Note
More information can be found at: Add Host Group.
Interface
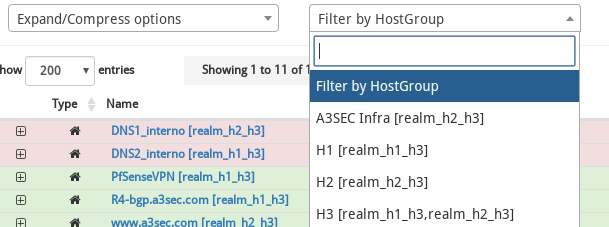
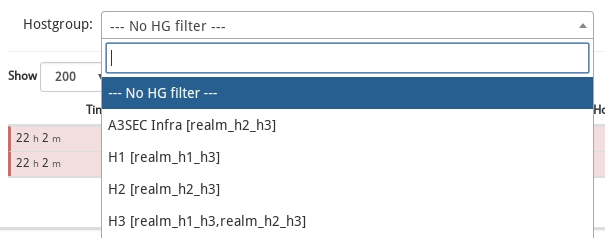
Filtering of Hostgroups grouped in multi-realms
A grouping of the Hostgroups filters into multi-realms has been done. Previously when you had Realms, which had some hostgroup with the same name, the filter would show that hostgroup duplicated with the Realm name it referred to:
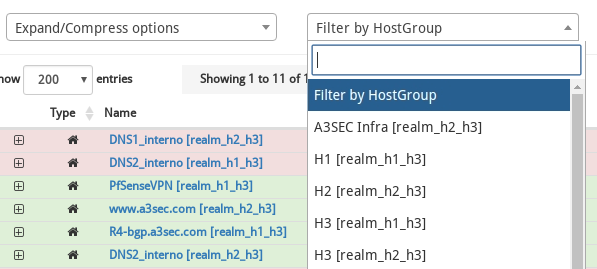
That behaviour has been changed and now a single hostgroup appears that will merge the Hosts of both Realms, and all computation will be done according to that mix.
Note
More information can be found at: Inventory operational options: filters and exporting.
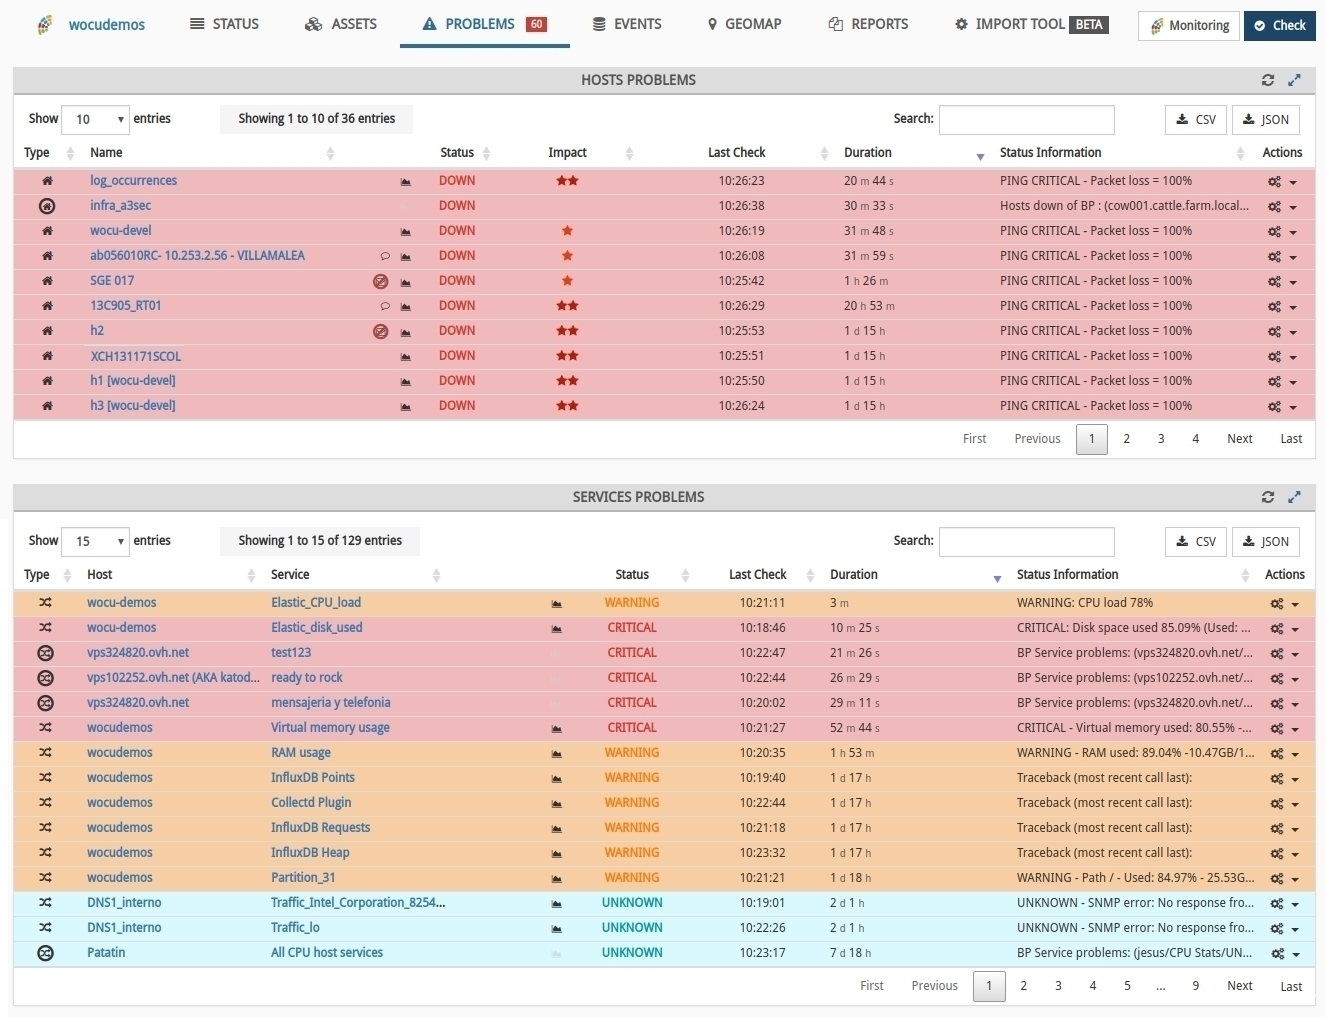
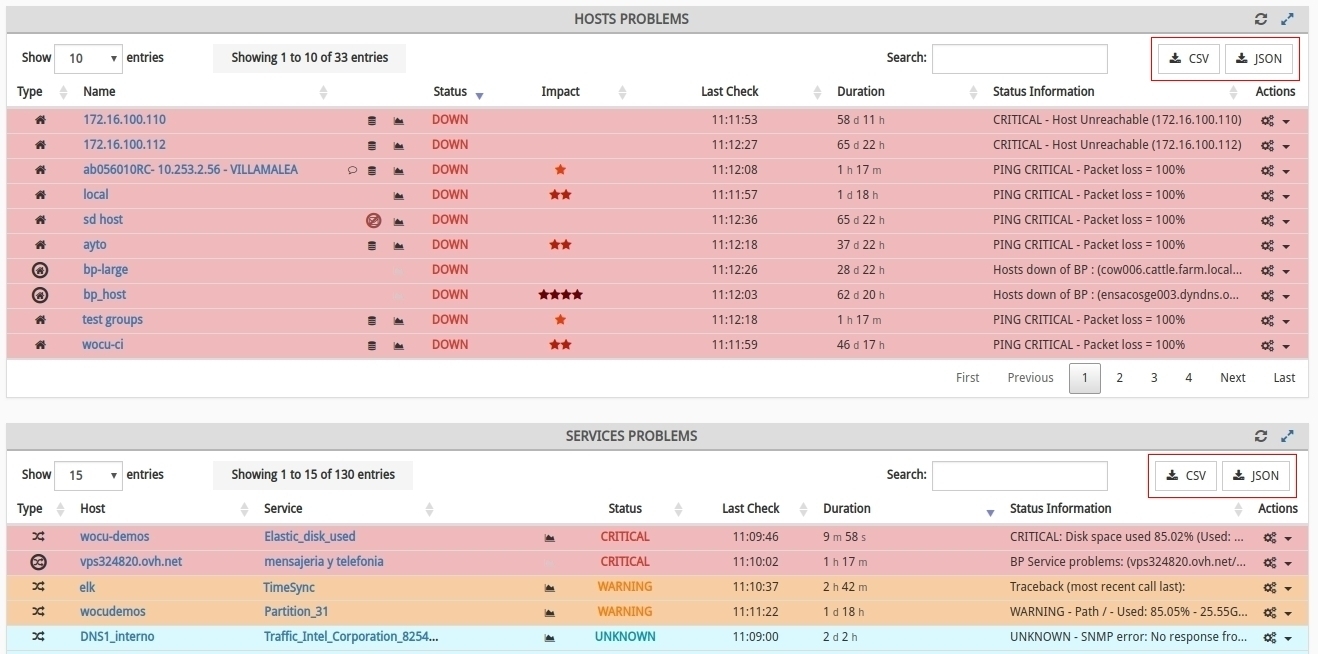
Unification of the Alarms tab (Problems)
The Problems tab in the aggregator has been unified, eliminating the multiple sections (sub-tabs) that were there before, and showing in a single view all the detected problems. Two tables are now displayed: in one table all the Host problems (Hosts and Business Process Hosts), and in another table all the Service problems (Services and Business Process Services).
This allows for improved visualisation of issues for users, and makes the auto-refresh of the page more useful by not having to navigate between tabs to see the update of infrastructure issues.
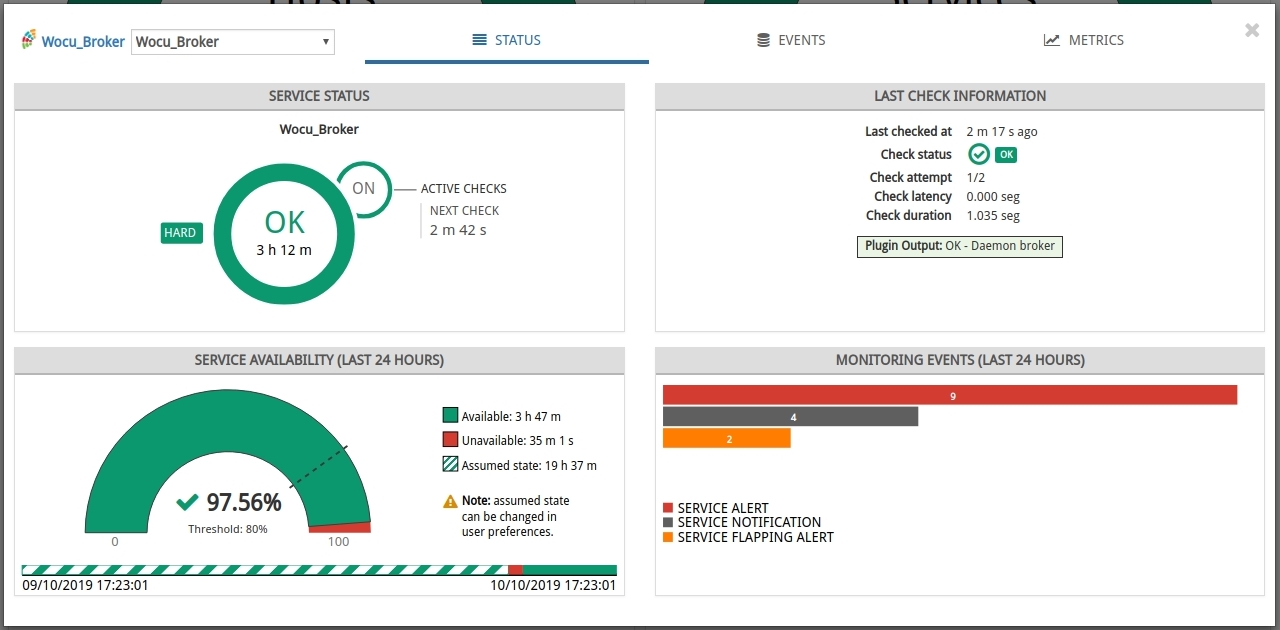
New Metrics tab
A new tab has been added to the Hosts and Services modal (detail view) to display the PNP metrics of a Host or a Service. The tab allows you to select a date range for the display of PNP data, and to select the metric whose information you want to display.
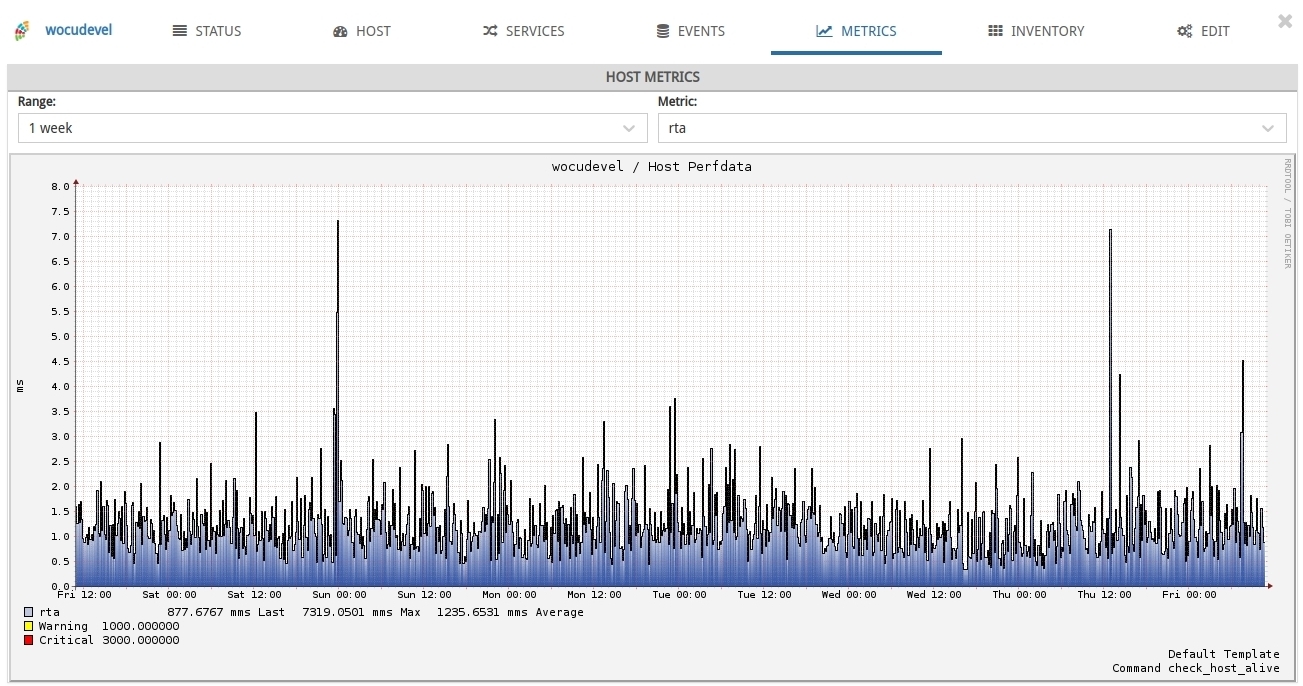
With this tab, it is intended to replace the link to the external tool PNP4Nagios from the Assets and Problem listings in the Realm view. This is done for two reasons.
Prevent security issues arising from access to an external tool. PNP4Nagios does not use authentication and does not allow access control, which may allow an unauthorised user to escape from the PNP4Nagios information page and view information from other Hosts or Services for which they are not authorised.
Prevent network problems, because the external tool may be on a machine that the aggregator application server has access to, but not the web browser that is accessing the browser, causing the PNP information not to be accessible in the first place.
Note
More information can be found at: Metrics.
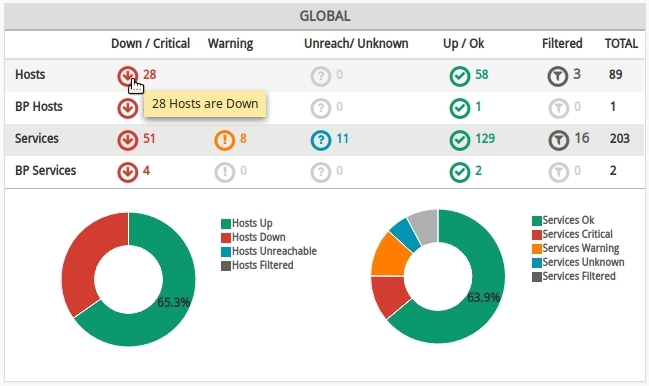
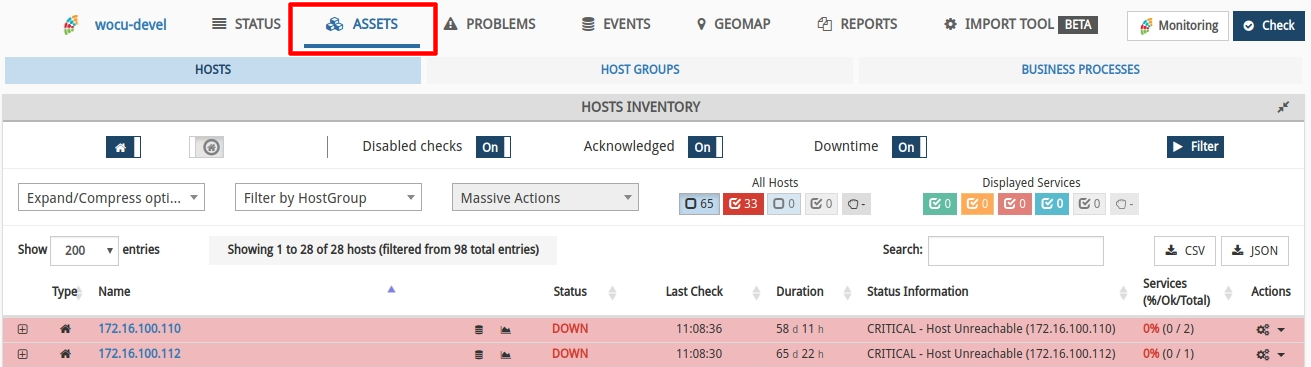
Jump to Assets tab from global status table
The functionality has been added to be able to click on the Hosts or Hosts Business Processes status icons in the global status widget of each realm and go to the Assets page applying the appropriate filter. This will result in greater agility on the part of the operator to examine the Hosts of a given status.
CSV and JSON download in Problems and Events
Prior to version 0.33, Assets could be downloaded in JSON and CSV format from the Assets section. Now, in addition, download functionality has been added from the Alarms (Problems) section, both Hosts and Services in JSON and CSV formats.
Note
More information can be found at: Problem list export.
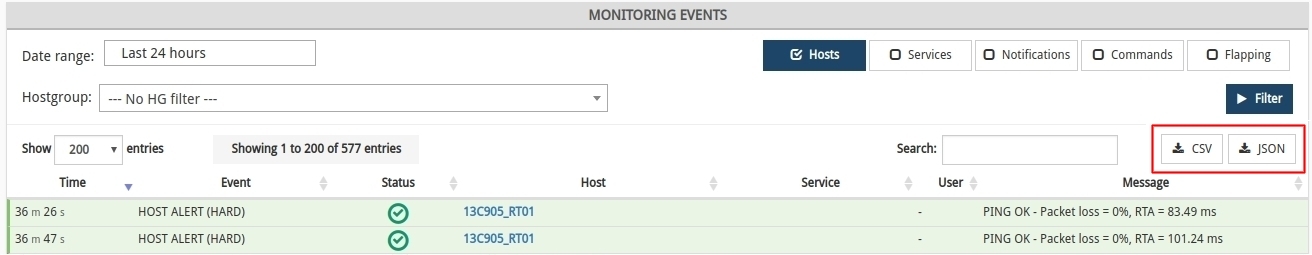
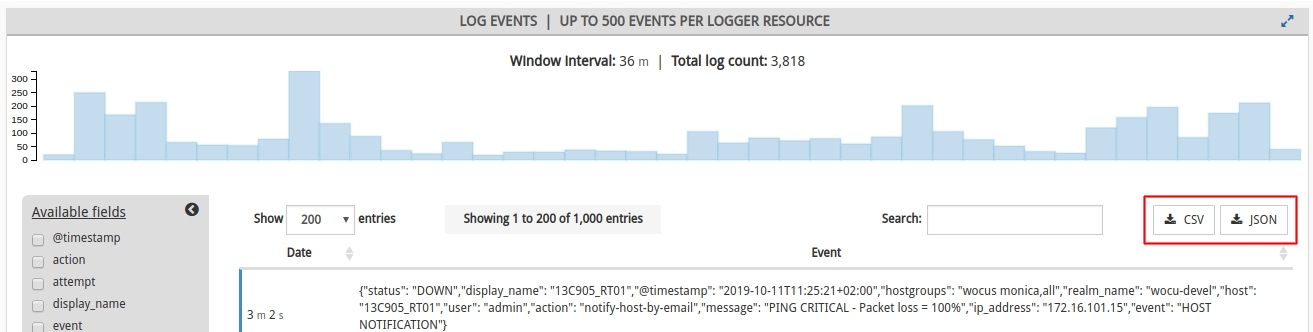
WOCU-generated monitoring events can also be downloaded from both sections of the Events tab:
Monitoring Events:
Logs:
Note
More information can be found at: Export of the list of Monitoring Events.
Documentation
Improvements to the user manual and new section: Use Cases
A new template has been defined for the presentation and reading of WOCU documentation. With the aim of improving the visualisation of contents, offering a more attractive and intuitive interface and facilitating internal navigation, thanks to the incorporation of a sidebar with the different sections and chapters of the documentation.
This new redesign is presented as an improvement in the visualisation, structuring and localisation of information, as the documentation of the tool is very extensive.
In addition, a new Use Cases section has been added to the WOCU technical documentation, as a complement to the User Manual. This space will be dedicated to the detailed description of routine and/or relevant actions for users of the tool. The section will continue to be enriched with new use cases to streamline the handling and management of WOCU.