Dashboards
The Dashboards tab centralizes various charts, topological maps, statistical tables, diagrams, etc., exported from external tools to WOCU-Monitoring, based on the configuration and choice of the Administrator. The system allows for the integration, visualization, and management of data from multiple sources, rendering them within its own interface.
Attention
The Dashboards tab will only be enabled when dashboards ar
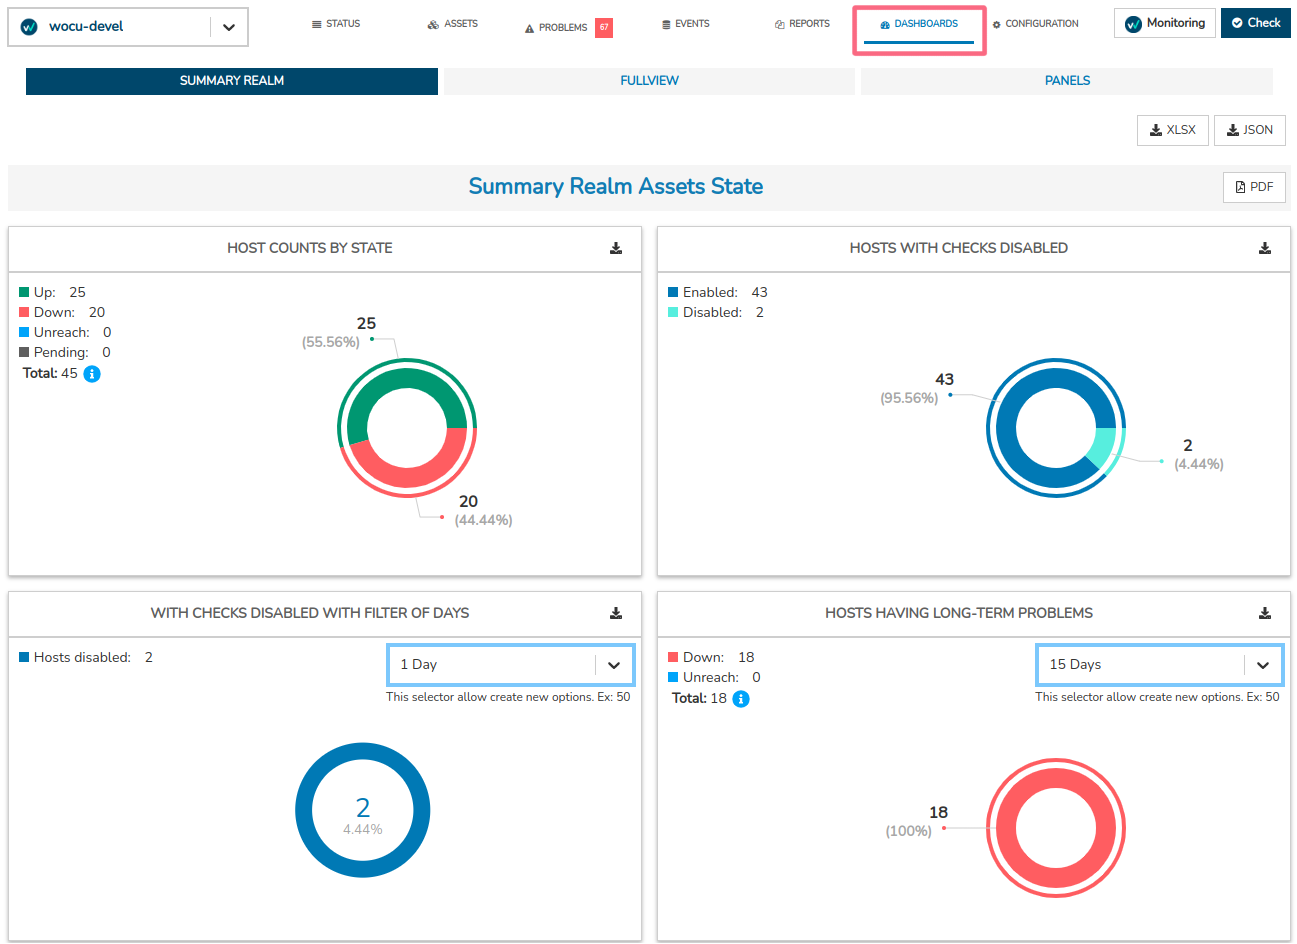
Image 1: Dashboard imported from the Summary module.
Thanks to the versatility of WOCU-Monitoring in managing countless metrics, tables, databases, etc., of different types and origins, it is possible to generate dashboards with powerful graphical capabilities. These can show, for example, the real-time behavior of monitored infrastructures, aiding in incident resolution, or the logical relationships and interactions between applications in a local network through network diagrams.
Important
WOCU-Monitoring offers a series of OpenSource tools as a complement to its functions, from which a variety of dashboards can be generated and exported; see Grafana, Nagvis, Pnp4nagios, Thruk-panorama, etc. More information at: Additional Tools (Monitoring).
The operation of these tools is independent of WOCU-Monitoring, but they are useful for various daily monitoring tasks.
Configuration of Dashboards
The configuration of this view is entirely flexible and will depend on the Administrator’s needs and use cases. The configuration will be carried out only by system Administrators, but it will be visible to other users
Note
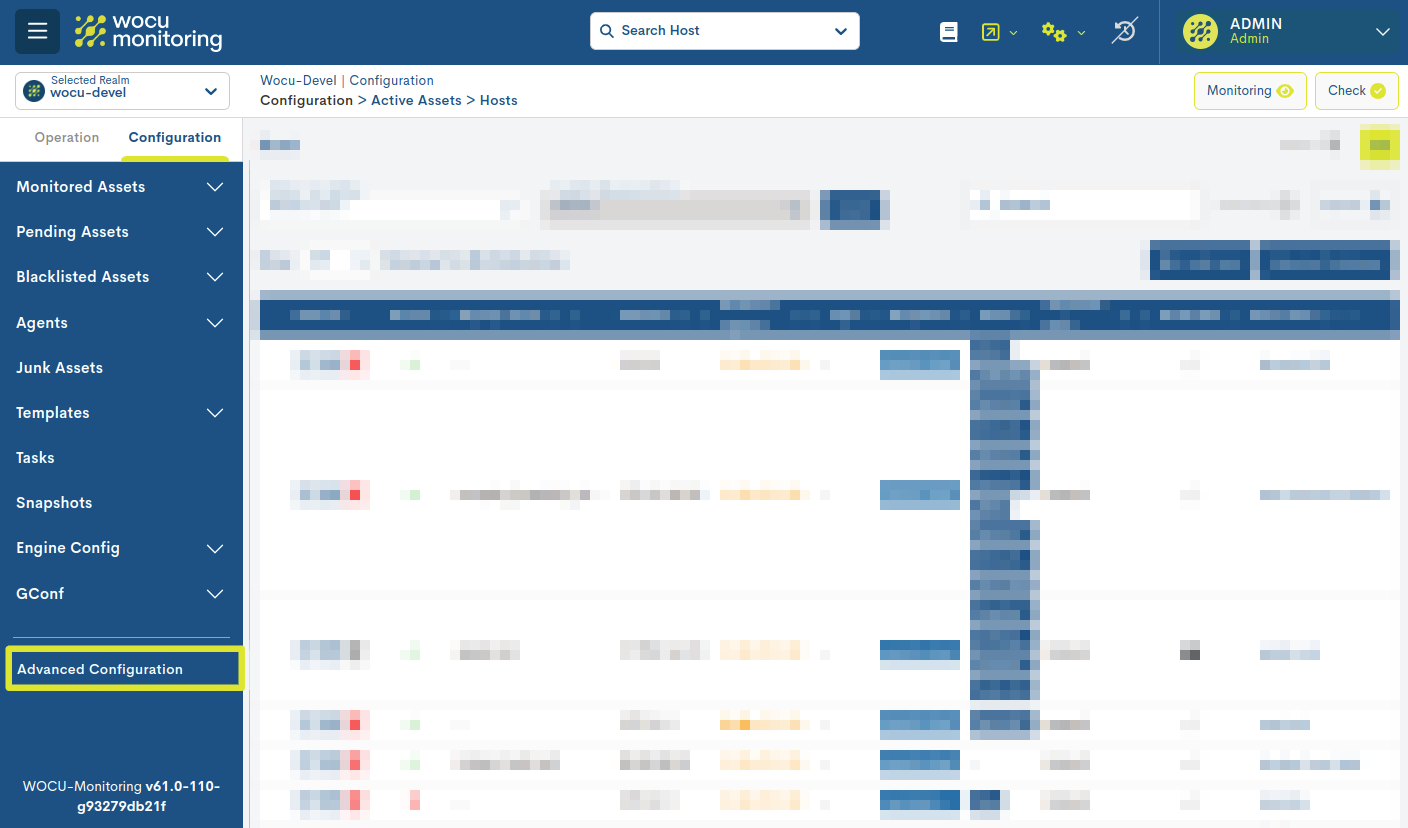
From Advanced Configuration (WOCU Engine), the Administrator can link and manage resources generated in external tools but with data extracted from WOCU-Monitoring. It is as simple as adding the URL of the elements to be incorporated into our dashboard. Once linked, the Realm in which this WOCU Engine is configured will have the corresponding elements available
Dashboard Analysis
Three views are available:

In the last two views (Fullview and Panels), various options for filtering, pagination, and data refresh are available. These options are detailed below:
Refreshing the displayed elements: by clicking on the circular arrows icon (🔁), an immediate refresh will be forced. This action is useful to ensure that the most up-to-date information is being displayed.

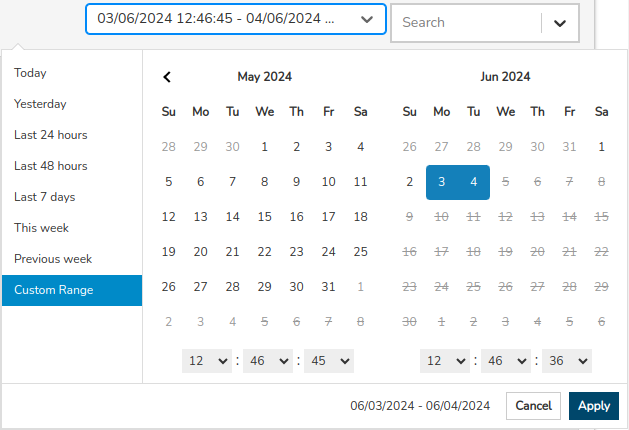
Selecting a time range: which the data displayed on the dashboard elements will refer to. You can select from various predefined time criteria or configure a custom time period using the Custom Range option. This is essential for specific analyses and temporal comparisons.
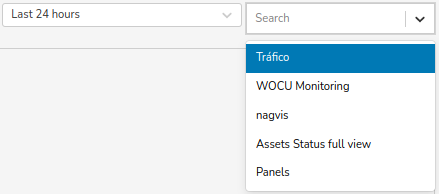
Panel selection filter: this selector lists all the panels available in the Realm. By selecting one of them, the elements associated with the chosen panel will be displayed.
Pagination and navigation between views: the different resources and elements will be arranged over several pages. At the bottom of the view, there is a pagination menu useful to navigate through all the available views.

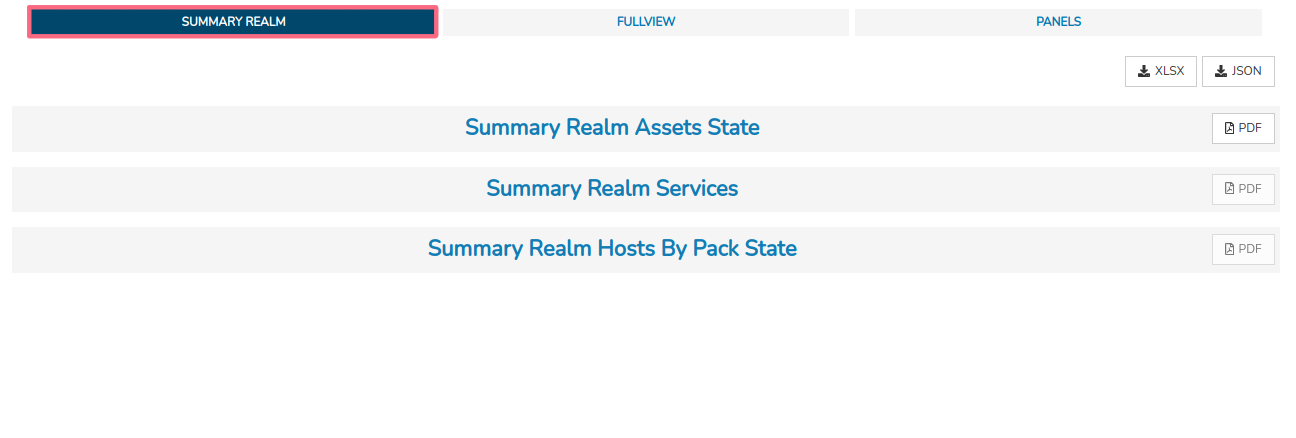
Summary Realm
This view is divided into three main sections. Each section includes various interactive widgets, along with informational modals and data export options.
Each of the widgets that make up the view is explained in detail in: Assets Hosts.
Summary Realm Assets State
Comprised of five interactive widgets whose charts distinguish betweendevices based on recorded monitoring states, devices duplicated by name and IP, and those with disabled checks.
Summary Realm Services
Composed of four interactive widgets whose graphics make a Distinction of Devices by critical monitoring statesregistered and for services with disabled checks.
Summary Realm Host By Pack State
Composed of two interactive widgets whose graphics are linkedto the use of Monitoring Packs.
Note
Through the Aggregator Summary view, WOCU-Monitoring offers these same measurements at a global level, that is, considering the totality of elements that make up the monitored network (without distinctionof Realm).
Fullview
This view shows a single panel (with its corresponding graphic representations) by dashboard.
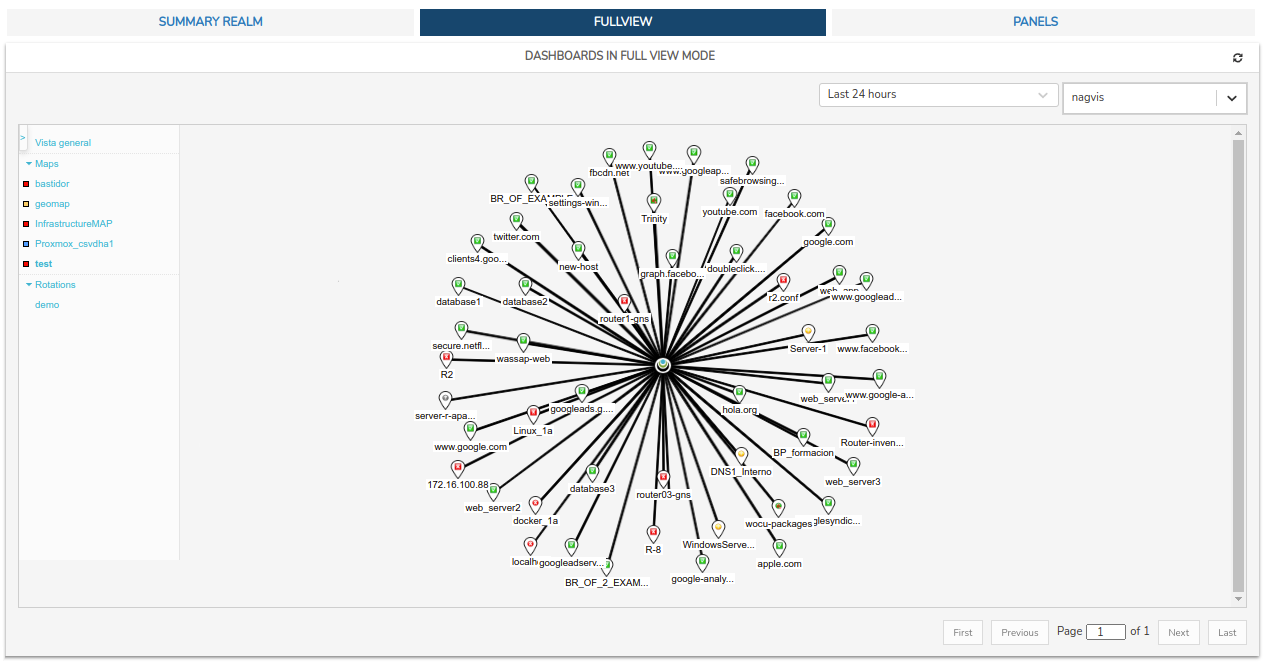
Figure 2: Dashboard exported from NagVis.
Panels
This view displays up to 10 panels per page. If this number is exceeded, they will be distributed over several pages. To display a specific panel, select it in the drop-down menu above and the view will be updated with the marked element (removing the rest of the panels).
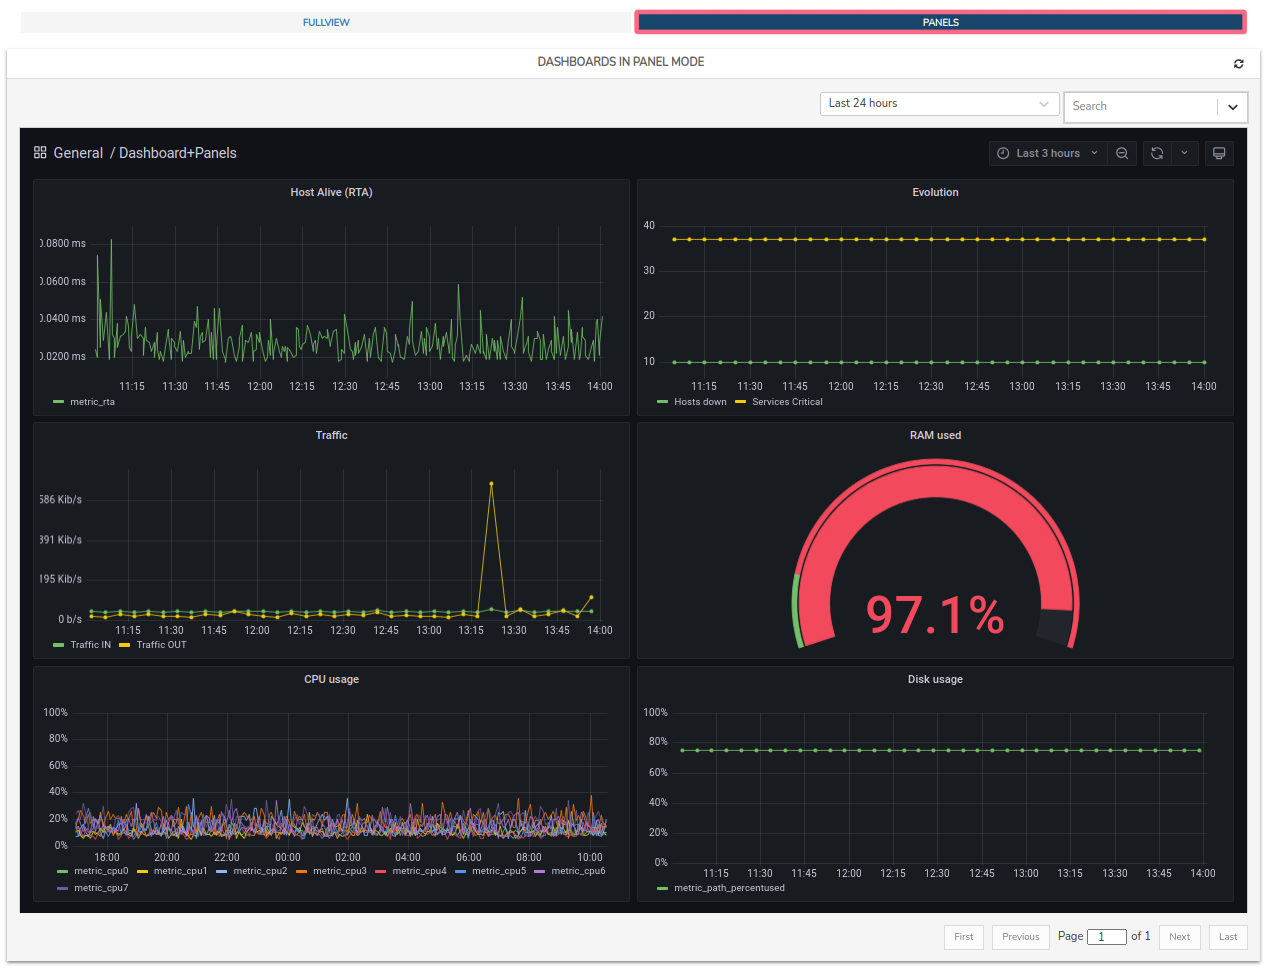
Figure 3: Exported Grafana panels.
Customization of Dashboards and interactive functions
Dashboards are dynamic environments composed of numerous interactive components. Additionally, by supporting and loading a wide variety of widgets, there are many applicable options that will vary depending on the type of each element and the scope of the tool providing them to WOCU-Monitoring. Some possible interactions with elements are:
By placing the cursor over any point on graphs, diagrams, maps, etc., an extra information window will pop up. For example: values recorded for the particular point, monitoring status information, geolocation of nodes, etc.
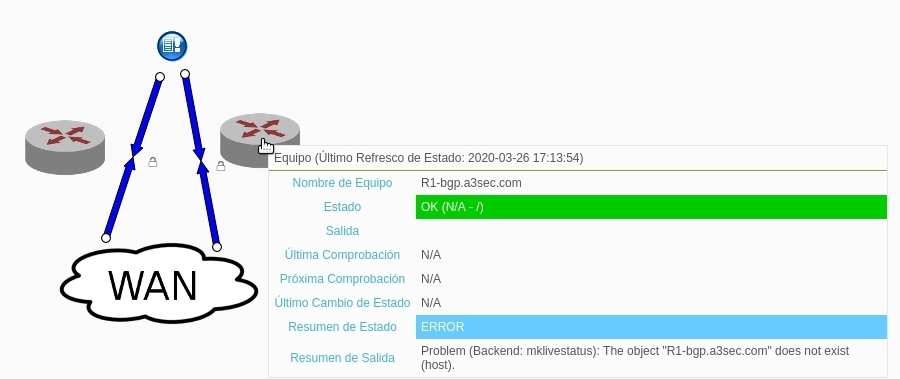
Figure 5: Network topology maps exported from NagVis.
By clicking on one of the series in the legend, only the marked series will be displayed on the graph, clearing the view and hiding the rest of the series. To restore the initial graph, repeat the action by clicking again on the series or refresh the view (🔁).
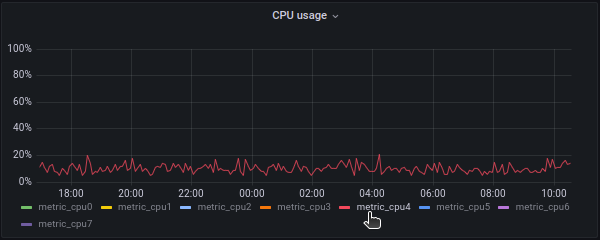
Image 5: Graphics exported from Grafana.
Manual selection of metric data intervals. Clicking and dragging with the left mouse button on a specific area of a graph will select an interval that will result in the updating of the graph with the data corresponding to the marked plot.
This action can be repeated indefinitely, each time obtaining a smaller selected range than the previous one and reaching a high level of detail.
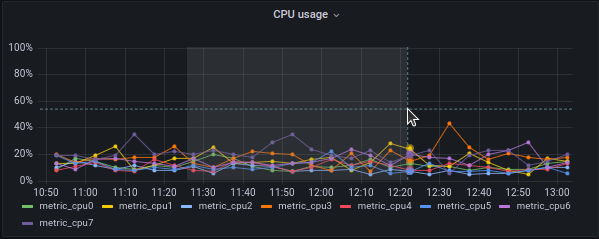
Image 6: Graphics exported from Grafana.
Among many others, there is the possibility to share, delete or duplicate panels, buttons to manipulate the zoom of maps or a multitude of options for panel styling and formatting.
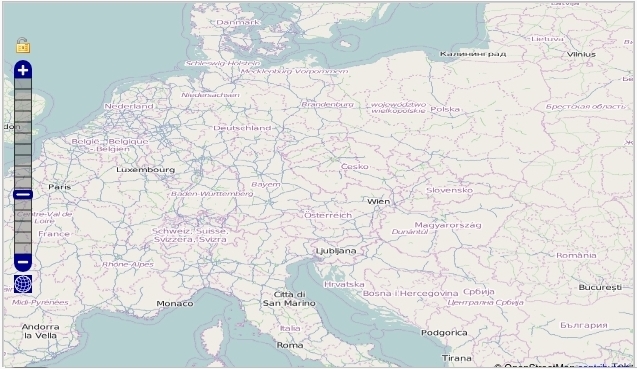
Figure 7: Map exported from Panorama.
Additional module and how to contract it
Dashboards is not distributed by default in WOCU-Monitoring, this is included in the ‘Platinium version <https://www.wocu-monitoring.com/licenses/>`_.
If you are interested, contact our Commercial Team <https://www.wocu-monitoring.com/contact/>`_ and they will resolve all your doubts.