Release Notes 63
Publication Date: 24/03/2025.
This document presents a detailed summary of the new features, functionalities, improvements and fixes integrated in WOCU-Monitoring version 63. With this update, we respond to the requests and suggestions of our users, while at the same time aligning ourselves with current market trends and needs.
1. Cloud environment monitoring Phase I (Meraki)
In this new version, a new module for monitoring network devices managed via the cloud has been included. The integration will cover the three most demanded cloud platforms in the market, starting with Meraki. This new module allows a seamless integration with the different platforms from a single point.
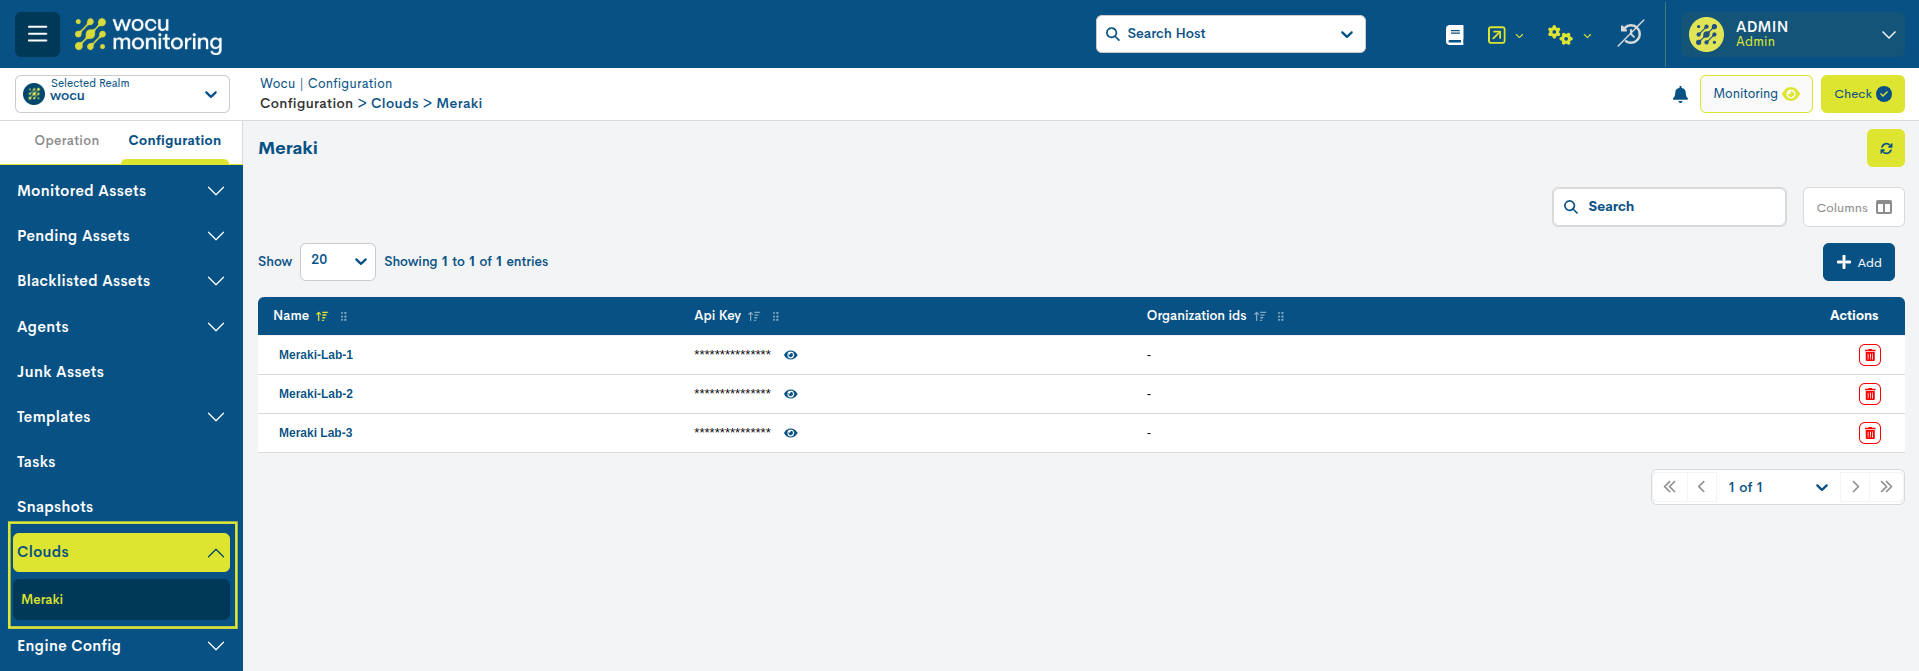
This new module has been designed to automate as much as possible the process of monitoring devices managed through the cloud, significantly reducing human intervention. Its operation is simple: a connection is established, which triggers a task responsible for collecting the list of hosts and the type of device. With this information, the system automatically applies the corresponding monitoring pack.
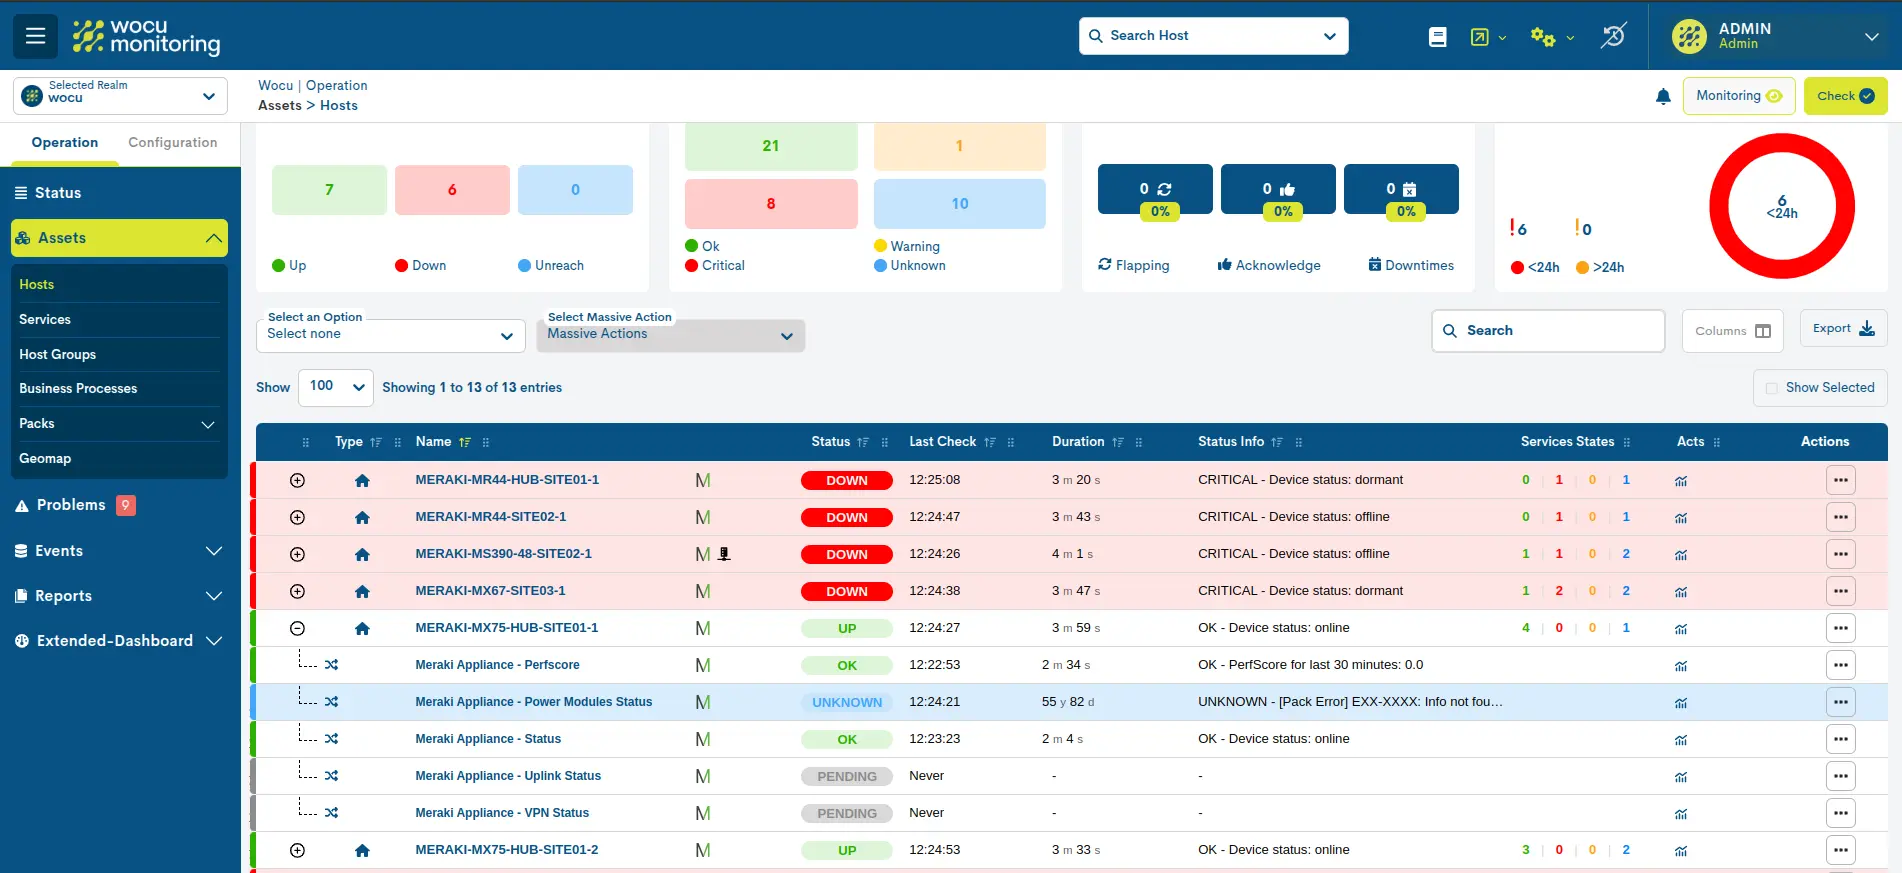
The list of available services is detailed below:
Service |
Metric |
Meraki Appliance - Perfscore |
Performance Score (perfscore) |
Meraki Appliance - Power Modules Status |
|
Meraki Appliance - Status |
|
Meraki Appliance - Uplink Status |
|
Meraki Appliance - VPN Status |
|
Meraki Network - Alerts |
Events by severity (sev_type) |
Meraki Network - Traffic |
Bites Send (sent), Bites received (received) |
Meraki Network - VPN Statistics |
Input and Output Traffic in Bytes (X_in), (X_out) |
Meraki Network - Events |
Num networks events (network_events) |
Meraki Switch - Port Status |
|
Meraki Switch - Power Modules Status |
|
Meraki Switch - Status |
|
Meraki Switch - Traffic by port |
Traffic average speed in bps (portX_up), (portX_down) |
Meraki Wireless - Status |
|
Meraki Wireless - Clients |
Clients count by state (online), (offline) |
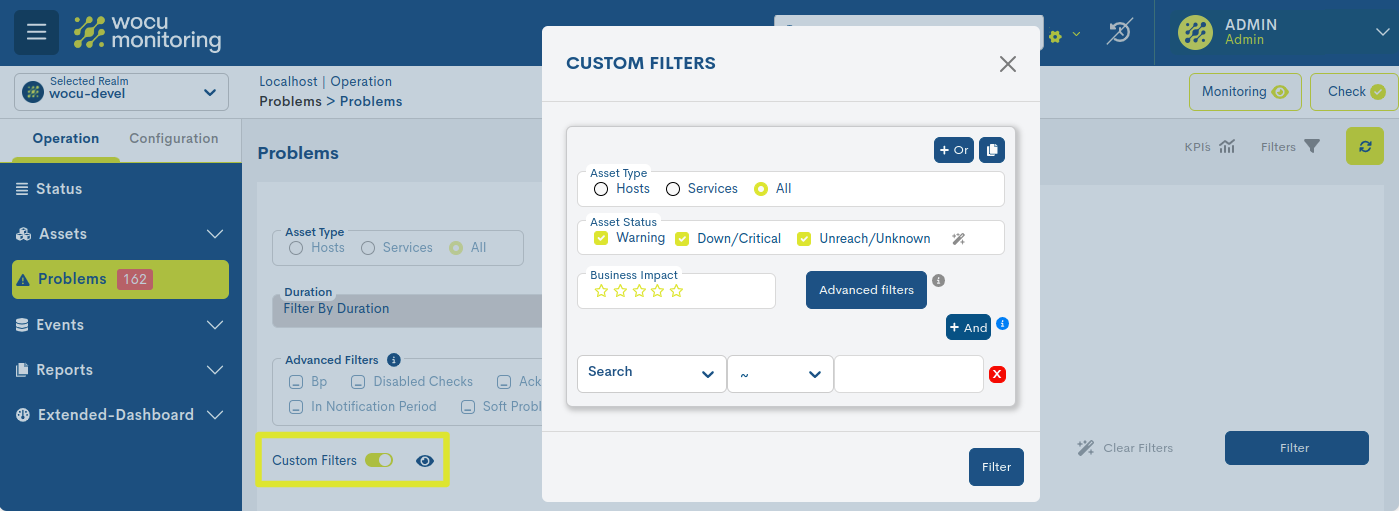
2. Custom Filters: editing filters in Problems, assets, services
Within the Operational options of the Problems list, a new block Custom Filters is incorporated.
This new feature gives users full control in searching and filtering data, with a more efficient and precise scope. Users can now define more specific criteria by using and combining various logical operations, segmenting information according to their particular needs.
In addition, nesting filters has become easier with the integration of operators such as AND, OR or duplicate queries. This makes it possible to perform more complex and flexible searches without having to perform multiple queries.
This functionality is ideal for reducing the volume of results and putting the focus exclusively on the problems that are most relevant to the daily operation in WOCU-Monitoring.
This functionality has also been implemented in the Assets and services tables.
3. Favourite Filters: filter analysis in Problems, Assets, Services
Custom filter management has been added to the hosts, services, problems and monitoring events tables. When the filters are displayed, the following options are available:
Custom filter selector: allows you to search and select a previously saved filter.
Save filter” button: located between “Clean filters” and “Filter”, this button displays a modal where the name of the custom filter can be entered to save it. - If the name already exists, a confirmation prompt will be displayed to overwrite the filter. In that case, the “Save” button will change its function to overwrite.
Delete filter” button: available when a filter is selected. Pressing it opens a confirmation modal to delete the current filter.

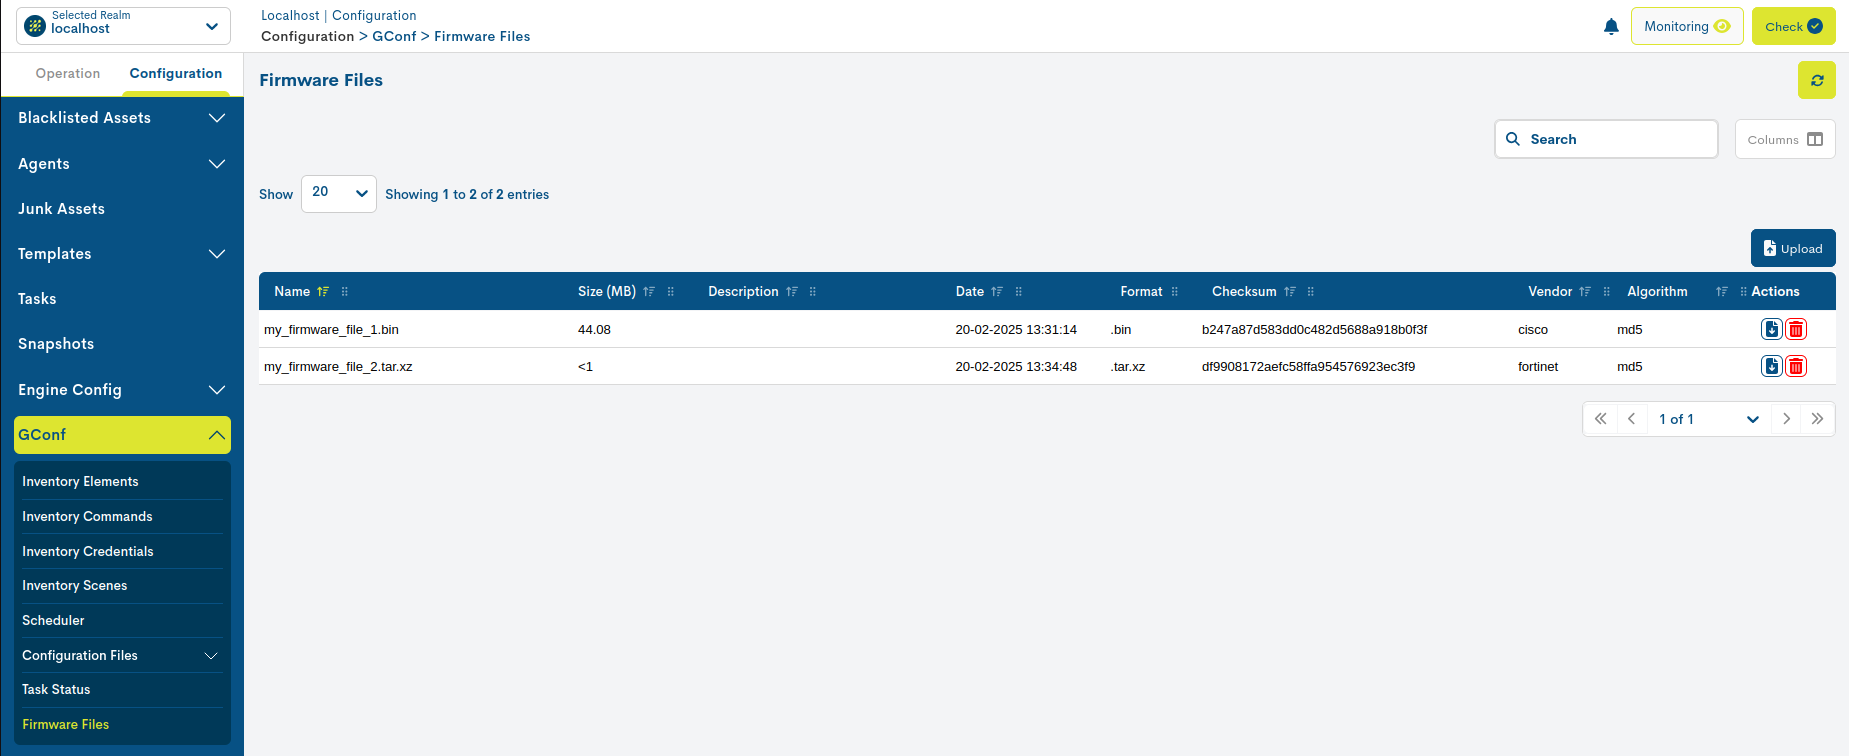
4. GCONF module evolution: Firmware files
Firmware Management has been incorporated into GConf, a functionality that automates updates on network devices, ensuring file integrity and providing detailed auditing. It allows centralised storage of firmware, facilitating its use as a repository and ensuring backups. It is compatible with TFTP, SCP and FTP, allowing its application on different devices.
The process is asynchronous and automated, avoiding interruptions. A dedicated worker manages the workflow, including backups, command execution and post-restart checks. In addition, each firmware goes through an integrity check (MD5, SHA1, SHA256 and SHA512), and detailed audit logs are generated to track every action.
File management is simple, with functions for uploading, listing, searching and deleting firmware. Before upgrading, the system allows you to create backups, execute pre-commands and verify connectivity after reboot. Integrated with GCONF, it leverages existing servers and allows customisation of parameters according to the needs of each company.
For more information, please refer to the User Guide or contact the support team.
5. Integration of endpoints for host management in the Public API
The API Public of WOCU-Monitoring has been updated by adding four new endpoints for hosts management in the application.
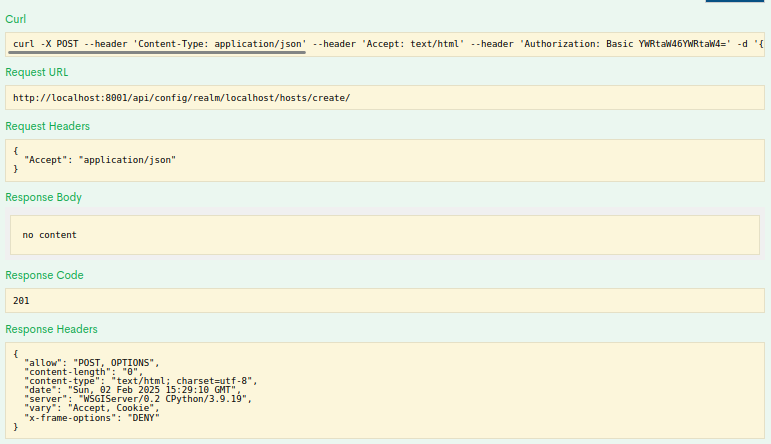
New endpoints for host creation
It is now possible to create a new host in the application via two different endpoints, depending on whether the realm name or the IP address of the Import Tool is used.
Host creation using the name of the realm:
POST /api/utils/wocu-add-host/realm/{realm_name}/
Host creation using the IP address of the Import Tool.
POST /api/utils/wocu-add-host/import-tool/{import_tool_ip}/
When making a request to these endpoints, information about the host to be created, including parameters such as name, IP address and associated tags, must be provided in the body of the request.
The expected outcome of a successful consultation could be the following:
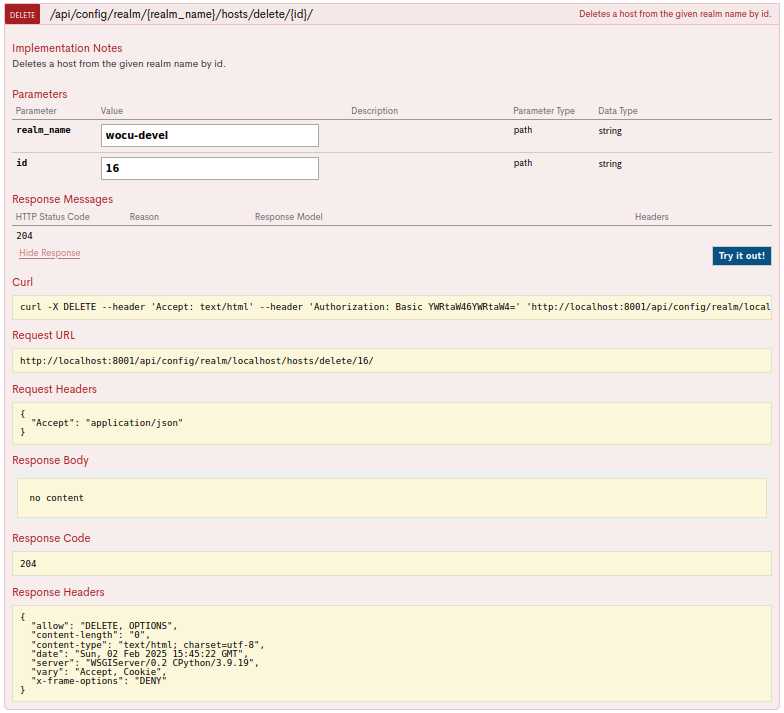
New endpoints for host removal
Two endpoints have also been added to allow the deletion of hosts, using as reference the realm name or IP address of the Import Tool, together with the identifier of the host to be deleted.
Host removal using the realm name:
DELETE /api/utils/wocu-delete-host/realm/{realm_name}/host/{host_id}/
Host removal using the IP address of the Import Tool
DELETE /api/utils/wocu-delete-host/import-tool/{import_tool_ip}/host/{host_id}/
When a request is made to these endpoints, the specified host shall be deleted immediately.
The expected outcome of a successful consultation could be the following:
Note
All endpoints described in this section may only be employed by administrators.
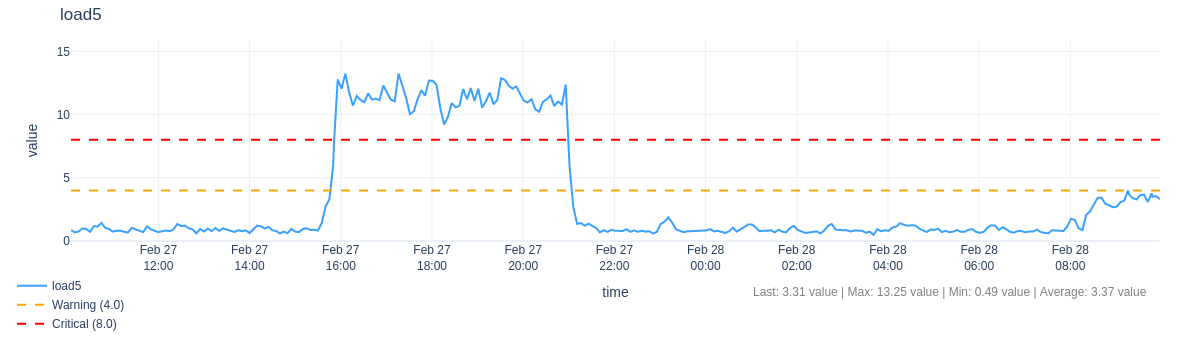
6. Improvements to mail notification graphics
Improvements have been implemented in the mail notification system, optimising the presentation of data and the visual appearance:
New graphics: The previous system has been replaced by a more efficient and visually improved one.
Greater clarity: The new data representation makes it easier to interpret the information sent.
Updated design: Notifications are now aligned with the new look and feel of the platform.
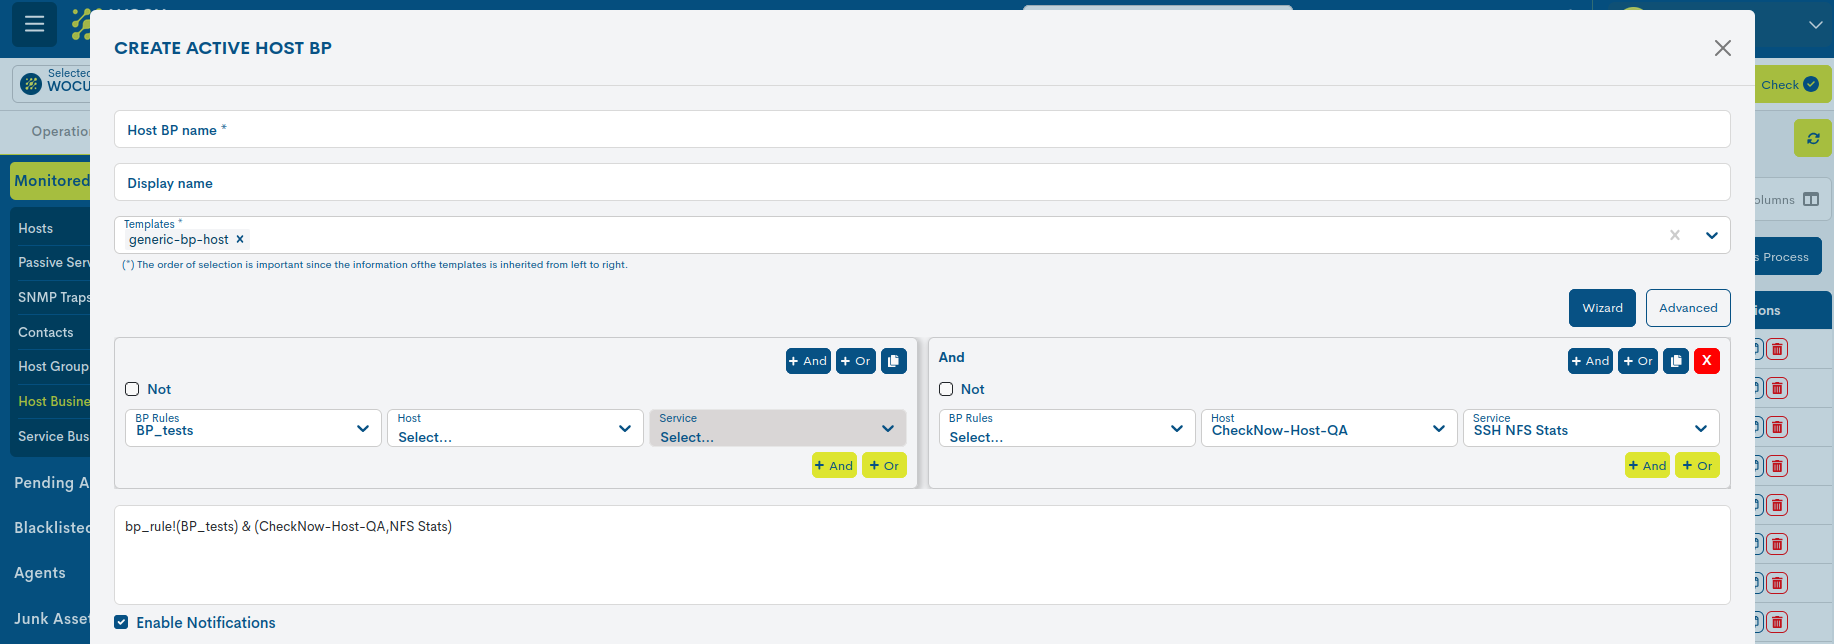
7. New Business Process creation interface.
A new interface for the creation of Business Process has been added in Configuration. When declaring the Business Rule, you canselect the Wizard option, which will display different boxes tochoose the hosts and services that will be part of the process
This new interface allows users to create Business Process in simpler and more visual, with a graphical representation of theelements and relationships that make up the process.
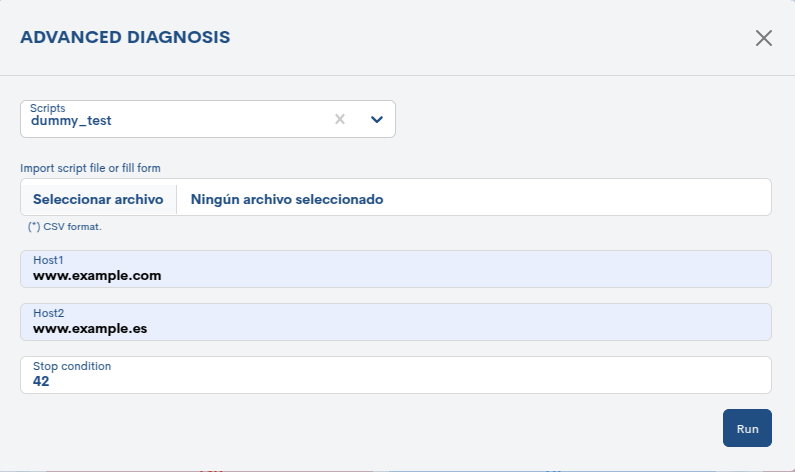
8. Execution of custom scripts
The ability to run custom and/or client-specific scripts has been incorporated within Wocu-Monitoring.
The ability to run custom and/or client-specific scripts within Wocu-Monitoring has been incorporated. This functionality allows launching such scripts individuallyfor a specific device or massively using a CSV file with multiple devices.This facilitates the automation of diagnostic, configuration or information gathering tasks in monitored environments.
Monitoring Packs
Cloud Meraki
New packs have been created to monitor the Meraki Cloud. Go to Meraki Cloud for more information.
meraki-v1-appliance
The services offered are:
Perfscore: Gets the performance score of Meraki Appliance (MX).
Power Modules Status: Gets the status of the power supply modules of the Meraki (MX) device.
Status: Check the status of the Meraki Appliance (MX)
Uplink Status: Checks the link status (uplink) of the Meraki (MX) device.
VPN Status: Check the VPN status of the Meraki (MX) device.
meraki-v1-switch
The services offered are:
Port Status: Check the port status of the Meraki switch. (MS)
Power Modules Status: Checks the status of the **Meraki Switch (MS) power modules
Status: Check the status of the Meraki Switch (MS).
Traffic by port: Checks Meraki Switch (MS) traffic by port
meraki-v1-wireless
The services offered are:
Clients: Gets the Meraki Wireless (MR) clients.
Status: Check the status of the Meraki Wireless (MR) device.
meraki-v1-network
The services offered are:
Alerts: Check Meraki network alerts.
Traffic: Check Meraki network traffic.
VPN Statistics: Get the VPN statistics of the Meraki network.
Events: Check Meraki network events
meraki-v1-organization
The services offered are:
Security Events: Gets the Organization’s security eventsMeraki
Linux SNMP conntrack and Linux SSH conntrack
Two new packs have been added to the catalog to monitor the use of the Conntrack of Linux.
Linux-snmp-conntrack obtains the information via SNMP, while Linux-ssh-conntrack does so via SSH. Both packs deploy a single service that displays the percentage of Conntrack usage.

Other improvements and repairs
Every new version is full of small changes, fixes and optimisations that should be briefly highlighted. We list the most notable ones in this release:
A new Passive Services table has been created in the Blacklisted Assets section of the Importing and Configuring Assets module. In addition, a new action has been created that allows Passive Services to be sent to Blacklisted Assets from the Passive Services table in Pending.
The button to apply mass actions has been disabled if there is no item selected.
Fixed a bug in the legend of the widget Tops 5 Hosts duplicated by IP when exporting as pdf.
Removed backups message when deleting a host that does not have gconf.
Improved display of Global view Status in different resolutions.
Fixed a bug in the Metrics Evolution report where the correct hosts were not displayed when choosing a hostgroup.
A new type of events called Engine Events has been added to the Monitoring Events page which refer to relevant events in the Monitoring Engine, such as that Monitoring Notifications have been globally deactivated or that a new Monitoring Configuration has gone live.
The functionality of the Check Now Action on the Hosts and Services pages has been improved.
Upgraded software
As always, other pieces of software have been incorporated and updated in this new version of WOCU-Monitoring:
Software |
Previous version |
Current version |
Remarks |
|---|---|---|---|
haproxy |
None |
2.9.10 |
|
wocu-agents |
None |
1.0.0-1 |
https://docs.wocu-monitoring.com/es/docs/setup/4_12_agent.html |
About WOCU-Monitoring
WOCU-Monitoring is a multi-purpose monitoring tool that integrates the latest Open Source technologies for monitoring, visualisation, metrics plotting and log management, providing a wide visibility on the status and availability of network elements, servers, databases and workstations (among others) using customised Monitoring Packs.
In addition to the Free version, the WOCU-Monitoring version called Enterprise allows deployments of thousands of IP devices, in a distributed environment, with customisations tailored to each customer’s infrastructure.