WOCU-Monitoring Interface
Top Menu
The WOCU-Monitoring top bar, identified by its dark background, brings together a set of informative and quick-access options available throughout your navigation of the tool.
As it is a fixed element of the interface, it remains visible on the different screens of the application, allowing the user to consult or access the following options at any time:

The following are its main components in order of presentation:presentation:
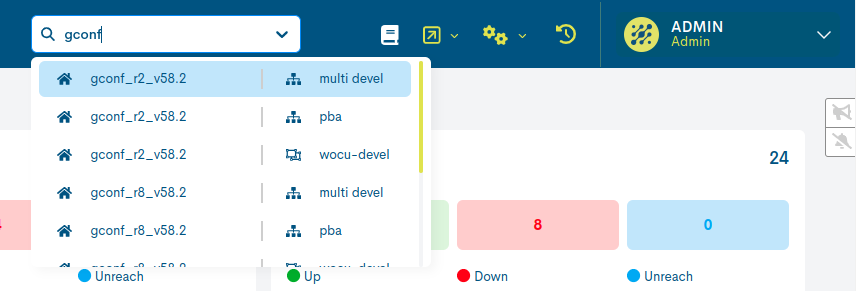
Global hosts finder
The top bar includes a global search function to locate a specific Host among all the Realms managed in the application. When selecting or searching for the desired item, the user is automatically redirected to its own detail view to continue with its management and monitoring.

The global search engine allows several search options:
Manually entering the name of the Host of interest.
Via the available selector: clicking on the date (V) displays an initial list of the first ten Hosts. Asyou scroll down the list, it will be updated with new items.
For each element is indicated:
Type and name of the Host | Type and name of the Realm in which found.
Documentation
By choosing this option, the user will be redirected to this document: WOCU-Monitoring Technical Documentation.
Useful links
This space allows the user to include a list of configurable links.
The top menu remains always visible, making it an ideal place to include access to resources frequently used in daily operations.
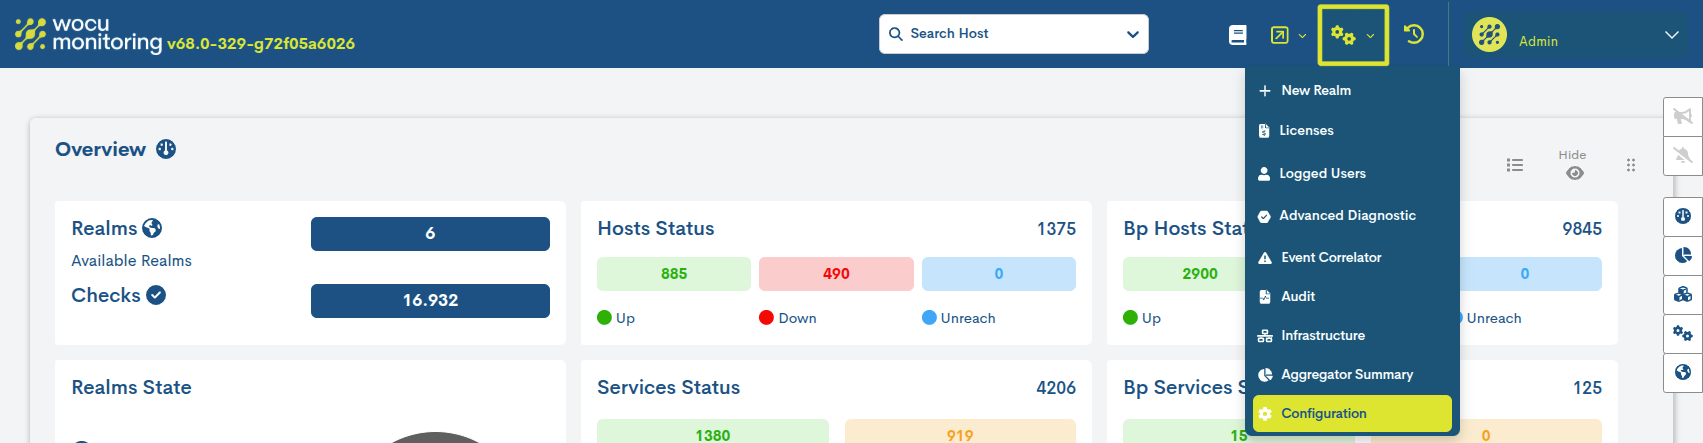
Settings
This dropdown menu includes the following options:
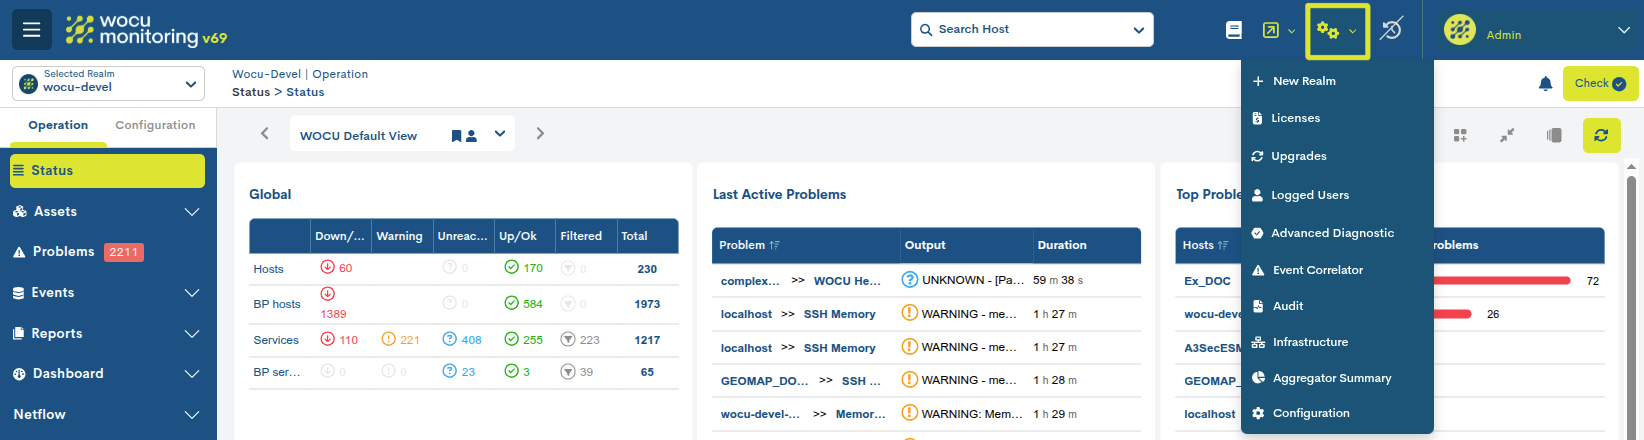
New Realm
By choosing this option, the user will be redirected to the registration form for a new Realm that will become part of the monitored monitored technological infrastructure.
More information in: Creation of Realms.
Licenses
Purely informative view with updated data on the licence contracted.
The Administrator shall be able to monitor the status of the licencein force, know the days remaining for its renewal or other particularities of the licence.
This information shall be displayed in the following tabular format:
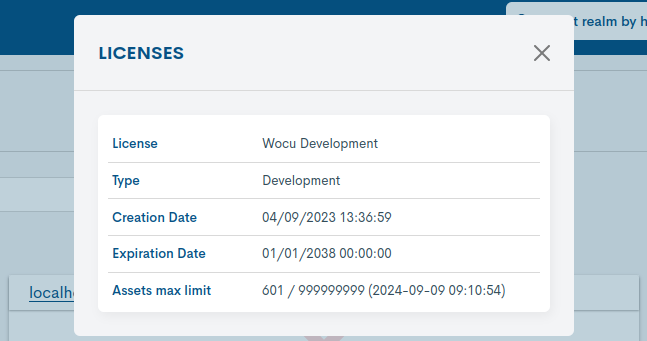
License: identifying name of the contracted licence.
Type: details the type of licence in use. The licences that currently provided by WOCU-Monitoring are:
Silver
Gold
Platinum
Prepod
Demo
You can find out more about the specifics of each of them here.
Creation date: details the exact date and time the licence was created.
Expiration date: details the exact date and time of expiry of the licence.
Assets max limit: this column records the total number of monitored assets (Services, Hosts, and Business Processes) across all registered standard Realms, compared to the total number of assets available in the contracted license. This indication is purely informational; no restrictions are implemented.
Attention
Each type of licence has its own specific characteristics and terms, so for your review contact our Commercial Team.
Upgrades
This view centralizes information related to product versioning, without the need to manually review documentation or contact support.
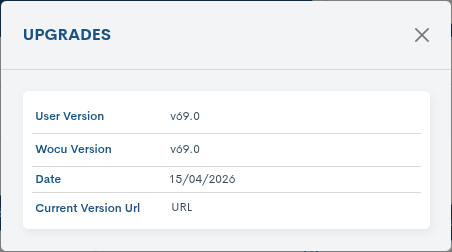
When you access this option, a window appears with the following information:information:
User version: version currently deployed on the user instance.
WOCU version: Latest official version of WOCU-Monitoring.
Date: publication date of the latest available version.
Current Version URL: Direct link to the changelog of the latest version published, accessible in the Official Documentation of WOCU-Monitoring
This section provides a centralized point from which to view the new features included in each version and access the consolidated product change history.
Logged Users
This window allows you to view in real time a detailed list of the users who have an active session in WOCU-Monitoring.
This information is available **exclusively to users with the Administrator” role, who can monitor how many users are using the system at any given time and the identity of each one of them.
Its purpose is to facilitate the verification of current user activity, control the existence of simultaneous sessions of the same user, and confirm system access times.
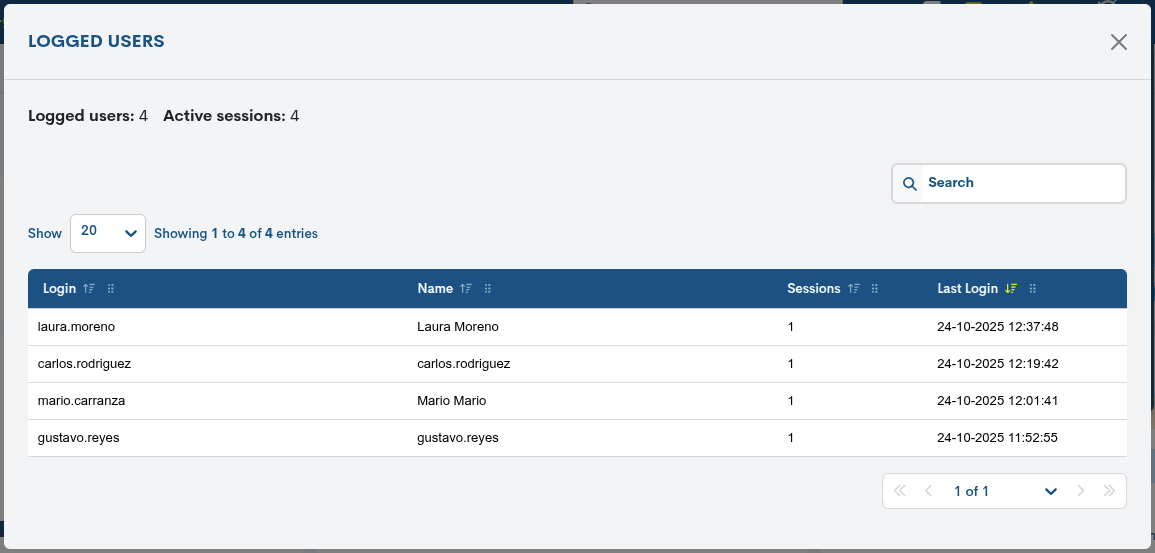
The window displays a table with the following fields:
Login: Displays the username used to log in to the system.the system.
Name: Enter the full name of the registered user.
Sessions: Shows the number of active sessions the user has at that moment. Generally, each user is expected to have only one session open.
Last Login: Indicates the exact date and time the user started their most recent session.The format used is
DD-MM-YYYY HH:MM:SS.
Additionally, two indicators are displayed at the top of the window:indicators:
Logged users: total number of users currently connected.
Active sessions: total number of active sessions on the system.
Advanced Diagnostic
WOCU-Monitoring offers the possibility to load and execute scripts previously loaded into the system by an Administrator. From this section, the user can select and execute available scripts from easily.
Each time this section Advanced Diagnostic is accessed, the system automatically performs a reload process that detects any changes in the script set (new additions, updates or deletions). This process is completely transparent to the user and does not require any manual action.
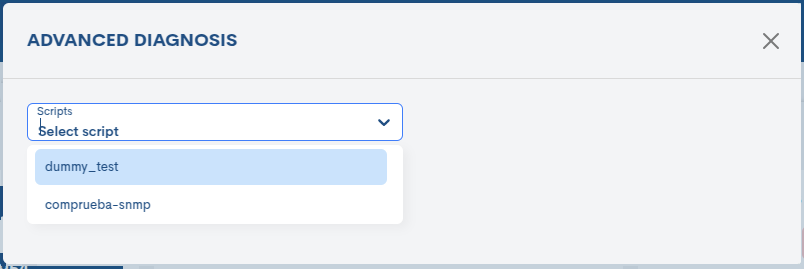
After selecting a script from the list, specific configuration fields will appear. These fields are previously defined by the Administrator. More information can be found in Execution of scripts.
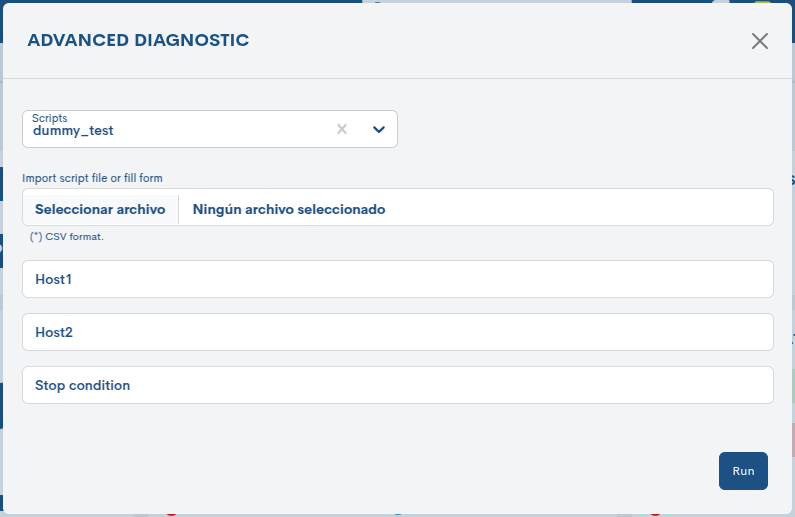
Additionally, a file selector will appear that allows the upload of a parameter file, in CSV format. More information at: Execution with file-loaded parameters.
Note
For a detailed description of the complete process of loading, detecting and executing scripts, see section: Execution of scripts.
Event Correlator
Independent module whose function is the prediction of massive failures of monitored devices that share a common property, defined by the assignment of tags.
The system is based on the definition of rules that allow establishing associations between devices and applying thresholds based on a minimum percentage of devices down during a specific time period. When these conditions are met, the module automatically generates a mass failure event and notifies the relevant users, facilitating an early response and proactive incident management.
More information in: Event Correlator.
Audit
Independent module for the detailed logging of actions executed in WOCU-Monitoring, tracing all movements performed in terms of asset configuration and changes tracked by the system, with the purpose of making a subsequent audit of the processed the information processed.
More information in: Audit.
Infrastructure
Interactive and informative module that encapsulates and traces the various elements/nodes that WOCU-Monitoring has deployed at the time of the query.
This functionality provides a comprehensive and correlated overview of the different components that make up the network infrastructure monitored, being a tool of great help for administrators of the solution.
More information in: Infrastructure.
Aggregator Summary
It is a space designed to provide a comprehensive view of the monitored infrastructure according to the nature, connectivity, and configuration of realms and member assets at the time of the query.
This module stands out for its ability to translate the complexity of the infrastructure into clear and intuitive sectoral graphics, greatly simplifying the interpretation of key data.
More information in: Aggregator Summary.
Configuration
Clicking on this option will take you to the advanced module WM Console Admin, the epicenter of many advanced WOCU-Monitoring functions. It is possible to perform and establish more deep configurations of the elements that make up the monitored technological infrastructure, although it requires greater technical knowledge on the part of the user.
Attention
To access this configuration module, you need to enter the access credentials authorised by your Administrator.
Once the option is selected, a new browser window will open, giving access to the advanced module, where the different the different elements, services and functions available for, among other actions, to set the advanced parameters of the monitoring tasks monitoring tasks carried out by the tool.
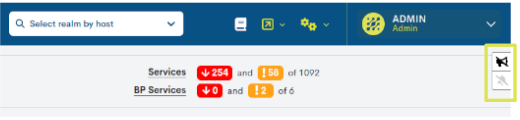
Auto-refresh screen
WOCU-Monitoring enables the automatic update of the data displayed on the screen.
By clicking on the auto-refresh icon (🕐) it is possible to activate or deactivate the repeated reloading of the page. Note that when switching the autoscreen refresh, this icon will change depending on the status:
Auto-refresh disabled

Auto-refresh enabled

Note
It is possible to consult the remaining time for the next refresh of the screen, by placing the cursor over the icon. By default, the length of the time interval between refreshes is 60 seconds, and you can define a new sequence from the User preferences.
User Menu
This dropdown menu includes the following options:
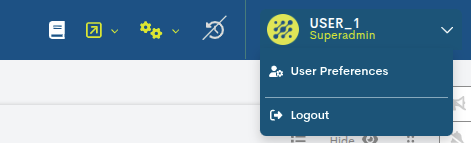
User preferences: Selecting this option will open a window specific for customizing certain aspects of viewing, managing, and filtering a variety of WOCU-Monitoring elements.
Logout: Option to disconnect or log out of the system.
Notification options
Only in the Home, we find the notification options:
✓ Top option, with a speaker icon enables and disables notifications via a small pop-up window.
✓ Bottom option, with a bell icon enables and disables audible notifications.
The background colour of each icon indicates the status of each option, green: enabled, dark grey: disabled. You can enable/disable these options by clicking on the corresponding icon.