Top Events Reports
The Top Events report allows the user to extract different types of data from one or more data sources. WOCU-Monitoring collects and groups the most frequent events from these sources, providing a consolidated view of the activity recorded in the monitored environment.
This report only shows events related to changes in availability status, specifically UP and DOWN events, which indicate respectively the recovery or failure of the monitored devices.monitored devices.
In short, the report facilitates the consultation of events generated by WOCU-Monitoring in relation to managed assets, allowing the identification of which devices have a greater or lesser number of recorded incidents and focusing the analysis on the most relevant events for infrastructure availability.
The following details the process for creating and running reports, establishing a series of filters and parameters customized by the user.
Configuration and generation of Top Events reports
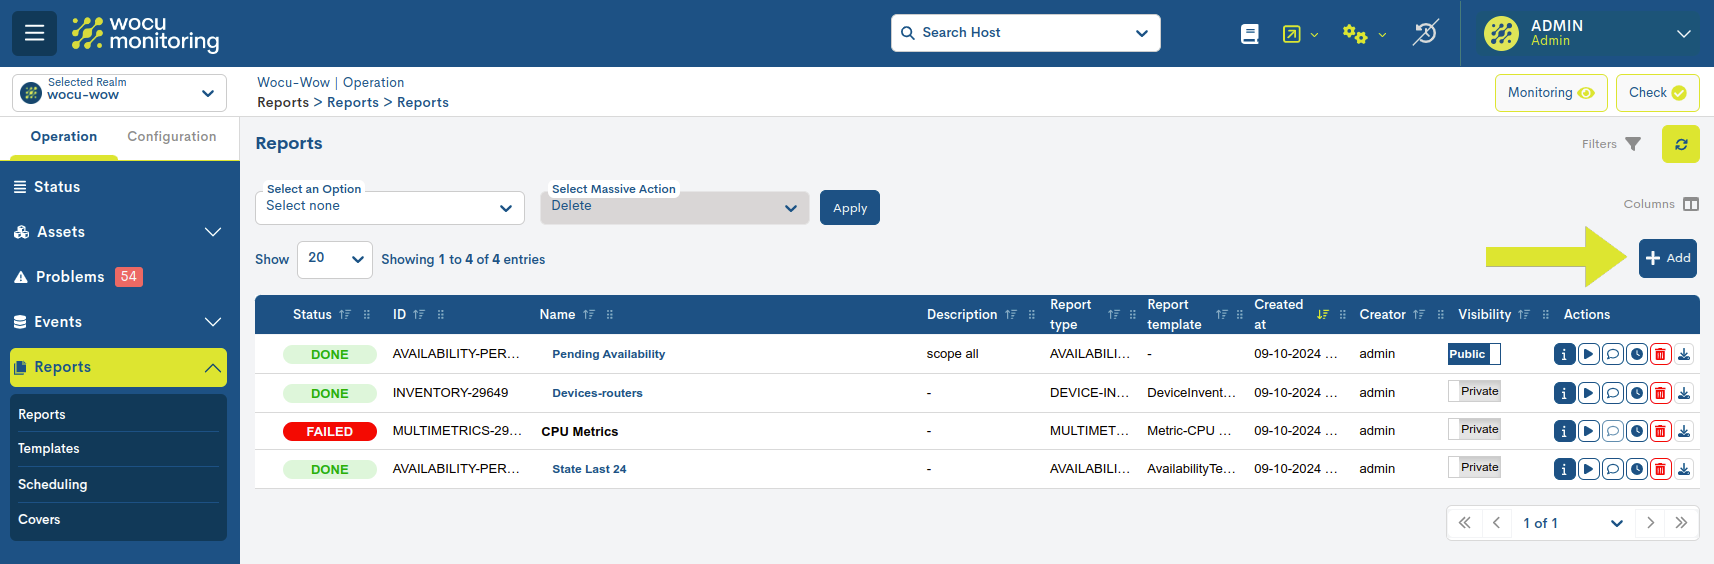
Generally, when creating reports, the user should access the blue + Add button, located within the Reports section.
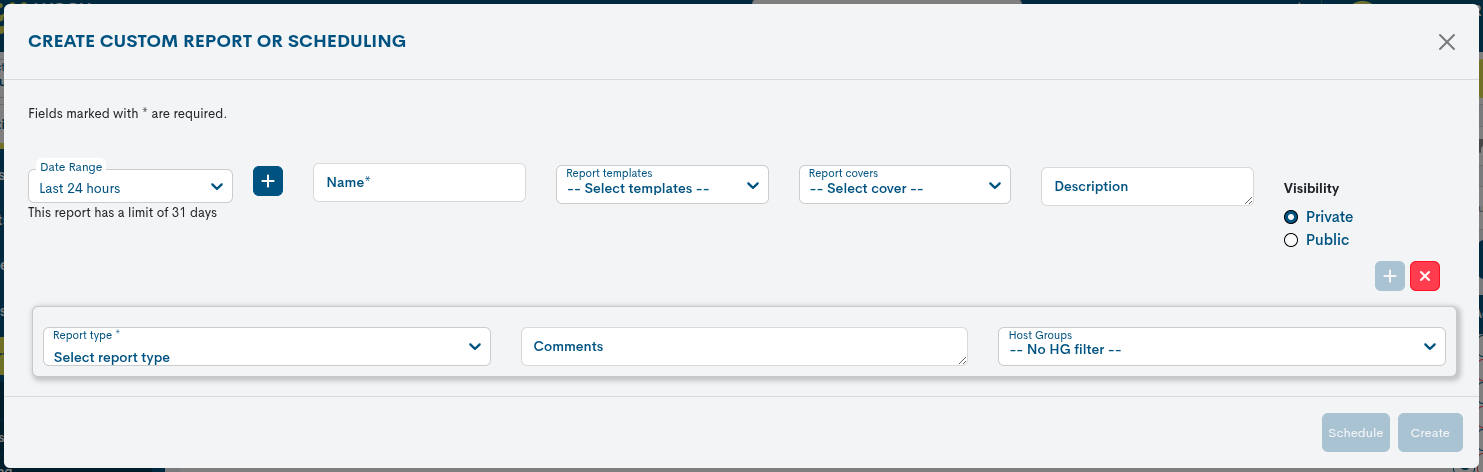
Before generating the report, you will need to configure a series of parameters described below:
Date range
This parameter establishes the time period for which the Availability calculation will be performed.
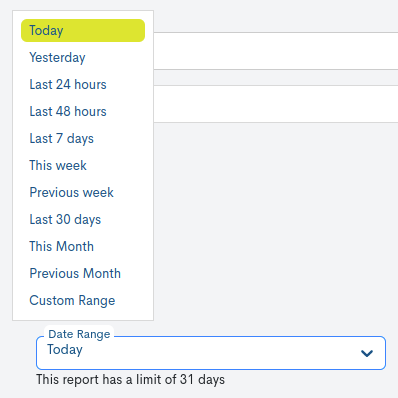
There are a number of time criteria already in place:
Parameter |
Description |
|---|---|
Today |
Filters and displays only data recorded during the time period that elapsed today. |
Yesterday |
Filters and displays only data recorded yesterday. |
Last 24 hours |
Filters and displays only data recorded in the last 24 hours. |
Last 48 hours |
Filters and displays only data recorded in the last 48 hours. |
Last 7 Days |
Filters and displays only data recorded in the last seven days. |
Last 30 Days |
Filters and displays only data recorded in the last thirty days. |
This Week |
Filters and displays only data recorded during the time period elapsed in the current week (from the start day of the week to the current day). |
Previous Week |
Filters and displays only data recorded in the previous full week (Monday to Sunday). |
Last 30 days |
Filters and displays only data recorded in the last 30 full days from the current date. |
This Month |
Filters and displays only data recorded during the time period elapsed in the current month (from day 1 to the current day of the month). |
Previous Month |
Filters and displays only data recorded in the previous full month (day 1 to days 28/30/31). |
If you want to define a specific time period, you can use the Custom Range option. To configure the time range, you must specify a start and end date. Clicking on a day will select it and highlight it with a blue background. In addition to the date, you can specify a specific time within that day using the drop-down menus for hours, minutes, and seconds, until you reach the exact moment you want. The selected date and time will be displayed in both the upper and lower boxes of the view.
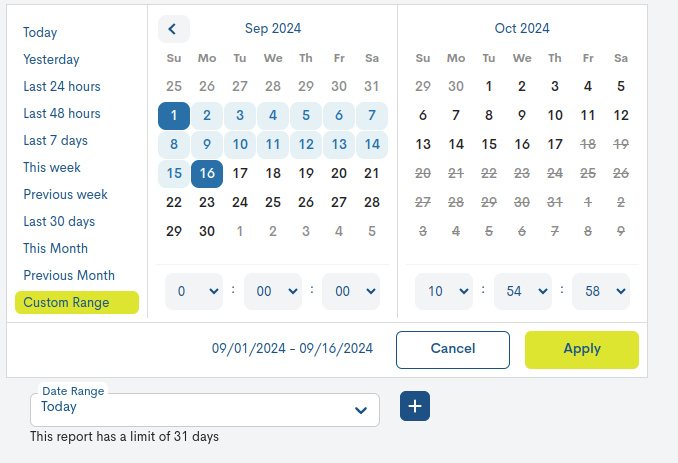
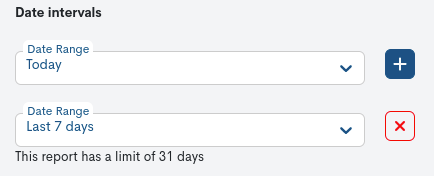
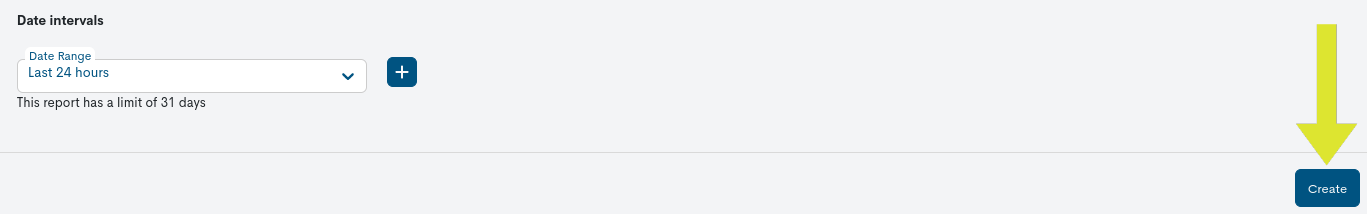
Using the plus sign (+) button, you can add multiple date ranges for data collection in the configured report. If you want to delete one, simply press the red button with the cross (X). The range will disappear, and when you run the report, only the remaining periods will be taken into account.
Attention
Logically, it is not possible to choose start and end dates later than the current date, or to set an end date earlier than the start date.
Name
Required field to record a report identifier term.
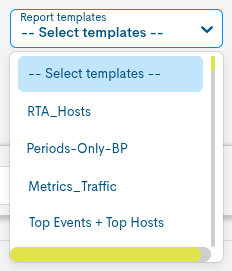
Report Template
In this optional field, the user can select the template they wish to apply to the report. Templates are pre-created and available for reuse during report configuration. More information can be found at: Templates.
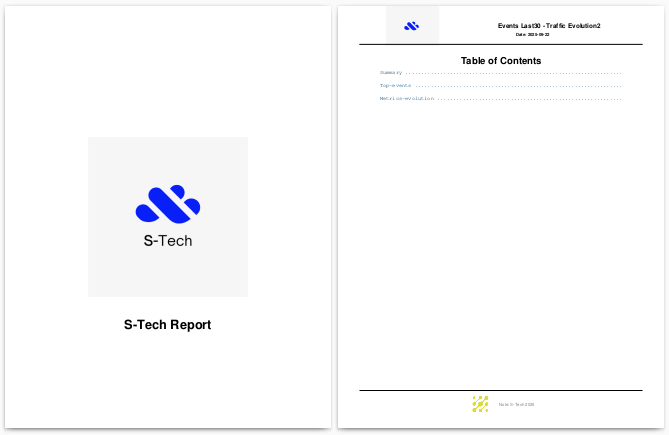
Report Covers
In this optional field, the user can choose a predefined cover for the report. This includes a cover image, a header on the pages, a main title, and a footnote. This gives documents a corporate and professional appearance, tailored to the organization’s visual identity. More information can be found at: Covers.
Description
Optional field where the user may include descriptive text relating to the report.
Visibility
In this field, the user will determine whether the report will be visible to other users (i.e., a public report, Public), or whether it will be private and visible only to the report’s creator (Private).
Report Type
In this drop-down field, the user must select the type of report he/she wishes to create, in this case Top Events.
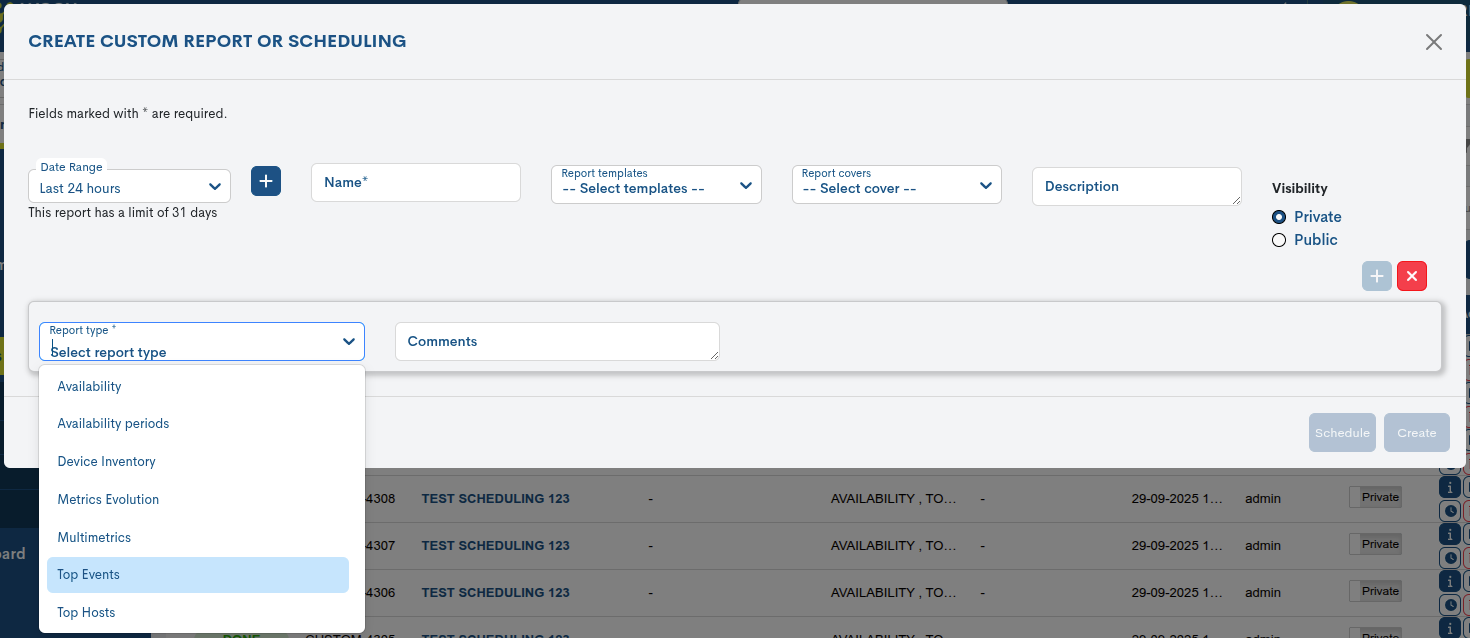
Note
Depending on the type of report selected, new fields to be defined will be automatically included.
Host Group
This configuration parameter allows filtering of the data collected and reflected in the report, showing only those datarelating to the Host Group existing in WOCU-Monitoring.
Simply choose the group name from the Device Group (Host Group) dropdown. All groups registered within the realm will be displayed.
To deactivate the filter, the user must choose the No HG filter option, which appears first in the list.
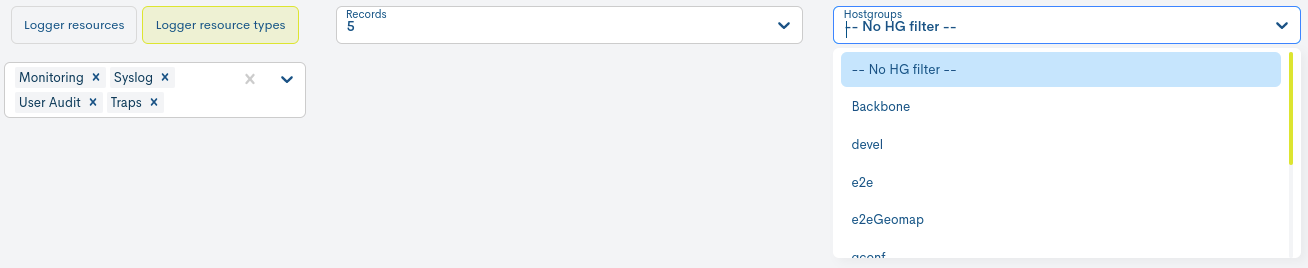
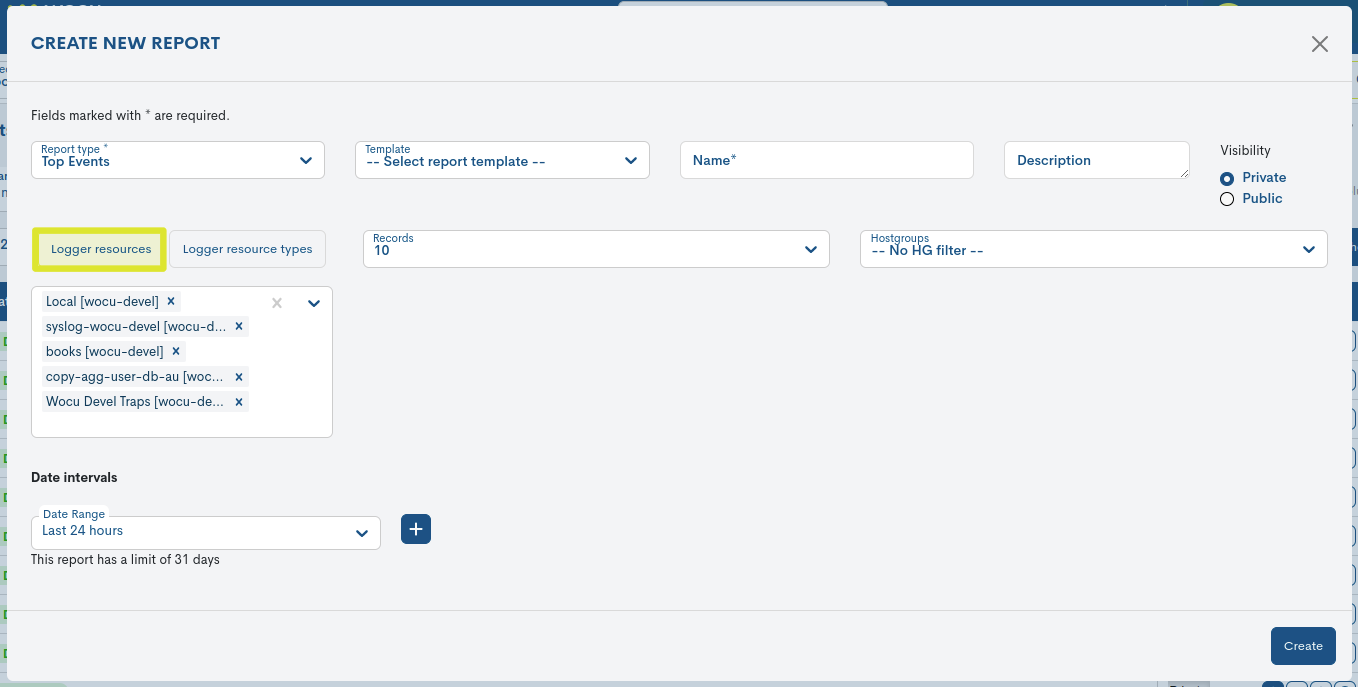
Source Selector
By selecting one of the two options in this menu, Logger Resources and Logger Source Types, you can select which data sources will be used to generate the report.
Logger resources are various data sources and event histories that report on the operational status of monitored devices registered with WOCU-Monitoring.
Logger resource types are groups of Logger Sources (Logger “”resources) created and configured in WOCU-Monitoring with the goal of “”collectively displaying similar data from different log sources.
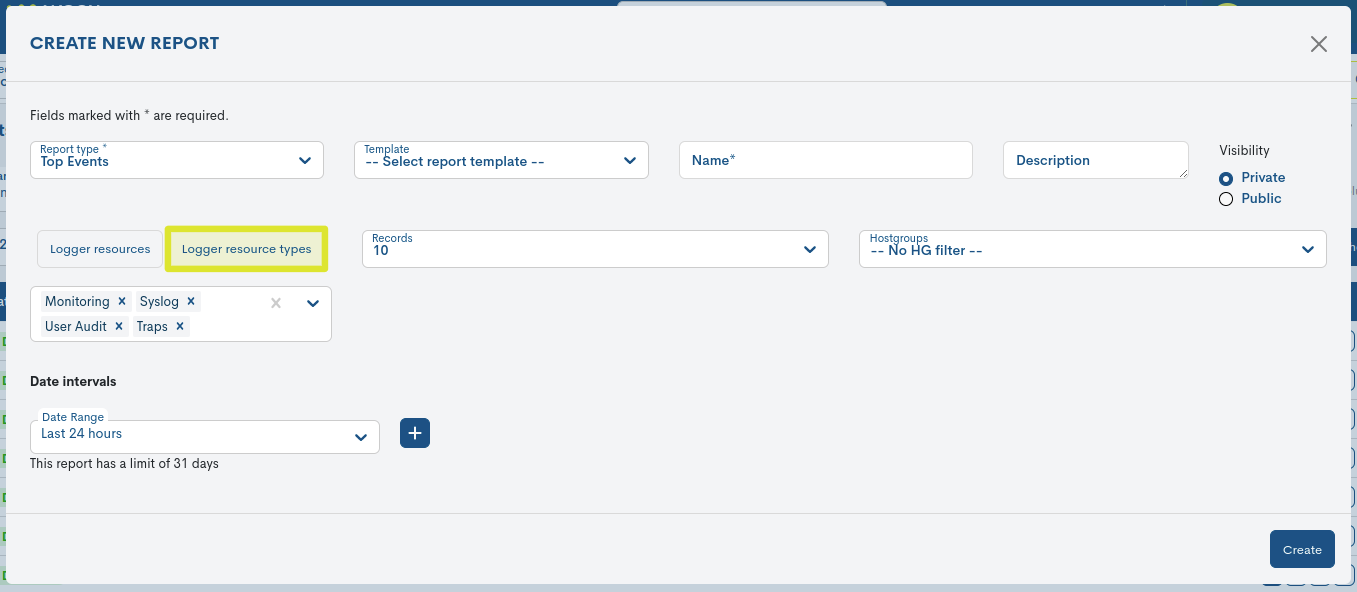
By clicking the corresponding buttons, Logger resources and Logger resources types, you can alternate between the two options. The selected option will be highlighted in blue.
Once you select the Logger Resources or Logger Resource Types option, a list of all available sources will be displayed.
Sources are presented in the form of identifying tags that include the source name and realm in brackets (for example: Local [wocu-devel]).
If you want to remove a selection, simply click the “X” icon to the right of the font name.
Important
Logger sources and Logger source types are created and configured in WOCU-Monitoring by your Administrator.
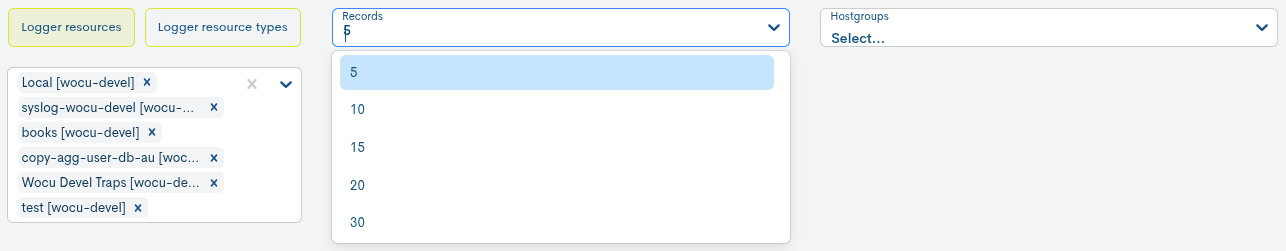
Items to display
This option allows you to select the number of records to display in the report using the drop-down menu. You can select a limited number of results (5, 10, 15, 20, or 25 records).
To save the configuration and generate the report, click on the blue blue Create.
Once the report has been created and scheduled, you will be taken back to the initial screen of this section, where the reports will be sequentially stacked in the Centralized Report Management.
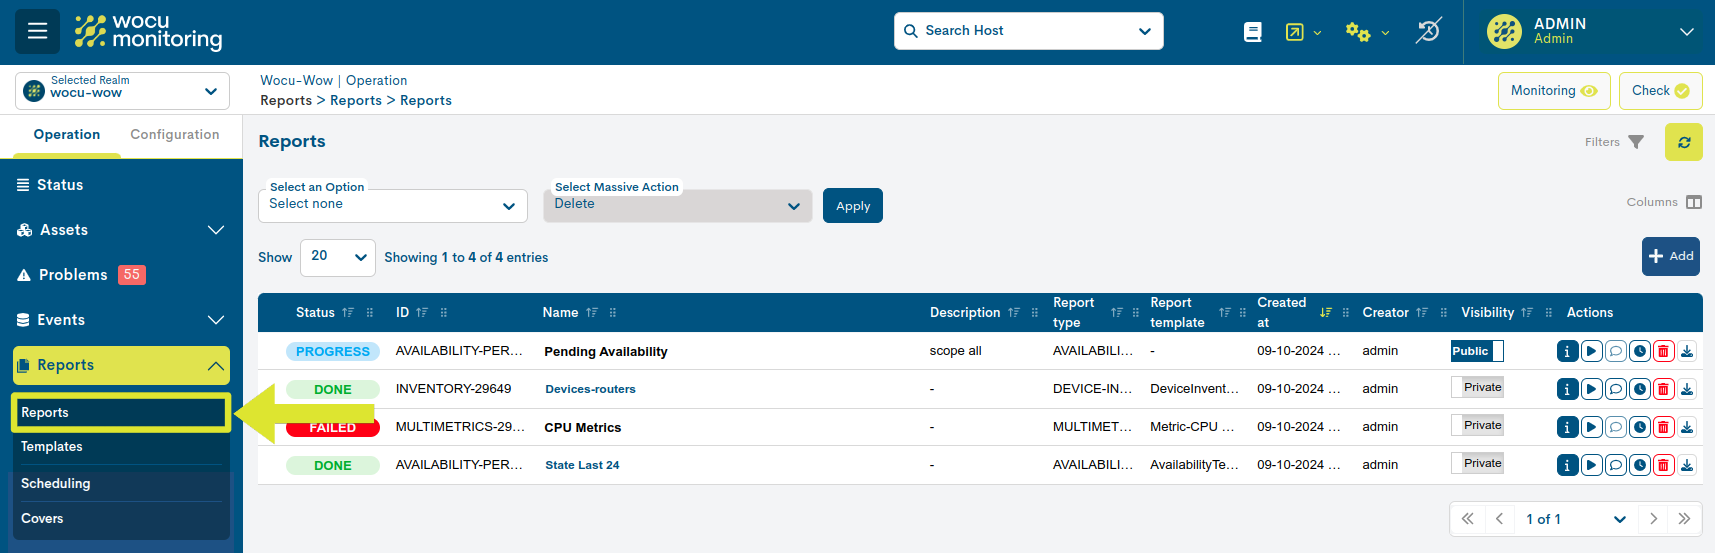
Click on the Name to access the full report. The user is then taken to a new report window where the information generated and collected by the system is presented. These panels are described in detail in the next section.

Setting up a multiple report
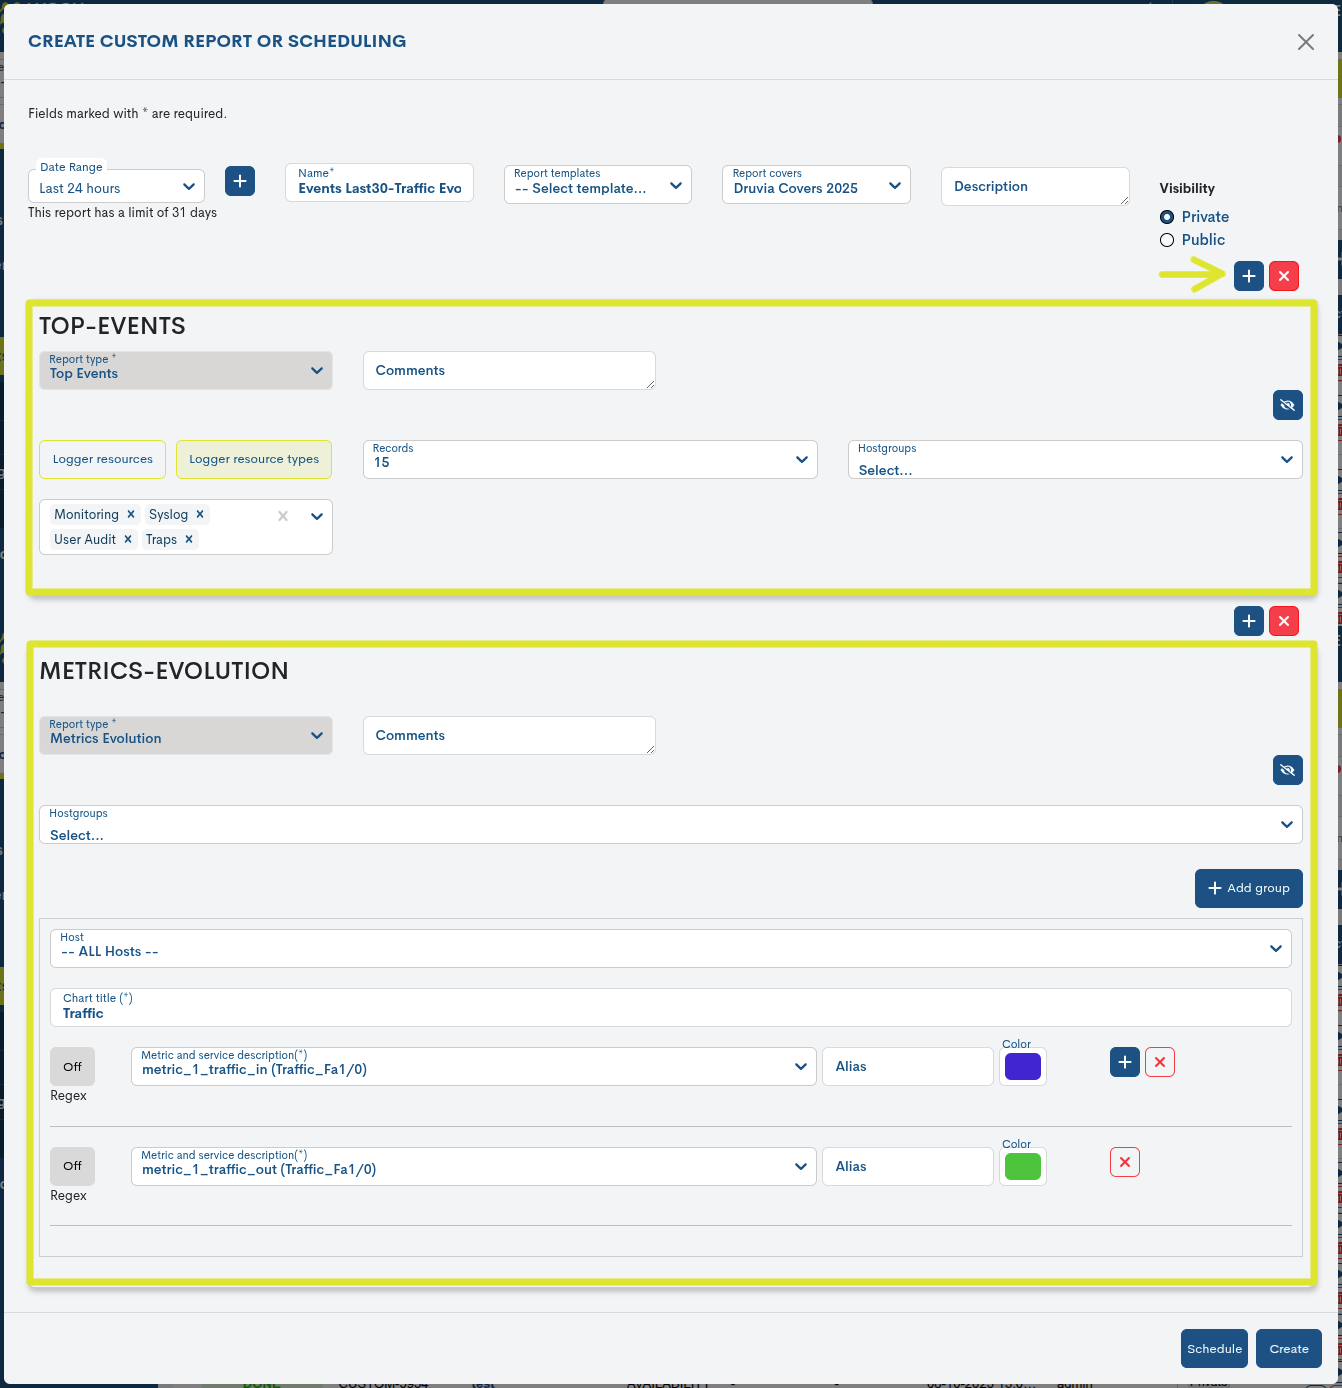
WOCU-Monitoring allows the creation of multiple reports in a single operation. This allows the user to define several reports of different types from a single configuration form.
The operation is simple and intuitive. Once the user selects the first report, the system enables the + button in the upper right corner of the configuration form. Clicking this button displays a new form for defining another report.
Attention
The system supports the combination of the seven types of reports available, as long as they are of different types.
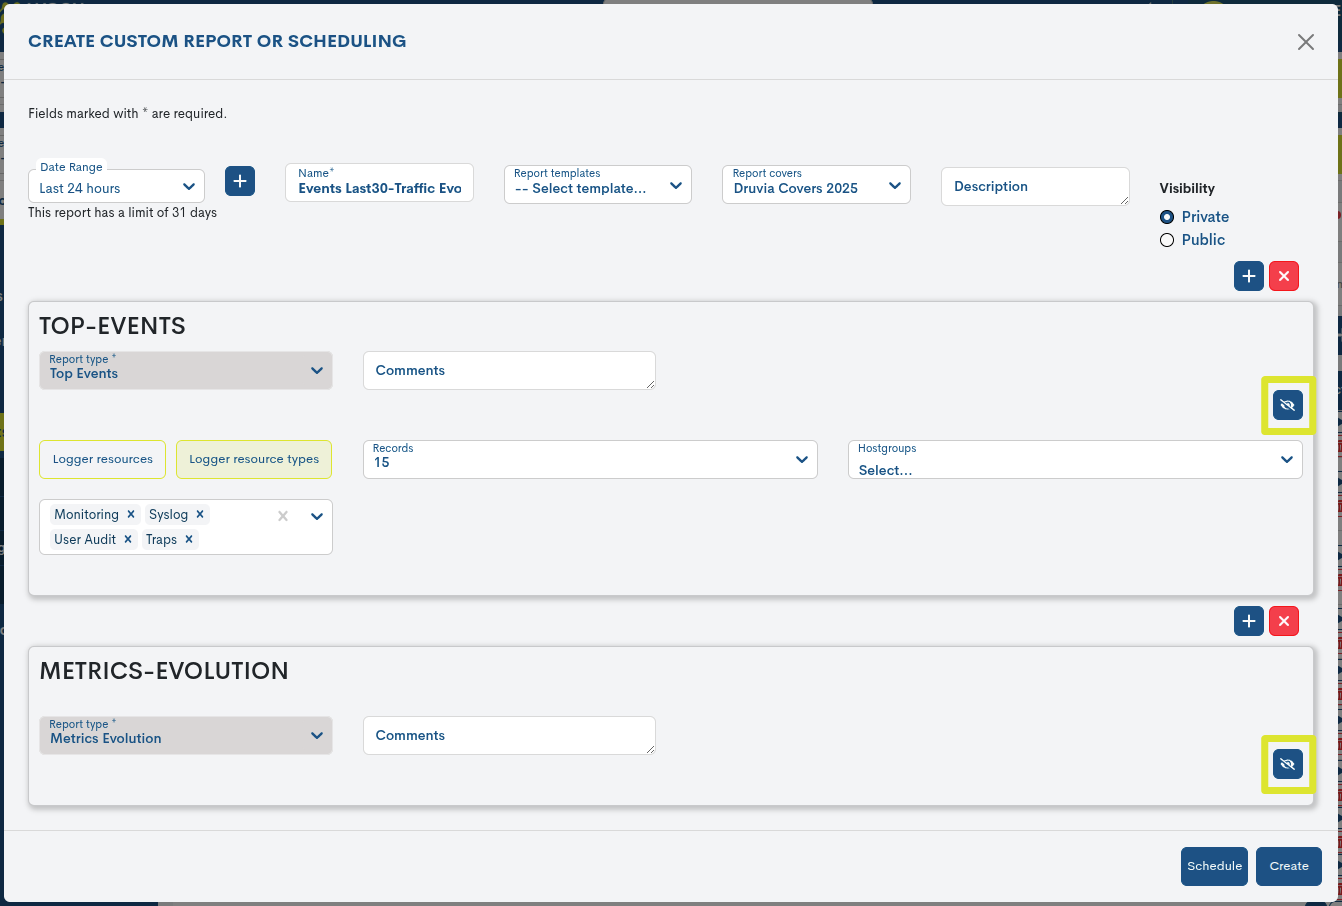
If a report is to be deleted, the user can use the x button, which deletes the previously configured settings.
Each configuration form includes a Hide Report Config button (identified by an eye icon with a diagonal line through it), which allows you to hide the corresponding configuration view and expand the available screen space.
See the following multiple report structured in two separate sections:
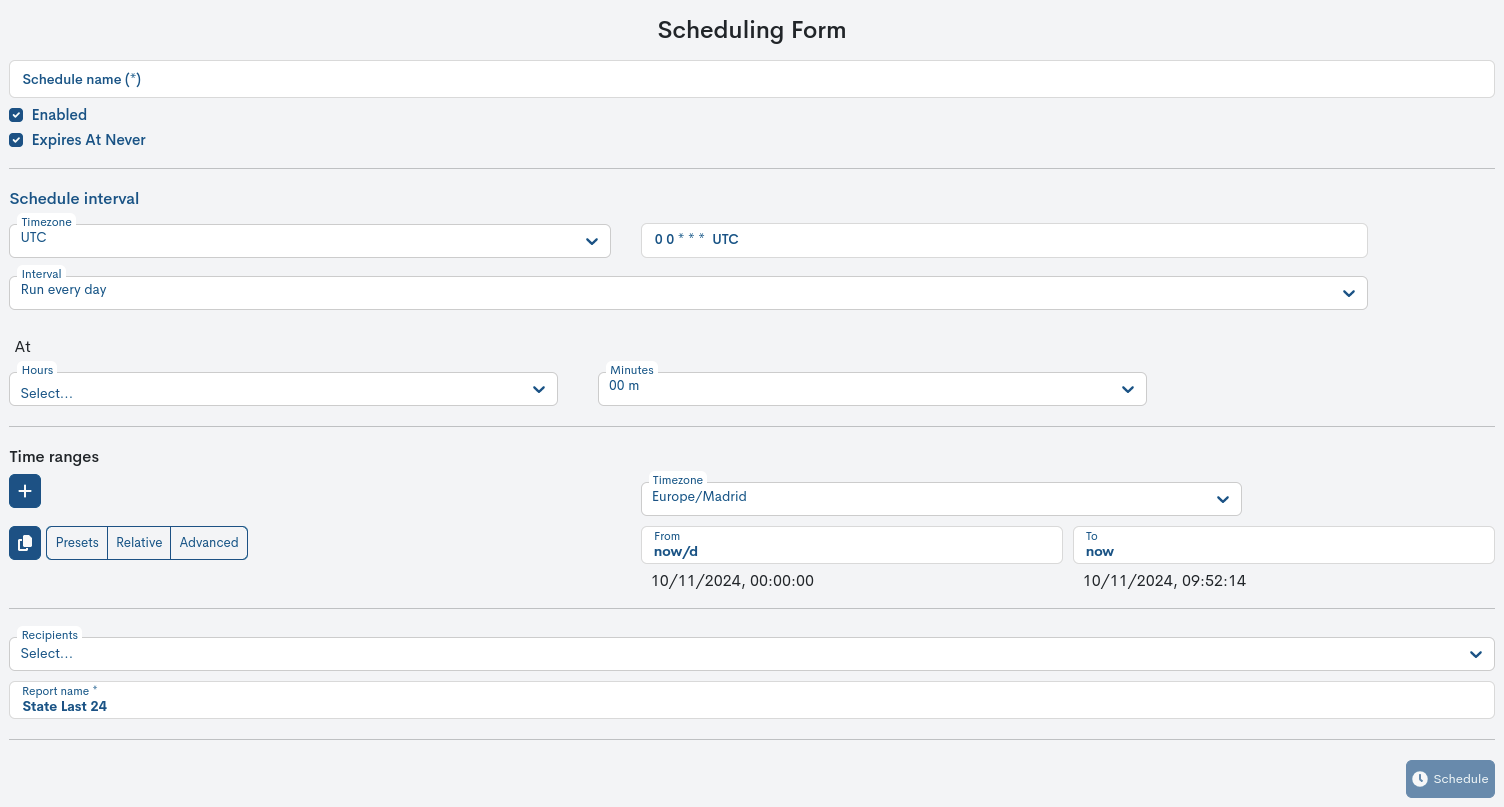
Scheduling of Top Events Reports
WOCU-Monitoring also allows for the automation of reporting operations, thanks to the ability to schedule their generation and launch at the user’s discretion using the Schedule button.

Next, a form will appear to begin setting up your schedule. **For more information, see the following section: Schedule.
Exporting Top Event Reports
WOCU-Monitoring also allows the report to be exported in PDF, XLSX, and JSON formats. These condense all the information on the availability of the monitored assets into a document that is easy to distribute and analyze.
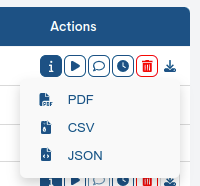
Through the Export selector located in the global report panel, the corresponding files shall be downloaded.
Important
WOCU-Monitoring will return an error message when the report scope exceeds a certain number of devices. The default number is 1,000 devices, but this number may vary depending on the environment and infrastructure being monitored.
Viewing and analyzing of Top Events reports
Clicking on the name label (column Name) takes you to the full report.
The report’s information is presented through interactive panels and graphs, designed to facilitate user interpretation.
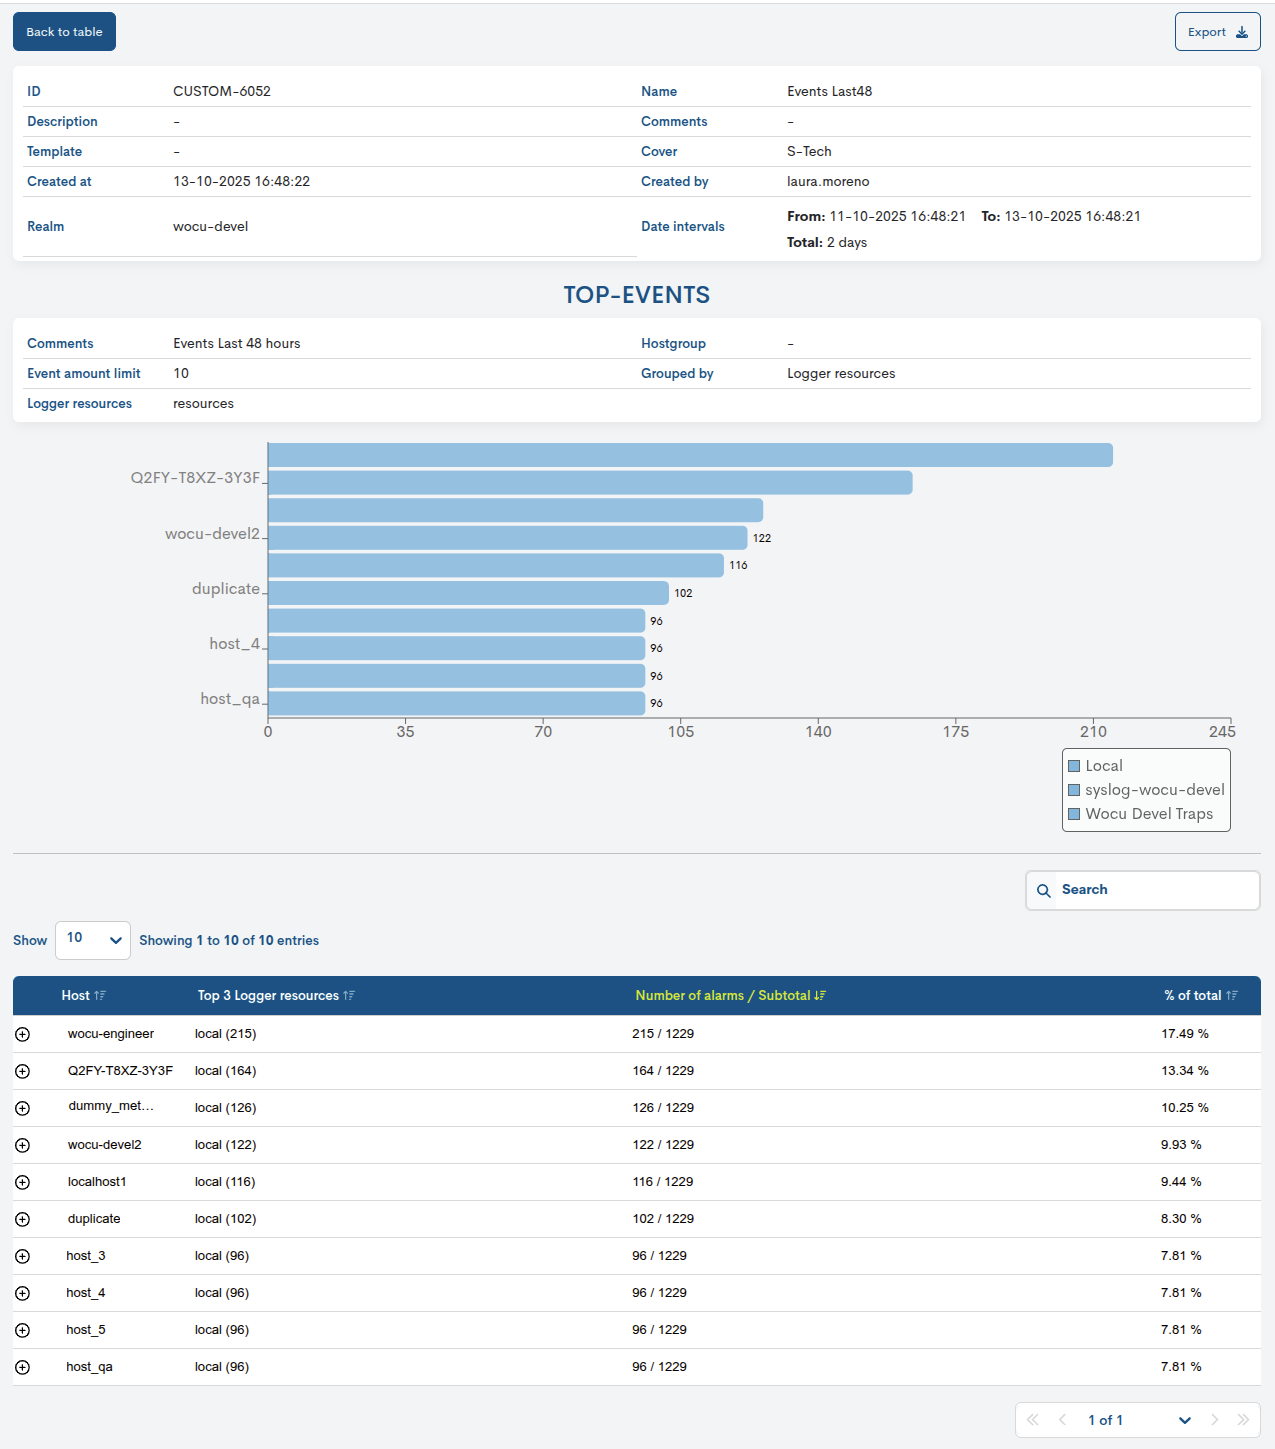
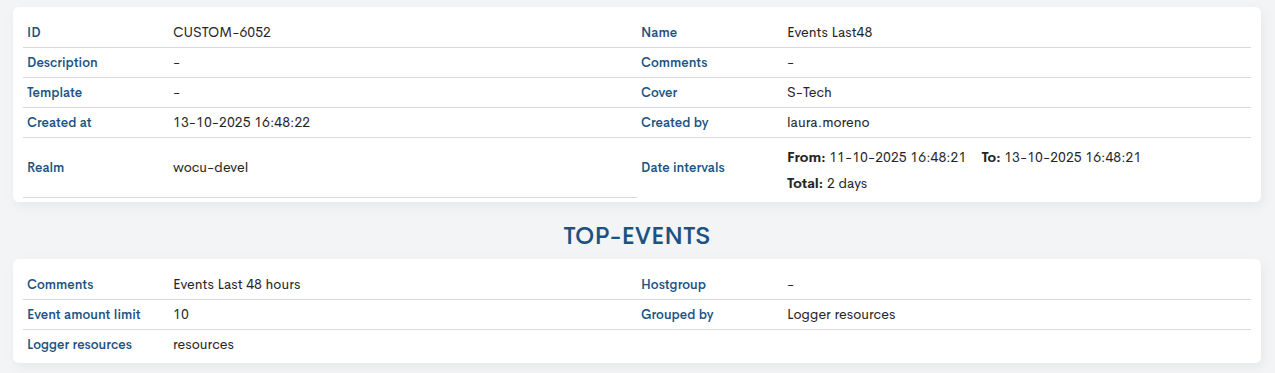
Settings panels
This configuration panel presents the filters and parameters set in the configuration of the generated report.
These are
ID: report identifier code.
Description: descriptive text relating to the report.
Template: Templates selected on which the report is based.
Create at: indicates the date and time the report was created.
Realm: indicates the name of the Realm which is the subject of the report.
Name: identification name assigned to the report.
Comments: Free text assigned by the user regarding observations, annotations, or additional clarifications regarding the report.
Cover: Specifies the Covers applied to the report.
Create by: indicates the user who created/owns the report.
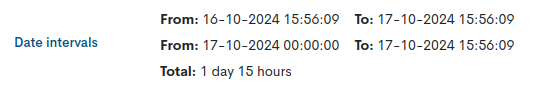
Date intervals: indicates start and end time and date of the reporting period.
In multiple time frames, periods will be presented in a tabular format. The total range limit is 31 days.
Comments: Free text assigned by the user regarding observations, annotations, or additional clarifications regarding the report.
Event amount limit: indicates the number of records to be presented in the report.
Logger resources: indicates the Logger Source(s) selected for collecting and grouping Events.
Hostgroup: Specifies the device group selected for the report calculation.
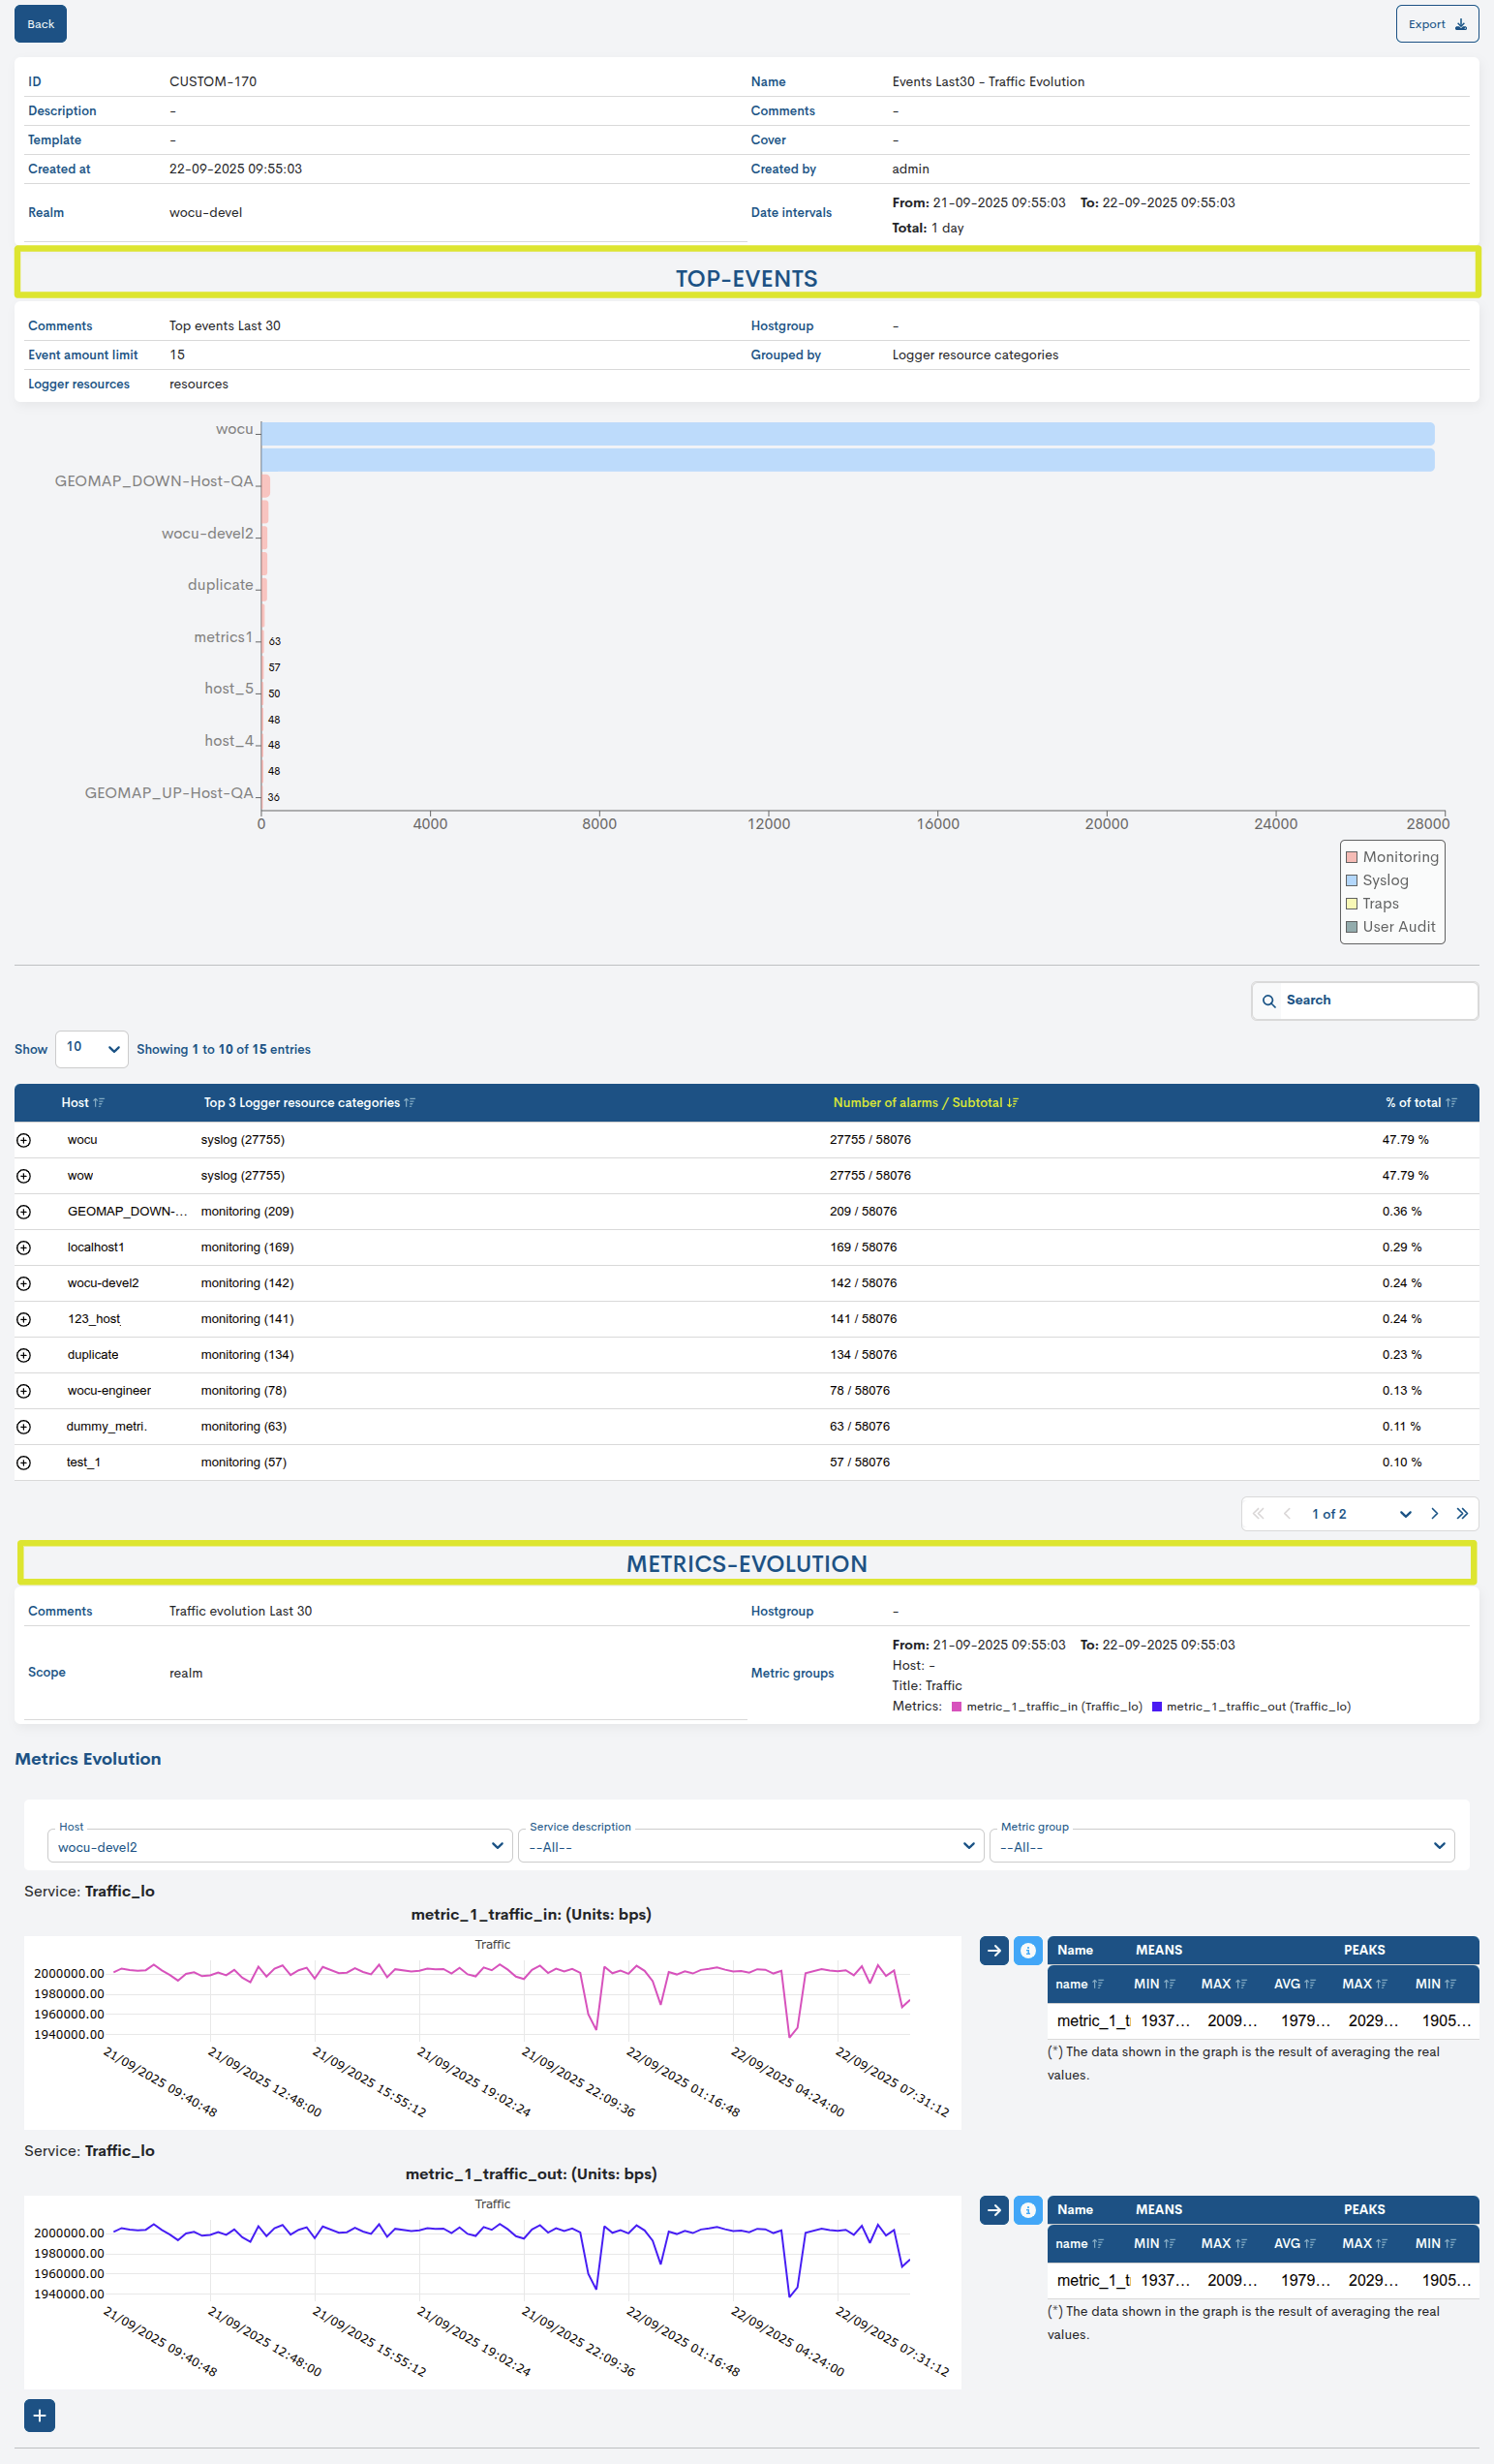
Overall Hosts/Events Chart
This overview chart visually reflects the ranking of devices with the highest number of events, collected by the data source selected for the report in the specified interval. The items displayed are ordered from highest to lowest number of events.
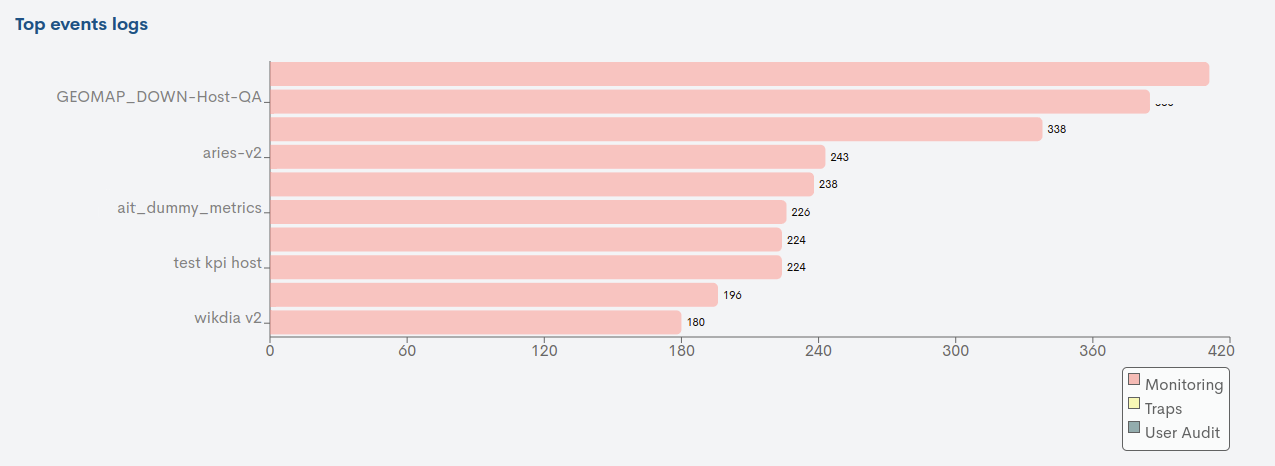
Each Host is named on the vertical axis of the graph, indicating graphically the volume of events generated by it. The horizontal axis expresses the scale, although the precise number of events generated by each element is reflected inside each bar.
In case several data sources are used in the report, different coloured bars will appear indicating, according to the legend (at the bottom right), which is the corresponding data source from which the events reflected in the graph originate.
By placing the cursor over each of the bars in the WOCU-Monitoring graph, additional information about the selected host will be displayed in a pop-up panel.
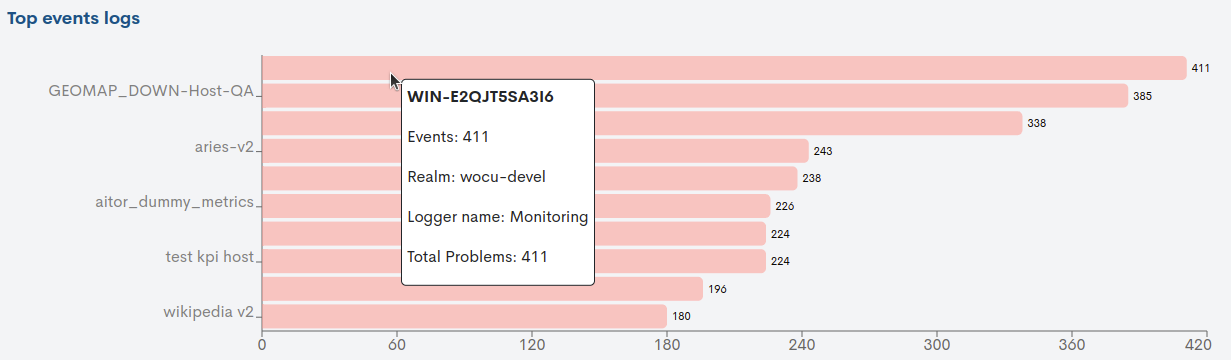
First, the device name will appear, followed by the number of events (Events) shown in this graph, the realm (Realm) to which the device belongs, the logger source (Logger name) from which the displayed events originate, and finally, the total number of events (Total problems) logged in WOCU-Monitoring for this element across all configured data sources.
Detailed table of Hosts/Events
Additionally the Hosts together with their Events are listed in a table in order to complete the information presented in the report.

The information in the table is organised in a series of fields as described below:
Host
Indicates the name of the Host with Events.
Top 3 problematic logger resources
Indicates, in case data from several data sources are shown in the Report, which three data sources account for the majority of the events shown.
Number of alarms/Total
Indicates the number of events for each Host against the total number of events, for the data source(s) in the selected interval(s).
% of total
Indicates what percentage the event volume of the Host represents compared to the total number of events contained in the data source(s) in the selected interval(s).
Data Source Verification
When you click on the host name, three columns with three additional fields appear (click on the minus icon if you want to hide this information again).
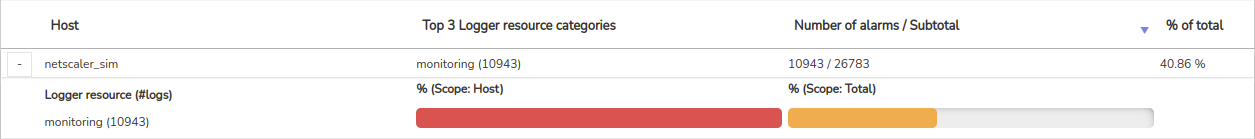
Logger resource (#log): indicates the name of the Logger resources or Logger resources types, from which the events have been extracted and, in brackets, the number of events each one has recorded for this Host.
Percentage of Host Scope (% Scope:Host): represents in a graph the percentage of events that each data source represents in the total number of events in the Host.
Percentage of Scope over Total (% Scope:Total): represents in a graph the percentage that the events of a Host represent against the total number of events of that data source.
Important
The different navigation, search and sorting options available on this screen are explained in detail in the section: Common navigation, filtering and sorting options.
Comments
Free text field to add comments, notes, or additional clarifications about the report.