Availability Reports
WOCU-Monitoring facilitates the monitoring of the level of Availability of the monitored technological infrastructure. Through the Availability Report it is possible to evaluate compliance with Service Level Agreements (SLAs) in a quick and easy way.
Calculation of availability
Framed in a specific time interval, the availability calculation of the configured sample is obtained by the following formula:
Where i is a Host, if it is a Host Report (Hosts) or a Service, in Service-based Reporting.
Where n is the total number of Hosts or Services.
Equivalently, the availability of Services is obtained with the formula presented.
The process of creating and executing reports is detailed below, establishing a series of filters and parameters configured by the user.
Configuration and generation of Availability Reports
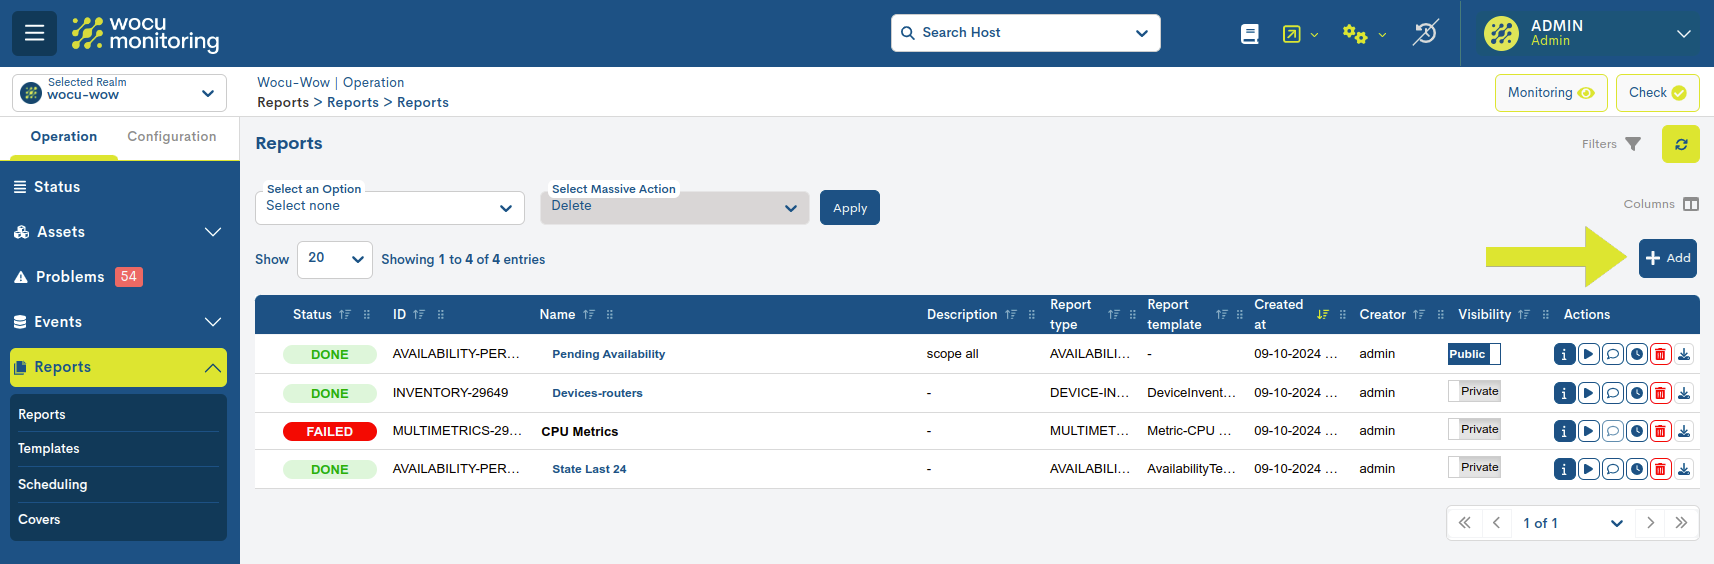
In general, when creating reports, the user must access the blue + Add button, located in the Reports section.
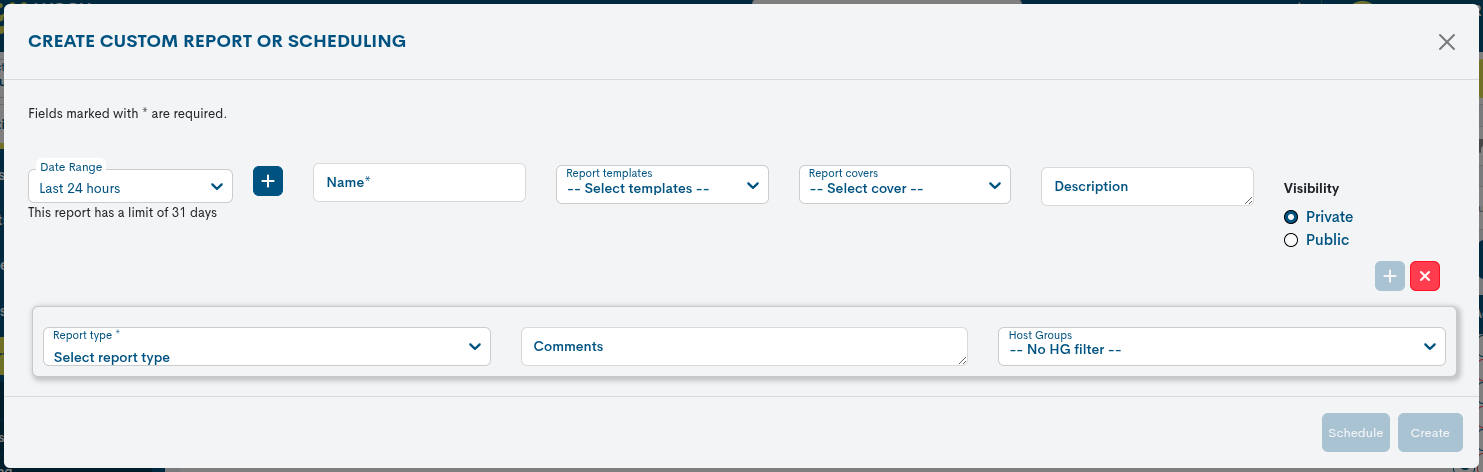
Before generating the report, you will need to configure a series of parameters described below:
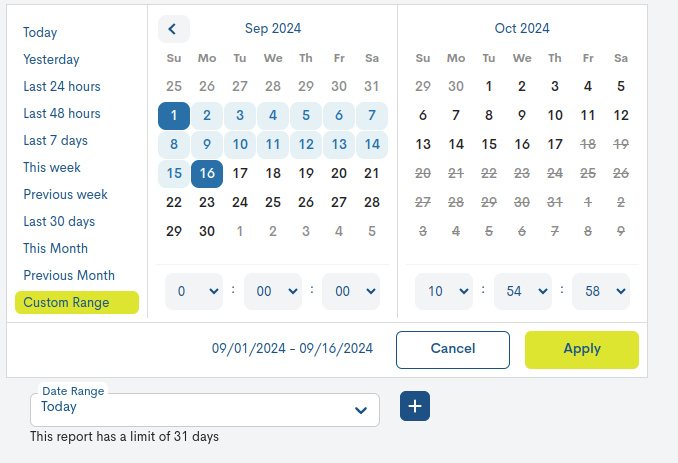
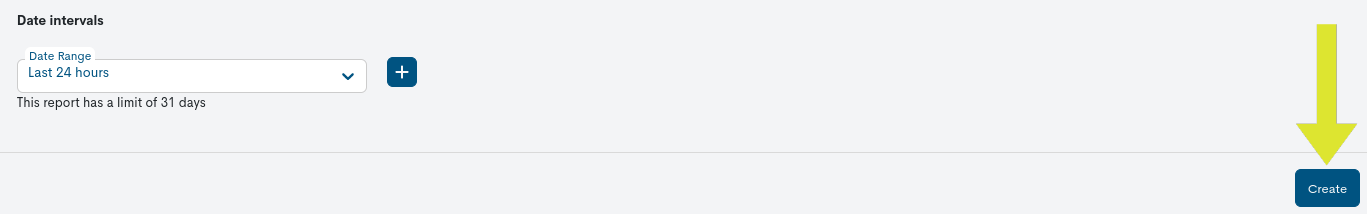
Date range
This parameter is used to establish the time period for which the Availability calculation will be made.
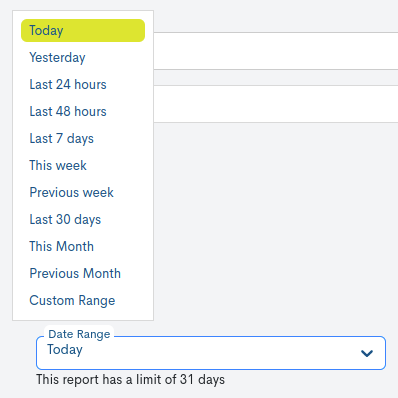
There are a number of time criteria already in place:
Parameter |
Description |
|---|---|
Today |
Filters and displays only data recorded during the time period that elapsed today. |
Yesterday |
Filters and displays only data recorded yesterday. |
Last 24 hours |
Filters and displays only data recorded in the last 24 hours. |
Last 48 hours |
Filters and displays only data recorded in the last 48 hours. |
Last 7 Days |
Filters and displays only data recorded in the last seven days. |
Last 30 Days |
filters and displays only data recorded in the last thirty days. |
This Week |
Filters and displays only data recorded during the time period elapsed in the current week (from the week’s start date to the current day). |
Previous Week |
Filters and displays only data recorded in the previous full week(Monday to Sunday). |
Last 30 days |
Filters and displays only data recorded in the last 30 full daysfrom the current date. |
This Month |
Filters and displays only data recorded during the time period elapsed in the current month (from the 1st to the current day of the month). |
Previous Month |
Filters and displays only data recorded in the previous full month (from day 1 to day 28/30/31). |
If you want to define a specific time period, you can use the Custom Range option. To configure the time range, you must specify a start and end date. Clicking on a day will select it and highlight it with a blue background. In addition to the date, you can specify a specific time within that day using the drop-down menus for hours, minutes, and seconds, until you reach the exact moment you want. The selected date and time will be displayed in both the upper and lower boxes of the view.
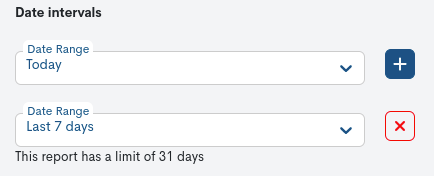
Using the plus sign (+) button, you can add multiple date ranges for data collection in the configured report. If you want to delete one, simply press the red button with the cross (X). The range will disappear, and when you run the report, only the remaining periods will be taken into account.
Attention
It is of course not possible to choose start and end dates after the current date, nor to set an end date before the start date.
Name
Required field to record a report identifier term.
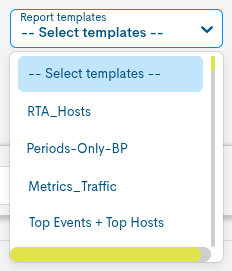
Report Template
In this optional field, the user can select the template they wish to apply to the report. Templates are pre-created and available for reuse during report configuration. More information can be found at: Templates.
Report Covers
In this optional field, the user can choose a predefined cover for the report. This includes a cover image, a header on the pages, a main title, and a footnote. This gives documents a corporate and professional appearance, tailored to the organization’s visual identity. More information can be found at: Covers.
Description
Optional field where the user may include descriptive text relating to the report.
Visibility
In this field, the user will determine whether the report will be visible to other users (i.e., a public report, Public), or whether it will be private and visible only to the report’s creator (Private).
Report type
In this drop-down field, the user must select the type of report he/she wishes to create, in this case it will be Availability.

Note
Depending on the type of report selected, new fields to be defined will be automatically included.
Host Groups
This configuration parameter allows you to filter the data collected and reflected in the report, showing only data related to the Hostgroups existing in WOCU-Monitoring
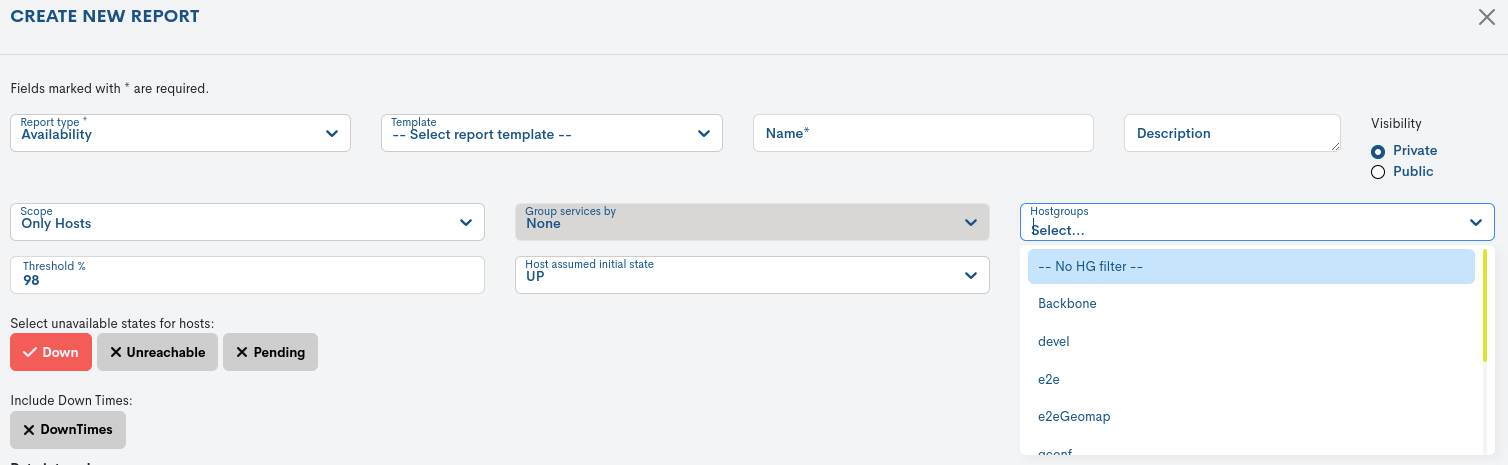
To select and filter the report results by a specific Device Group, simply select its name from the Hostgroup dropdown. All registered groups within the realm will be displayed.
To deactivate the filter, the user must choose the No HG filter option, which appears first in the list.
Scope
This parameter determines the scope of the Availability Report, as the report will refer to one type of asset or another monitored in WOCU-Monitoring.
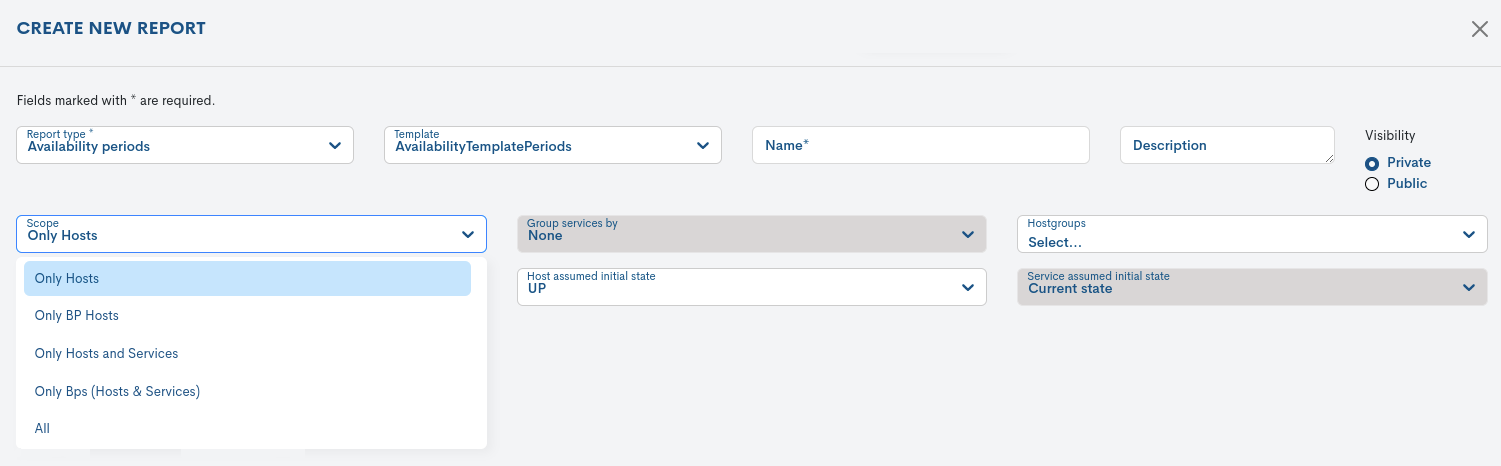
The four options available are as follows:
Only Hosts: Selecting this option will cause the report to refer only to the Hosts monitored in WOCU-Monitoring.
Only BP Hosts: By selecting this option the report will refer only to monitored Business Processes (BP Hosts).
Hosts & Services Only: By selecting this option the report will refer only to the monitored Hosts and Services.
Only Business Processes (Only BPs - Hosts & Services): by selecting this option the report will refer only to monitored Business Processes (Hosts and Services).
All: By selecting this option the Availability Report will refer to all types of Assets monitored in WOCU-Monitoring: both Hosts and Services as well as Business Processes.
Group services by
This configuration parameter allows for certain groupings to be made in the detail information about the services monitored by WOCU-monitoring which is reflected in the final report in its Services by service Availability.
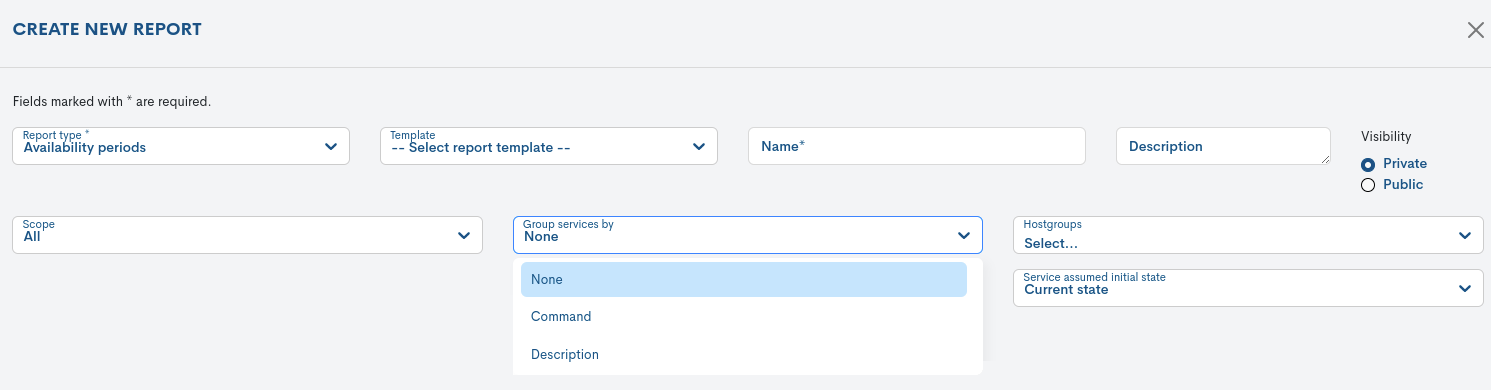
The grouping options are as follows:
Command
Selecting this option will display the information from the Services by service Availability will display the report results for the Services grouped in function to the checking command executed by the system in the check for each Service.
For example, the
check-cisco-healthcommand will group the results of the health check of the monitored Cisco Hosts. That is, this action groups together different Services from different Hosts.
Description
Selecting this option will display the information from the Services by service Availability will display the report results for the Services grouped in function to the name or description of each Service.
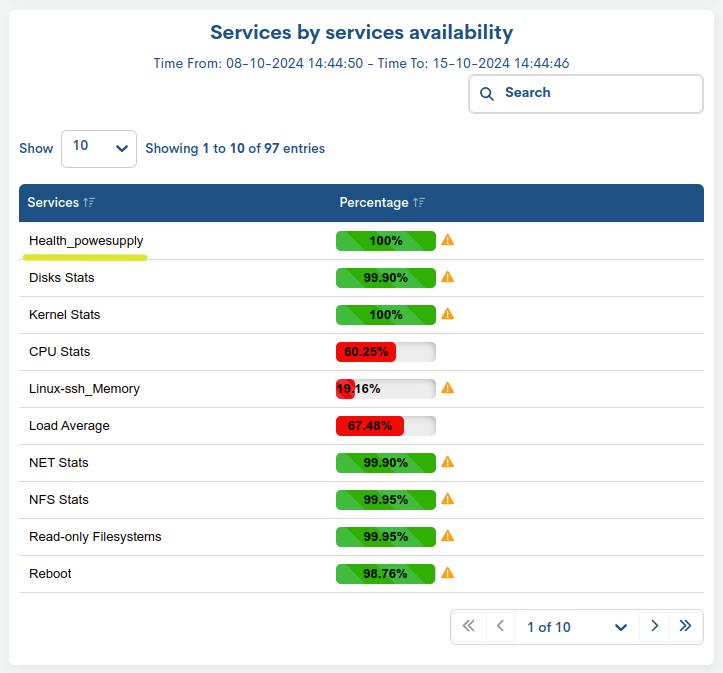
Continuing with the previous example, under the description of the Service
health_powersupplythe status of the power supplies of all monitored Cisco* devices will be grouped. That is, through this action, Services from different Hosts are grouped.
Attention
The Service Command and Service Description grouping options cannot be applied when the selected Scope is Host. In this case no grouping will ever be applied.
None
By selecting this option the Services by service Availability informationwill display the report results for the Services without any grouping. The information in the Panel, in this configuration, details one by one the different Services associated with each of the Hosts.
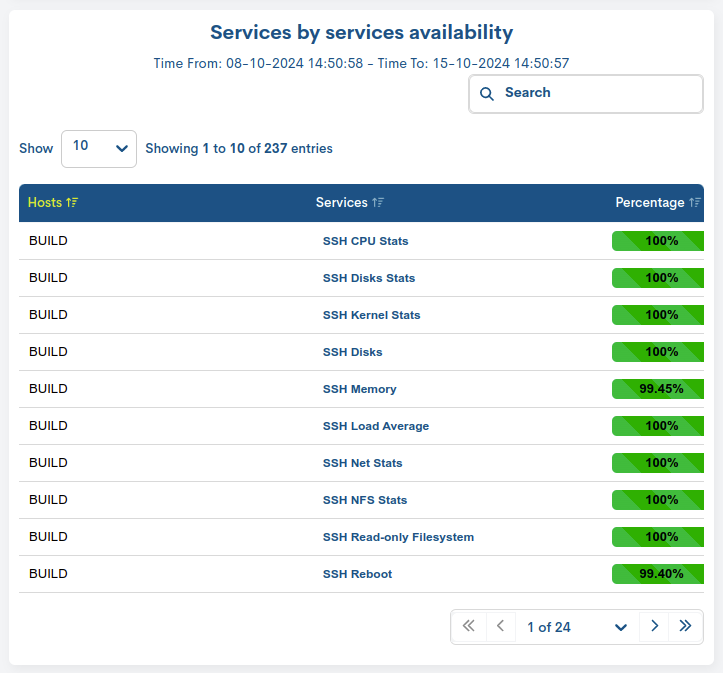
Important
When this option is selected, an additional field is introduced to the Panel (Hosts) to indicate the Host to which the Service whose percentage of Availability is detailed corresponds.
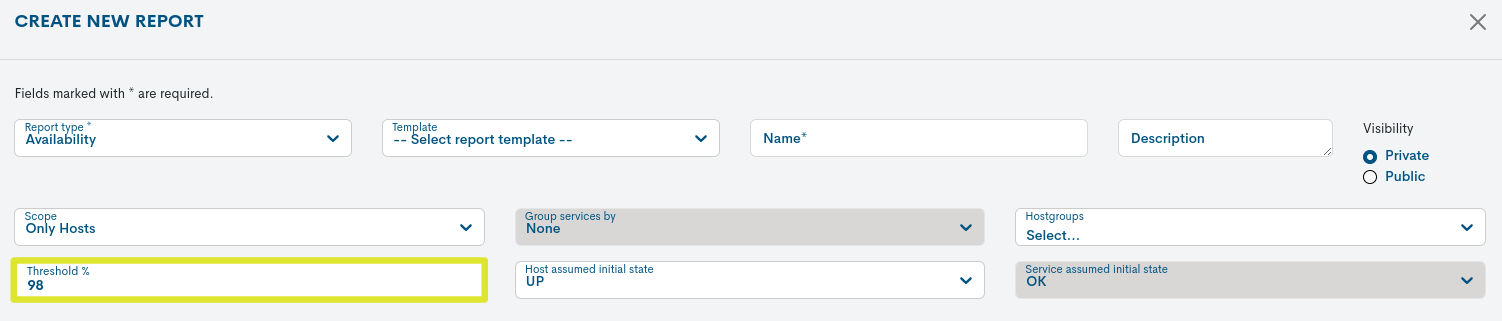
Threshold
This configuration parameter establishes the percentage value of the minimum service level threshold that is considered adequate or acceptable. This percentage is closely linked to compliance with Service Level Agreements (SLAs) and is a simple way to evaluate and measure the availability of a technological infrastructure over a period of time.
By default, the value set in the User preferences is defined. To change it, click on the up and down arrows in the box itself. Each click will add or subtract one unit to this percentage.
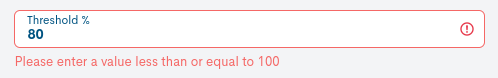
Important
The value must be between 0 and 100%, with a maximum of two decimal places.
The value must be between 0 and 100%, with a maximum of two decimal places. When defining a value that does not conform to the above requirements, the system will return the following error messages, preventing the correct configuration of the report:
Assumed initial state
These options allow the user to assume and assign the initial state of devices and services, in the event that WOCU-Monitoring has not collected enough data to define them.
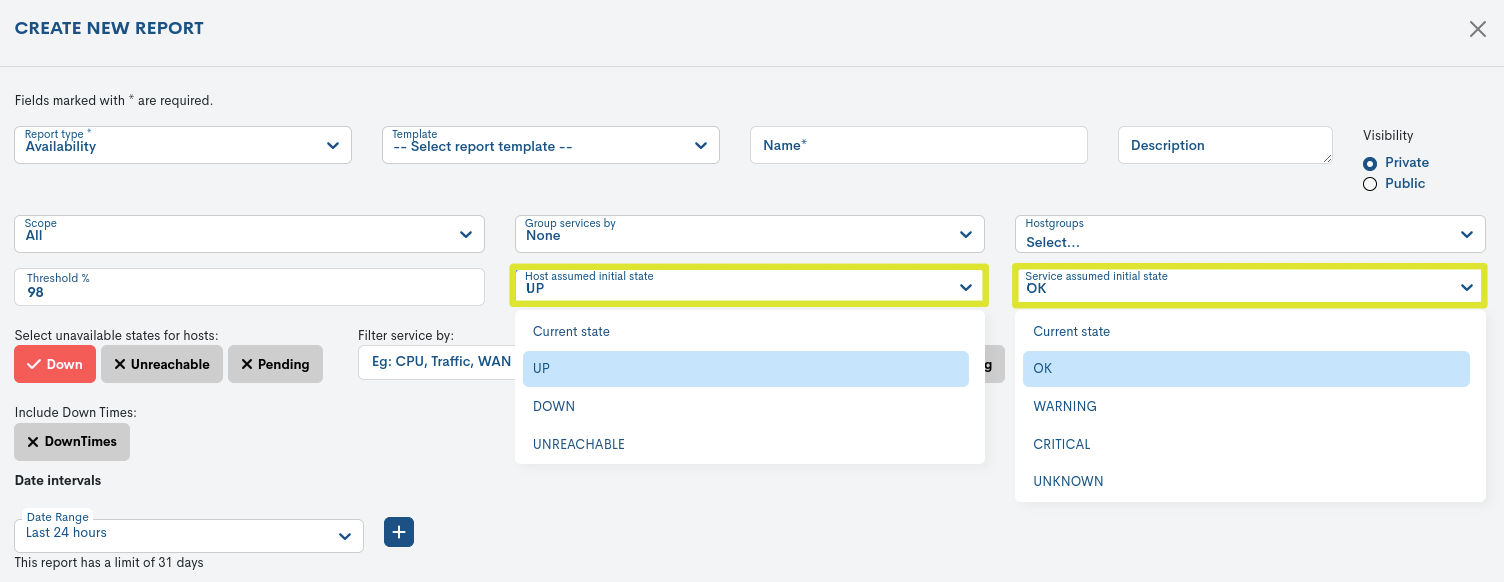
Possible states for Host:
Down
UP
Unreachable
Current state
Possible states for Services:
OK
Warning
Critical
Unknow
Current state
More information in Statements of Assets in WOCU.
Note
It shall not be possible to select an initial status for a service, when the selected Scope is Host.
Select unavailable states
Every asset monitored in WOCU-Monitoring always has a status associated with it, which is categorized based on whether it is available or not. These configuration options allow the user to choose the status of devices and services so that they are considered non-operational (unavailable).
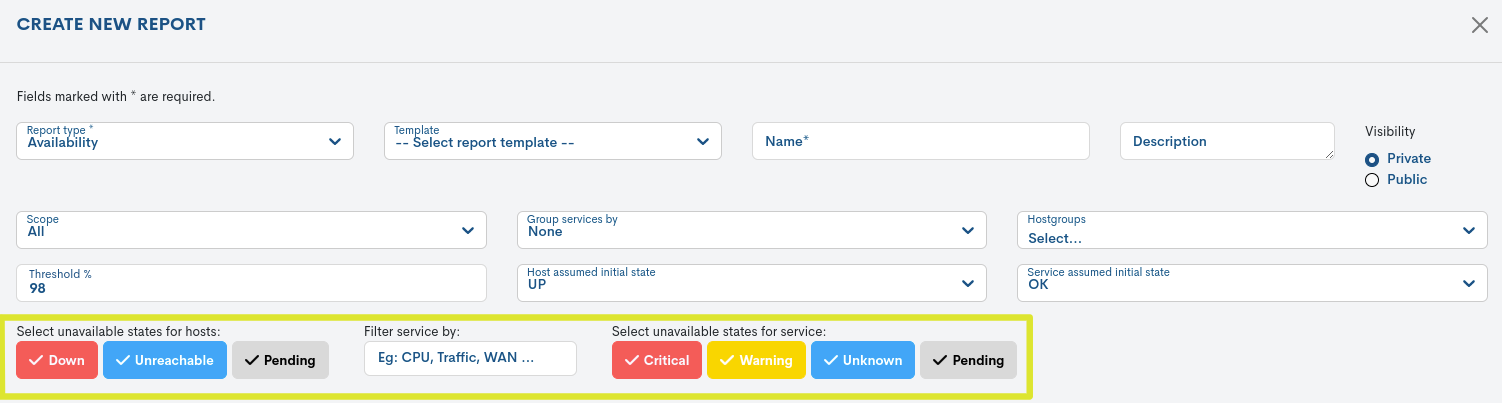
The possible states associated with unavailable elements are:
For Host:
Down
Unreachable
Pending
For Services:
Warning
Critical
Unknow
Pending
More information in Statements of Assets in WOCU.
By clicking on a specific box you can activate or deactivate this option. Note that once selected, the box marked with a tick (✓) will appear inside it.
It’s worth mentioning that the Down and Critical states, for devices and services respectively, are always considered inoperative. Therefore, they cannot be deselected.
Note
It shall not be possible to select a status for unavailable services, when the selected Scope is Host. In this case the options will not be visible in the report configuration.
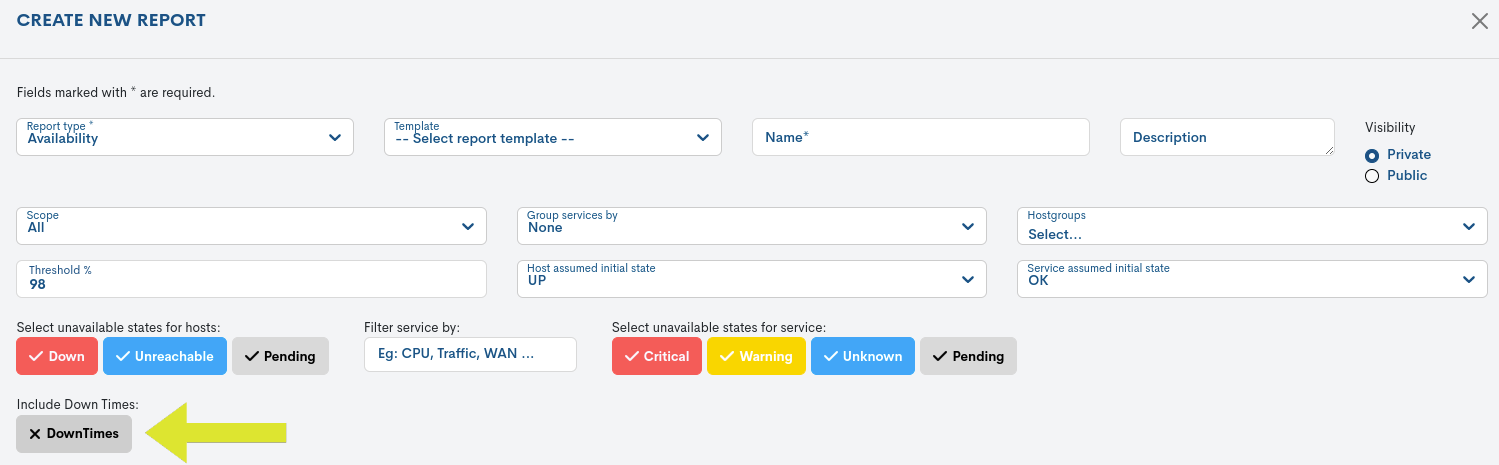
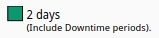
Include Down Times
The system allows to inhibit for a certain period of time the warnings and alarms of an Asset, which is going to suffer a fall or other known and/or planned event that will affect the status of the Asset.
Checking this box will include all scheduled downtimes on the Assets that make up the report.
Filter service by
This field allows filtering by certain services, in order to monitor their level of availability in the report. This filter acts in the context of:
Host & Services
Only BPs - Hosts & Services
All
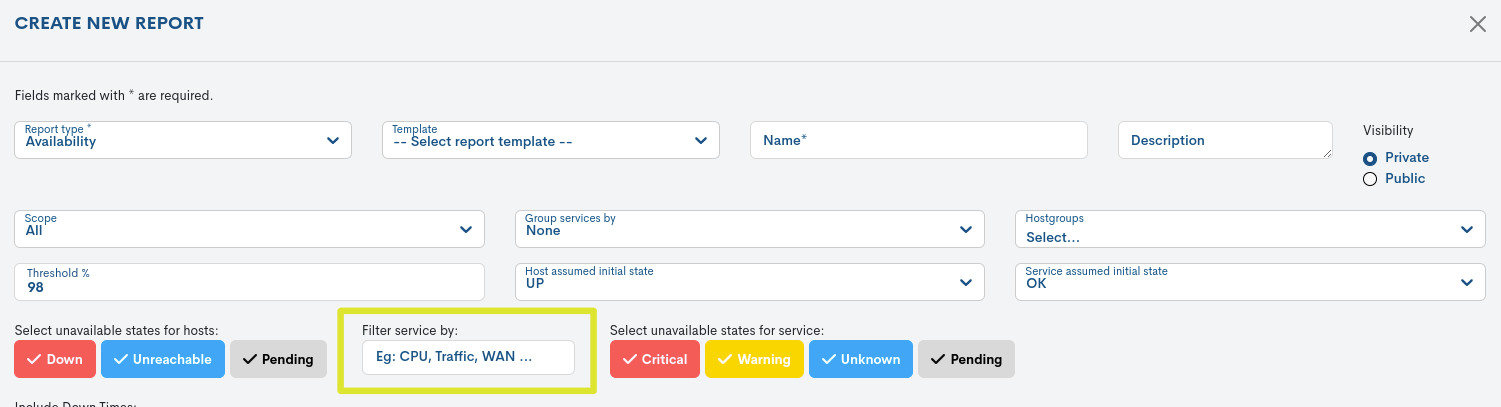
The filtering of services will be carried out by defining a regular expression, giving greater flexibility and customisation of the filtering to the operator himself.
For this purpose, the services whose name/description meet those defined in the regular expression will be picked up and displayed in the generated report. On the other hand, services that are outside the entered pattern will be excluded by the system.
Important
Regular expressions will be case insensitive to facilitate filtering.
A simple string or complex regular expressions can be used (see the python documentation for reference).
The regular expression must be valid, otherwise the form itself will do the corresponding validation.
To save the configuration and generate the report, click on the blue button Create.
Once the report has been created and scheduled, you will be taken back to the initial screen of this section, where the reports will be sequentially stacked in the Centralized Report Management.
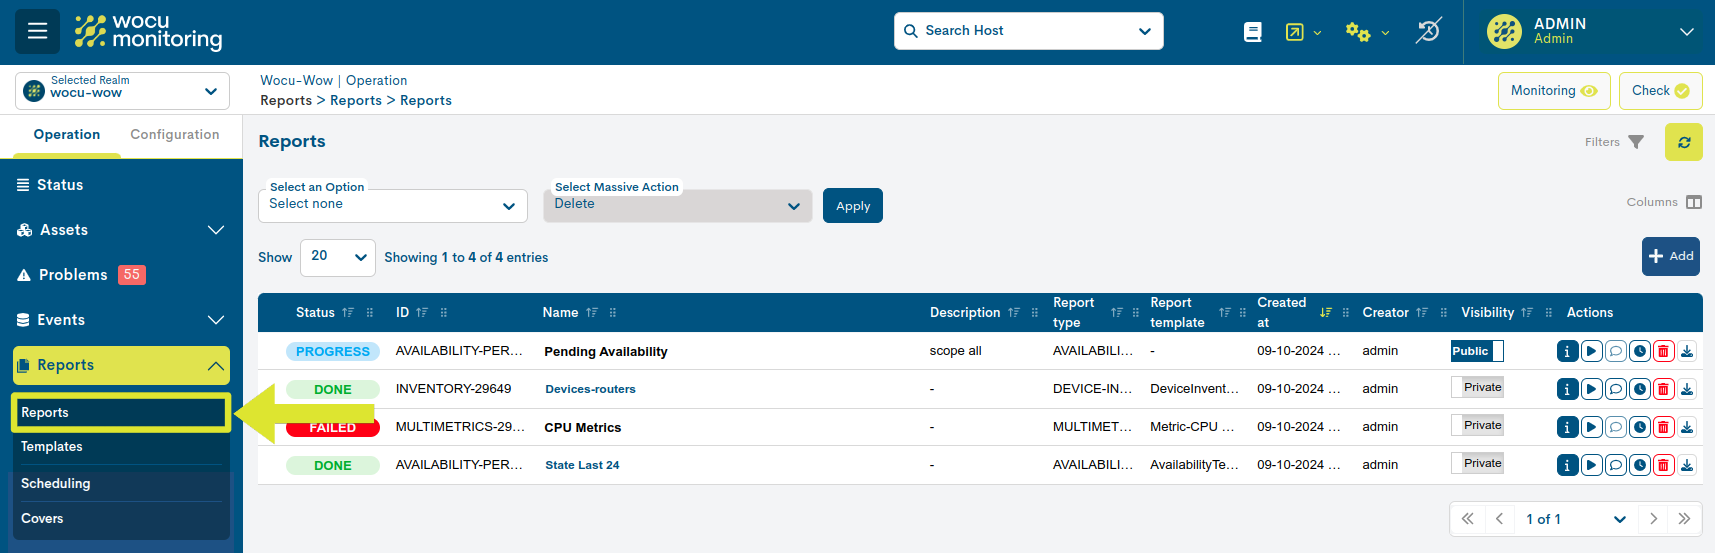
Click on the Name to access the full report. The user is then taken to a new report window where the information generated and collected by the system is presented. These panels are described in detail in the next section.

Setting up a multiple report
WOCU-Monitoring allows the creation of multiple reports in a single operation. This allows the user to define several reports of different types from a single configuration form.
The operation is simple and intuitive. Once the user selects the first report, the system enables the + button in the upper right corner of the configuration form. Clicking this button displays a new form for defining another report.
Attention
The system supports the combination of the seven types of reports available, as long as they are of different types.
If a report is to be deleted, the user can use the x button, which deletes the previously configured settings.
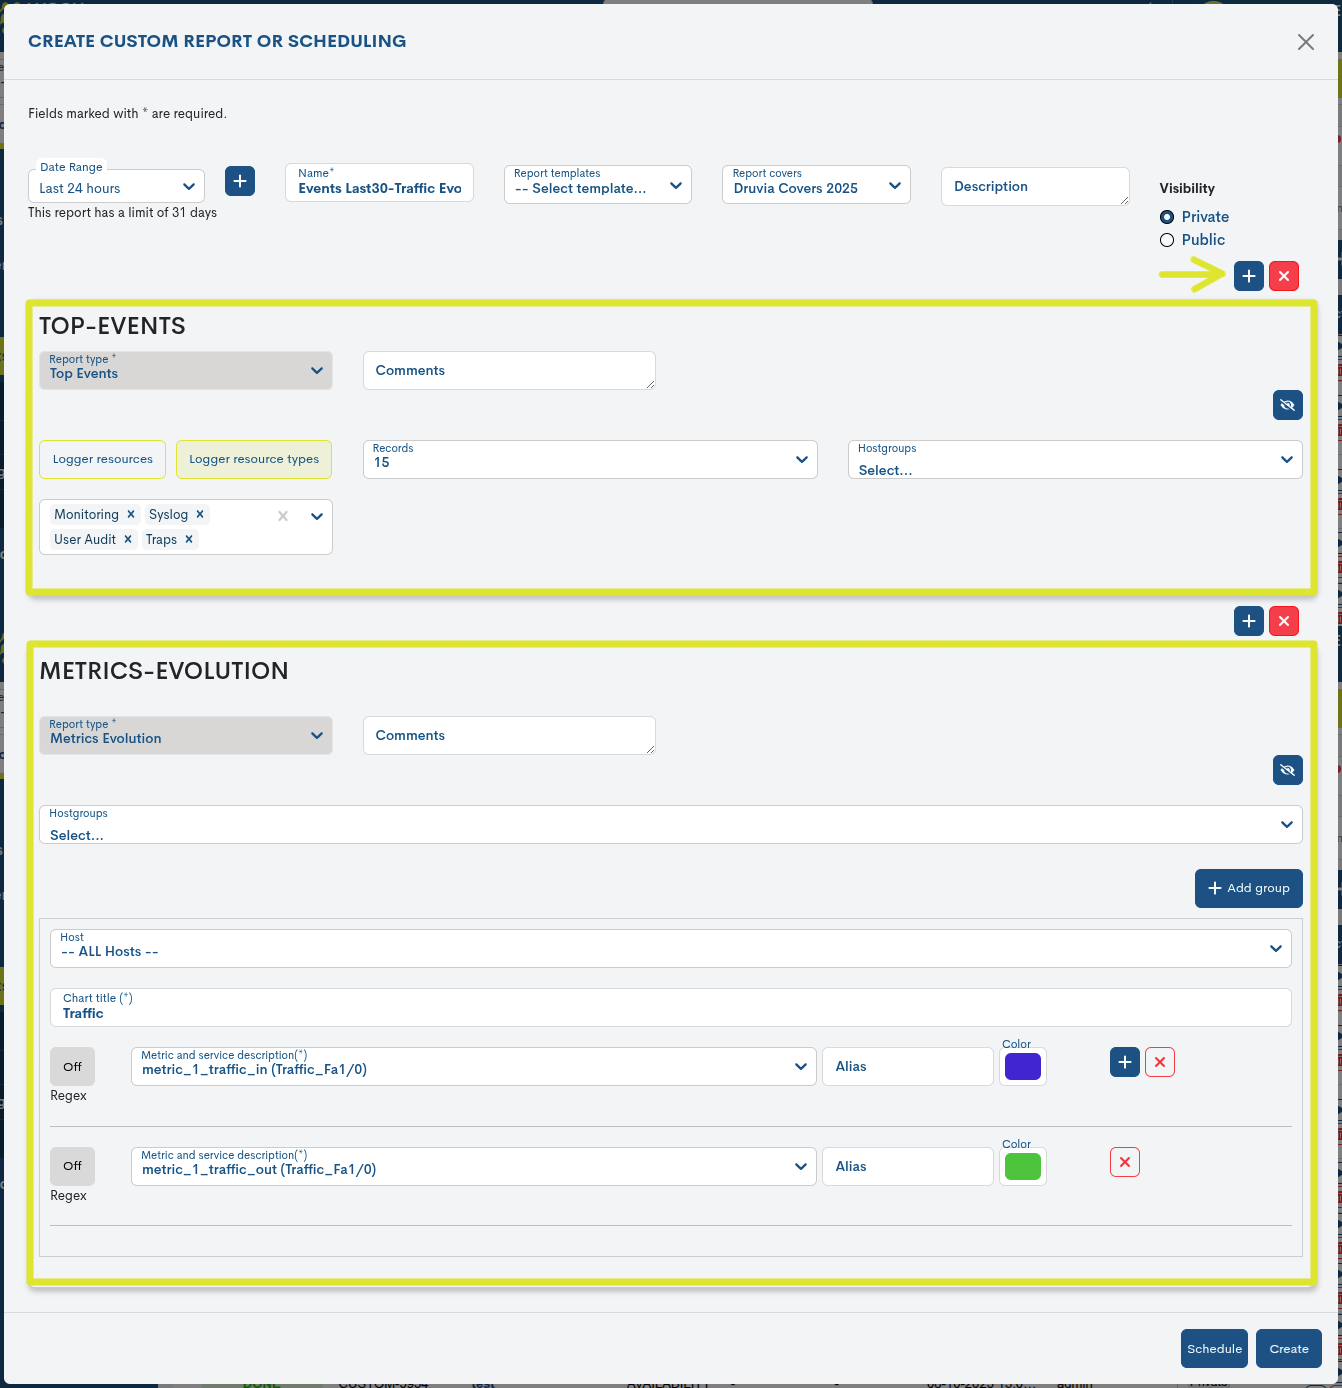
Each configuration form includes a Hide Report Config button (identified by an eye icon with a diagonal line through it), which allows you to hide the corresponding configuration view and expand the available screen space.
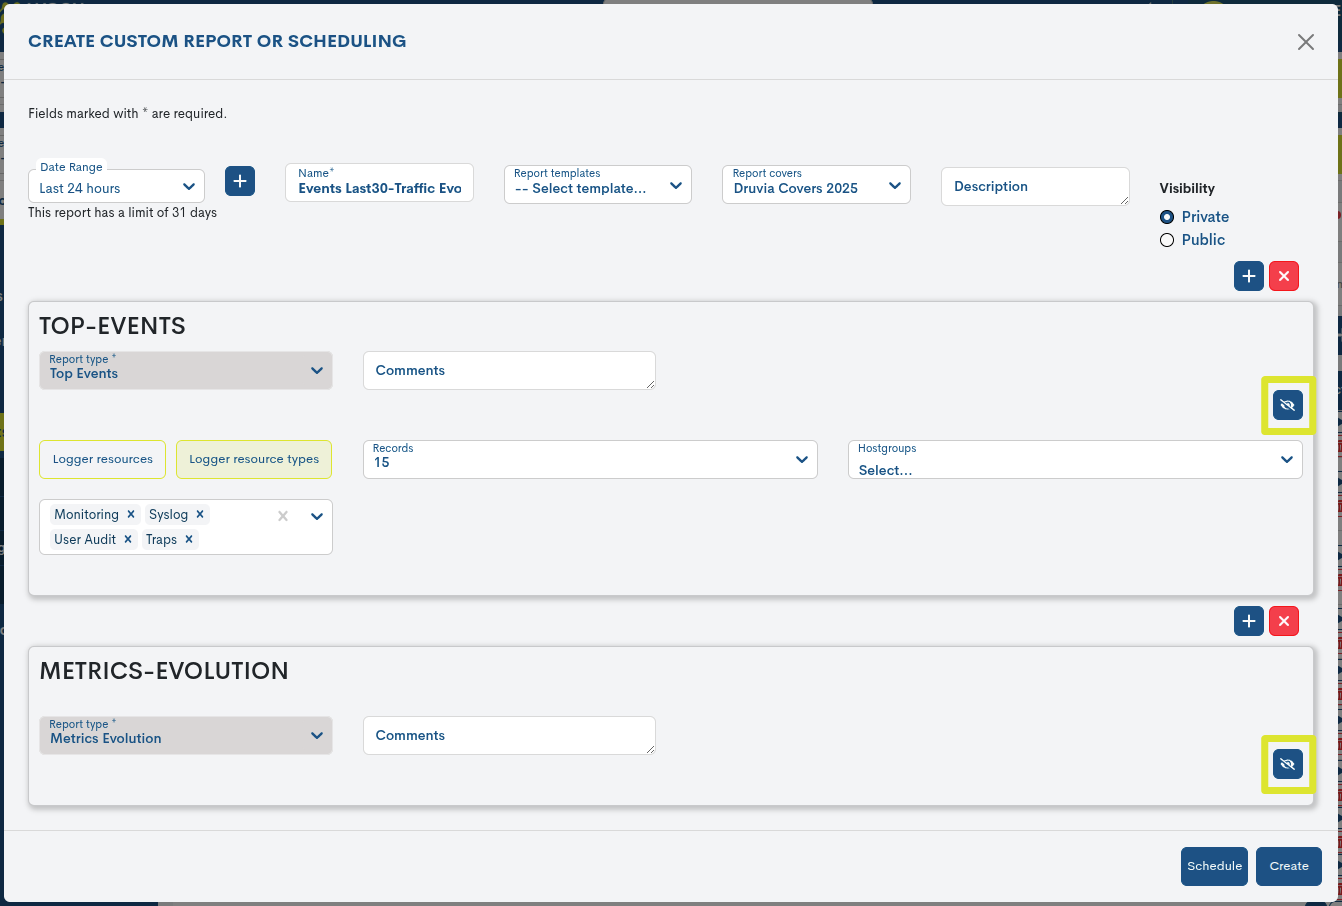
See the following multiple report structured in two separate sections:
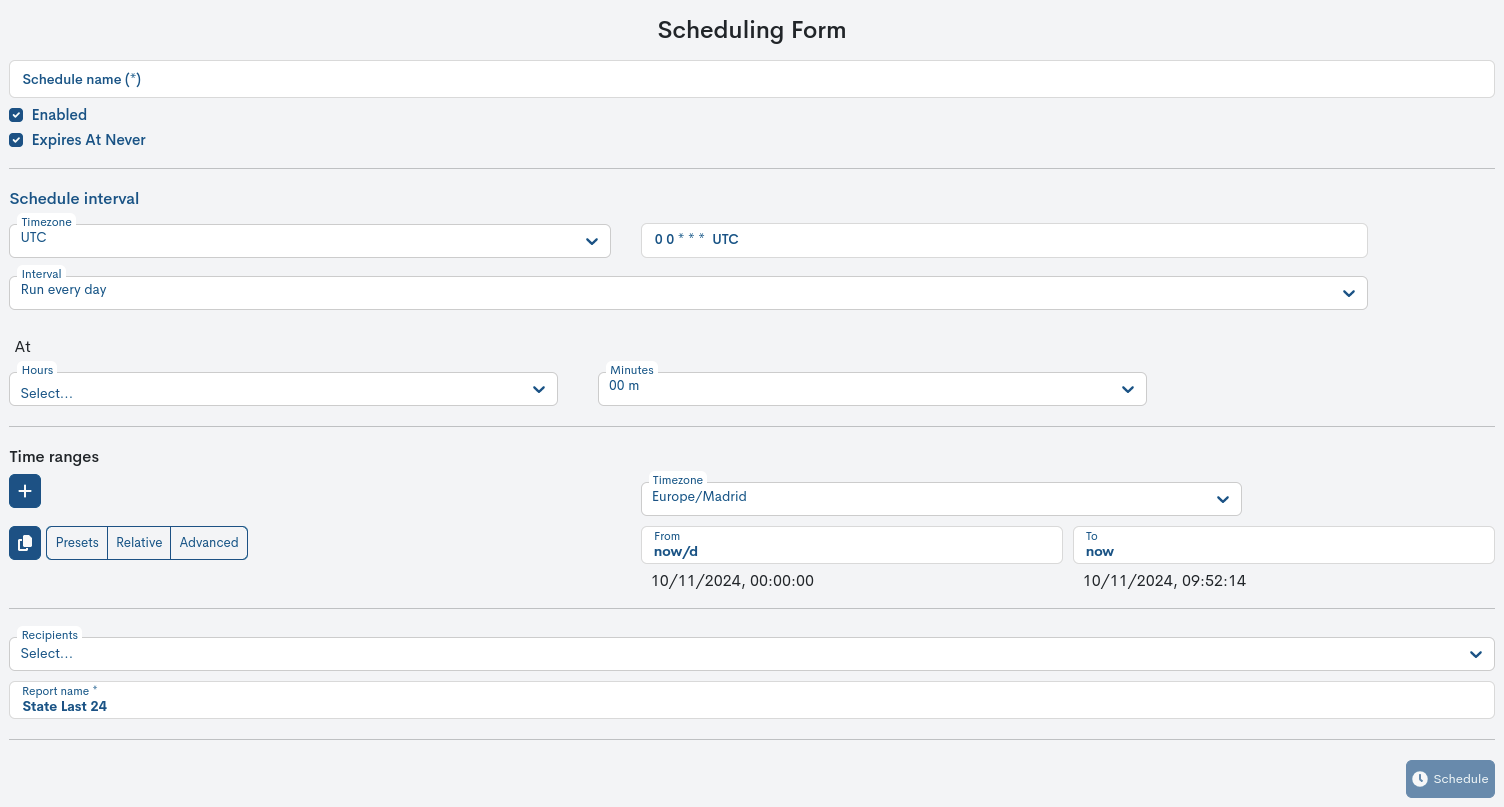
Availability Report Scheduling
WOCU-Monitoring also allows for the automation of reporting operations, thanks to the ability to schedule their generation and launch at the user’s discretion using the Schedule button.

Next, a form will appear to begin setting up your schedule. For more information, see the following section: Schedule.
Export of Availability Reports
WOCU-Monitoring also allows the export of the Availability Report in PDF, XLSX and JSON format. These condense all the information on the Availability of the monitored Assets into a document that is easy to disseminate and simple to analyse. These options facilitate the immediate sending of information.
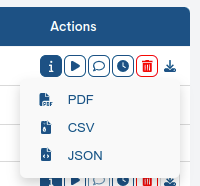
Using the Export selector located in the global reporting panel, the corresponding files will be downloaded.
Important
WOCU-Monitoring will return the following error message when the report scopeexceeds a certain number of Hosts. The default number is 1,000 Host, but this number may vary depending on the monitored environment and infrastructure.
Note on the PDF Availability Report
This section briefly describes the main elements of this document. For more information, please refer to Viewing and analyzing availability reports.
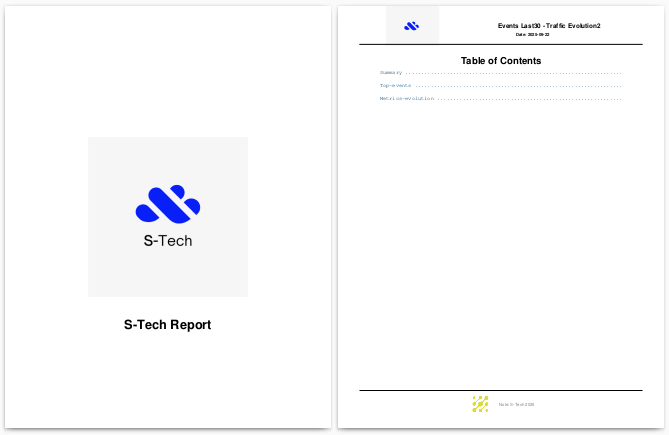
Cover
The cover page presents the type of report as its main title, in this case:
Comprehensive Availability Report: Performance Insights
If a predefined Covers is used, the cover will include a custom image, accompanied by a header, a main title, and a footnote.
In the following example, the first cover page corresponds to thedefault design with the WOCU-Monitoring logo, while the second shows a customized cover page.

Table of content
The index includes two main sections: Summary and Availability.
Within Availability, additional subsections will be displayed depending on the report configuration, specifically the scope defined.

Report Summary
Descriptive data from the report is presented on the following page.
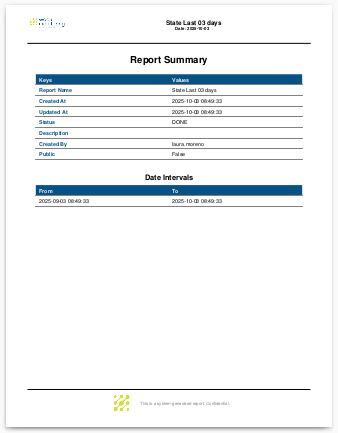
There are
Report Name: identification name assigned to the report.
Create at: indicates the date and time the report was created.
Updated at: indicates the date and time the report was created.
Status: Indicates the status of the reports. Thesecan be:
Pending: The report is pending execution.
Progress: Report execution is in progress.
Done: The report is now created and available to the user.
Failed: The report has failed to execute, that is, it was not executed correctly.
Unknown: This status is assigned when none of the above have been detected and indicates that the report status is unknown.
Description: descriptive text relating to the report.
Create by: indicates the user who created/owns the report.
Public: Indicates whether the report’s visibility type is public or private.
Date intervals: Records the start and end time and date of the data collection period.
Configuration
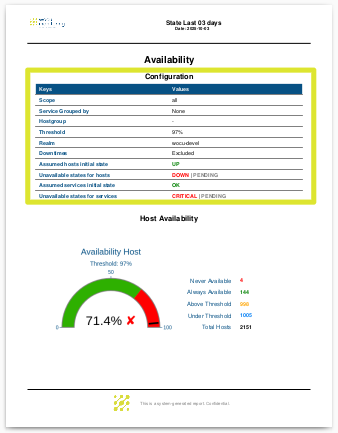
Scope: indicates the scope of the Availability Report (Host, Host & Services, Business Processes, All).
Services grouped by: indicates the type of grouping of services for the calculation of availability. This field shall not appear in the report when no grouping type is applied, i.e. Host is selected in the Scope parameter.
Hostgroup: reports the host group selected for the availability calculation. This field shall not appear in the report when it is not configured in the Hostgroup parameter.
Threshold: indicates the minimum percentage of availability set.
Realm: indicates the name of the Realm which is the subject of the report.
Downtimes: Indicates whether or not the report includes all scheduled downtimes for the assets included in the report.
Assumed initial states: indicates the status assigned and assumed by the user for both Host and Services. Assets with assumed states shall be notified with an attention signal icon (⚠).
Unavailable states for hosts/services: indicates the type of state(s) categorised as unavailable, chosen by the user, for non-operational Host and Services.
Services filtered by: indicates the regular expression defined and applied in the report for the filtering of services.
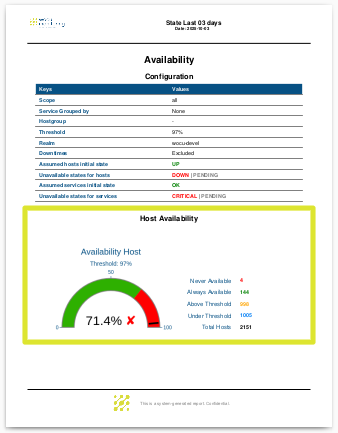
Host Availability/ Service Availability
Below are the Availability Panels corresponding to the asset selection configured in the report, specifically in the Scope field.
The following image provides a graphical summary of the availability percentage obtained for the selected set of devices over a specific time period.
For example, if Hosts” and “Services” are selected in the report’s **Scope* field, there will be another report page dedicated to this graph, but based on the services data.
Hosts by hosts availability/ Services by services availability
If the selection of assets made by the user in the filters refers to or includes hosts, the report shall include this section detailing, one by one, the statistics and availability data of the selected hosts within the given time frame.

For each Device, the following information is included in tabular format:
Host: Device Name.
Total Downs: Indicates the total number of downtimes (losses of availability) experienced by a device during the established timeframe.
Time Down(s): Recorded in days, hours, and minutes, the time during which the device was unavailable.
Availability(%): Percentage reached by the device during the established timeframe. The data will change color depending on the availability percentage reached.
If the selection of assets made by the user in the filters refers to or includes services, the report will include this section detailing, one by one, the statistics and service data of the selected assets within the given time frame.
The information in this section includes three fields:
Host: Name of the service to which the specific service is associated.
Service: Service name.
Availability(%): Percentage reached by the service during the established timeframe. The data will change color depending on the availability percentage reached.
Hosts with Downtime
Section intended for devices that have experienced periods of inactivity during the analyzed date range.
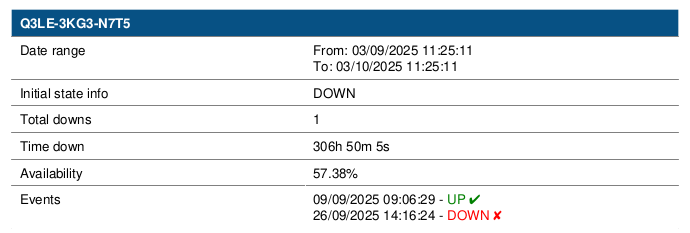
Data range: Indicates the time interval analyzed to calculate the asset’s availability.
Initial state info: indicates the initial state of the host, together with the exact date and time at which WOCU recorded this state. Remember that in the event that the system has not collected enough data to to define the initial status, the user may assume and assign a starting state during the report configuration in the Assumed initial state. This status shall be identified in the report by the icon of an attention signal (⚠) followed by the word Assumed.
Total Downs: Indicates the total number of downtimes (losses of availability) experienced by a device during the established timeframe.
Time Down(s): Recorded in days, hours, and minutes, the time during which the device was unavailable.
Availability(%): Percentage reached by the device during the established timeframe. The data will change color depending on the availability percentage reached.
Events: History of device status changes, detailing all events recorded in WOCU-Monitoring. This history allows for detailed analysis of a device’s activity.
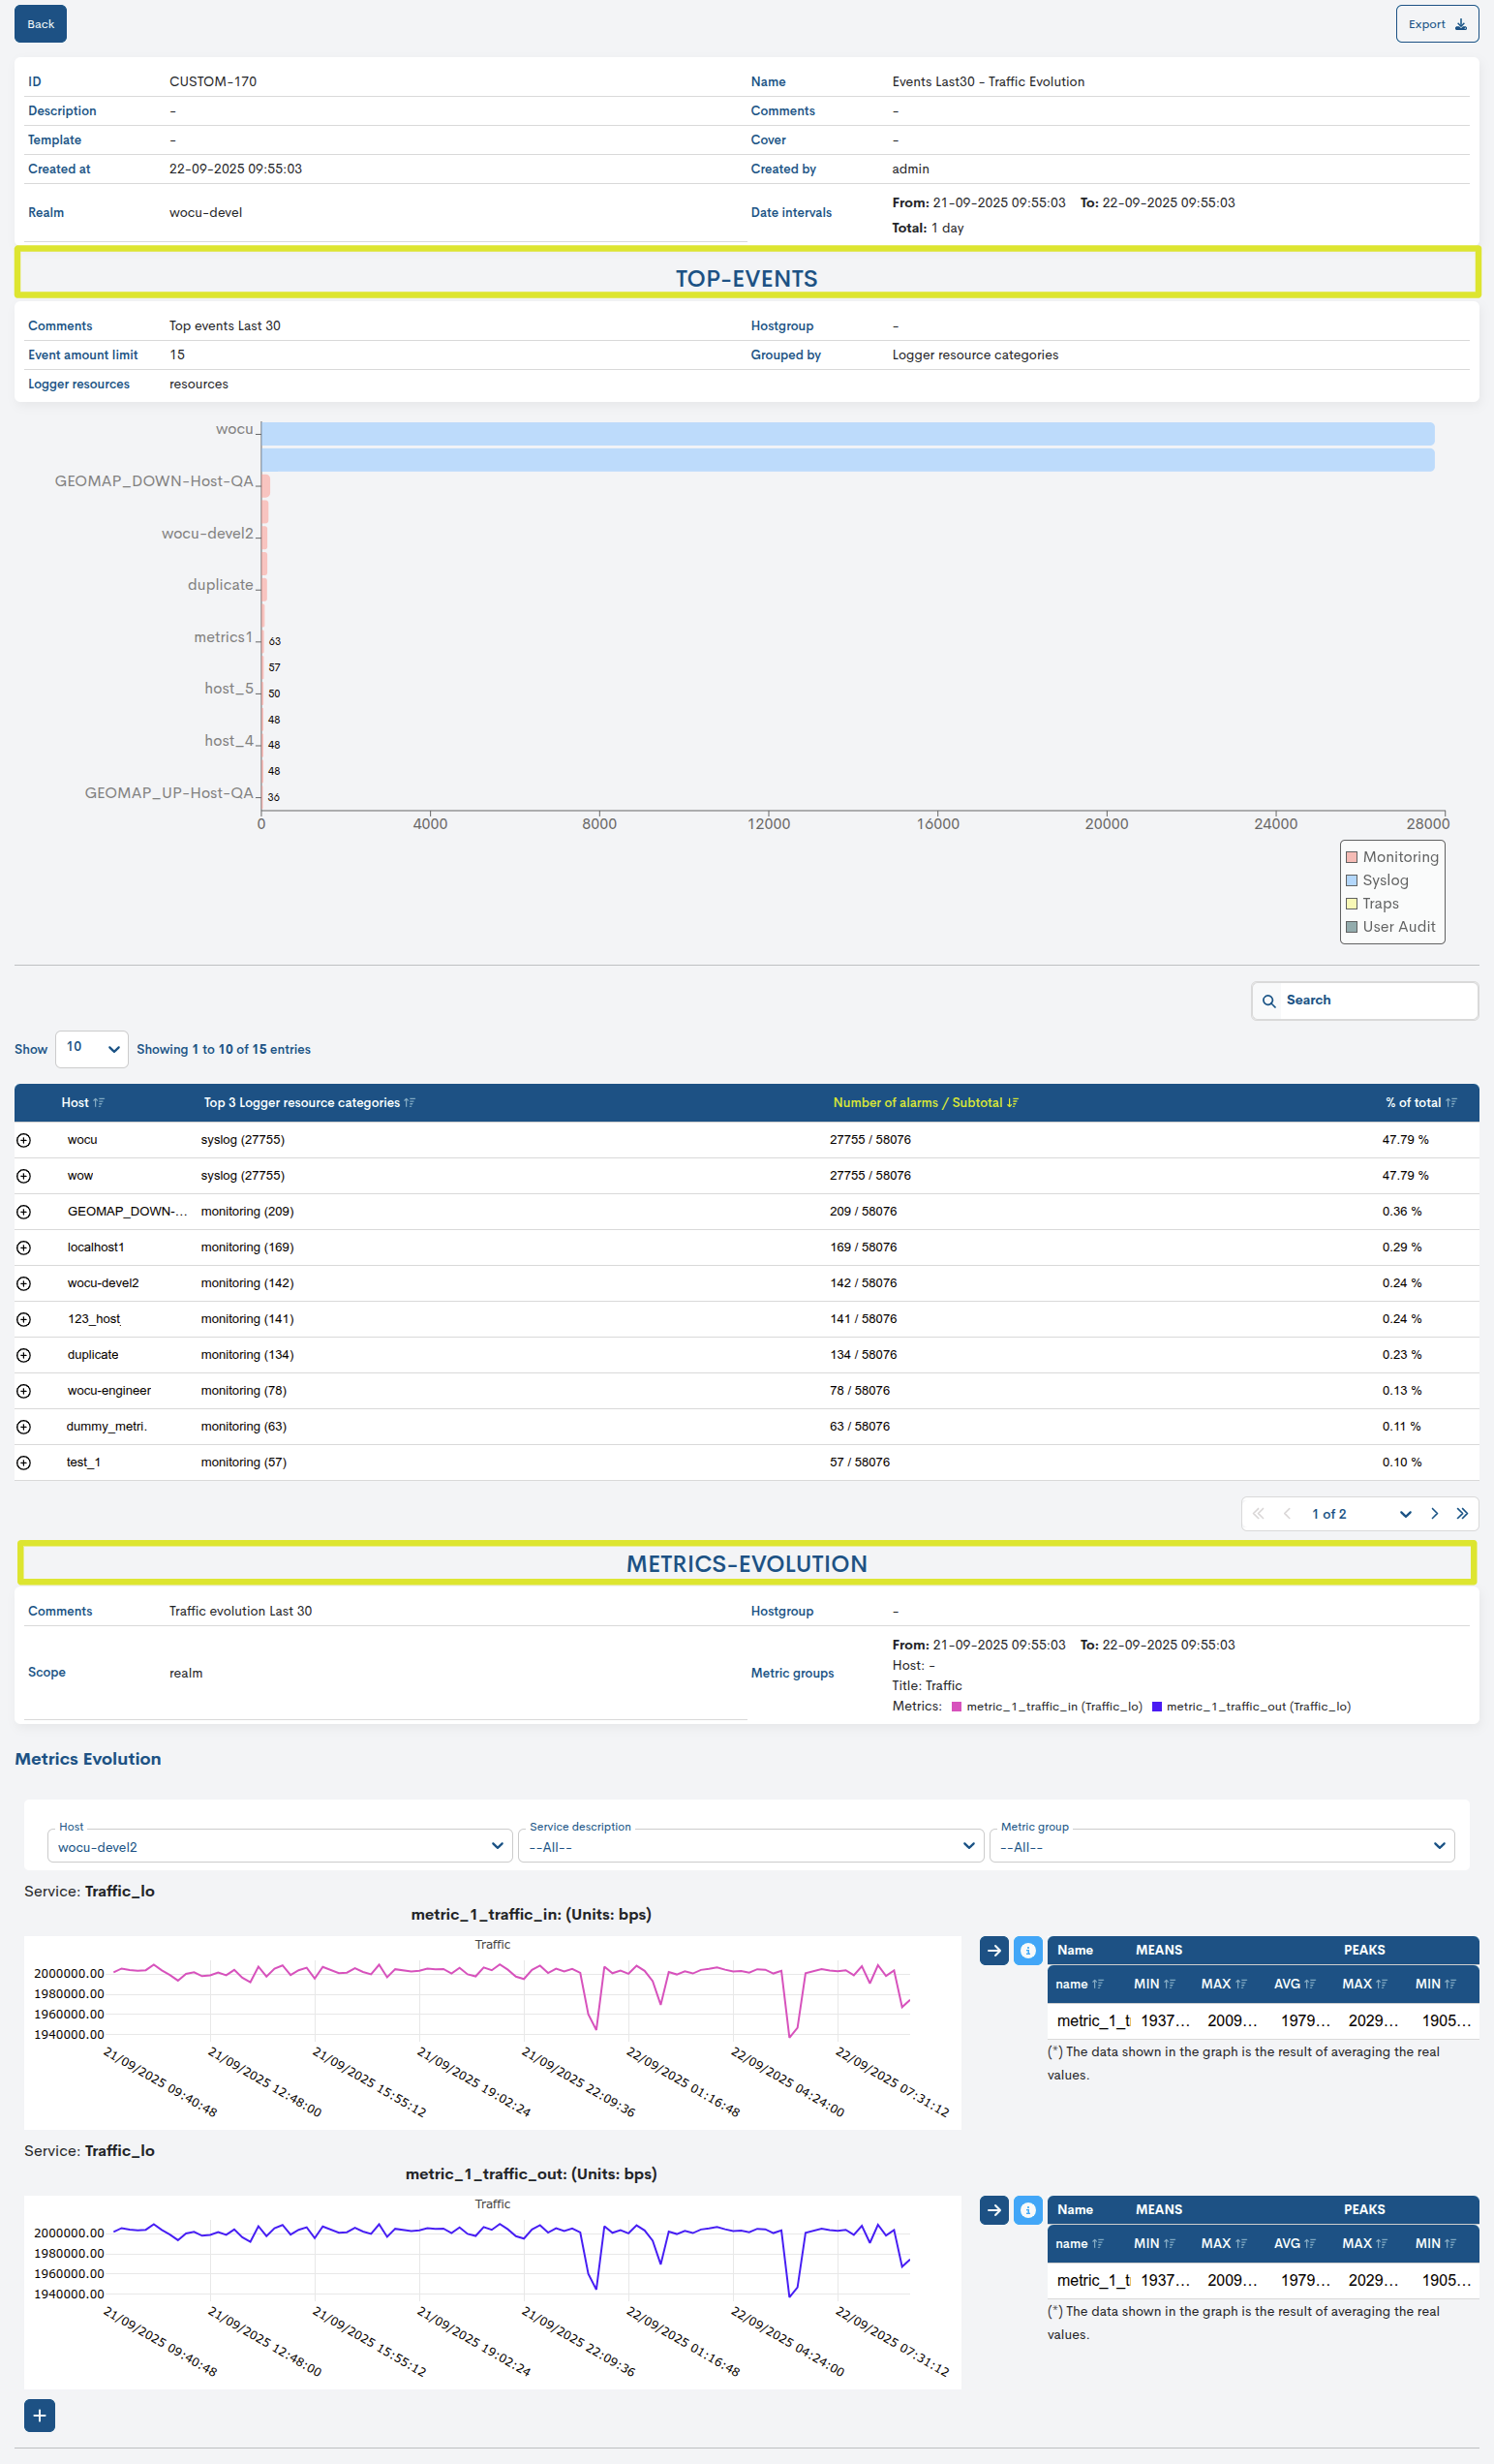
Viewing and analyzing availability reports
Clicking on the name label (column Name) takes you to the full report.
The Availability Report information is presented through interactive panels and graphics, designed to facilitate user interpretation.
Note
Each panel in the report displays, next to its title, the corresponding time range, indicated as: Time from: X - Time to: X.

Settings panels
The filters and parameters established in the generated report configuration are presented in a tabular format.
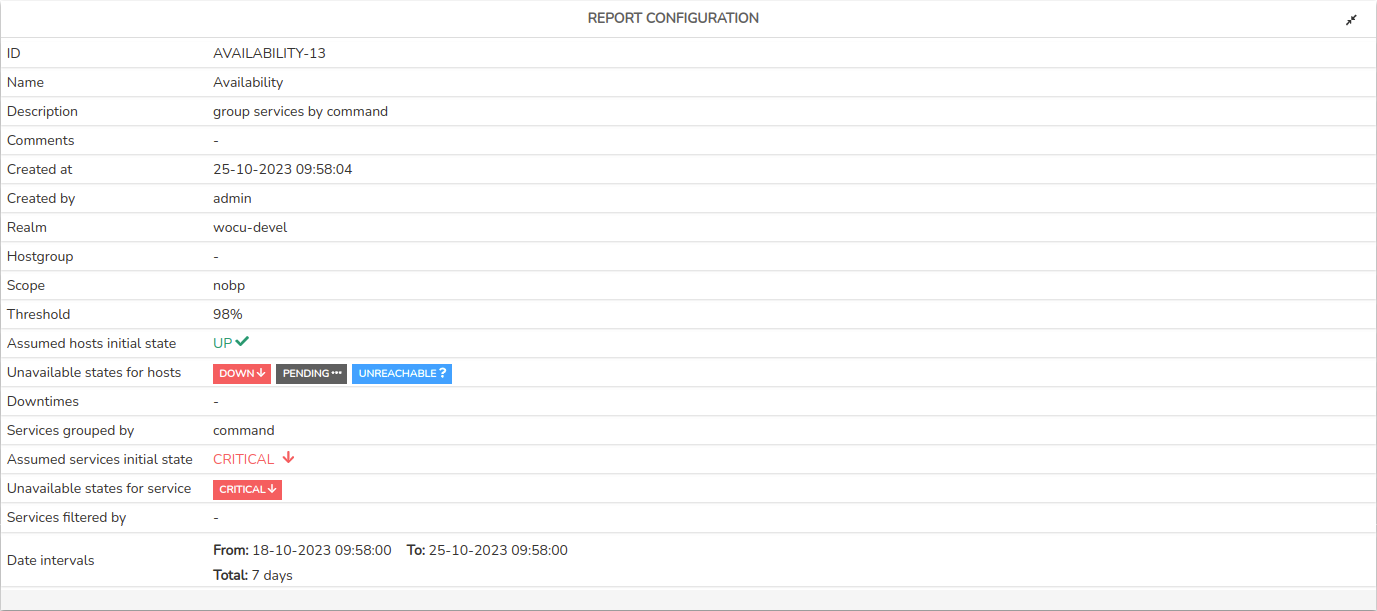
There are
ID: Report identifier code.
Description: descriptive text relating to the report.
Template: Templates selected on which the report is based.
Create at: indicates the date and time the report was created.
Realm: indicates the name of the Realm which is the subject of the report.
Name: identification name assigned to the report.
Comments: Free text assigned by the user regarding observations, annotations, or additional clarifications regarding the report.
Cover: Specifies the Covers applied to the report.
Create by: indicates the user who created/owns the report.
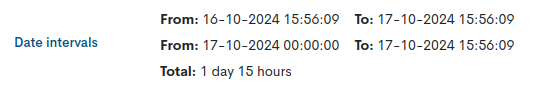
Date interval: indicates start and end time and date of the period.
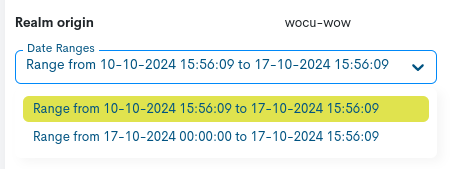
In multiple time frames, periods will be presented in a tabular format. The total range limit is 31 days.
Scope: Indicates the scope of the report (Host, Host & Services, Business, Processes, and All).
Assumed hosts initial states: Indicates the state assigned and assumed by the user for Devices.
Downtime: Indicates the inclusion in the report of scheduled downtimes for the component assets.

Assumed services initial states: Indicates the state assigned and assumed by the user for Services.
Services grouped by: indicates the type of grouping of services for the calculation of availability. This field shall not appear in the report when no grouping type is applied, i.e. Host is selected in the Scope parameter.
Hostgroup: Specifies the device group selected for the availability calculation.
Threshold: indicates the minimum percentage of availability set.
Unavailable states for hosts: Indicates the type of state or states categorized as unavailable, chosen by the user, for non-operational devices.
Unavailable states for services: Indicates the type of state or states categorized as unavailable, chosen by the user, for non-operational services.
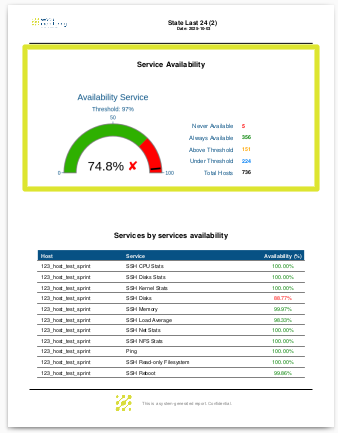
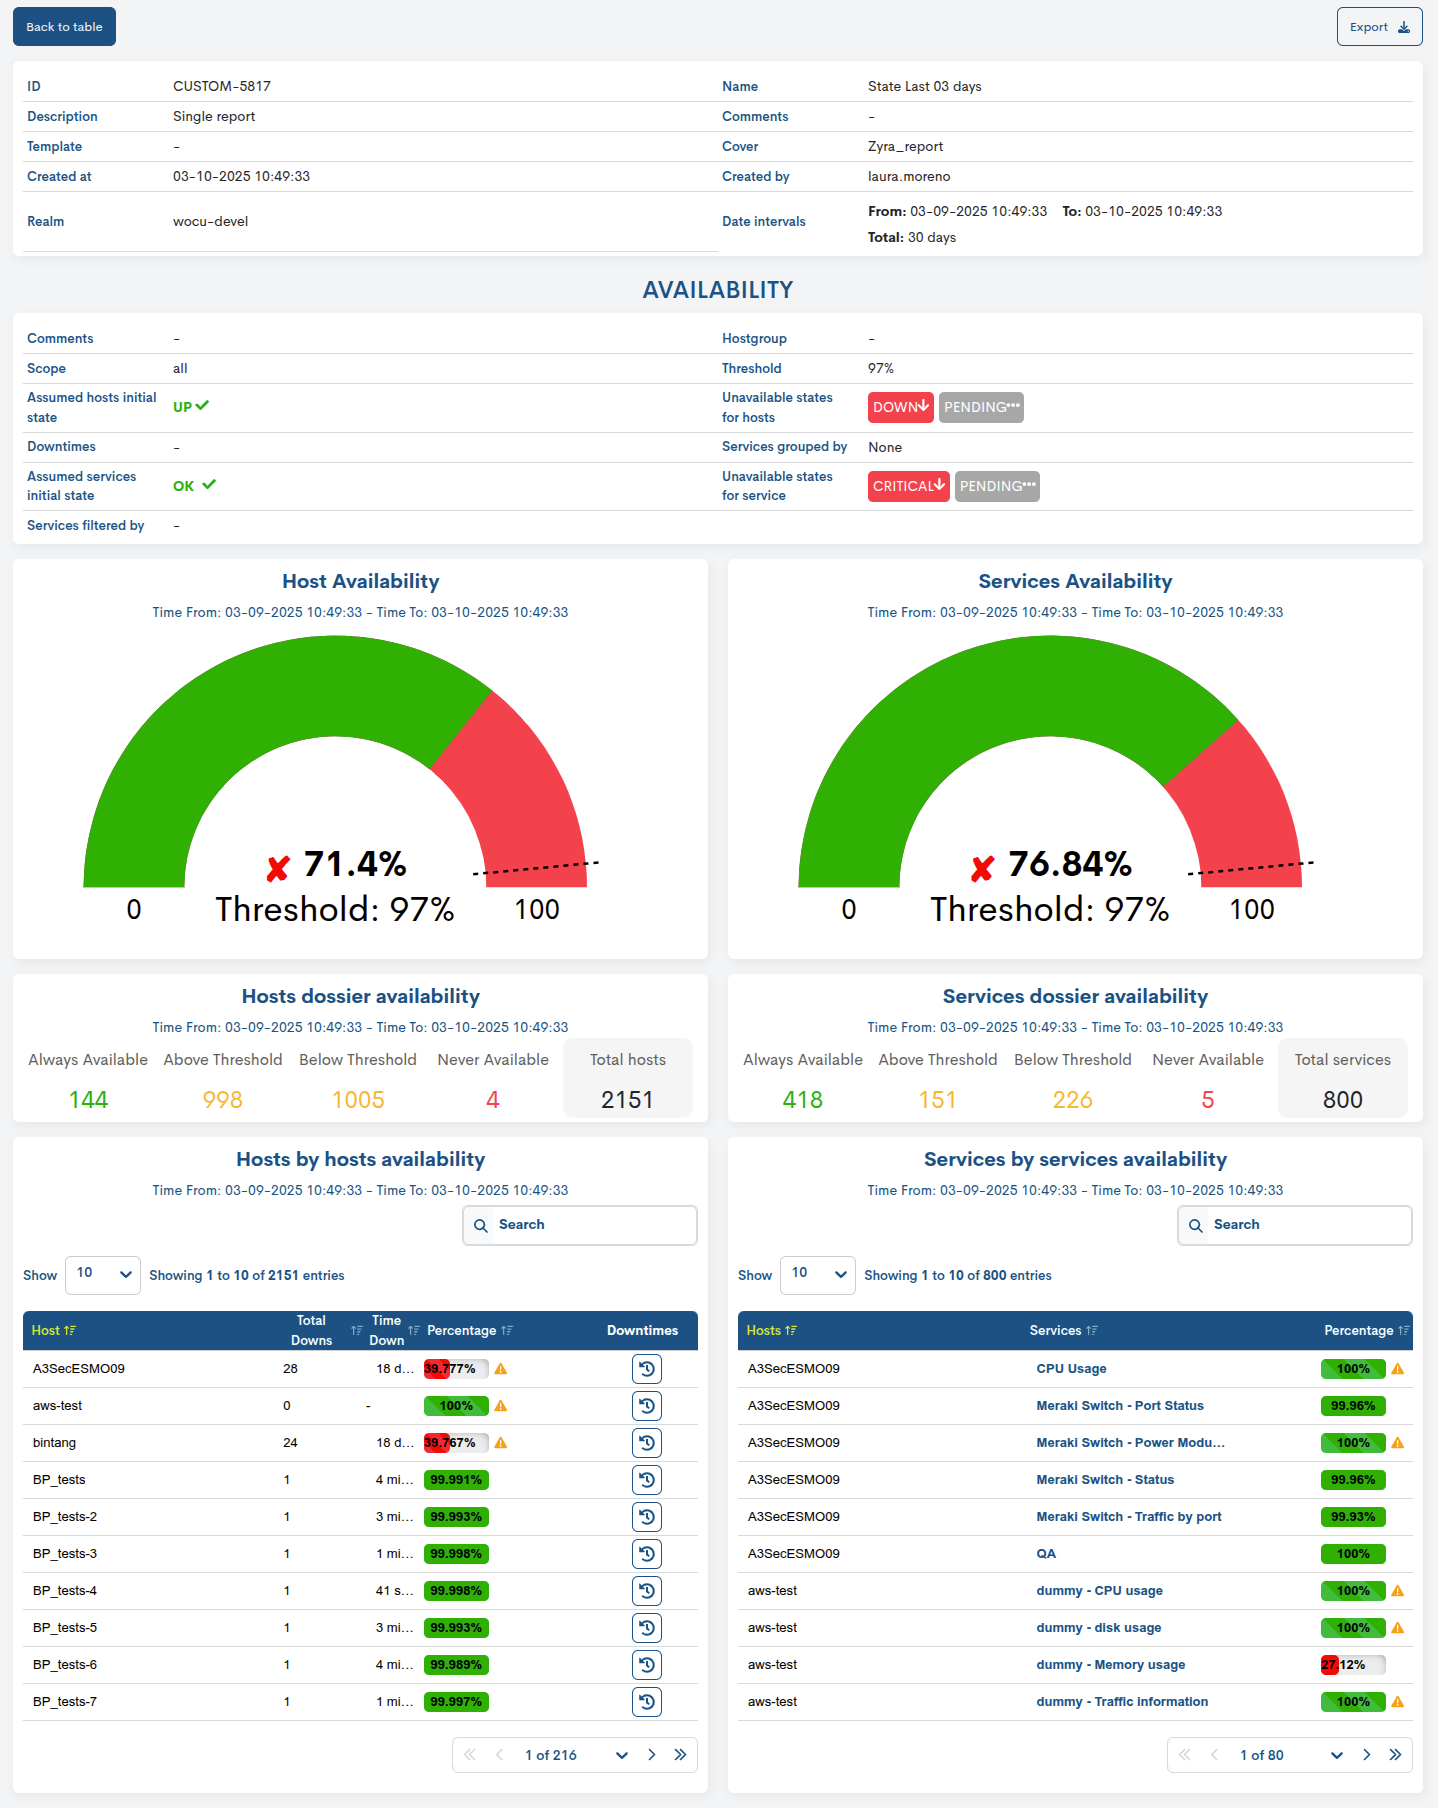
Global Availability Charts
the availability percentage calculated by WOCU-Monitoring for Devices and Services during the configured time period.
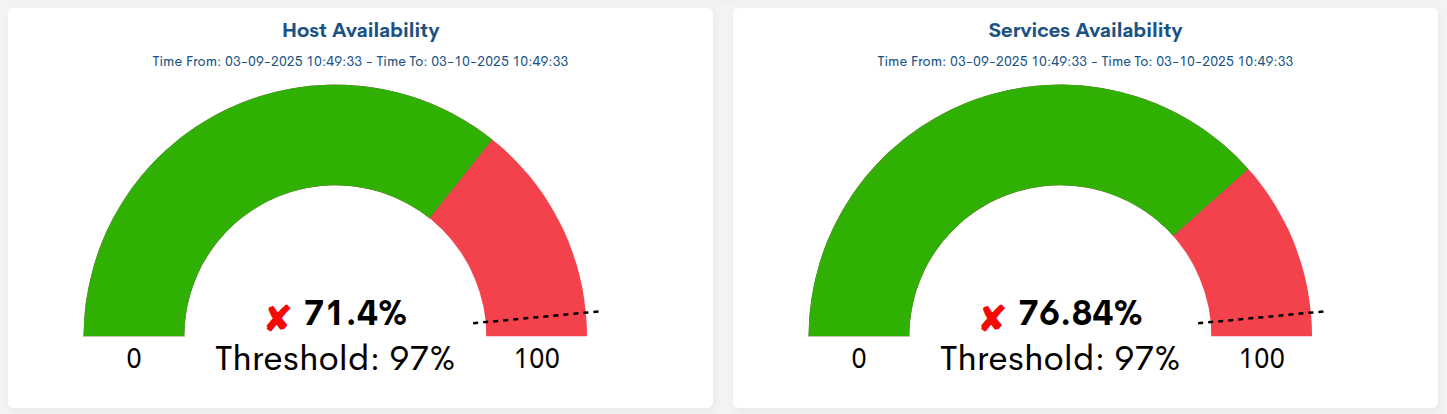
The green shaded area indicates the availability percentage reached. Within each graph, the corresponding percentage value is displayed, along with the user-defined threshold, which is also represented by a dashed line.
Depending on whether the established minimum availability threshold is met or not, a green ✓ will be displayed in front of the percentage when the availability exceeds the set value, or a red X otherwise.
En el ejemplo anterior, el porcentaje de disponibilidad de Dispositivos (71,4%) se encuentra por debajo del umbral configurado (97%). Lo mismo ocurre con el valor obtenido para Servicios (76,84%).
Note
If the Business Processes or All options have been selected in the Scope parameter, the panels will display, respectively, Device and Service Business Processes.
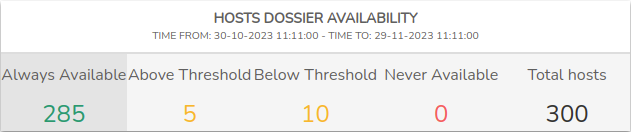
Availability Dossier Panels by State
In the third row of the Availability Report there are two panels that count the compliance status of the different Hosts (Hosts) and Services (Services) monitored. WOCU thus allows you to know how many have met the availability Threshold, set for the established period.
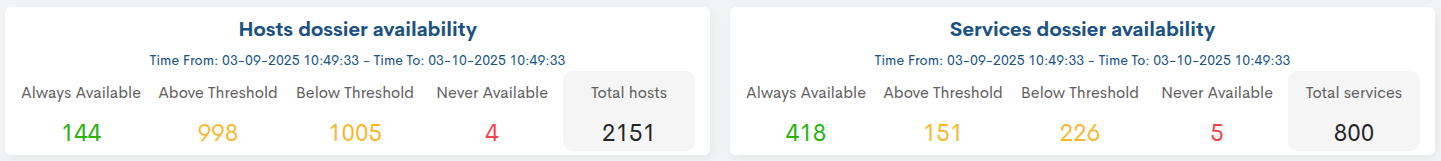
The compliance status of these panels is as follows:
Always Available
The green figure indicates how many of the assets have 100% availability.
Above Threshold
The yellow figure indicates how many of the assets have an availability below 100% but above the Availability percentage set in the Threshold.
Below Threshold
The orange figure indicates how many of the assets have an availability below the availability percentage set in the Threshold.
Never Available
The figure in red indicates how many of the assets have an availability of 0%.
Total Hosts/Services
The figure in black indicates how many assets of this type are monitored in WOCU.
This panel, in addition to serving the user as a numerical summary, also performs filter functions, which have effects on the fourth group of Availability Report panels: Availability dashboards by device and service. By clicking on the different availability compliance states, the following detail panel will display only the devices and services selected in this panel.
Note
If the Business Processes or All options have been selected in the Scope parameter, the panels will display, respectively, Device and Service Business Processes.
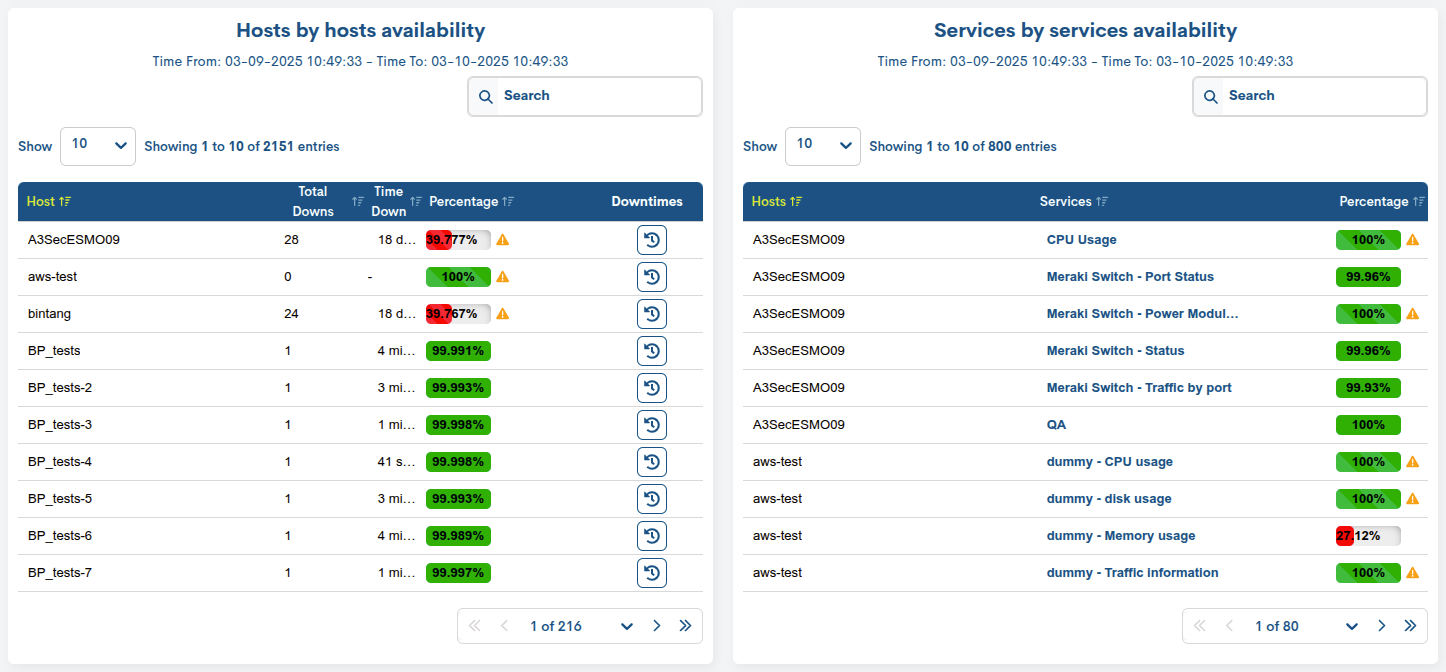
Availability dashboards by device and service
In the fourth row of the Availability Report are two panels that give detailed visibility on the availability of monitored hosts and services on an individualised and/or aggregated basis.
WOCU-Monitoring thus facilitates detailed availability analysisfor each element, and even allows the study and analysis of the degree of availability achieved for a certain type of service, thanks to the Services grouped by option discussed above.
Note
If the Business Processes or All options have been selected in the Scope parameter, the panels will display, respectively, Device and Service Business Processes.
Hosts by host Availability
This panel provides the percentage of availability for each Host. In this way, WOCU-Monitoring allows you to observe the detail of the availability of critical infrastructure elements or simply an individualized analysis of the elements.
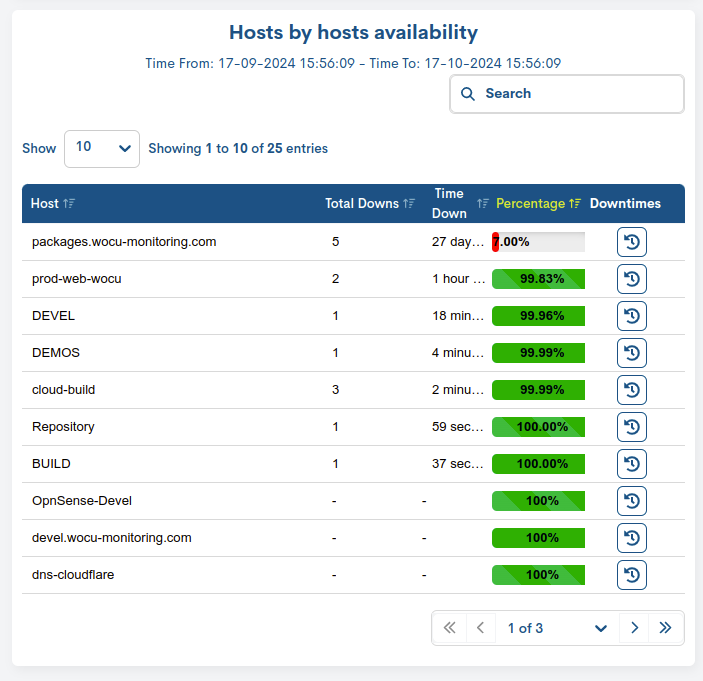
The detail panels have the following fields:
Hosts
Indicates the name of the host or service for which availability data is provided.
Total Downs
Indicates the total number of downs (loss of availability) suffered by a host during the set time frame.
Time Down
Indicates the total number of downs (loss of availability) suffered by a host during the set time frame.
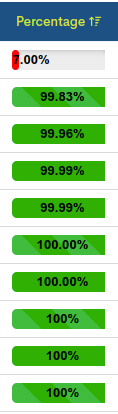
Percentage
Indicates the percentage availability value reached by the asset, in the time period set for the report. The field contains a bar that changes size and colour depending on the percentage of availability reached. In turn, the bar is complemented by the icon of an attention signal, when the initial status of the asset is assumed by the user.
Downtime
Clicking on any record in the Hosts table will pop up a new window with specific availability information about the host:
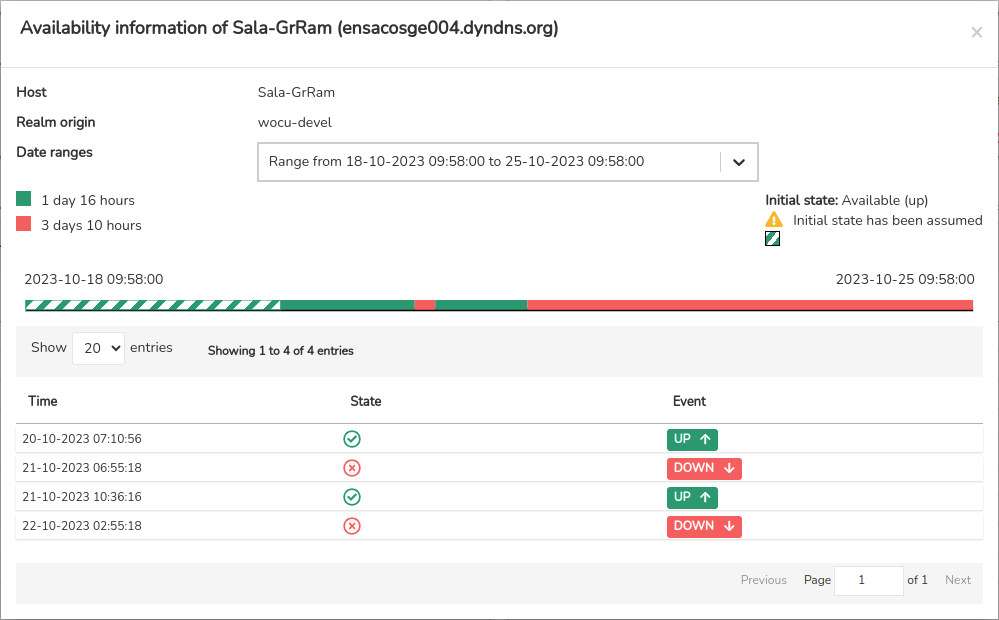
This window provides the following information:
✓ Host
✓ Realm origin: Realm in which the host is embedded.
✓ Date range: indicates the start and end date and time of the period configured for the collection of availability data. In the case of having configured several time frames, this field will display each of them.
✓ Time bar: which provides a history of the availability of the host over the established time range. A simple legend accompanies this graphical representation, informing the total time (given in days and hours) that the host has been available (in green) or unavailable (in red).
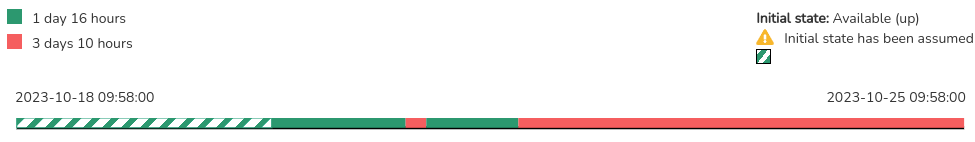
Along with the exact date and time at which this status was reached and recorded, the Initial State of the host is added.Remember that in the event that the system has not collected sufficient data to define the initial state, the user may assume and assign a starting state during the configuration of the report in the parameter Assumed initial state.
In this case, WOCU-Monitoring will indicate that the initial state has been assumed by the user with the text: ⚠ Initial state has been assumed. This situation will also be recorded and displayed in the time bar.
✓ Event history table: where the alternating states occurred during the defined time range. More information on states and associated colours in Statements of Assets in WOCU.
Each entry in the table shall contain the following information:
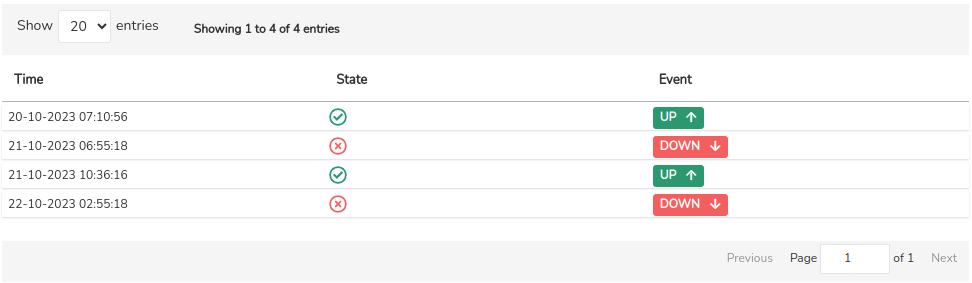
Time: details the exact date and time when a status change was recorded and therefore an event was generated.
State: Indicates whether the device is available (✔️ in green) or not available (❌ in red) for the date and time when a new status was recorded. Remember that unavailable states are configured by the user during report generation in the
Select unavailable states for hostsparameterEvent: Indicates the status that the system calculated for the device at the time of receipt of the event.
When there are Assets with scheduled downtimes and the Include Down Times has been checked during the report configuration, this view may change. We will illustrate this case with the following example:
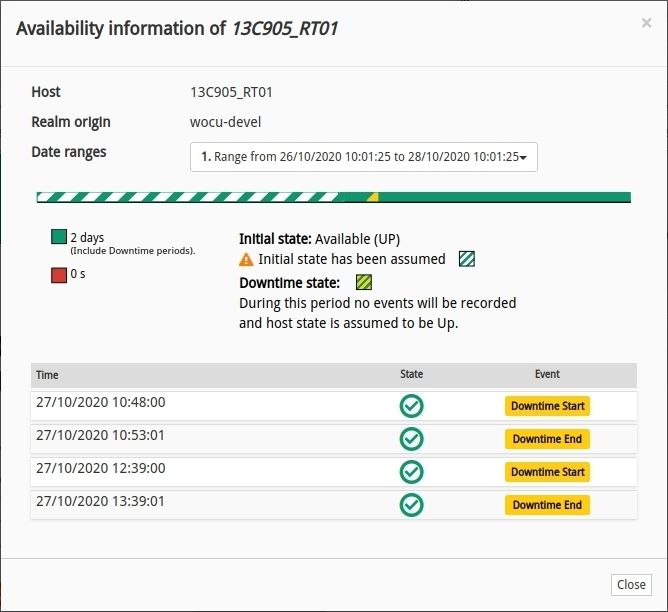
The scheduled downtime period(s) between one date and another, are also recorded and represented in the time bar. In order to identify this situation, the legend includes a new entry in the field that indicates the color code associated with said state, along with the following explanatory text: During this period no events will be recorded and host state is assumed to be UP >> During this period no events will be recorded and the state of the devices is assumed to be UP.
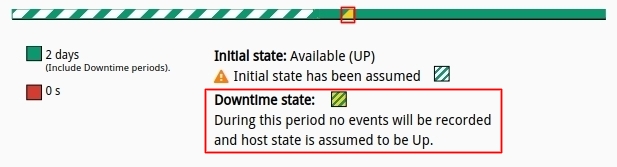
Important
Downtimes are included in the availability band (UP).
Finally, in the Event History Table where the alternation of states is recorded, the set of scheduled downtime periods occurring during the defined time range shall be listed.
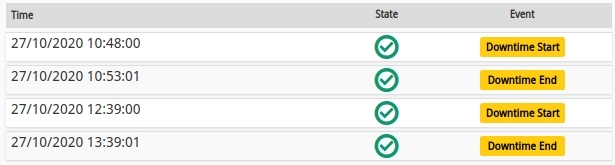
Each entry in the table shall contain the following information:
Time Column: date and time at which the start or end of the downtime period, and therefore of the event, was recorded. Thanks to the labels shown in the Event Column, we can identify whether the period starts (
Downtime Start) or ends (Downtime End).State column: indicates the optimum availability status of the host (✔️ in green). Remember that the down times are included in the total availability range (UP) of the host.
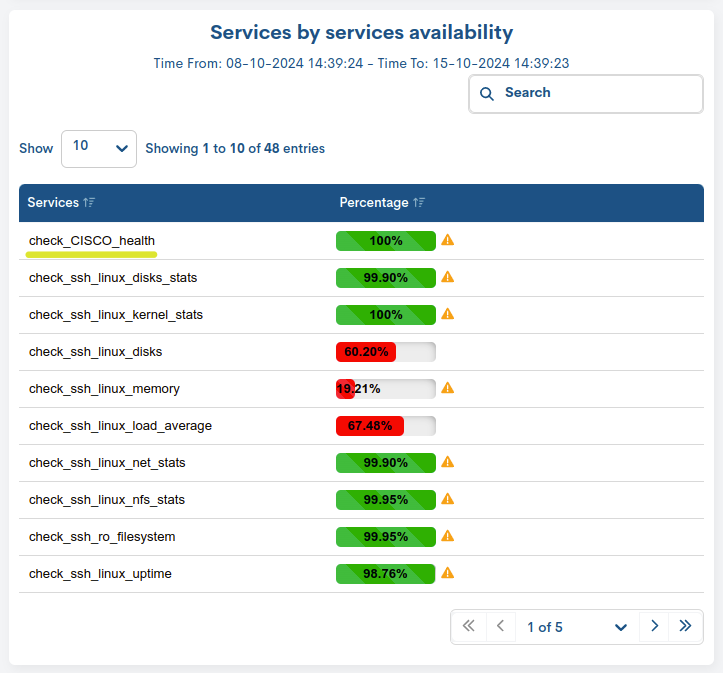
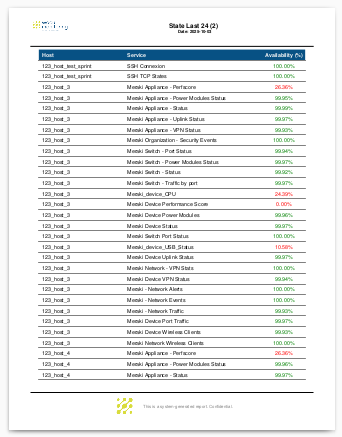
Services by service Availability
This panel provides the percentage of Availability for Services. Through this mode WOCU allows to observe the availability detail of critical infrastructure elements or simply an individualised analysis of the elements.
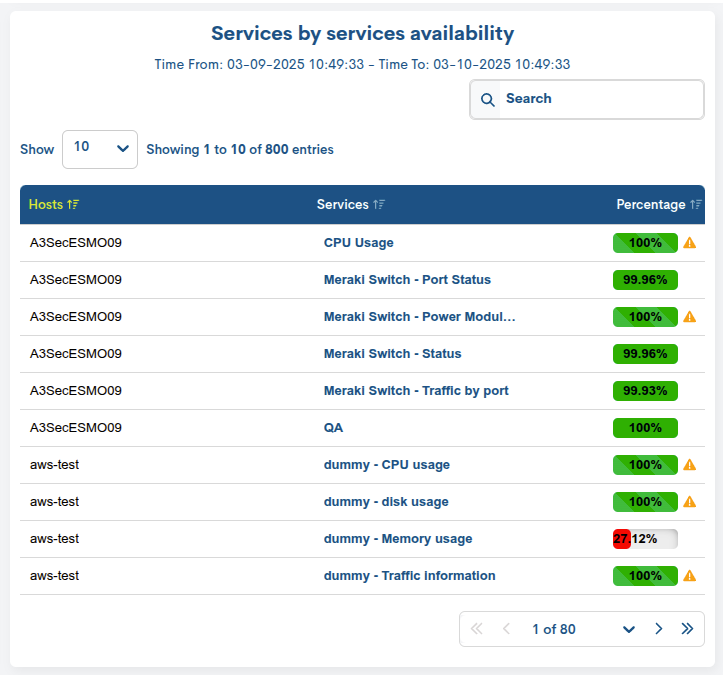
The detail panels have the following fields:
Hosts (optional)
Additionally, it is worth remembering that if the user uses the Group by filter with the None option, an additional Hosts** field will appear that will identify the device to which each listed Service belongs.
Services
Indicates the name of the host or service for which availability data is provided.
Percentage
Indicates the percentage availability value reached by the asset, in the time period set for the report. The field contains a bar that changes size and colour depending on the percentage of availability reached. In turn, the bar is complemented by the icon of an attention signal, when the initial status of the asset is assumed by the user.
Important
Clicking on any record in the Services table will redirect the user to the Detail view of Services and Business Processes.
Comments
Free text field to add comments, notes, or additional clarifications about the report.