User preferences
WOCU-Monitoring allows users to customize certain technical and display aspects through the User Preferences modal, accessible from the User Menu located in the top bar with all the Top Menu.
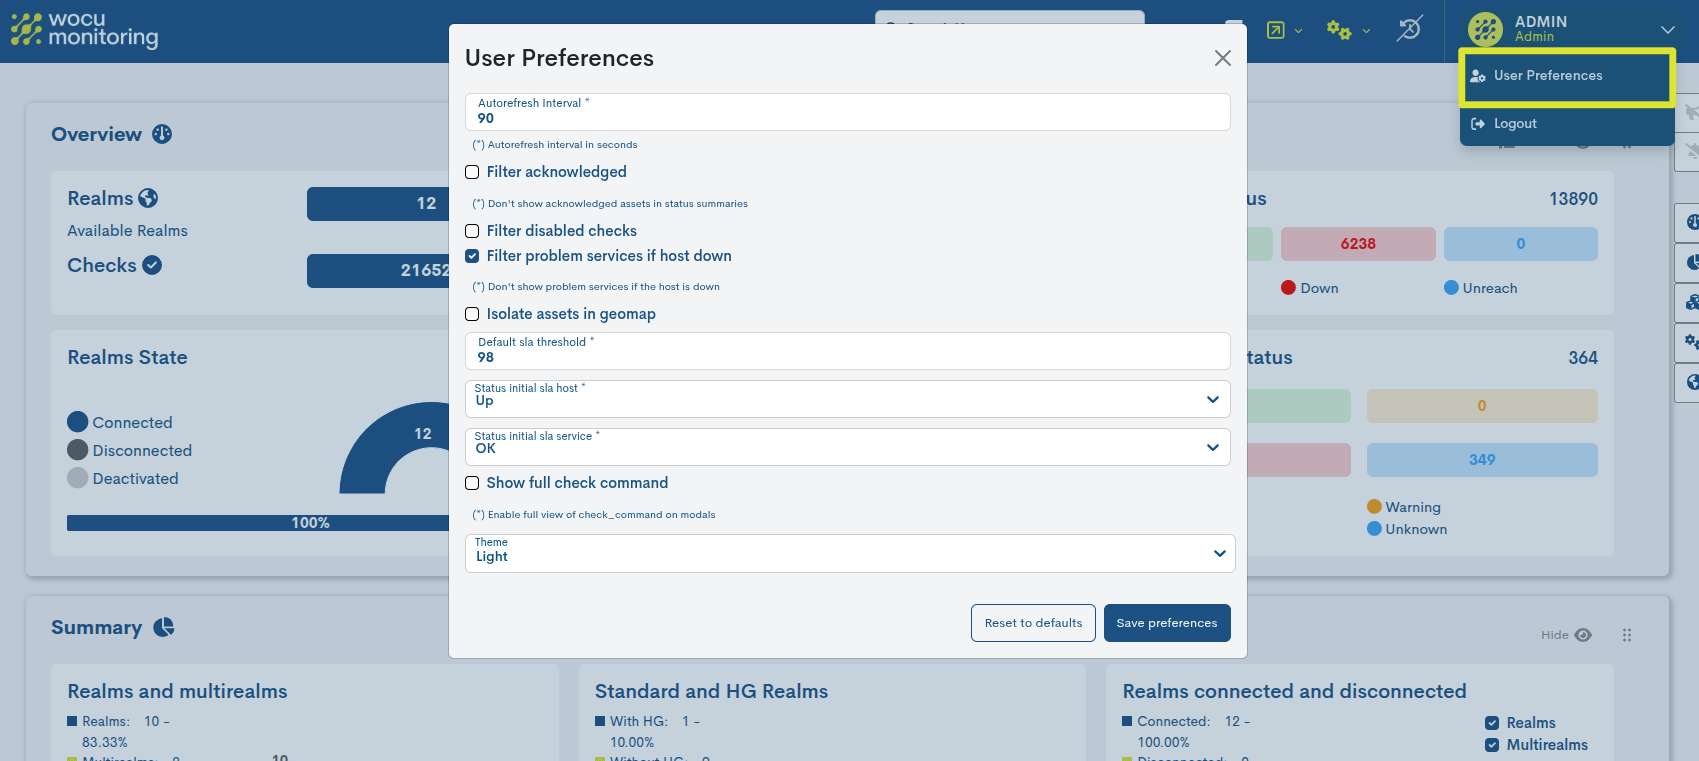
The possible options to modify are:
Autorefresh Interval
Allows the user to set the number of seconds that should elapse to refresh the data displayed in WOCU-Monitoring (if the corresponding option is enabled).
⇨ By default WOCU-Monitoring sets 90 seconds.
Filter Acknowledged status filter
This option allows filtering devices and services with alarms that are already known and assumed by the operator, and that for the time being will remain in the same situation. Therefore, when applying this filter, these elements will be recognised and therefore hidden, showing only those with more serious alarms. In this way it will be easier to know in advance which alarms have already been dealt with and which have not. Acknowledgement is a common task in the daily operation of alarm handling in WOCU-Monitoring.
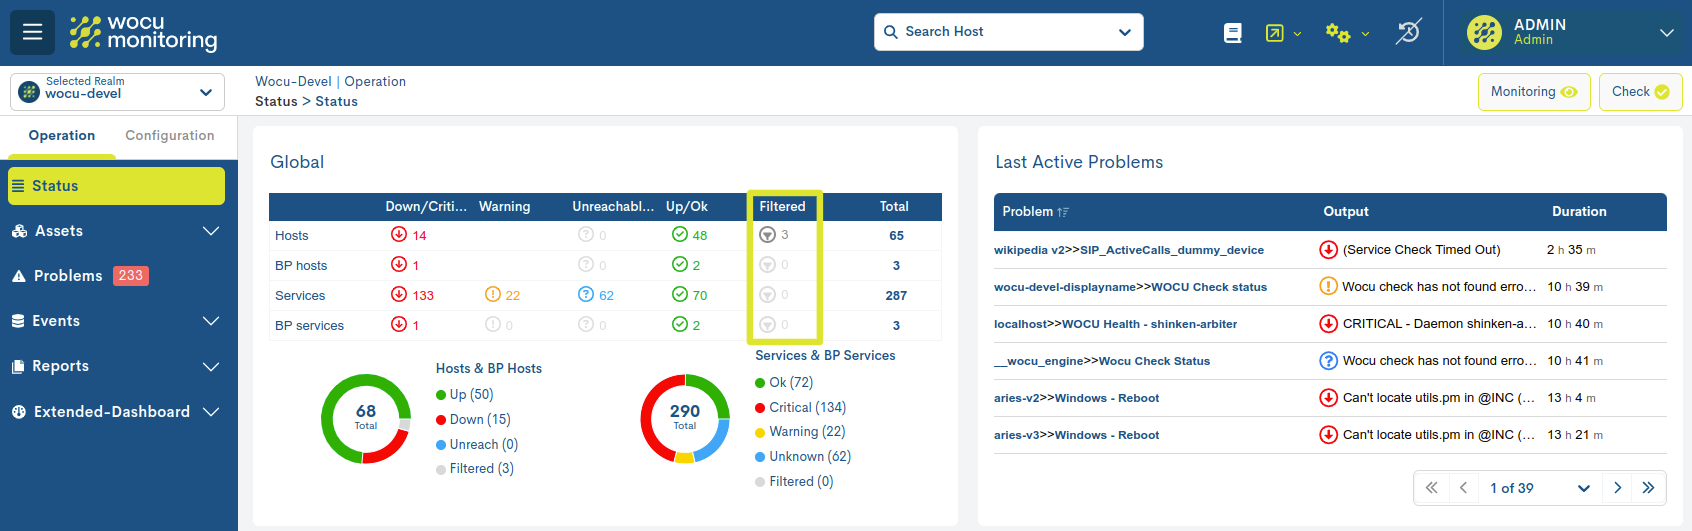
Enabling this filter may affect the data expressed in the panels of the Status.
Additionally, (and after activating this filter), in the Global of the Status, in the Filtered column, those items for which the Apply acknowledged to Host action has been selected will appear.
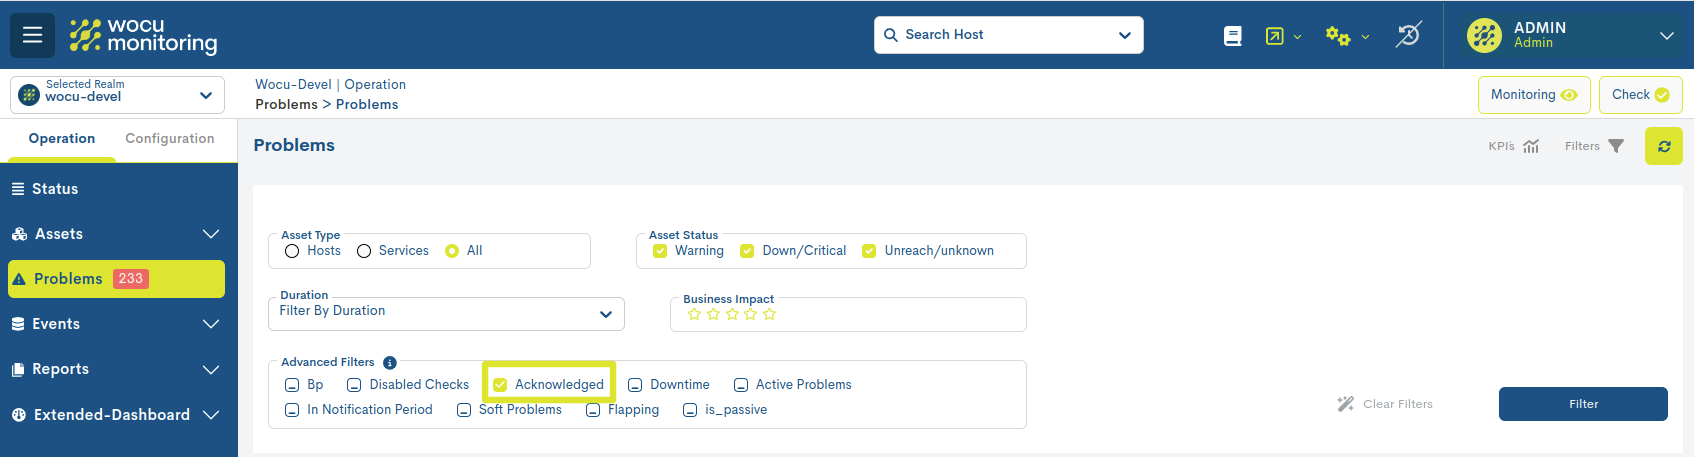
In addition this option can be modified within the tabs Problems and Assets. Activating this filter will not show in the list the assets where the user has applied the recognition action.
⇨ By default this filter is disabled in the user preferences.
Filter Disabled Checks
WOCU-Monitoring performs checks to assess the operational status of hosts and services, but it allows temporarily disabling this execution. By enabling this option, hosts and services with disabled checks will not be displayed in the Problems or in the Status summaries.
Additionally, (and after activating this filter), in the Global of the Status, in the Filtered column, those elements for which the Disable active checks action has been selected will appear.
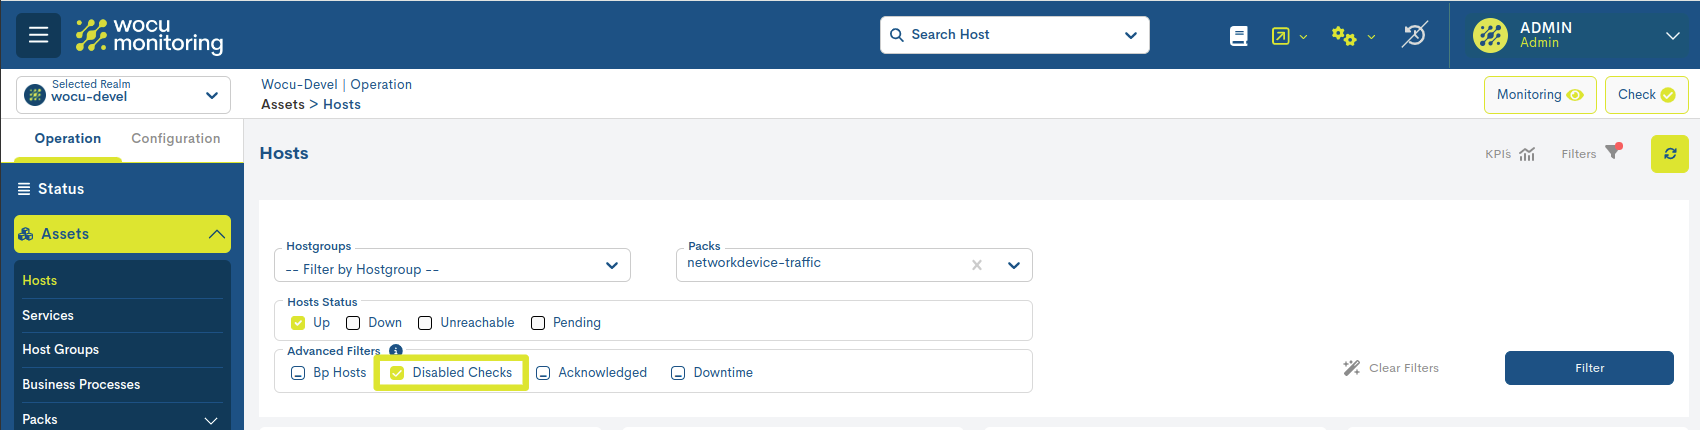
In addition this option can be modified within the tabs Problems and Assets. Enabling this filter will not show in the list assets for which the user has disabled the check task.
⇨ By default this filter is disabled in the user preferences.
Filter Problem Services if Host Down
By selecting this checkbox, the tool will only display services that are down while the associated host is operational. If the host is down or unreachable, its associated services will not be displayed. This avoids showing redundant information, as the host’s alert is sufficient.
This filter will affect the data displayed in:
Tab Status:
Global: a Filtered column will appear, when this option has been enabled and there are items in these conditions.
List of alarms on monitored assets: in this list of alarms, the filtered services will not be displayed.
⇨ By default this filter is enabled in the user preferences.
Isolate Assets in Geomap
By activating this checkbox, assets represented on geomaps that are geographically close will not be grouped.
On the other hand, those that share an exact location or are extremely close are unified, as they cannot be shown at the same time without overlapping each other, which would make it difficult to locate them on the geomap. For a clear visualisation it is recommended to use the zoom options available in the geomaps.
Filter not activated:
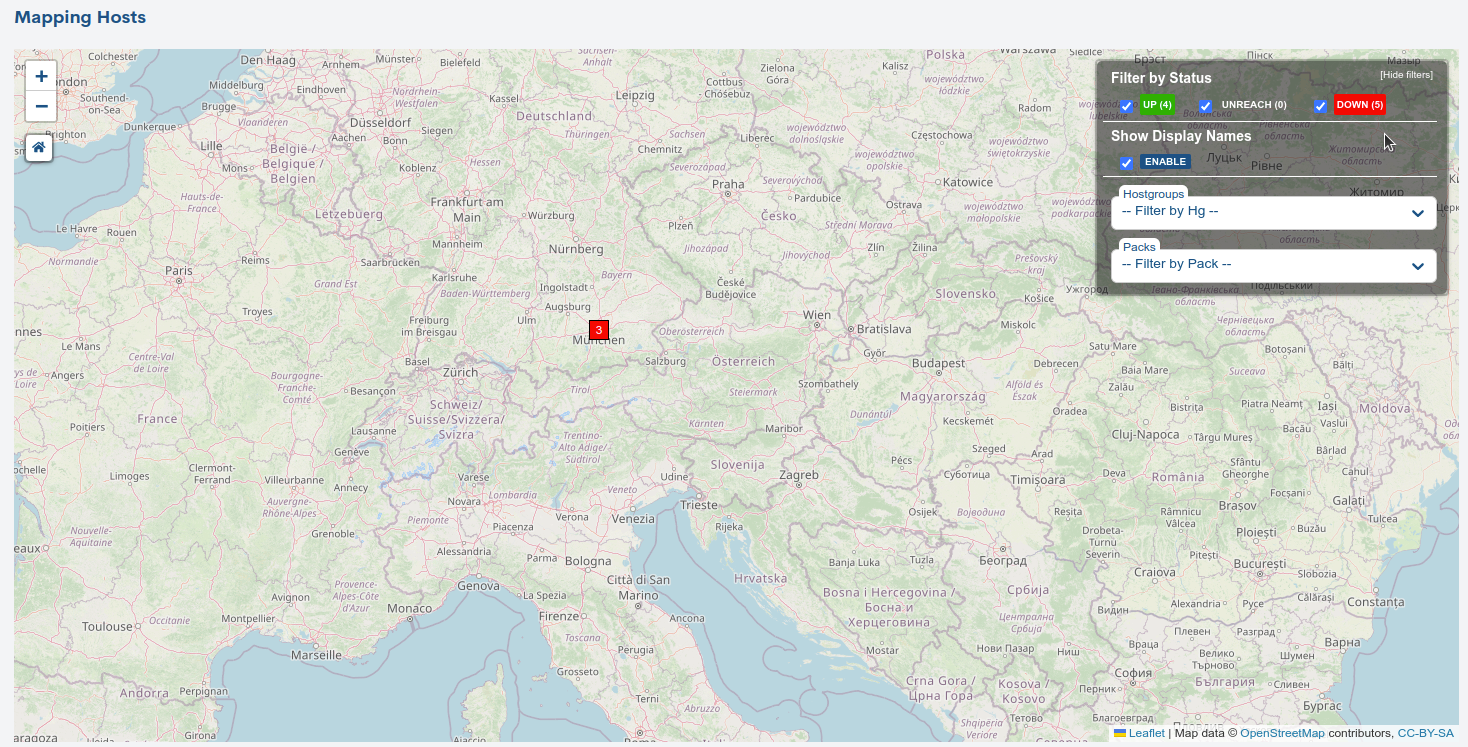
Activated filter:

⇨ By default this filter is disabled in the user preferences.
Default sla threshold
Through this option the user can set the minimum threshold value (in percentage) for the fulfilment of the Service Level Agreement (SLA).
Click on the up and down arrow icons to the right of the threshold percentage. Each click will add or subtract one unit to the threshold percentage.

In the creation and configuration of Availability Reports, there is a Threshold field, where the value set in this section can be modified.
⇨ By default this parameter is set to a value of 98.
Status Initial SLA Host
It may be the case that not enough data has been collected to determine the initial state of a Host. This option allows the user to assume and assign the initial state that WOCU-Monitoring has not been able to ascertain.
The possible states are:
Down
UP
Unreachable
Current state
Note
This user decision is represented in the panel Availability, of the Detail view of Services and Business Processes.
⇨ By default the predefined initial state is UP.
Status Initial SLA Service
As with hosts, there may also be a lack of data to determine the initial status of a Service. This option allows the user to assume and assign the status that WOCU-Monitoring has not been able to ascertain.
The possible states are:
OK
Warning
Critical
Unknown
Current state
Note
This user decision is represented in the panel Availability, of the Detail view of Services and Business Processes.
⇨ By default the predefined initial status is OK.
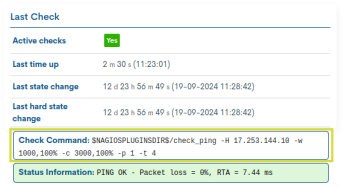
Show full check command
Through this option, the user can enable the full view of the Check Command executed to determine the status of the Service, in the Last check information panel of the Detail view of Services and Business Processes.
Due to the sensitive data that this command may display, the parameter will be disabled by default.
Remember
Check Command is a service definition argument. It is an internally executed operation to check the status of a specific parameter you want to know about an asset (CPU, hard disk space, RAM used, etc.).
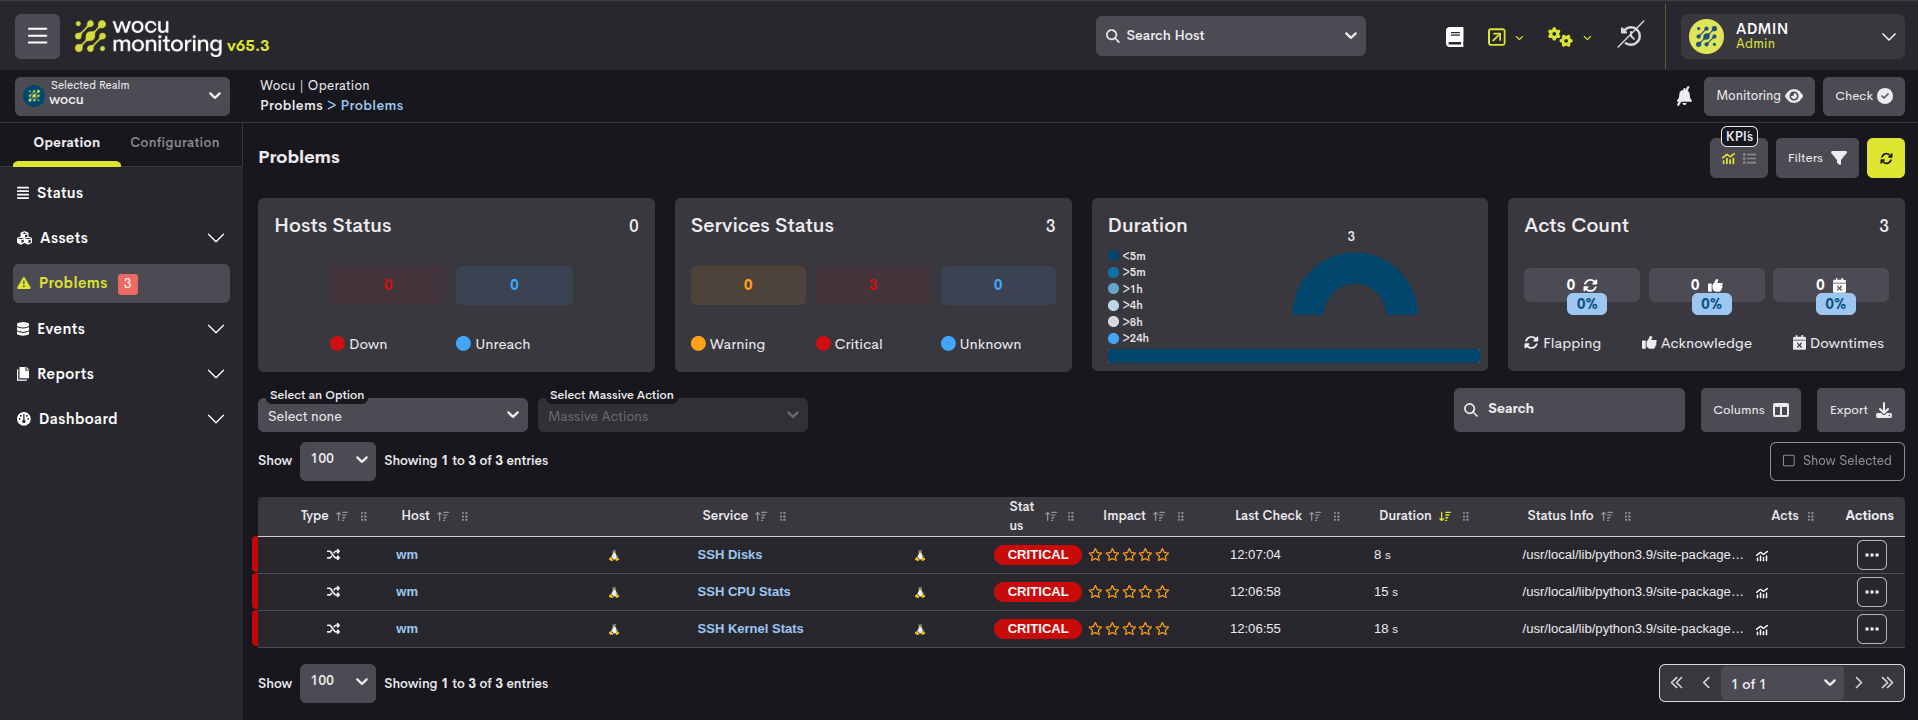
Theme Selector
This selector allows the user to customize the appearance of the interface by choosing between two available themes:
Light: Light theme, provides a standard display and is implemented by default.
Dark: Dark theme, designed to reduce eye strain.
When you select a theme other than the active one, the application automatically reloads the interface to apply the changes.
Additionally, the chosen mode is stored in the user preferences, so it is retained in future sessions.
Attention
This option will not be available to customers who already have their own corporate theme applied.
Selector del formato fecha y número (Date and number format)
Este selector permite al usuario definir el formato en el que el sistema mostrará las fechas y los valores numéricos en toda la interfaz de WOCU-Monitoring.
Esta configuración es útil para adaptar la visualización de la información a las convenciones regionales más utilizadas a nivel internacional. Cada formato combina un estilo de fecha y de números determinado.
Al desplegar la lista de opciones, se muestran los siguientes formatos predefinidos:
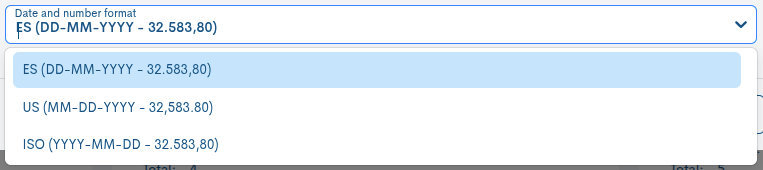
Formato ES (España / Europa): este formato sigue las convenciones habituales en España y la mayoría de países europeos continentales.
- Formato fecha:
DD-MM-YYYYEjemplo: 25-03-2025
- Formato número:
Separador decimal: coma (,)
Separador de miles: punto (.)
Ejemplo: 32.583,80
Formato US (Estados Unidos): es el formato estándar utilizado en Estados Unidos y otros países anglosajones.
- Formato fecha:
MM-DD-YYYYEjemplo: 03-25-2025
- Formato número:
Separador decimal: punto (.)
Separador de miles: coma (,)
Ejemplo: 32,583.80
Formato ISO: este formato es recomendado para documentación técnica, estándares internacionales y sistemas que requieren ordenación cronológica fiable.
- Formato fecha:
YYYY-MM-DDEjemplo: 2025-03-25
- Formato número:
Separador decimal: punto (.)
Separador de miles: coma (,)
Ejemplo: 32,583.80
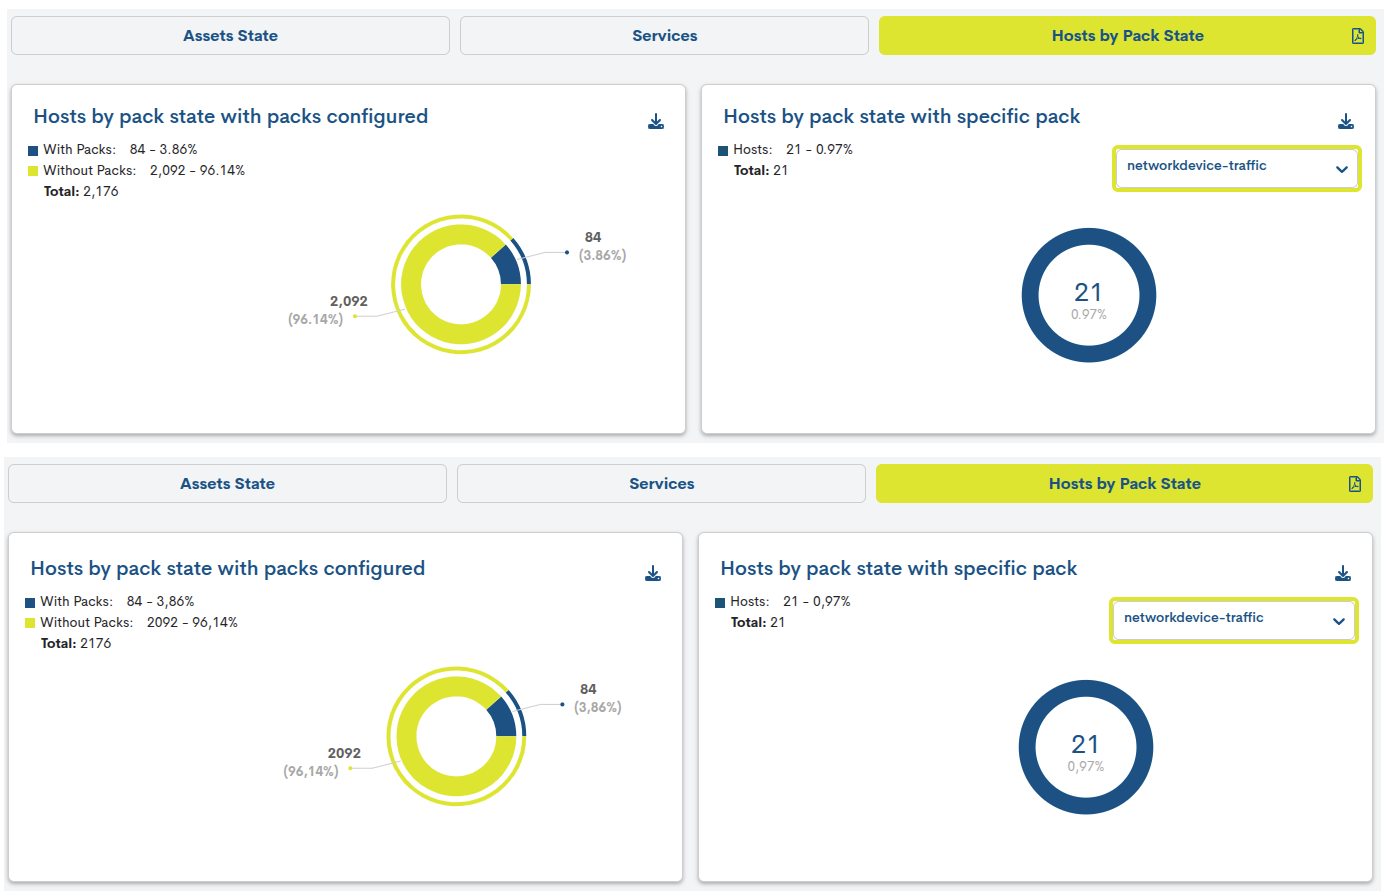
Algunos ejemplos dentro de la aplicación:
Formato fecha US/ES:
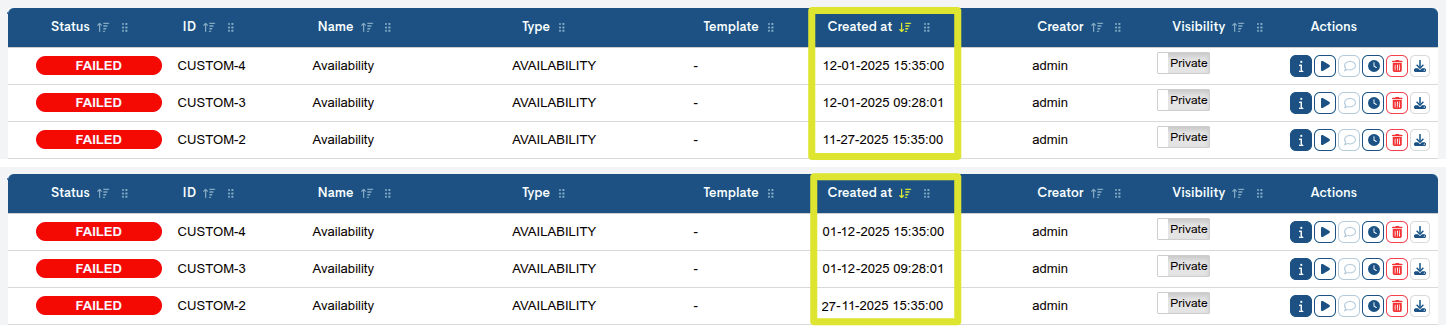
Formato número US/ES:
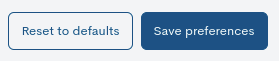
Finally, once all the filters and parameters in the User Preferences have been configured, you must save the changes by clicking the blue button Save Preferences to make the established configuration effective.
If for any reason you would like to return to the default settings, you can reset the initial values by pressing the Reset to Defaults button.
Important
User preferences are applied globally across the platform. Any configured changes will affect all realms and assets monitored by WOCU-Monitoring, without exception.