Home
The Home screen provides an overview of all monitored Realms. This is also the usual starting point in WOCU-Monitoring when accessing its environment and the starting point for navigation between its different screens.
Remember
A Realm is a completely independent monitoring system, organised and managed by the system. Each Realm will have its own monitored assets, over which the tool will maintain in isolation: inventories, problems, event logging, metrics calculation, report generation, etc.
This screen is divided into the following main blocks:
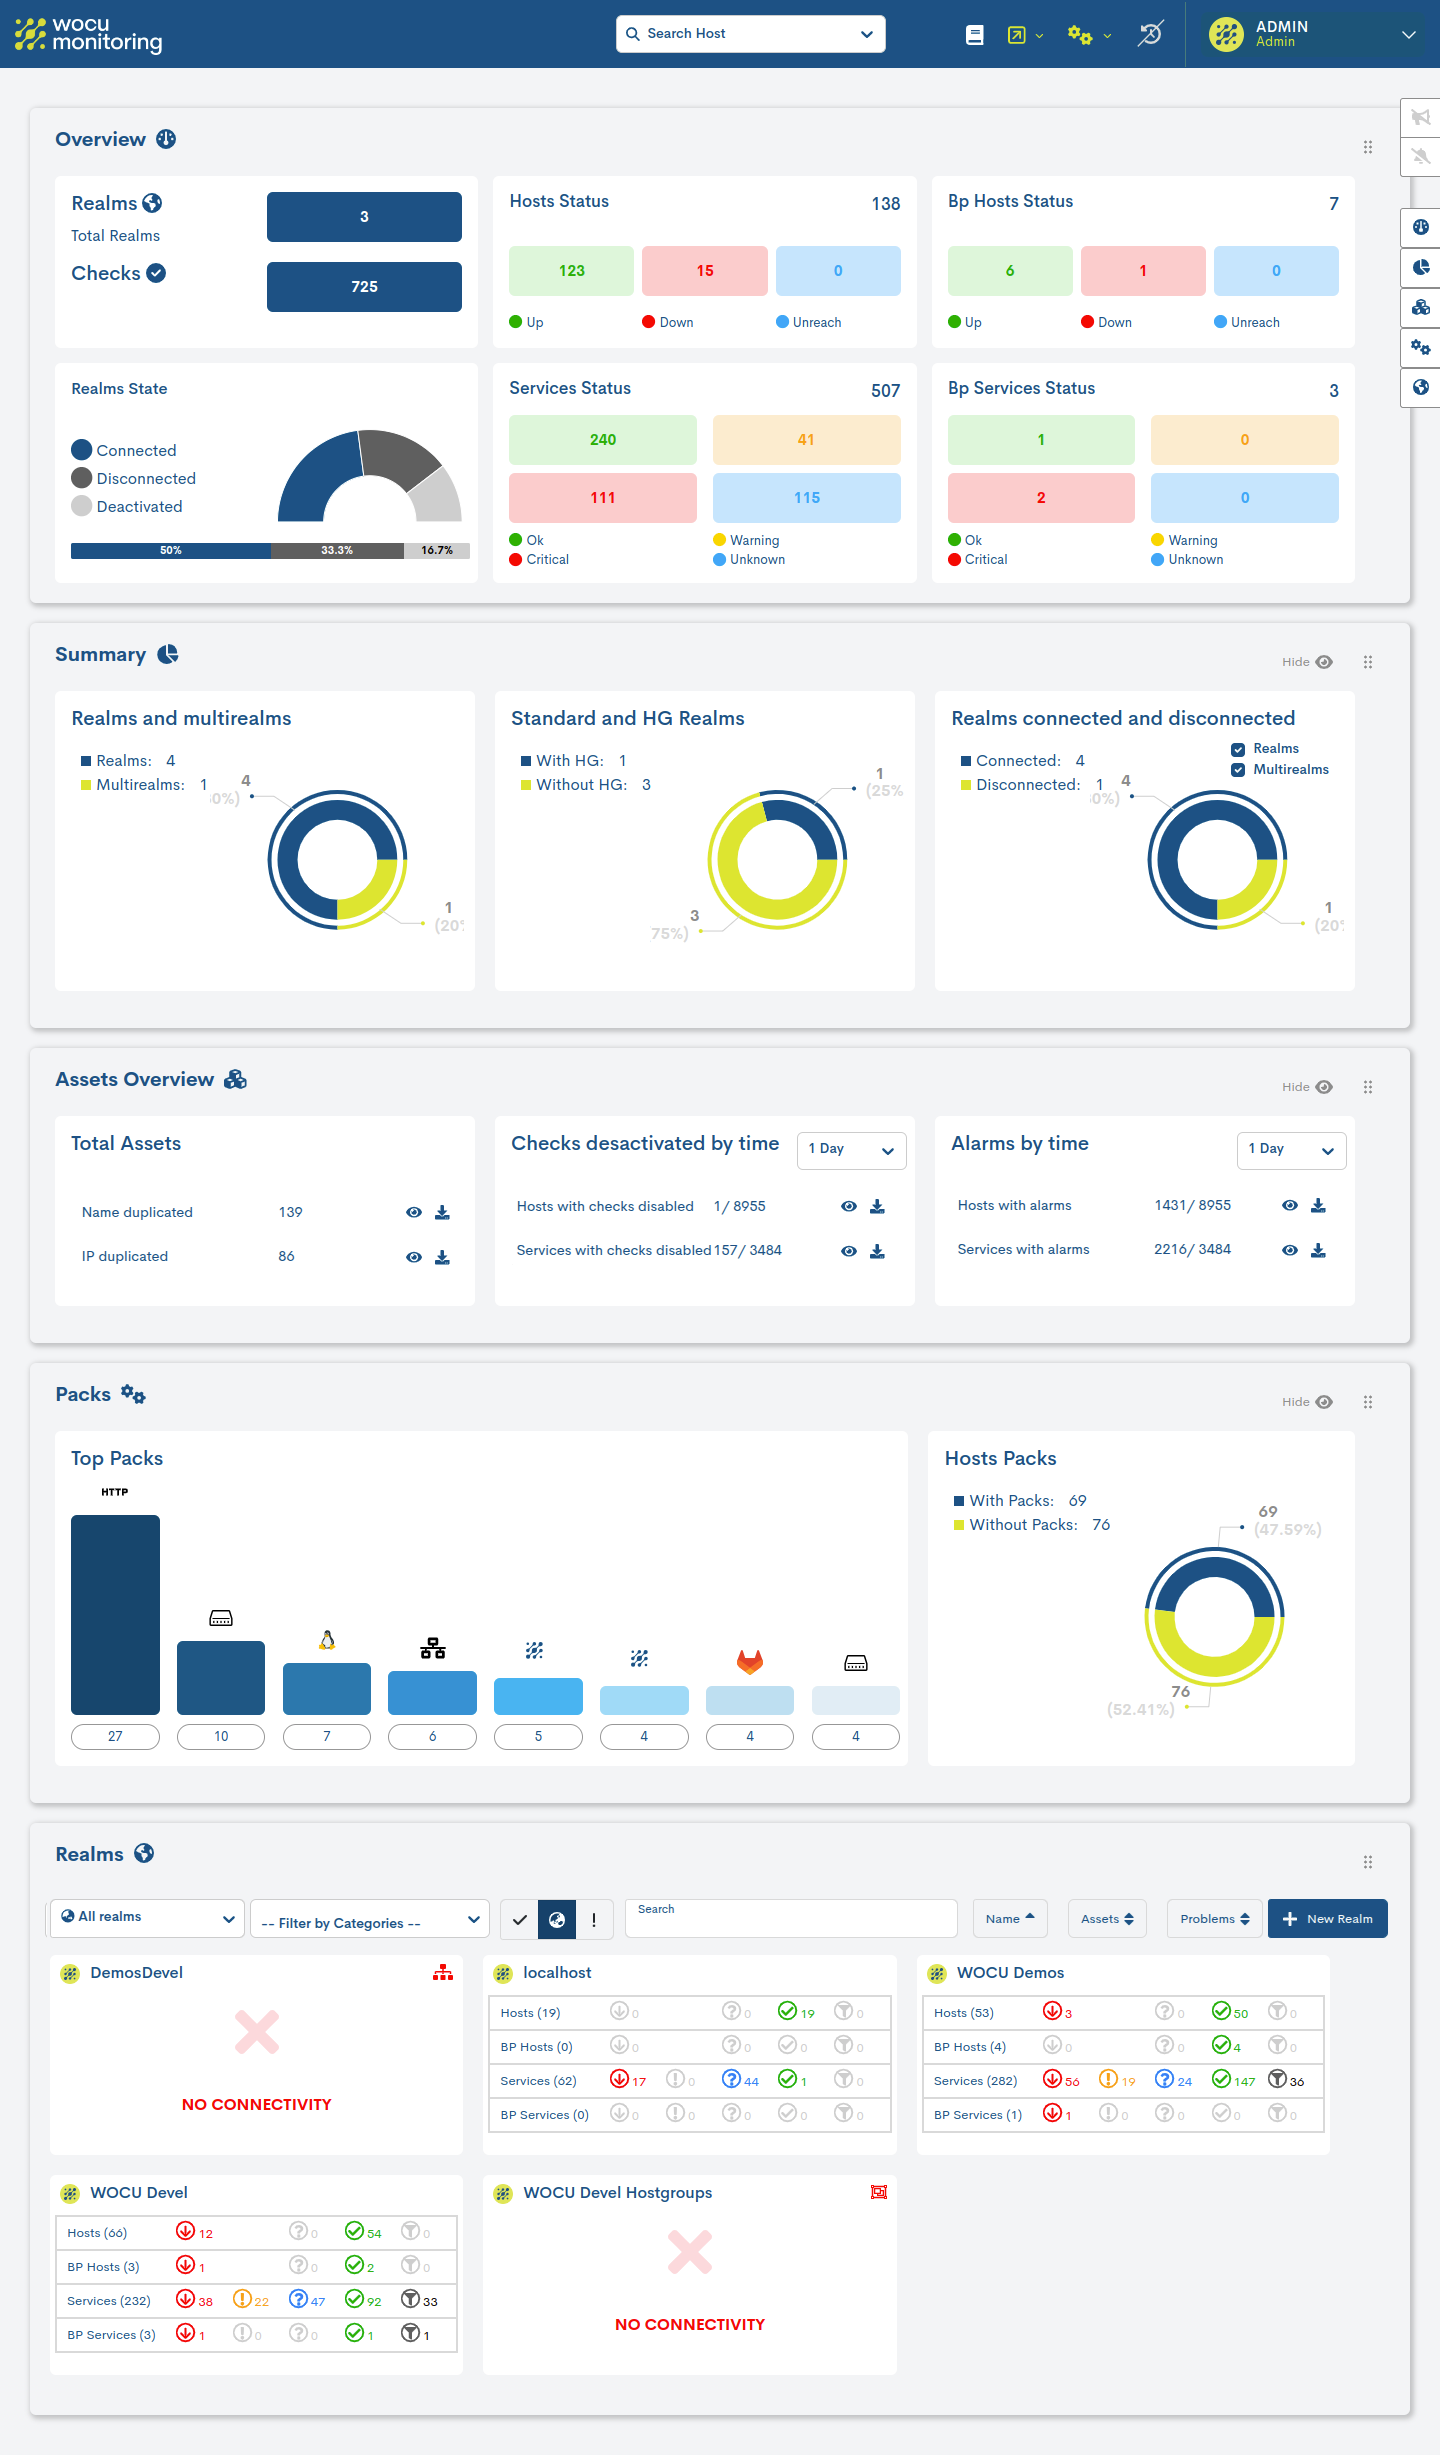
Overview
This space displays, as a summary, a series of panels with numerical data and related information about monitored realms and assets.
The following presents each of the panels:
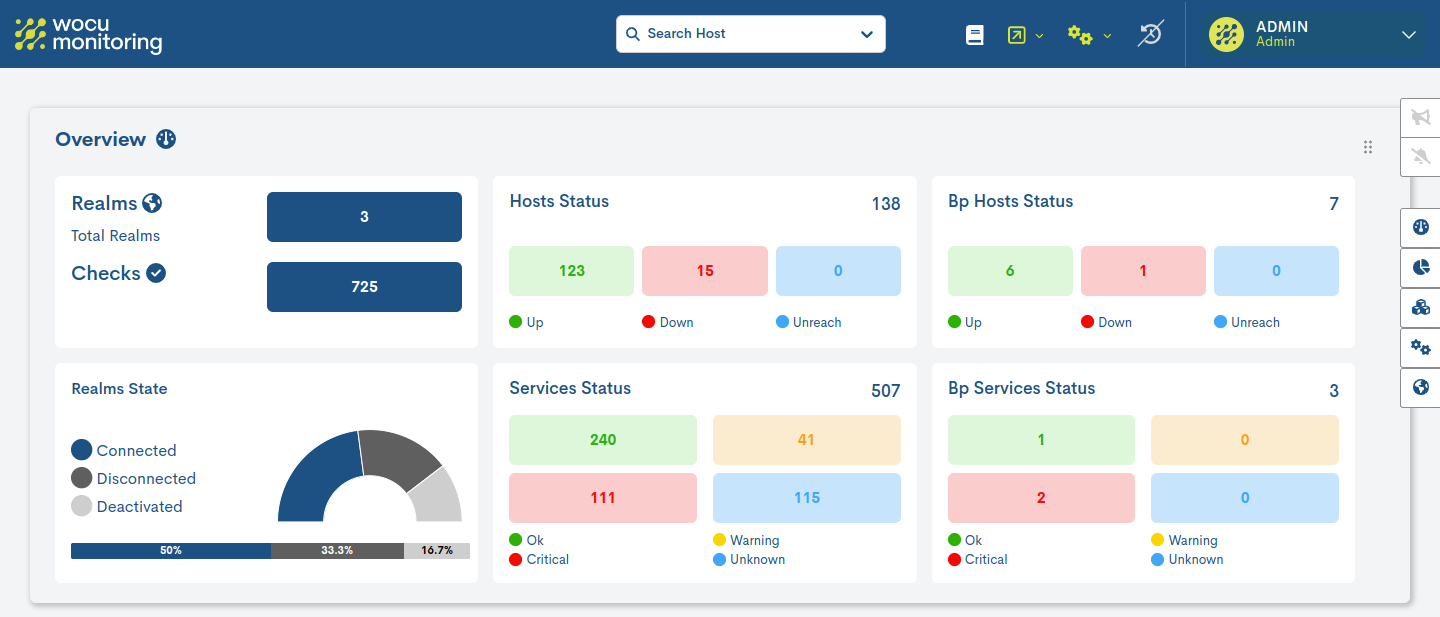
Realms y checks
Realms
Total number of independent monitoring systems (Realms) under WOCU-Monitoring.
Checks
Total number of checks performed by WOCU-Monitoring, i.e. the sum of all Hosts and Services.
Realms State
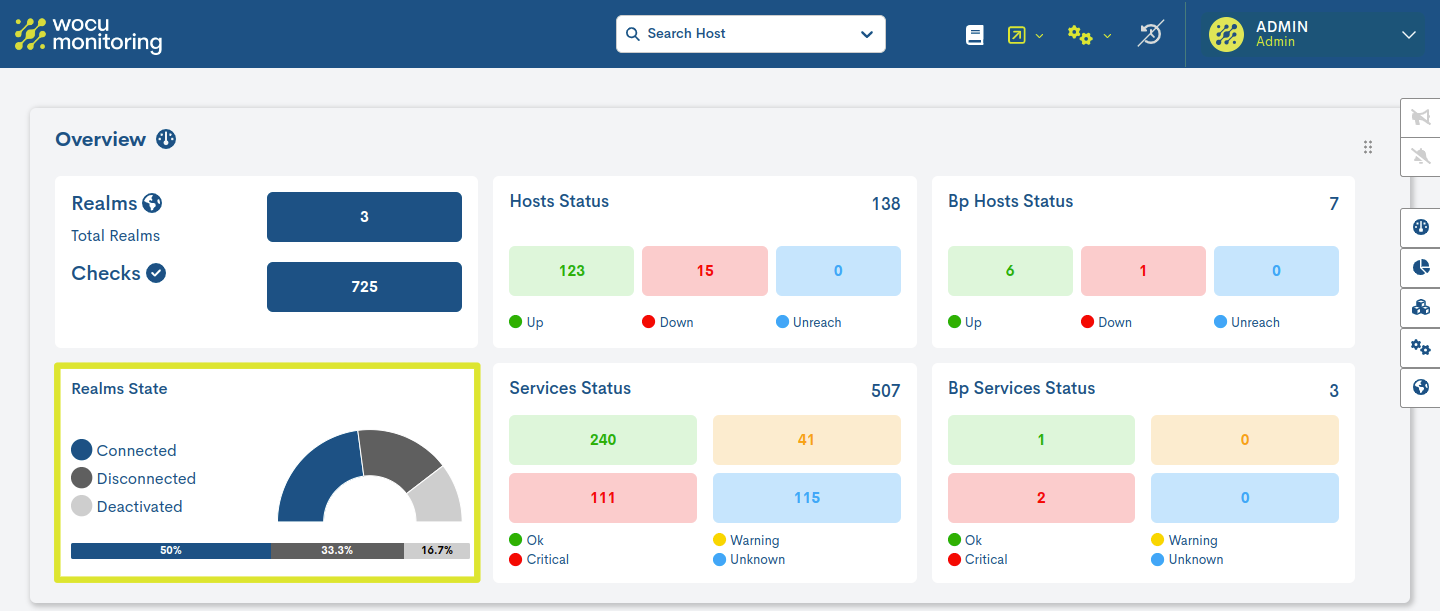
Panel with information about the current connectivity status of the realms managed in WOCU-Monitoring.
Connected: realms that are available and accessible to the user.
Disconnected: realms that are not responding despite beingconfigured, and therefore, are inaccessible to the user.
Deactivated: realms intentionally deactivated by the administrator.
The information is presented using two visual resources:
Pie chart: to visualize the proportion and quantity of realms that are in each of the possible connectivity states.
Percentage bar: to represent the percentage of realms in each of the possible connectivity states.
Count by asset type and monitoring status
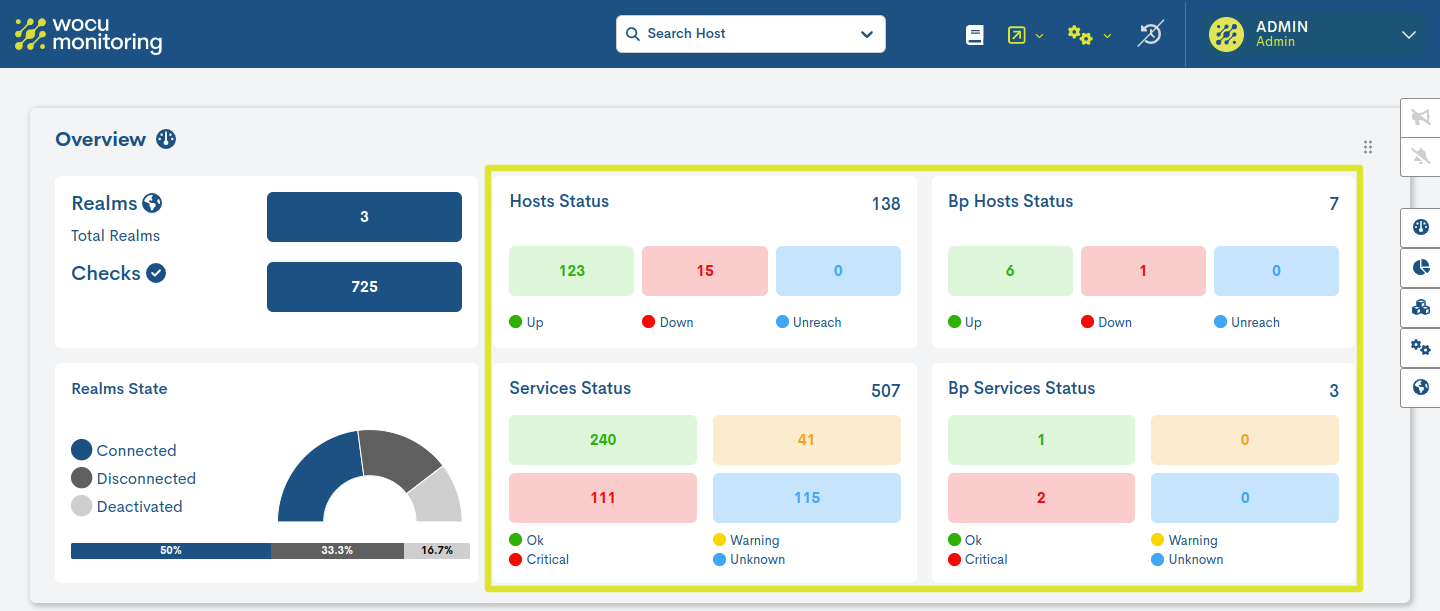
A set of four panels, each associated with a type of monitored asset:
Hosts Status
BP Hosts Status
Services Status
BP Services Status
Each panel displays:
Total number of monitored elements of each type.
In separate blocks, the number of elements in each of the monitoring states defined by WOCU-Monitoring is recorded.
Summary
This view is divided into three widgets whose graphics illustrate the different typologies of realms (that are being managed in the system) and its connectivity.
Important
This section only counts the realms to which the user has access.
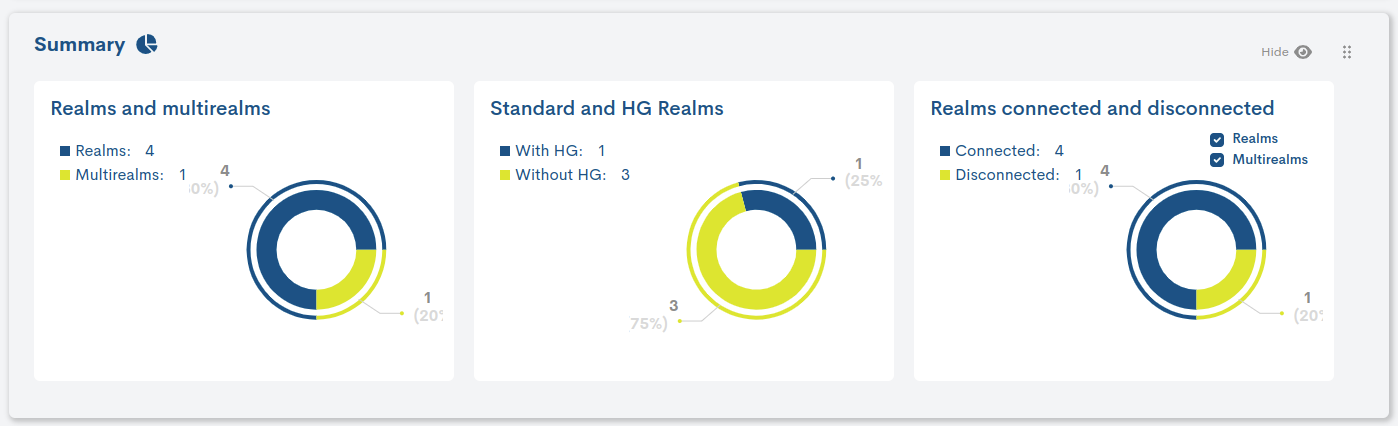
The following presents each of the panels:
Note
Those widgets are taken from Aggregator Summary.
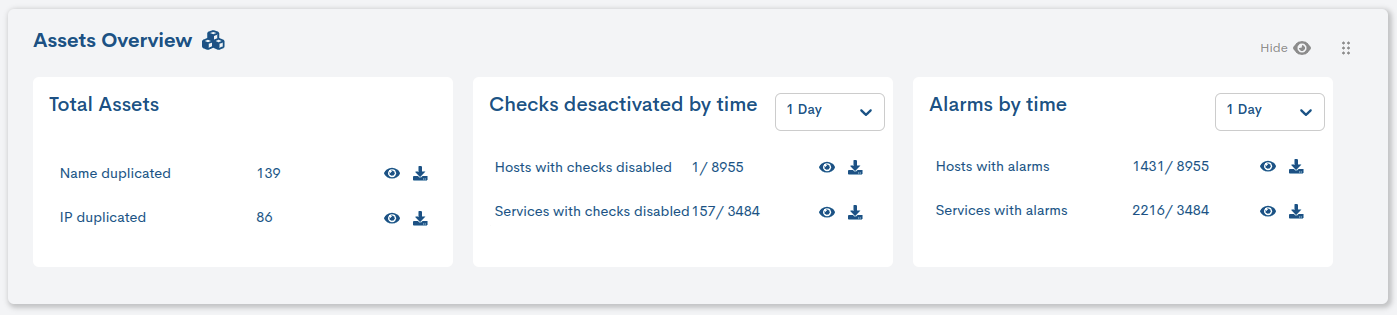
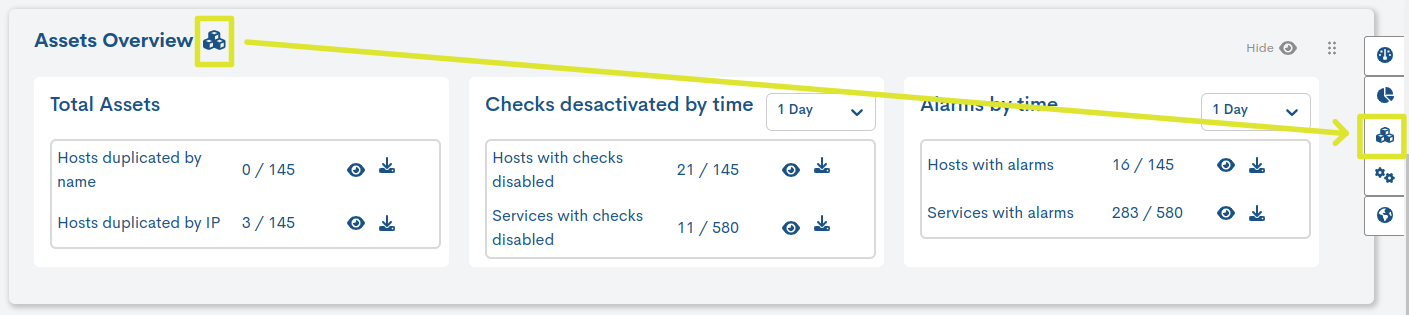
Assets Overview
This space helps to quickly identify problems related to duplicate assets, deactivated checks and alarms registered in the system.
The following presents each of the panels:
Total Assets
This widget provides a summary about asset duplication in the system. The parameters displayed are:
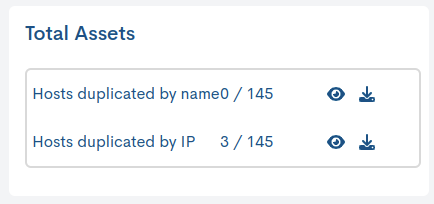
Name duplicated: Indicates the number of duplicate devices based on their name.
IP duplicated: indicates the number of duplicate devices according to their IP address.
Each parameter includes two additional options:
Eye icon: Allows you to see a detailed breakdown of assetsduplicated. More information in: Tops 5 Hosts duplicated by Name and Tops 5 Hosts duplicated by IP.
Download icon: offers the possibility to export the list of duplicated to a CSV or JSON file for external analysis.
Checks desactivated by time
This widget displays the assets (devices and services) in which themonitoring checks are disabled.organized according to a configurable time period (1 day, 7 days, 15days and 30 days).
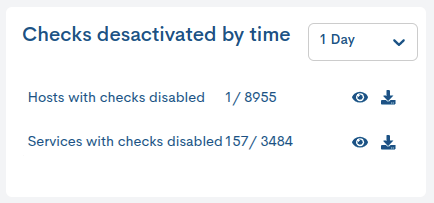
Hosts with checks disabled: Number of devices that have the checks disabled. The previous image reports that 1 out of 8955 devices are in this condition.
Services with checks disabled: Number of services with checks disabled. In this case, 157 out of 3484 services are disabled.
The data displayed is organized according to a time periodconfigurable. The possible options are: 1 day, 7 days, 15 days and 30 days.
Each parameter includes two additional options:
Eye icon: Allows you to see a detailed breakdown of the assets whose checks are disabled. More information at: Hosts with checks disabled and Service with checks disabled.
Download icon: offers the possibility to export the list of duplicated to a CSV or JSON file for external analysis.
Alarms by time
This widget shows how many devices and services are spawningalarms in a configurable time period (1 day, 7 days, 15 days and 30 days).
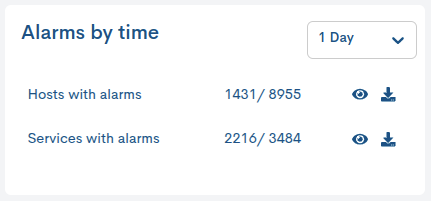
Hosts with alarms: number of devices with active alarms. In the Previous image reports 16 of 145 affected devices.
Services with alarms: number of services that have active alarms.In this example, 283 alarms are reported out of a total of 580 services.
The data displayed is organized according to a time periodconfigurable. The possible options are: 1 day, 7 days, 15 days and 30 days.
Each parameter includes two additional options:
Eye icon: Allows you to see a detailed breakdown of the assets whose checks are disabled.
Download icon: offers the possibility to export the list of duplicated to a CSV or JSON file for external analysis.
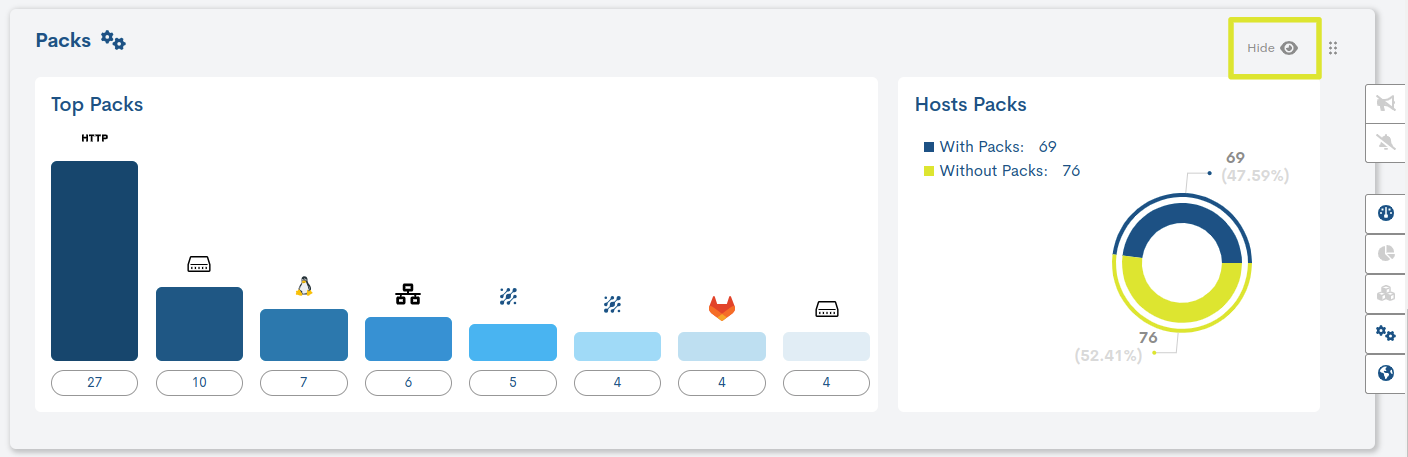
Packs
Top Packs
Through this bar graph the Packs of Monitoring with more presence and most used in WOCU-Monitoring. Each bar represents a Pack concrete and its size will vary according to its application in more or lessDevices.
Each bar is accompanied by the Pack’s identifying icon or its name if it does not have one.
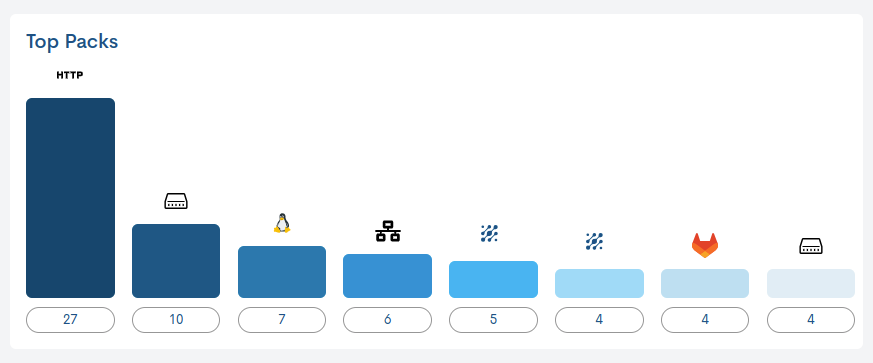
Clicking on one of the bars will display a new view that lists the devices that have that specific pack included in their configuration.
The following information is provided for each device:
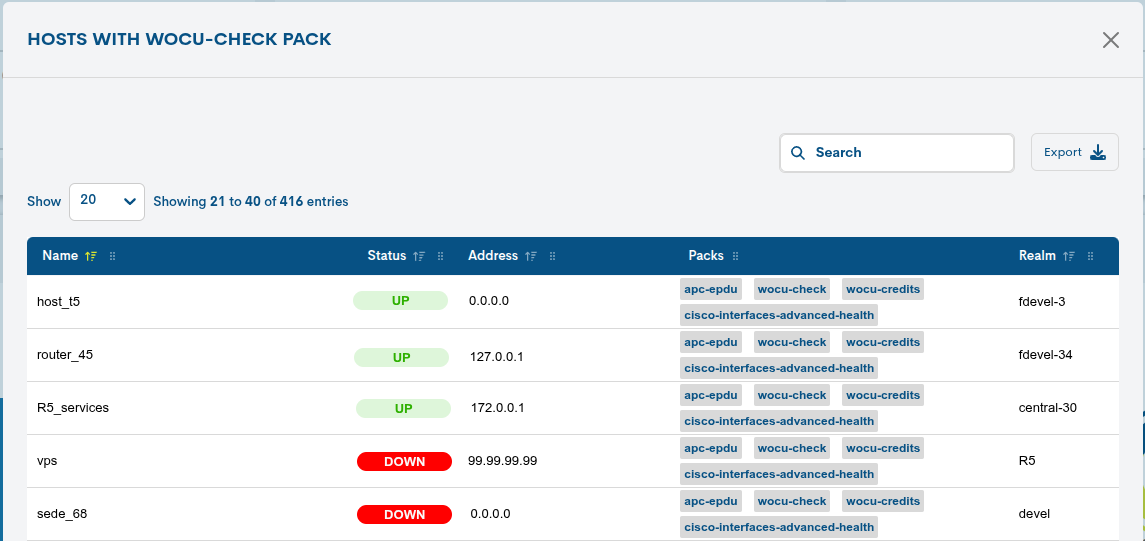
Name: identifying name of the device.
Status: reports the monitoring status of the device.
Address: contains the IP address of the device.
Packs: contains one or more tags corresponding to the Monitoring Pack applied.
Realms: specifies the realm to which the device belongs in concrete.
You can use the search bar to locate a specific device and export the list in CSV and JSON formats.
Hosts Packs
In this donut chart a distinction is made between Devices with Monitoring Packs configured and those that are not.
Use the legend to identify each type of Device (with and without Packs applied). In addition, for each sector of the graph the percentage value and total figure, making it easy to identify and reading of it.
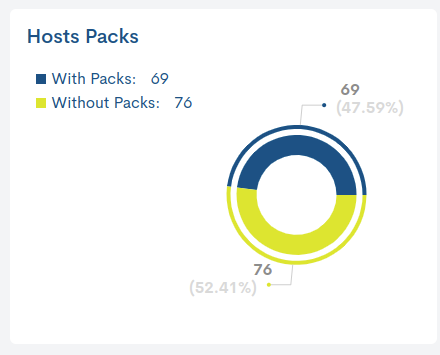
More information at: Hosts with/without Packs configured.
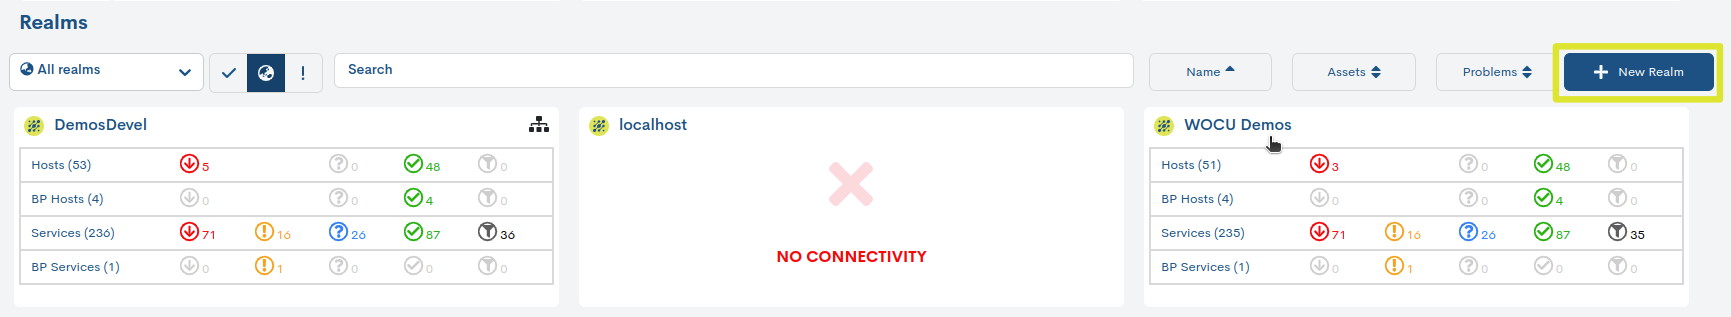
Realms
In this block, a brief numerical summary is presented for each realm managed in WOCU-Monitoring, along with useful filters for screening the information according to various criteria, which are described below.
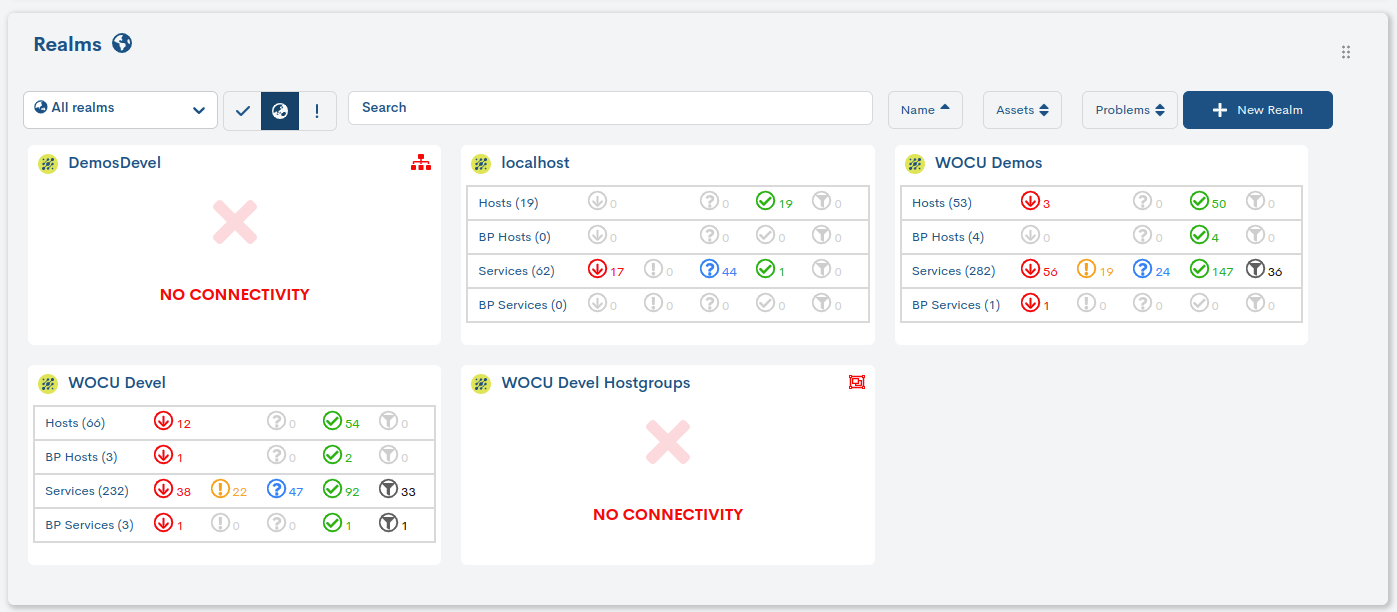
Summary panels of Realms
Each Realm is identified through a series of attributes located at the top of each Summary Panel (from left to right):
Customisable logo/image
On the far left, the logo is located, an element that helps the user visually identify each of the realms.
Identifier or name
The name helps define, give meaning to, and identify each of the monitored realms. Clicking on the identifier leads the user to the Status view.
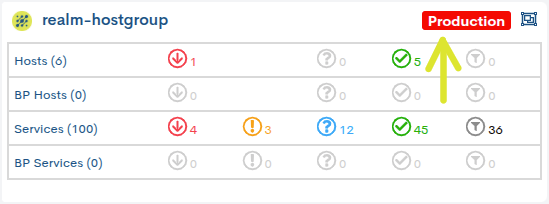
Customizable Category
It is an element used to categorize the different realms within WOCU-Monitoring. For this purpose, a series of categories are defined, each consisting of a description and a specific color, which are then assigned to the various realms.
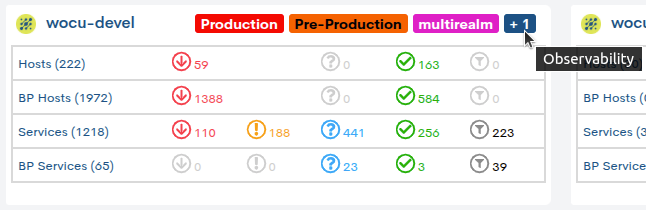
Note
Up to three categories are displayed for each Realms. If there are more, an indicator in the format “+N”, will appear, where N is the number of additional categories (e.g., “+1” or “+3”). Hovering over this indicator displays a tooltip with the visible names of the remaining categories.
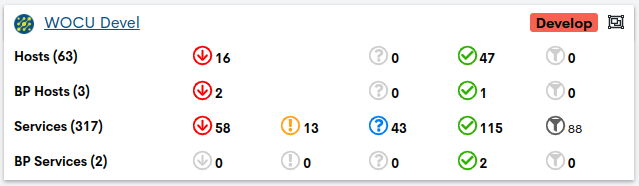
Realm type icon
WOCU-Monitoring assigns an icon to identify the nature of the realm in question. More information about each type can be found at: Realms in WOCU.
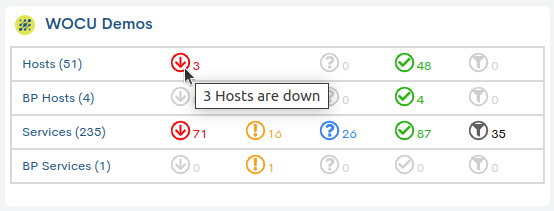
In Realms based on Hosts Groups…
When one of the Host Groups that make up a Realm is out of service, the data related to it will be hidden in the panel, showing only the information of the groups that are operational. However, as a visual aid, the icon associated with this type of Realm will turn red to indicate that there are problems with one of the Host Groups.
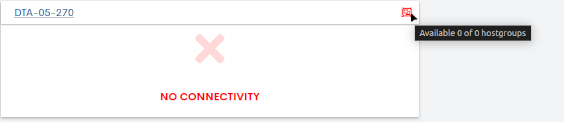
Similarly, hovering the cursor over the icon displays a pop-up with information on the availability of the Realm’s Host Groups.
In case no Host Group is operational, this particular panel shall become inactive.
In Multirealms…
Placing the cursor over the icon will display the Realms that make up the Multi-Realm (Available realms):
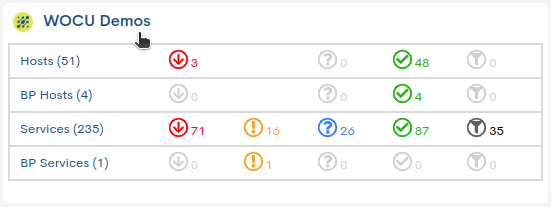
Next, in a tabular format, the assets monitored by WOCU-Monitoring that belong to each Realm are presented. The total number of elements of each type will be indicated in parentheses next to the corresponding type.
For each type of asset (Hosts, BP Hosts, Services, and BP Services), it indicates how many of them are in one of the monitoring states defined by WOCU-Monitoring (Down/Critical, Warning, Unreachable/Unknown, Up/OK) and how many of them have been filtered (through the User preferences).
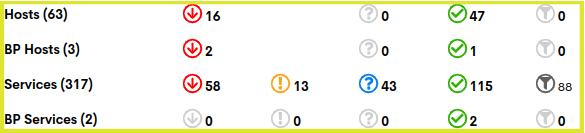
Placing the cursor over the data in each row and column will give the count of information for each type of element:
Filters and sorting of summary panels
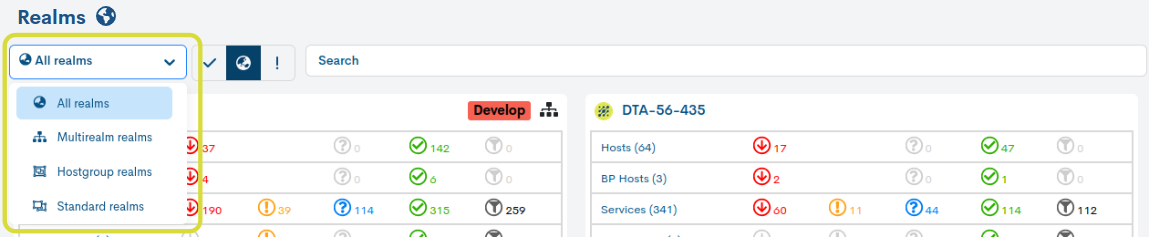
Filter by Realm type
To select which summary panels by realm will be displayed, according to the type of Realm, based on their typology: standard realms, multi-realms, and host group realms.
By default the selected option in this filter will be All realms, i.e. no WOCU-Monitoring realm will be filtered. Clicking on the button will display a menu that will allow you to select the type of realm you want to display, hiding the rest of the types in the view.
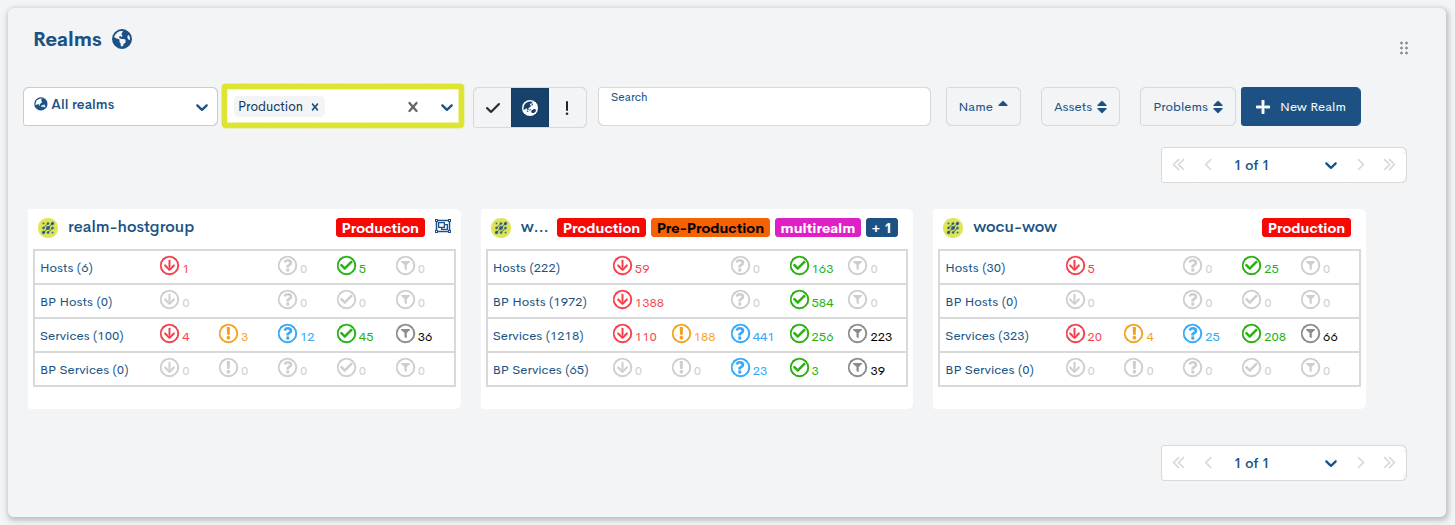
Filter by category
They are available in the category filter of the view of Realms.
When you expand the selector, all available categories are listed, created and assigned previously during the process of creating a new Realm. That is, they are not defined from the filter, but are part of the initial Realm configuration.
It works simply: by selecting one or more categories, the view will automatically update, showing only the Realms associated with the selected categories.
If no category is selected, all Realms will be displayed.However, if multiple categories are selected, the Realms belonging to any of them will be displayed.Realms belonging to any of them will be displayed.
Filter by connectivity
To restrict the display of summary panels of realms based on their connectivity and accessibility status.
The possible filtering options are
Show realms with connectivity: only living realms will be displayed,that is, all those that are available and accessible to the user.

Show all realms: all realms will be displayed without any distinction.

Show realms without connectivity: only the realms that, although configured, do not respond will be displayed, i.e. all those that are without connectivity and are not accessible to the user. With this option we will be able to know which elements of the WOCU-Monitoring infrastructure are not up.

Search filter (Search…)
To quickly locate one or more of the realms monitored in WOCU-Monitoring.

It will be enough to enter a few characters of the name for WOCU-Monitoring to perform the search. If multiple realms start with the same initial, only those will be displayed when that initial is entered. The filter also searches by name within the intermediate characters of the identifier, so the filtering possibilities are very extensive.
To undo the filter simply delete the characters entered and all Realms will be displayed again.
Sort Summary Panels by Realm
Through the Name, Problems, and Assets options, you can set the order in which WOCU-Monitoring displays the different realms (from highest to lowest and vice versa).

Name
It allows you to organize the view of realms based on their identifier in alphabetical order.
Problems
Allows you to organise the realms view according to the number of Hosts Down hosts.
Assets
Allows you to organise the Realms view according to the number of elements that make up each Realm.
Attention
These filters will be enabled when all Realms summary panels are loaded in the interface.
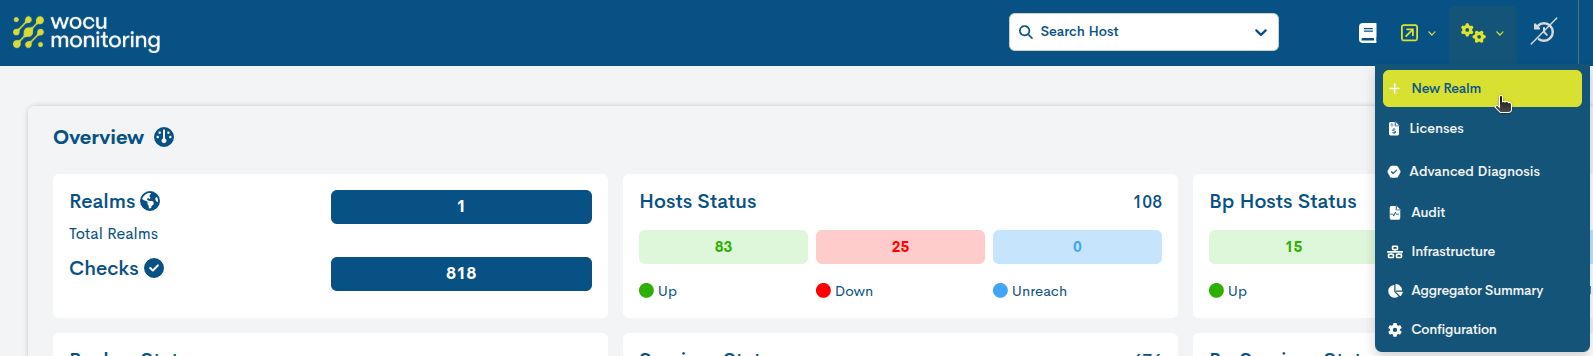
Add a new Realm (+ New Realm)
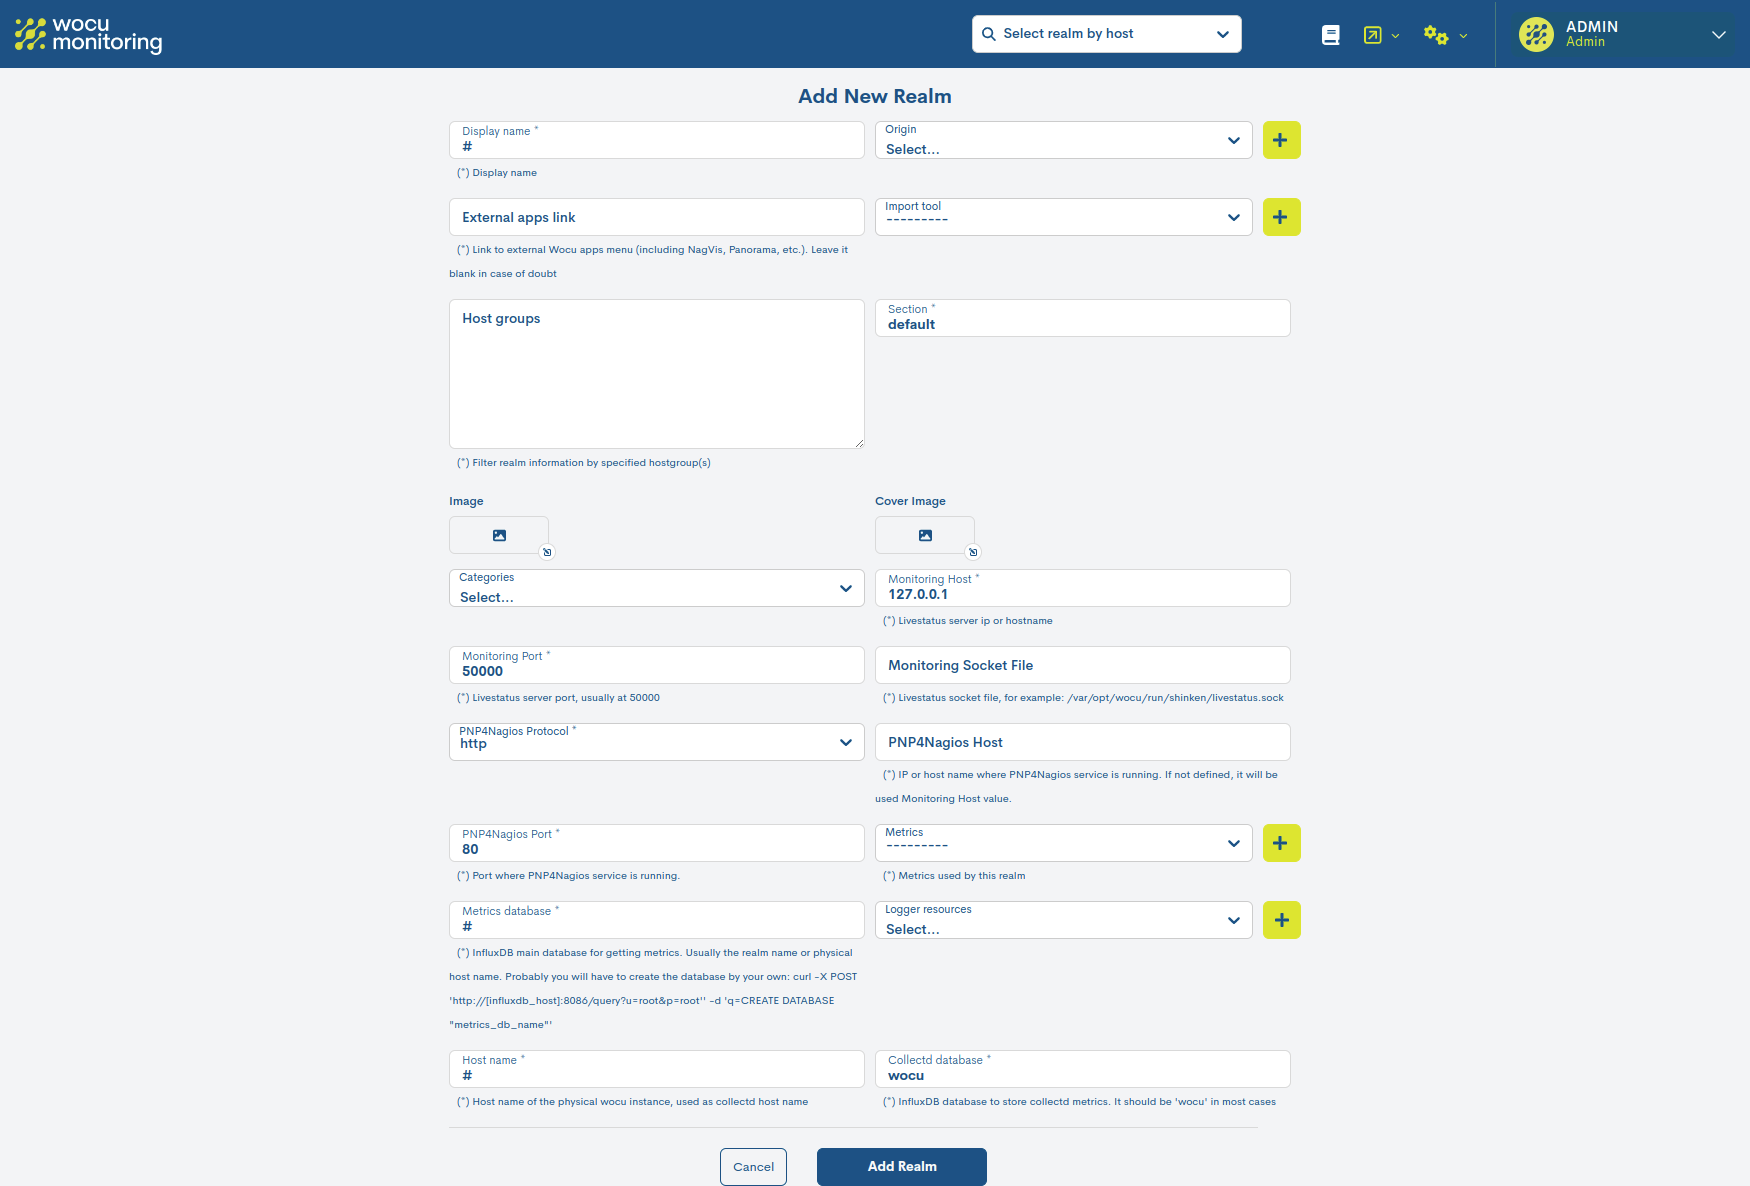
WOCU-Monitoring provides the option to add new realms from the Home interface, so they can be part of the monitored technological infrastructure. To do this, you need to click on the blue button + New Realm.
Once this action is selected, a pop-up window will appear with a form whose configuration fields have to be filled in manually by the user.
The process of configuring and filling in the fields and parameters of the registration form is described in detail in section Creation of Realms, distinguishing by type and nature of the Realm:
Attention
In the event that no monitoring Realm is configured in the tool, the + New Realm action will remain available to proceed with the creation of new Realms. To do so, you must be registered as an Administrator in the system.
Navigation options and widget rearrangement
The following describes the main tools available for efficient navigation:
Navigation controller
The navigation controller is permanently located on the right side of the interface. This interactive tool includes a series of buttons with icons representing the different blocks that make up the Home view.
By clicking on any of these buttons, the system automatically redirects the user to the corresponding block. This is particularly useful, as it allows quick and direct access to the desired information.
Hide/show widget blocks
The interface allows for further customization through the functionality of hiding or showing blocks of widgets, adjusting the visible space according to the user’s needs.
Through the Hide option, located in the upper right corner of each block, it is possible to temporarily hide a set of widgets, freeing up space in the view and facilitating the visualization of the remaining elements.
To restore the block, you will need to click again on the navigation controller button (now shown in a dimmer color) and the block will reappear in the global view.