Problems
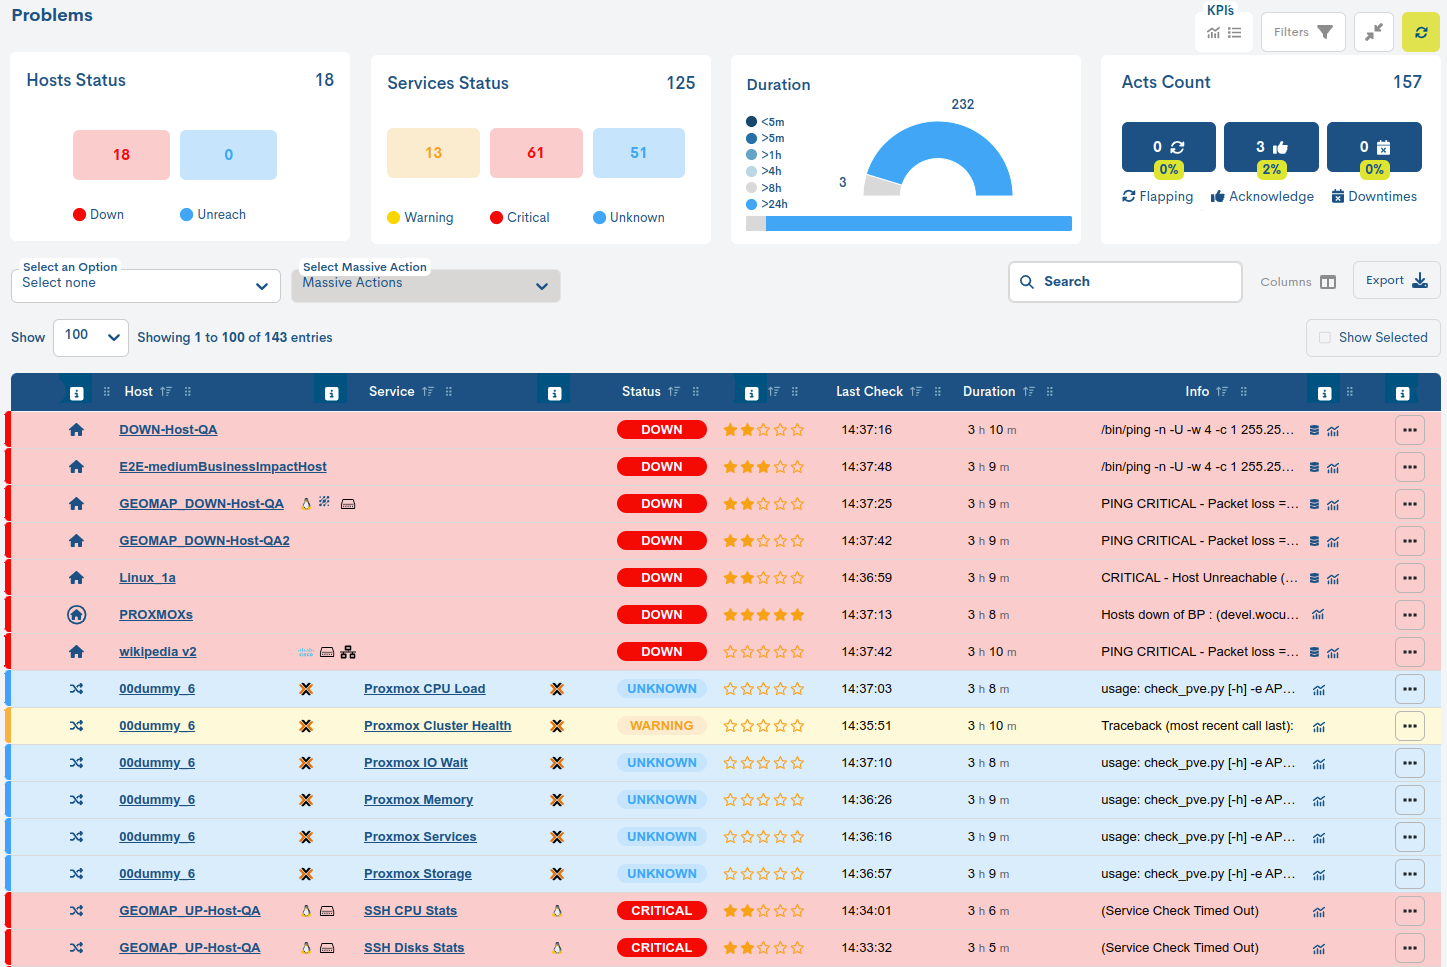
The Problems tab displays for a selected Realm the active alarms on the various elements monitored by WOCU-Monitoring (Hosts and Services and Business Processes). It also allows you to obtain information about their status and perform the most common operational tasks.
From a single view it is possible to view all the alarms of a multitude of elements.
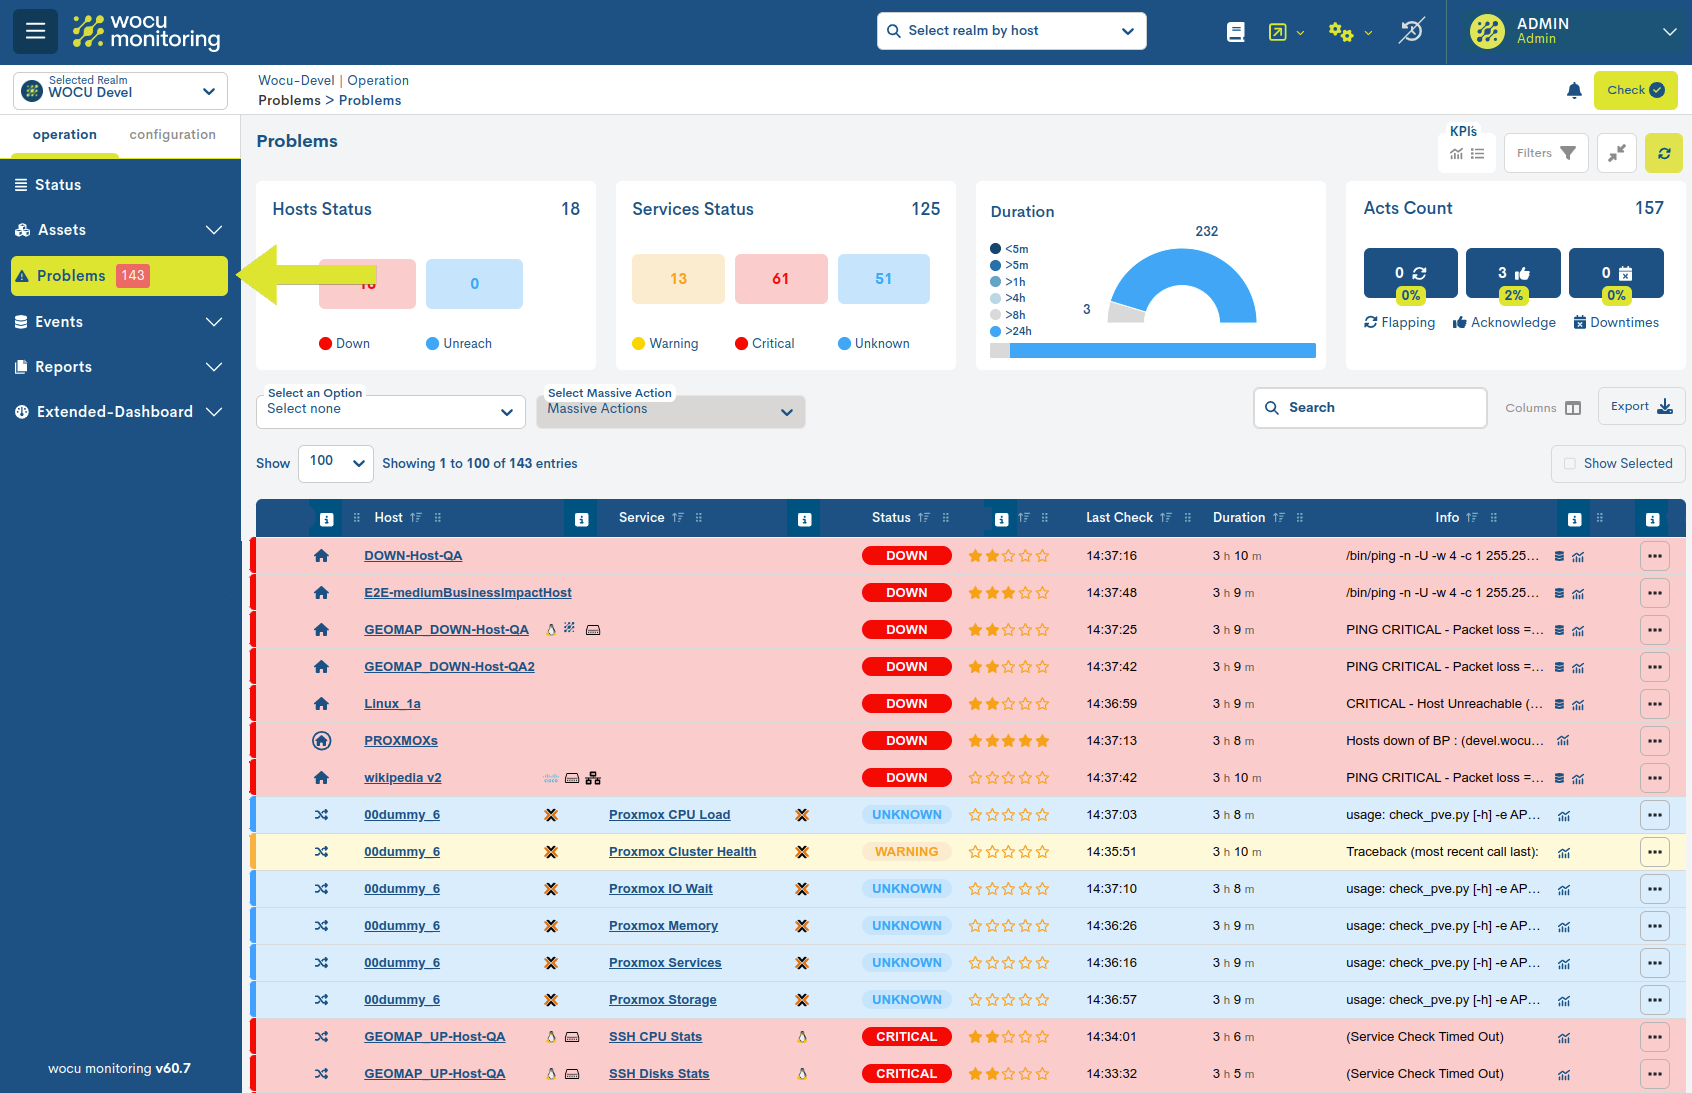
In the navigation menu, the total number of alarms generated is reported:
If there is no active alert type, the tab will appear disabled.
List of alarms on monitored assets
WOCU-Monitoring displays in the list of monitored asset alarms those elements whose operational status has changed from an optimal operating state (UP/OK) to any other situation.
Attention
Only when the asset has Monitoring Packs associated with it, the system will set, after the Name, identifying icons (manufacturers, technologies, operating systems…) referring to these applied packs.
The system will display a maximum of three icons ordered by a predefined weight scale, giving priority to the most representative and relevant (and least generic) icons/packs of the Host’s monitoring profile.
Placing the cursor over a particular icon will bring up a text alluding to the technology represented.
More information can be found at: 1. Display technology identification icons on Assets, Problems and Events pages..
Problems List Fields
The display of inventory fields (columns) is configurable through the Columns option. This functionality allows the user to dynamically select which columns to show in the table view and which ones should remain hidden. More information at: Customizing table display: Columns.
Attention
There is a maximum limit of 9 columns visible at the same time, in order to preserve readability and interface performance.

Además, la aplicación incorpora soporte para el redimensionamiento dinámico de columnas de la tabla, permitiendo al usuario ajustar manualmente el ancho de cada columna según las necesidades de visualización. Más información aquí.

The possible fields are:

✓ Indicador de estado de monitorización
El indicador de estado de monitorización es una barra vertical de color que aparece al inicio de cada fila en la tabla global de alarmas. Su función es ofrecer, de forma rápida y visual, información sobre la disponibilidad y el estado operacional actual de Hosts o Host Business Process los cuales tienen servicios vinculados (que han podido generar también algún tipo de alarma).

Siguiendo el ejemplo anterior, el dispositivo wocu-engineer-snmpv3 se encuentra en estado UP (asociado al color verde) y su servicio Linux SNMP3 - Disks registra un estado UNKOWN (como indica la columna Status).
- ✓ Type (ℹ)
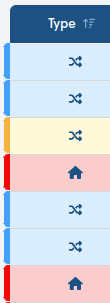
This field contains an icon that identifies the type of asset in the listing.
These are:
Hosts: physical devices are identified with the house icon.

**Business Process Host (BP Hosts): meaning logical devices, are identified by a house icon enclosed in a circle.

Services: Services are identified by the crossed arrows icon. You can view a Device’s Services by expanding them through the available view options.

Business Process Services (BP Services): Business Process Services (BP Services) are identified by the crossed arrows icon enclosed in a circle. You can view the Business Process Services of a Device by expanding them through the available view options.

Servicios Pasivos (Passive): se asignará un icono representado con la letra mayúscula P para identificar Servicios Pasivos. Esto indica que dichos servicios proceden de la monitorización pasiva, vía SNMP Traps.
Note
Use the increasing or decreasing order of entries in the Type column to group and locate Assets of the same type.
- ✓ Host
Records the formal identifier of the Host to which a Service in question is associated and which has generated some type of alarm. By clicking on the name tag, you will access its corresponding Detailed view of Hosts and Business Processes with detailed, complete and updated information about it.
- ✓ Service
Records the formal identifier of the Service linked to the parent Host that heads the row of the table and that has generated some type of alarm. By clicking on the name tag, you will access its corresponding Detail view of Services and Business Processes with detailed, complete and updated information about it.
- ✓ Status
Through this field, WOCU-Monitoring reports the current status (in terms of availability) of the asset.
For better understanding, the background color of each row in the Status column corresponds to one of the possible states that the asset can reach. For example, a pink color for those Services in Critical state. More information at: Statements of Assets in WOCU.
- ✓ Impact (ℹ)
It is a configurable attribute that shows the user the importance or significance of the alarm compared to the rest. The impact is represented using 0 to 5 stars, with 0 being the least vital and 5 the most critical.
None: 0 stars
Low: 1 star
Medium: 2 stars
High: 3 stars
Very High: 4 stars
Critical: 5 stars
Attention
The Impact value of a Host may vary when it is part of one or more Business Processes. More information can be found in: Impact Value (Impact) inherited in Business Processes.
- ✓ Last check
Records the exact time of the last status check of the asset.
- ✓ Duration
Records how long the asset has been in the ‘recorded’ state since the last check.
- ✓ Info
Output message obtained with information describing the circumstances of the incident. The nature of the messages will vary depending on the asset type and its configuration.
When the text exceeds the available space and appears truncated(…), the user will be able to consult the details of the text through a pop-up text when placing the cursor over this field.
- ✓ Icons associated with the alarm (ℹ)
Este campo muestra los iconos de las acciones aplicadas sobre el activo desde el Hosts Inventory. Más información sobre cada icono mostrado en: Icons associated with the asset (ℹ).

Note
You can easily find out what these icons mean by hovering your cursor over them.

- ✓ Host address
Device IP address. To view this field, use the Columns function.
Actions on inventoried alarms
WOCU-Monitoring offers the option of applying a series of actions on the assets from the Alarm lists. These are some of the fundamental tools in the operation and treatment of the incidents themselves.
To display the actions menu, click the icon in the “Actions” column in the row of the Asset/Alarm you wish to address. Then, select the desired action from the menu options.
Host and BP Host Alarm Actions
More information at: Actions on inventoried hosts

Services and BP Services Alarm Actions
More information at: Actions on inventoried services (ℹ)

KPI`S
This section displays a series of panels with key performance indicators (KPIs) and the operational status of assets that have generated some type of incident.
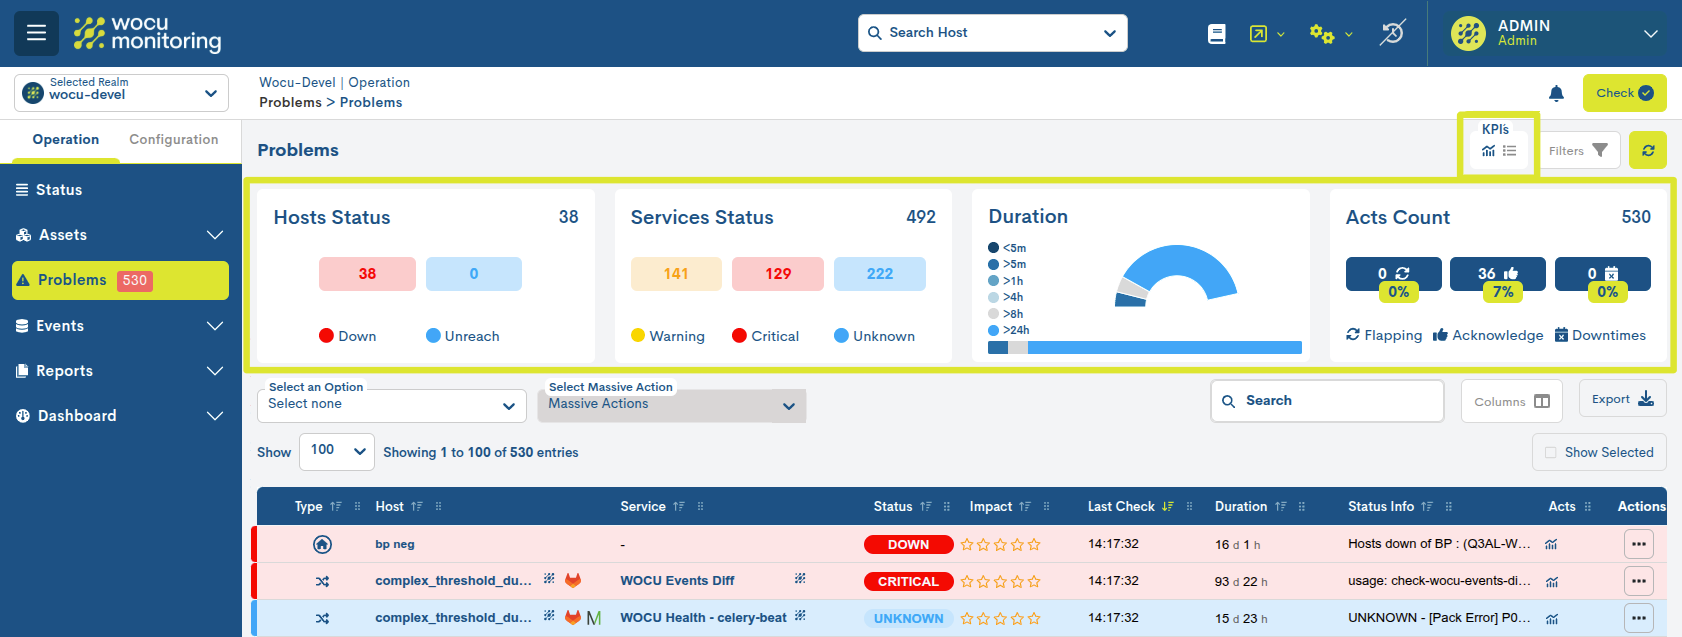
KPIs can be viewed in two possible ways:
Full view
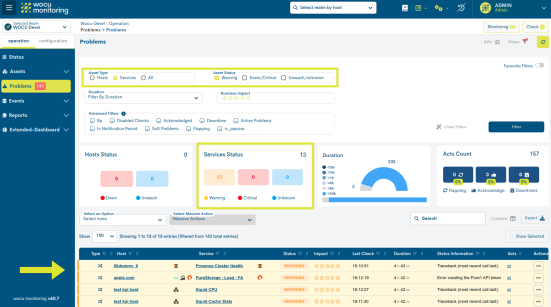
By activating the icon marked in the following image, the following KPIs are displayed, with detailed data and interactive charts:

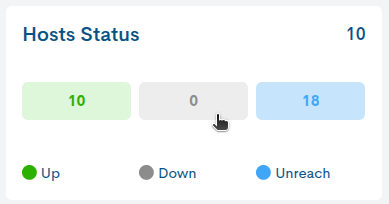
Hosts Status
Host count based on current monitoring state.
This information is key to assessing the overall health of the infrastructure and prioritizing interventions on the most critical devices.
Note
This KPI acts as an interactive filter: by clicking on any of the estados de monitorización, the table automatically updates to show only the assets corresponding to that state.
When one or more states are deactivated, the corresponding buttons are grayed out, visually indicating that they are inactive. To reactivate a previously disabled state, simply click on it again.
By default, the table displays assets from all possible states untilthe user interacts with one of the filters.
Services Status
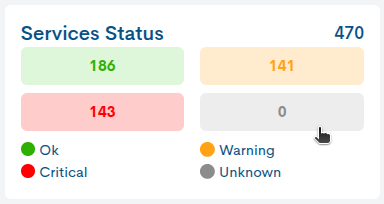
Service count based on current monitoring state.
Note
This KPI acts as an interactive filter: by clicking on any of the estados de monitorización, the table automatically updates to show only the assets corresponding to that state.
When one or more states are deactivated, the corresponding buttons are grayed out, visually indicating that they are inactive. To reactivate a previously disabled state, simply click on it again.
By default, the table displays assets from all possible states untilthe user interacts with one of the filters.
Duration
A semi-circular graph represents and distributes the alarms listed based on their duration. This value indicates how long the incident has been active, i.e. the duration of the outage or total failure. This KPI is vital for identifying prolonged incidents that could affect overall performance or cause serious interruptions.
Acts Count
This panel collects the following three key parameters for provide a comprehensive view of the status of devices withassociated alarms:
Flapping Status: Count of inventory assets experiencinga rapid alternation of changing monitoring states, knownlike flapping.
Acknowledge: Inventory asset count with Apply acknowledged to service applied, allowing trackingefficient of the incidents recognized and in the process of resolution.
Downtimes: inventory asset count with :ref action:schedule-downtime applied, optimizing the organization of tasksmaintenance and reducing unplanned downtime.
It should be noted that these KPIs are not fixed, as they are updated and adapted based on the filters applied to the list of incidents. This allows the data displayed to always reflect the most relevant information according to the selected criteria.
See example below:
Summary view
By activating the icon marked in the following image, the previous KPIs are displayed, but in a more compact format for quick reading:

It is also possible to hide the panel block by switchingboth buttons.
Botón para ocultar filtros
Con el objetivo de ofrecer una interfaz más limpia y enfocada, a través de este botón es posible ocultar el bloque de filtros de la vista, dando prioridad a la visualización de la tabla principal.

Una vez activado, se mostrará un botón lateral fijo que permite volver a desplegar el panel oculto en cualquier momento, garantizando un acceso rápido y flexible a las opciones de filtrado.

Inventory Operational Options: Filters and Export
WOCU-Monitoring has a series of very useful options that facilitate the treatment of Alarms from monitored Assets. The use of the set of filters and actions available allows for a more organized management of alerts.
By default, all filtering options are hidden, leaving a larger, clearer space for viewing and reading data. Simply click on the Filters option followed by the funnel icon (see image) and the available filters will be displayed.

Filtering by Duration
This filtering option modifies the display of Hosts and Services according to the time that the incident has been active, that is, the duration of the downtime or total failure. Remember that this information is recorded in the Duration field for each of the elements.

This selector has multiple filtering options:
Duration < 5 minutes: Duration less than 5 min.
Duration < 10 minutes: Duration less than 10 min.
Duration < 15 minutes: Duration less than 15 min.
Duration < 30 minutes: Duration less than 30 min.
Duration < 1 hour: Duration less than 1 hour.
Duration < 2 hours: Duration less than 2 hours.
Duration < 8 hours: Duration less than 8 hours.
Duration < 1 day: Duration less than 1 day.
Duration > 5 min: Duration greater than 5 min.
Duration > 10 min: Duration greater than 10 min.
Duration > 15 min: Duration greater than 15 min.
Duration > 30 min: Duration greater than 30 min.
Duration > 1 hour: Duration greater than 1 hour.
Duration > 2 hours: Duration greater than 2 hours.
Duration > 8 hours: Duration greater than 8 hours.
Duration > 1 day: Duration greater than 1 day.
Flexible filtering allows you to respond to queries such as: display only Hosts that have been in a critical state for more than 2 hours.
Important
The settings made will be retained even if the user switches tabs.
Filtering devices and services by status type
These filtering options modify the display of assets based on their current state. Using this filter, it is easy to select items that are in a particular monitoring state.
By default, all boxes/status are checked, indicating that the inventory is showing all assets, without discriminating by any type of status. Its operation is very simple, clicking on a box toggles the filtering option. Note that once the box is checked, a tick will appear inside (✓).
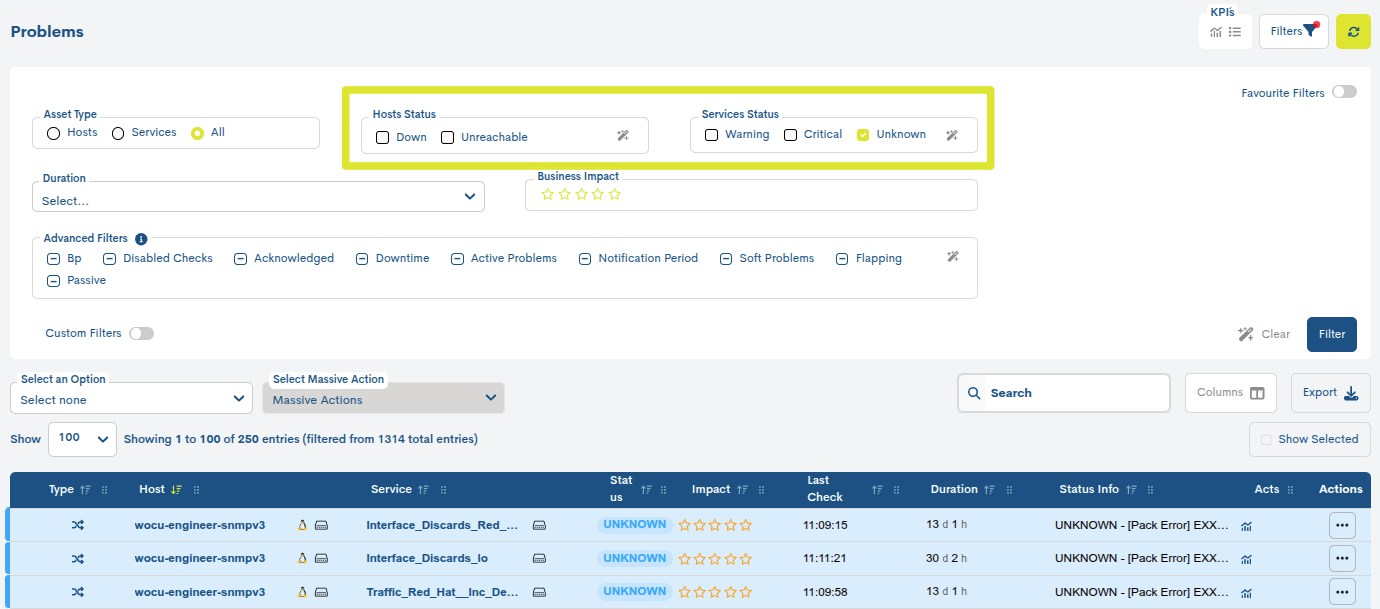
Attention
The service filter by status type cannot be applied when the selected expansion/compression option is “Hide all services”. In this case no selection shall be applied.
Finally, once the filters have been configured, the changes must be saved by clicking on the blue Filter button, in order to reload the inventory with the new data request.
Impact
This option is enabled only for Host and BP Hosts, not for Services. Applying this filter will only display the Alarms of the Hosts whose criticality or Impact degree is equal to or greater than the selected value. By default this option will appear inactive and, therefore, all Alarms will be displayed, regardless of their Impact value:
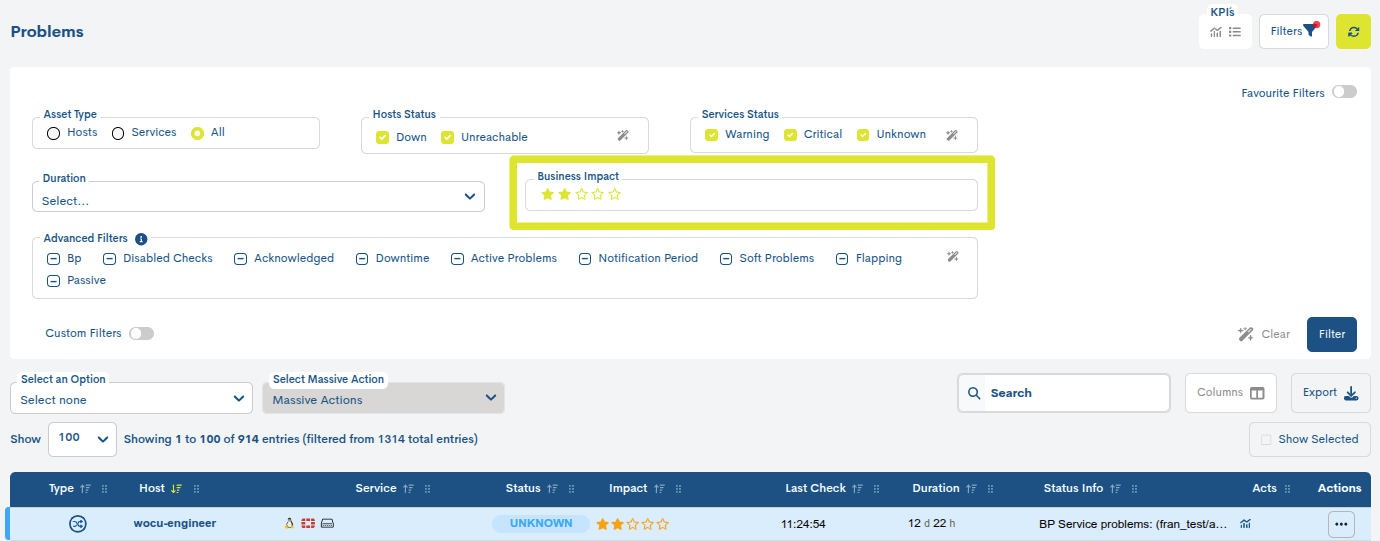
The user can select the Impact value that he/she wants to set as a filter. The selected option will be highlighted in red. To remove the filter, simply click on the minus sign located on the left.
Remember
The impact value is defined in the Import-Tool, specifically in the Business Impact field of the Hosts and Host Business Processes view. The impact is represented using a scale from 0 to 5, with 0 being the least vital and 5 being the most critical.
Impact Value (Impact) inherited in Business Processes
This variable is used to establish the importance that a Host or Business Process will have in the Realm, which will influence the normal operational flow, for example, in the treatment and notification of incidents to the operator.
By default, the default value is 2 for Business Processes and 0 for Hosts (scale of six values). Based on this situation, any Host that is part of the logical relationship that constitutes a Business Process, will inherit its impact value as long as it is greater than or equal to the one assigned to it as an individual element, i.e:
If the highest Impact is that of the Host, the one it has is maintained.
If the highest Impact is that of the Business Process, the Host inherits that value.
If the Host affects several Business Processes, it shall inherit the highest impact value among the above.
See example below:
Object |
Impacto |
|---|---|
|
⭐ ⭐ ⭐ ⭐ ⭐ |
|
none |
|
⭐ |
|
⭐ ⭐ ⭐ |
BP A –> |
⭐ ⭐ ⭐ ⭐ |
BP B –> |
⭐ ⭐ ⭐ ⭐ ⭐ |
For the above configuration, the system shall act as follows:
Host
h1will maintain its impact value since it is higher than that of the Business Process BP A of which it is a part.The
h2Host, having no value, acquires the impact value of the Business Process BP A.The Host
h3, acquires the impact value of the Business Process BP A, since it is greater than its value as a particular entity.In the case of the
h4host, two issues need to be observed:1. Su valor de impacto es menor que el de ambos Procesos de Negocio del que forma parte. En caso contrario conservaría el suyo propio.
2. Hereda el valor del BP B, puesto que es mayor que BP A.
Filtros avanzados (Advanced Filters)
The application provides another advanced filtering system for inventory items, making it easier to select and visualize items within certain categories or operational situations.

The available options are:
BP: Filtering by asset type, specifically by Business Processes of Hosts. More information on the representation and identification of Assets in Type (ℹ).
Disabled Checks: Filtering assets in which the user has suspended the active monitoring tasks that the system is performing, that is, the Disable active checks for services has been applied.
Acknowledged: Filtering alarms that have been acknowledged, meaning, alarms in which the user has applied the Apply acknowledged to service action for that asset.
Downtime: Filtering alarms that are in Downtime, meaning, alarms in which the user has applied the action Schedule downtime to service.
Active Problems: Filtering Active Alarms. This will filter incidents in which the user has not yet taken any action or treatment.
In Notification Period: Filtering alarms with a configured notification period. The list will show only the alarms that, at that moment, are within their notification period.
Include softproblems: By default, the main table Host Problems displays alarms generated from both
SOFTandHARDtypes. With this filter, all entries ofSOFTtype alarms are included in the list, while those of typeHARDare excludedFlapping: Filtering alarms associated with devices experiencing rapid alternation of monitoring state changes, known as Flapping.
Passive: filtrado de Alarmas asociadas a servicios pasivos (proceden de la monitorización pasiva, vía SNMP Traps).
The operation in this mode allows the concatenation of filters, offering different combinations to the operator for the direct visualization of data of interest. This is possible because each filter can assume 3 states summarized in the following table. Simply check the filtering box repeatedly to cycle through the different states indefinitely.
Icon |
Value |
Description |
|---|---|---|
ー |
Off |
The filter is not enabled. The table shows all items by default. |
✔ |
True |
Filter enabled. The table is updated to show the items that meet the filter condition. |
✖ |
False |
Filter enabled. The table is updated to hide the items that meet the filter condition. |
Filtros avanzados (Advanced Filters)
The application offers other advanced options for customised filtering of the items in the list.Of the items present in the list. These filters allow users to nest and define more specific criteriato segment the information according to their needs, by using certain categories or logical operations.
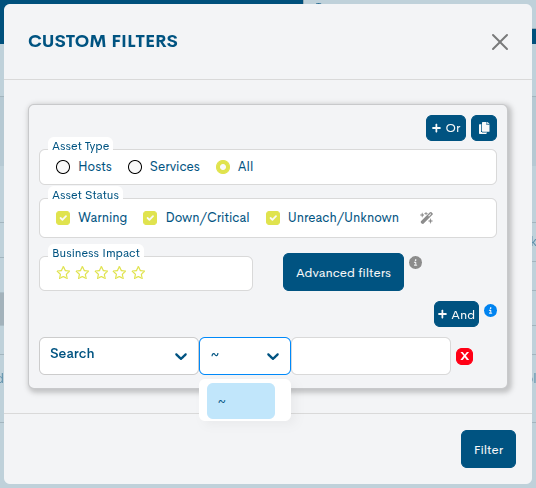
To display the custom filter package, you will need to enable the Custom Filters tab.
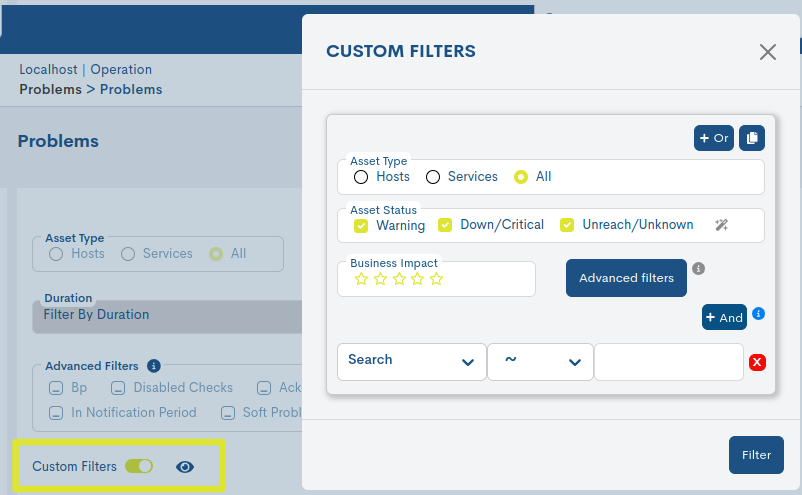
The available options are:
Asset Type
Allows filtering of alarms belonging to Hosts, Services or both (All).
Asset Status
Host count based on current monitoring state.
Business Impact
Applying this filter will display only alarms from the Devices whose degree of criticality or Impact is equal to or greater than the selected value.
Advanced filters
Corresponds to the module of Filtros avanzados (Advanced Filters) present in.the alarm list and is similar in operation.
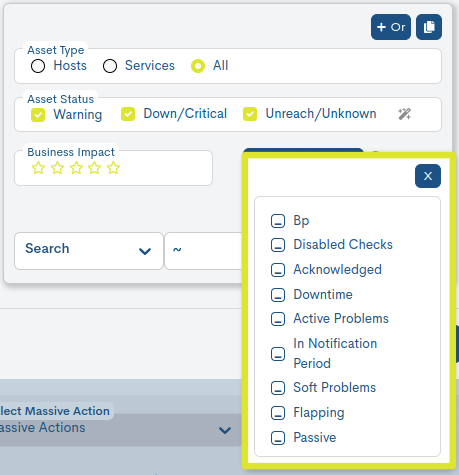
Filter selector
This selector presents a set of filtering options, whichcorrespond to the Problems List Fields and are configured by applyingconditions to the items listed in the table. This allows for moremore precise searches. The elements displayed under each filteringfiltering options are operators, which define the comparison logic between anattribute and a value.
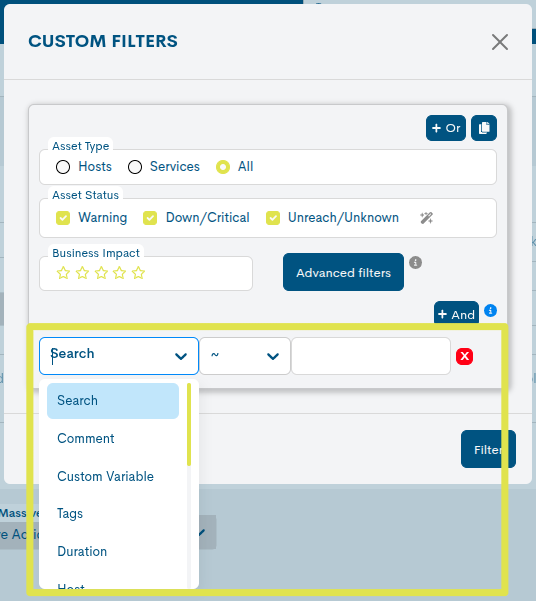
a. Basic filters:
Filter
The available options are:
Search
~ (similar to): search for items that contain a partial match or pattern with the specified value.
Comment
~ (similar to): search for items that contain a partial match or pattern with the specified value.
!~(not similar to): search for items that do not contain the partial or pattern with the specified value.
!= (other than): search for items that are different from the specified
= (equal to): search for items that exactly match the specified
Host
Hostgroup
Plugin output
Service
Packs
!= (other than): search for items that are different from the specified
= (equal to): search for items that exactly match the specified
For example…
If the = operator is used in conjunction with a value, problems whose specified attribute exactly matches that value will be located.
If != is used, problems matching this value.
b. Temporary filters:
The following table presents the available temporal filters along with the operators that can be used in each case:
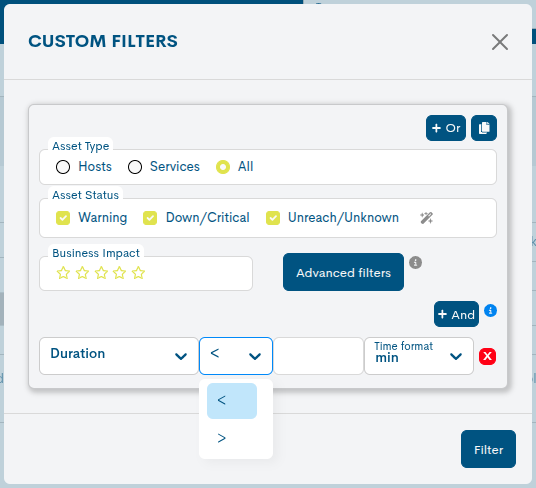
Filter
Operators
Number of services
= (equal to): filters out items that exactly match the specified
!= (other than): filter out items that are different from the specified
<= (less than or equal to): filters out items whose value is less than the specified value
>= (greater than or equal to): filters out items whose value is greater than the specified value.
Duration
< (lesser): filters out items whose value is less than the specified value.
> (greater): filters out items whose value is greater than the specified value.
Last check
c. Parent Filter:
This is a filter for problematic assets that are hierarchically related. This filter allows you to focus on items that have a dependency or hierarchy with others.
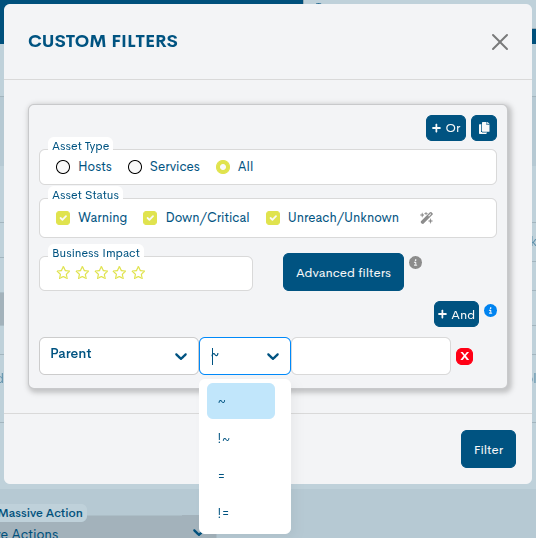
The following are the operators that can be used to execute the query:
Filter
Operators
Parent
= (equal to): filters out items that exactly match the specified
!= (other than): filter out items that are different from the specified
~ (similar to): search for items that contain a partial match or pattern with the specified value.
!~(not similar to): search for items that do not contain the partial or pattern with the specified value.
d. Tags Filter
The user can freely define and assign descriptive tags to assets to facilitate their search, classification, and location within the system.
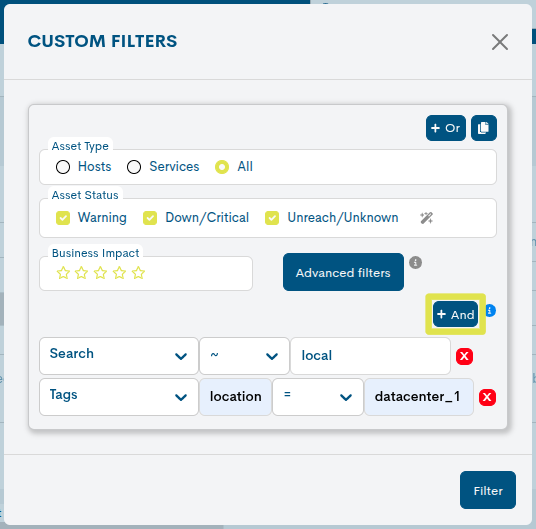
The Tags filter criterion follows the format
name = value(name-value), where the first cell corresponds to the Name, attribute or category of the asset you want to filter, followed by the search operator selector, and then the Value cell, where the specific value assigned to that attribute should be entered.Ej.:
device_type = routerorlocation = datacenter-1.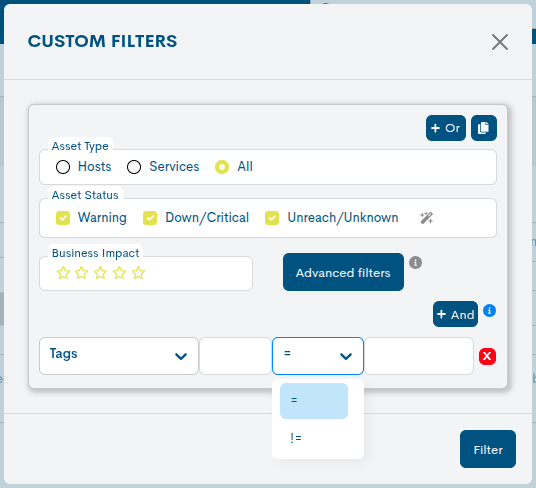
The following are the operators that can be used to execute the query:
Filter
Operators
Tag
= (equal to): filters out items that exactly match the specified
!= (other than): filter out items that are different from the specified
e. Custom Variable Filter
It has a text field that allows the user to enter a custom filter based on a specific variable, offering flexibility to adjust search conditions to suit their needs.
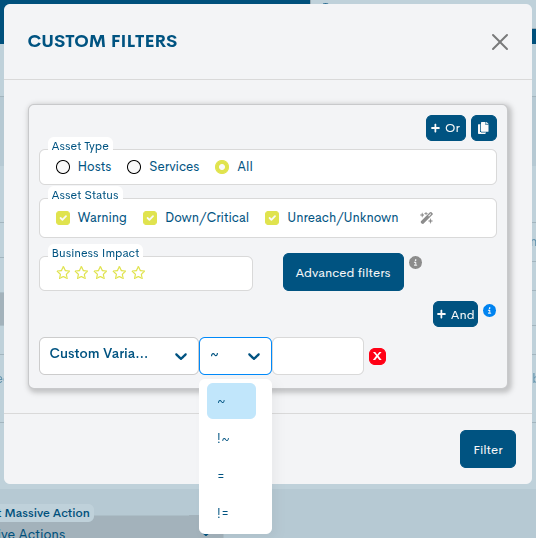
The following are the operators that can be used to execute the query:
Filter
Operators
Custom variable
= (equal to): filters out items that exactly match the specified
!= (other than): filter out items that are different from the specified
~ (similar to): search for items that contain a partial match or pattern with the specified value.
!~(not similar to): search for items that do not contain the partial or pattern with the specified value.
Finally, the AND button is available, which allows you to add rows to add search conditions and further refine the query.
Nesting filters: OR and Duplicate
The system allows combining multiple conditions or complete search configurations to obtain more specific or broader results.
Nesting filters using the OR operator: this operator allows multiple conditions to be included, where any one of them can be true for the filter to be applicable. Therefore, nesting filters with OR extends the results by including any of the conditions.

Duplicate queries: this action creates a new instance of an already defined query. By duplicating a query, you can modify the search conditions in each copy without altering the original query.
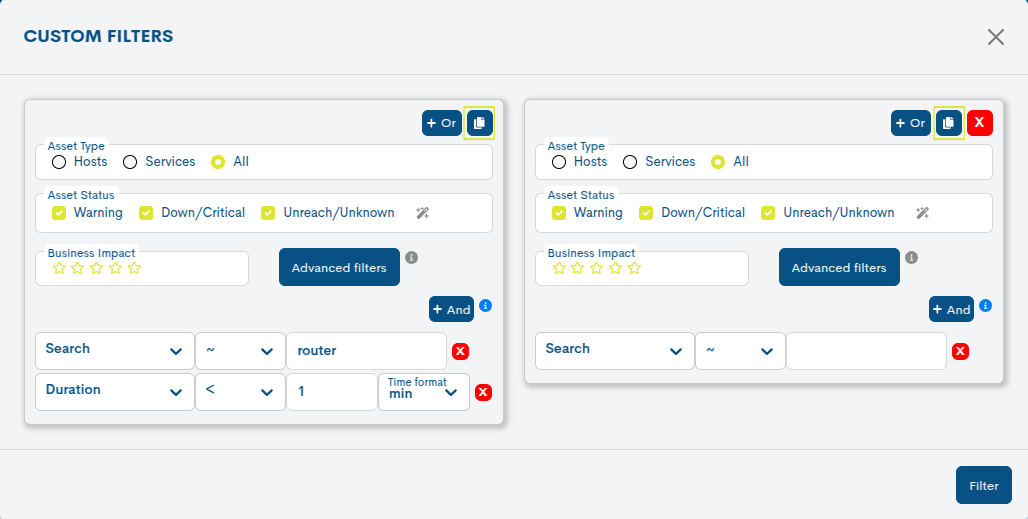
When combined with the OR operator and the duplicate query option, greater flexibility and control over the results can be achieved, allowing for highly customised searches. In doing so, more complex filters can be created that include several different conditions or criteria, both in parallel searches and alternative conditions within the same query.
To minimise this possible data saturation during the processing of active problems, there is the Exclude soft problems filter, which discriminates and extracts all SOFT type problem entries from the list, loading and displaying only HARD type problems.
Filter button
To minimise this possible data saturation during the processing of active problems, there is the Exclude soft problems filter, which discriminates and extracts all SOFT type problem entries from the list, loading and displaying only HARD type problems.
Button for clearing applied filters (Clear Filter)
When the intention is to clear the applied filters, you can click the Clear filter button, and the configuration will be reset immediately, except for the search performed in the Search bar.
Massive Actions
This filter allows you to distinguish inventory assets by type, whether they are: Hosts, Business Process Hosts (BP Hosts), Services or Business Process Services (BP Services).
Massive actions allow for a more organized management of large quantities of data in vast and complex environments.
The management of elements is carried out from the following drop-down menus:

For this reason, it is very useful to be able to establish filters similar to those for problem processing, in order to have a clearer view of the status of the problems. For this purpose, WOCU offers the possibility to apply the following filters:
Selection of list items
Disabling this filter hides all Active Problems, i.e. those where the WOCU user has not taken any Action. By placing the cursor over the button you can find a reminder of the action that will apply the filter: click to hide all Active Problems.
Disabling this filter hides all Problems where the user has applied the Disable active checks action for that Asset. By placing the cursor over the button you can find a reminder of the action that will apply the filter: click to hide problems with “Checks Disabled”.
The Disabled checks and Acknowledged checks filters can be disabled by default, if the options are enabled in the User Preferences: Filter disabled checks and/or Filter acknowledged statuses.
Select the complete list (Select All).
Select only the current page of the list (Select Current Page). This option can be used in a concatenated manner, meaning selecting multiple current pages and adding up the items they contain.

This functionality allows you to apply actions on several Problem records. By selecting at least two inventory records, this tab will display a set of actions that will be applied to the selected set of items.
To select one or more items from the list, simply click on one of the rows (highlighted in a darker colour) and it will be included in the joint selection.
To select multiple items, hold down the CTRL key while clicking on another of the items you wish to select. To deselect any of the items, simply click again and it will be removed from the selection.

Applying mass actions allows for a more organised management of large numbers of problems in large and complex environments.
Note
The operational design of WOCU is oriented to perform in a simple and efficient way the tasks of monitoring and operation of Systems and Network elements: the usual workflow in this type of environment assumes that every Problem must be examined and treated by the operator or Administrator of the monitored elements. It is therefore always good practice to perform an acknowledgement (Ack) of the incidents handled, alternatively to disable the active checks (in certain circumstances), or to apply the scheduled downtime (in the case of scheduled maintenance or intervention). WOCU offers tools to keep your Problem view as clean and uncluttered as possible so that you can concentrate on an orderly handling of your Problems: it is advisable to establish good habits and incorporate a good workflow that includes a correct use of Problem Filters and Asset Actions.
Problem list export
Next to the search bar there are two options for downloading files in CSV and JSON format, for data processing and management in tools external to WOCU or for later use in the system itself.
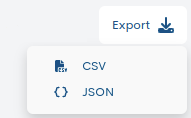
Clicking on one of the buttons starts the download of files in the format:
- CSV (Comma Separated Value)
Simple format that separates columns by a separator (semicolon “;”) and rows by a line break.
- JSON (JavaScript Object Notation)
Lightweight data interchange format capable of being read by any programming language and therefore being used to exchange information between different technologies.
By default the filename will be: problems_[realm name]_00h-00min_dd-mm-yyyy and the extension .csv or .json depending on the option chosen.
Important
If a filter is enabled, only the Problems corresponding to the filter criteria applied shall be included in the export file, i.e. the same filter applied on the screen shall be applied in the export.
Show Selected Hosts
This list offers different specific filters to configure the display of Problems, which facilitates navigation and speeds up and narrows the search in lists that can be very extensive.
Clicking on it will open a new window where, in addition to knowing which filters are active, you can interact with them.
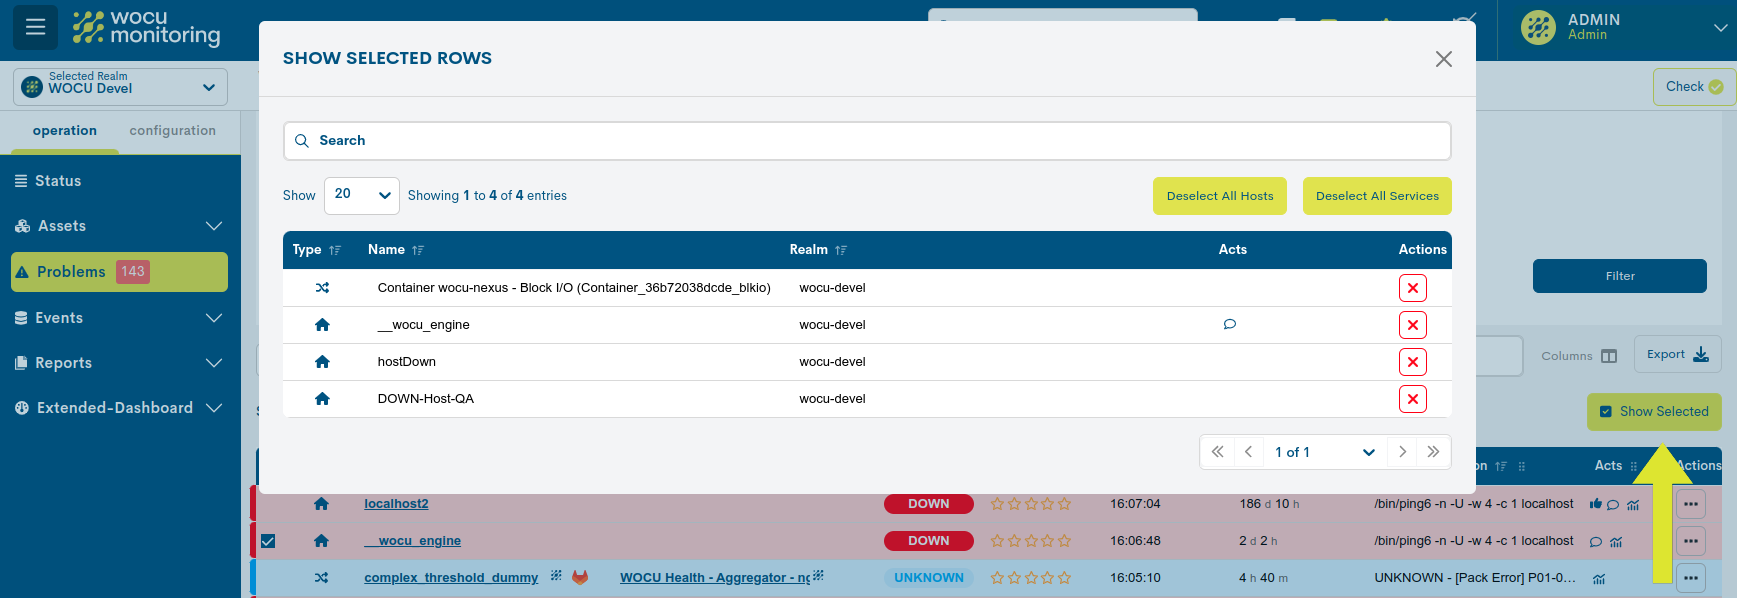
This management view consists of the following elements:
Selection of entries to display (Show) and search bar.
Selection table: with the following columns:
Type: This field hosts an identifying icon for the type of Host according to its nature. The possible options are:
Host: Dhosts identified with the house icon.

BP Hosts: Business processes identified with the house icon framed in a circle.

Host: Indicates the name by which the Host is known in WOCU-Monitoring.
Realm: Realm to which it belongs.
Deselect action: By clicking on the cross icon (X), the corresponding device will be removed from the table and automatically deselected from the inventory.
Deselect All Hosts: Acción rápida para la deselección de la totalidad de elementos de la tabla.
Important
The different navigation, search and sorting options available on this screen are explained in detail in the section: Common navigation, filtering and sorting options.


