Events
The Events tab displays event messages generated on assets monitored by WOCU-Monitoring for the selected Realm. This option allows viewing logs for a multitude of items from a single point.
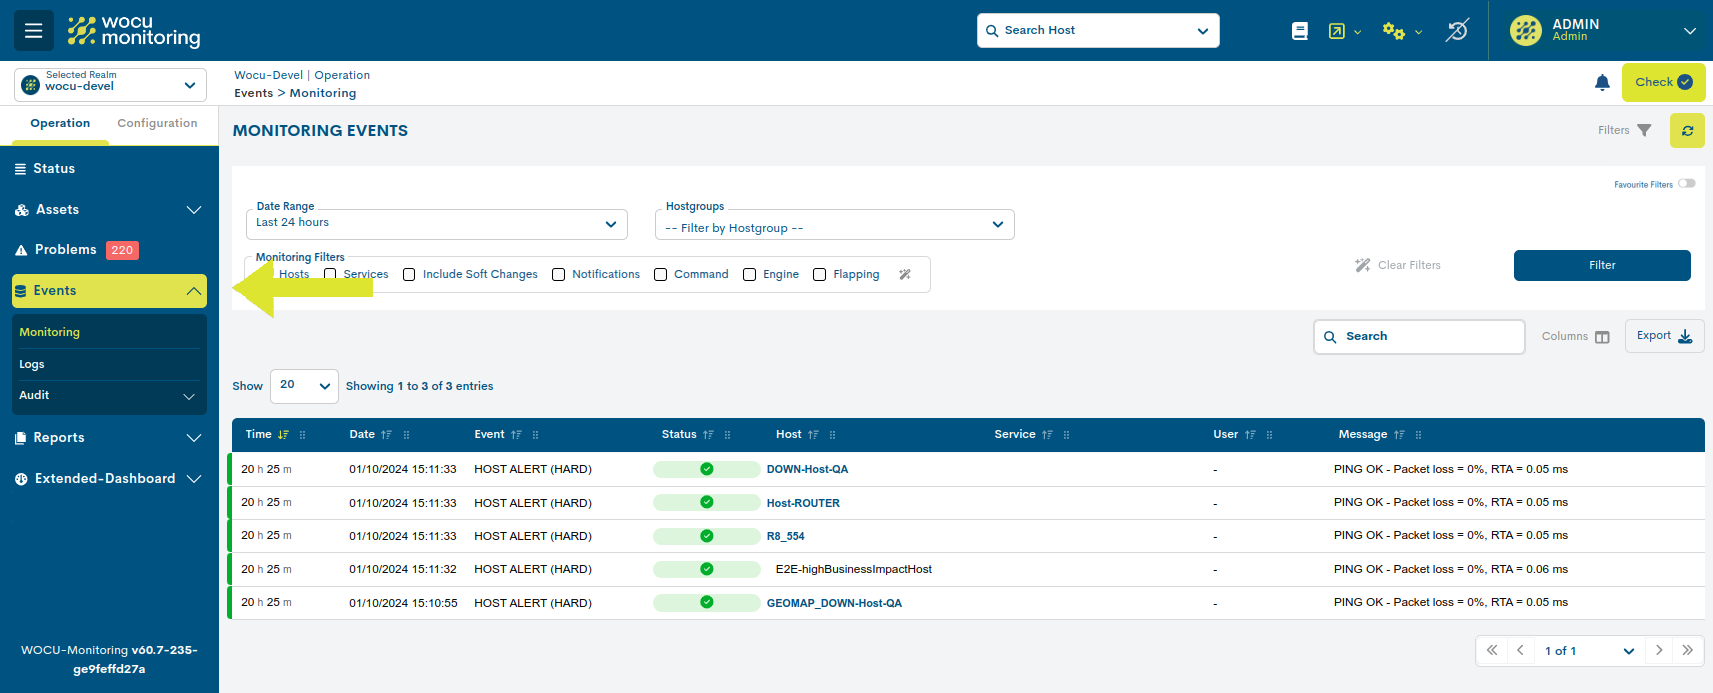
Monitoring Events (Monitoring)
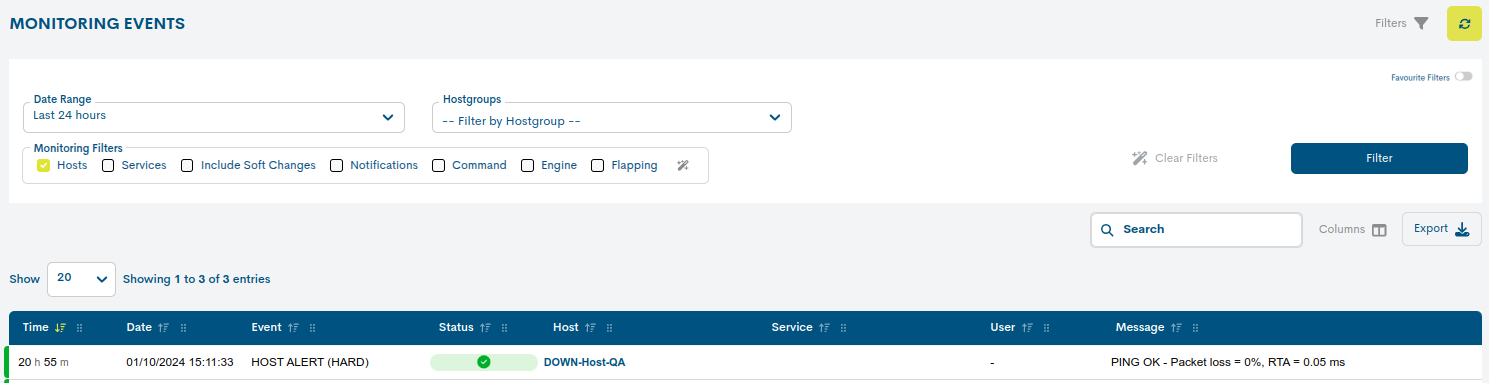
Events from the various WOCU-Monitoring Assets are stored and presented in this list. The most recent events will appear first.
Through this option the user can consult the events generated by WOCU-Monitoring in relation to the Assets managed by the tool.
Monitoring Event List Fields
The information for each of the events is recorded in a series of fields described below:

Time
This field indicates how long ago the event was received (days and hours since the event occurred).
By placing the cursor over each row of this field, the user will be able to consult the details of the field, and a pop-up text will show the date and time of the event.
Date
This field indicates the exact date and time at which the event was generated, and consequently, a relevant event occurred in the functioning and operation of the monitored assets.
Event
This field describes the type of event. The existing event types are listed below:
Alert Type Event (ALERT): This Event reports an event that causes a change in the calculation of the State in WOCU-Monitoring, for example the transition from a normal operating state (Up/OK) to a total loss of availability (Down, Critical). The types of messages that the Event field can accommodate to classify this type of Alert are the following:
HOST ALERT: message relating to an Alert on a Host when a change in the Host Status takes place.
SERVICE ALERT: message relating to an Alert in a Service when a change in the Status of the Service takes place.
HOST FLAPPING ALERT: message relating to an Alert on a Host when a rapid alternation of States (Flapping) takes place.
SERVICE FLAPPING ALERT: : message relating to an Alert in a Service when a rapid alternation of States (Flapping) takes place.
Notification Type Event (NOTIFICATION): This Event reports the sending of a warning message for a change in the Status of an Asset to the people listed in the Contacts field for said Asset. That is, it is a purely informative Event for the sending of a notice (email, SMS), which in turn originates from a Status Change Event (Alert). The types of messages that the Event field can host to classify this type of Notification are the following:
HOST NOTIFICATION: message concerning a Notification related to a Host when a change in the Host Status takes place.
SERVICE NOTIFICATION: message concerning a Notification related to a Service when there is a change in the Status of the Service.
External Command Type Event (EXTERNAL COMMAND): This event reports the execution by a WOCU-Monitoring user of any of the actions performed through the Actions on the monitored Assets (Hosts and Services) that originate the sending and execution of commands and instructions in WOCU-Monitoring. In this way, the actions performed by WOCU-Monitoring users are also recorded. Thus, for example, the application of the Acknowledgement of an Alarm will result in an event that will be identified with this label “EXTERNAL COMMAND”.
Engine Type Event: This Event reports important events related to the Monitoring Engine. The types of messages that the Event field can host to typify this type of Event are the following:
CONFIGURATION CHECKED: Informs that a new Configuration has been checked as well as the result of this check.
CONFIGURATION LOADED: Reports that a new Configuration has been loaded into the Monitoring Engine
NOTIFICATIONS ENABLED:Informs that the No
Status
This field reports the Status that WOCU-Monitoring calculated for the Asset at the time of receipt of the Event.
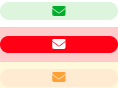
For this purpose, the impact of each Event on the State determined by WOCU-Monitoring is reported through an icon. The following icons exist:
Normal operating state (Up/OK), identified by the green tick icon:

Down/Critical status, identified by the red down arrow icon:

Warning status in the operation of a Service (Warning), identified by the yellow exclamation icon:

Loss of contact status (Unreach/Unknown), identified by the grey question mark icon:

Flapping state, identified by the blue rotating arrows icon:

Notification of the sending of a message due to a change in the status of an Asset (Notification), identified by the envelope icon:
Notice of execution of Actions on the monitored Assets by a WOCU-Monitoring user (Commands), identified by the gear icon:

Note
Additionally, the Status is also displayed on the background colour of each row of the event list, indicating to the user the change in Status that each event causes.
Host
This field contains the name of the Host that generated the event (by clicking on the name you can access the Detail View of that Host).
Service
This field indicates to which Service of the Host the event corresponds.
User
This field contains the name of the contact person in the event of an incident.
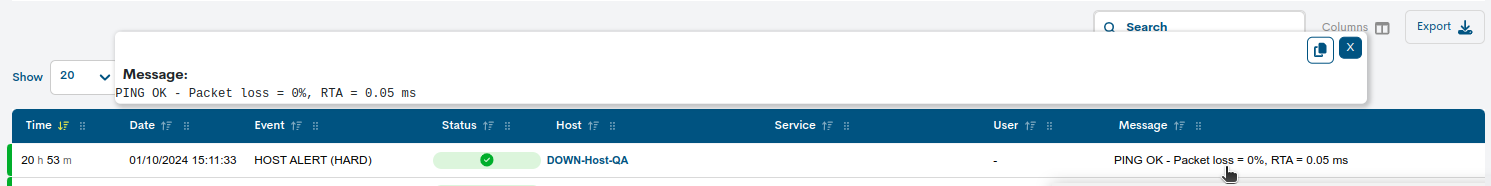
Info
This field contains a descriptive text of the event.
By placing the cursor over each row of this field, the user will be able to consult the full content of the field, and a pop-up text will appear with all the text with the information of the Event message. This is very useful in those occasions in which the text exceeds the available space and appears truncated. This is indicated by placing an ellipsis at the end of the cell (…). In these cases this is the easiest way to consult all the information about the event.
Filtering of the list of Monitoring Events
The filters in the Monitoring Event List allow the user to select which of the stored Events will be displayed. To do this, WOCU-Monitoring provides the user with tools that allow the user to select events either based on time criteria or on criteria of the type of the events themselves.
Date Range Filter
First, the Monitoring Events can be filtered according to the dates on which they were generated. For this purpose, the time filter described below is used.
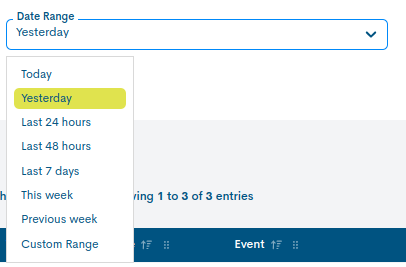
There are several time criteria already set for Event filtering:
Today: filters and displays only the events generated during the time period elapsed during the current day.
Yesterday: generated yesterday.
Last 24 hours: generated in the last 24 hours.
Last 48 hours: generated in the last 48 hours.
Last 7 Days: generated in the last seven days.
This Week: generated during the period of time elapsed in the current week (from the start day of the week to the current day).
Previous Week: generated in the previous full week (Monday-Sunday).
In case you want to set a specific period of time there is the option Custom Range. To configure the time frame it is necessary to set a start date and an end date. By clicking on one of the days, this date will be set as a selection, being marked with a blue background. In addition to the day, a specific time can be set for that day, using the drop-down menus in the hour, minute and second boxes, until the desired time is set. The selected date and time can be seen both in the upper boxes and in the lower part of the view.
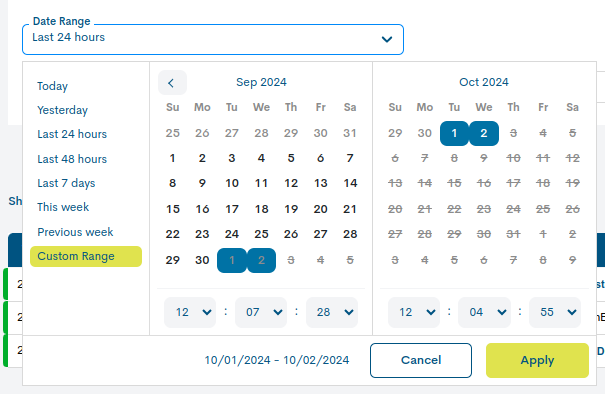
Once the programming has been carried out, click on the Apply button to apply the programming.
Attention
It is of course not possible to choose start and end dates after the current date, nor to set an end date before the start date.
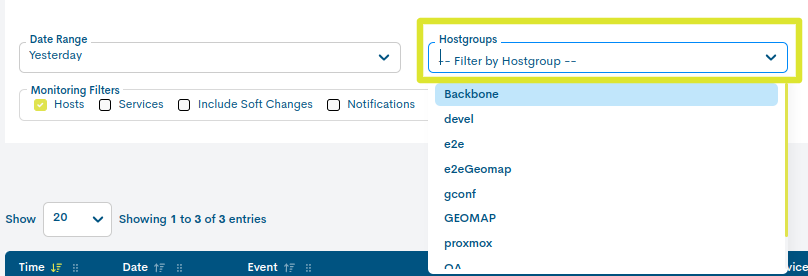
Filtered by Hostgroup
This action performs a filtering showing only the elements belonging to the chosen Hostgroup. To select a specific group, select the name of the group you wish to select from the drop-down list. To cancel the filter and show all the hosts, just select the first option in the drop-down list (-No HG filter-).
Important
The different navigation, search and sorting options available on this screen are explained in detail in the section: Common navigation, filtering and sorting options.
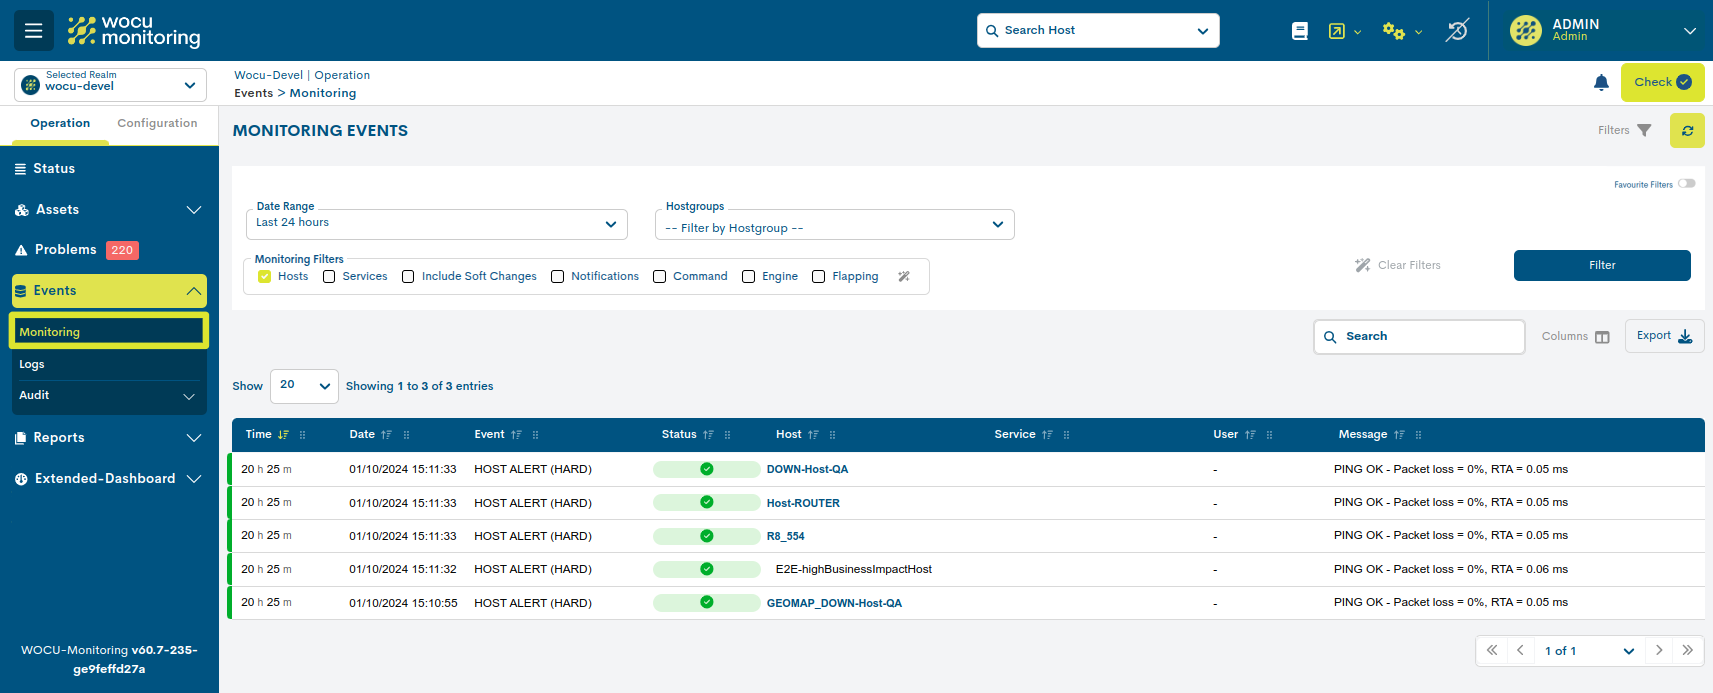
Monitoring Filters
The other filtering system for Monitoring Events is based on the types of Events recorded by WOCU-Monitoring. Using this filtering it is easy to choose the events that fall within certain categories.
For this purpose, WOCU-Monitoring offers the following options:
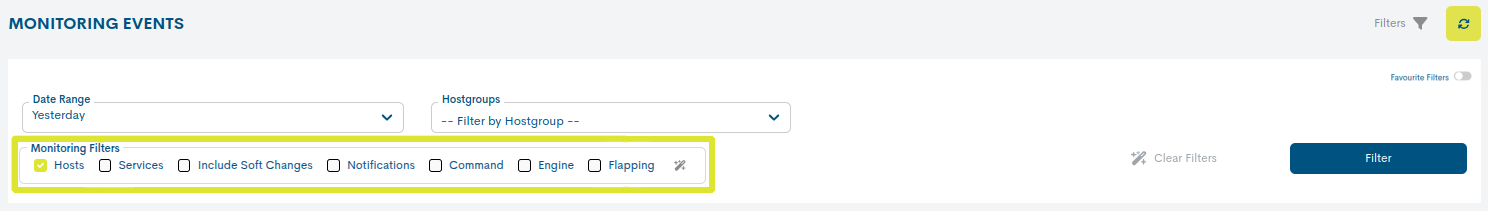
Once one of the filters is selected, the box preceding each of the titles will appear marked with a tick. After clicking the Filter button, the selected filters will be applied to the events shown.
The following filters are available:
Hosts
Selecting this filter will display events related to the Hosts monitored in WOCU-Monitoring.
Services
Selecting this filter will display events related to the Hosts monitored in WOCU-Monitoring.
Notifications
Selecting this filter will display events of type Notifications.
Commands
Selecting this filter will display events of type Commands.
- Engine
Selecting this filter will display the Engine type events.
Flapping (Fast alternation of states)
Selecting this filter will display events of the type Rapid State Flapping.
Include Soft Changes
Checking this box will include in the list all SOFT type events registered and stored in WOCU-Monitoringonitoring. By default, this option is
Remember
SOFT: is assigned when the service status obtained is not definitive, as it may or may not be reverted in the next check attempt. In the case of exceeding the predefined number of attempts obtaining negative statuses, the error severity level shall be raised to HARD type. The objective is to avoid false alarms due to transient problems.
HARD: is assigned when the status of the service obtained is continuously erroneous, without being corrected. That is, when the service returns a negative status in the first attempt and also in the subsequent checks, exceeding the predefined number of attempts. This new situation is notified to the contact user.
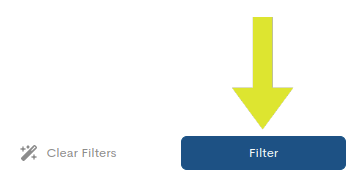
Filter button
To consolidate the desired filter configuration, it will be necessary to first activate the Filter action to reload the inventory with the new data request launched.
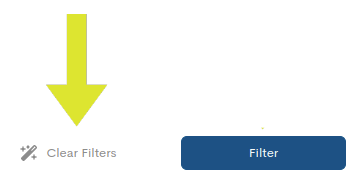
Clear Filter button
When the intention is to clear the applied filters, you can click the Clear filter button, and the configuration will be reset immediately, except for the search performed in the Search bar.
Export of the list of Monitoring Events
Next to the search bar there are two options for downloading files in CSV and JSON format, useful for processing and managing data in tools external to WOCU-Monitoring or for later use in the system itself.
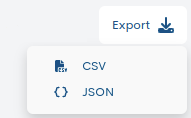
For the Events view the formats available through the Export option are:
CSV
Clicking on the corresponding button will open a new modal for the selection and marking of parameters to be exported at the user’s discretion. The available options are:
Time
Date
Event
Status event
Status
Host (Required)
Service
User
Message
Once the selection is confirmed, a file is downloaded in CSV (Comma Separated Value) format, a very simple format that organises the columns by a separator (semicolon “;”) and the rows by a line break.
JSON
This other option follows the same operation as the previous case, but initiates the download of a file in JSON (JavaScript Object Notation) format, a lightweight data exchange format capable of being read by any programming language and, therefore, used to exchange information between different technologies.
Important
If a filter is enabled, only the Events corresponding to the filter criteria shall be included in the export file, i.e. the same filter applied on screen shall be applied in the export.
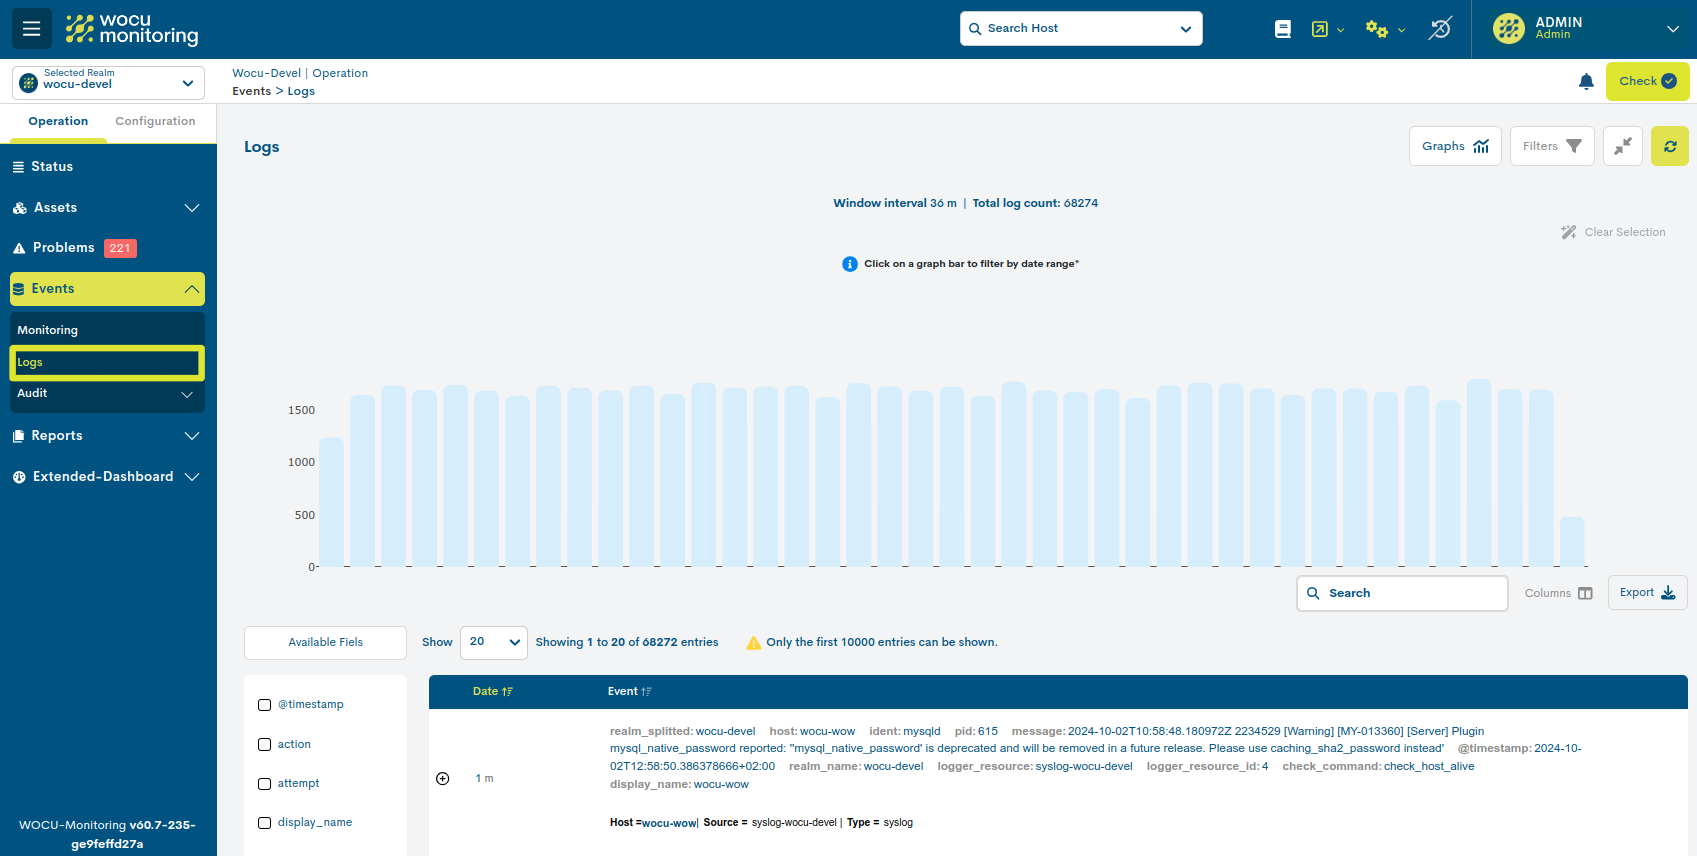
Other Log Events (Logs)
Thanks to the Other Event Log listing, WOCU-Monitoring is able to query and display other external event messages, independent of WOCU-Monitoring events, but which may be useful in daily monitoring and operation tasks.
Note
As indicated in the text: Only the first 10000 entries can be shown, only the first 10000 entries will be shown, to ease and ease the query computation capacity.
Log Event Graph
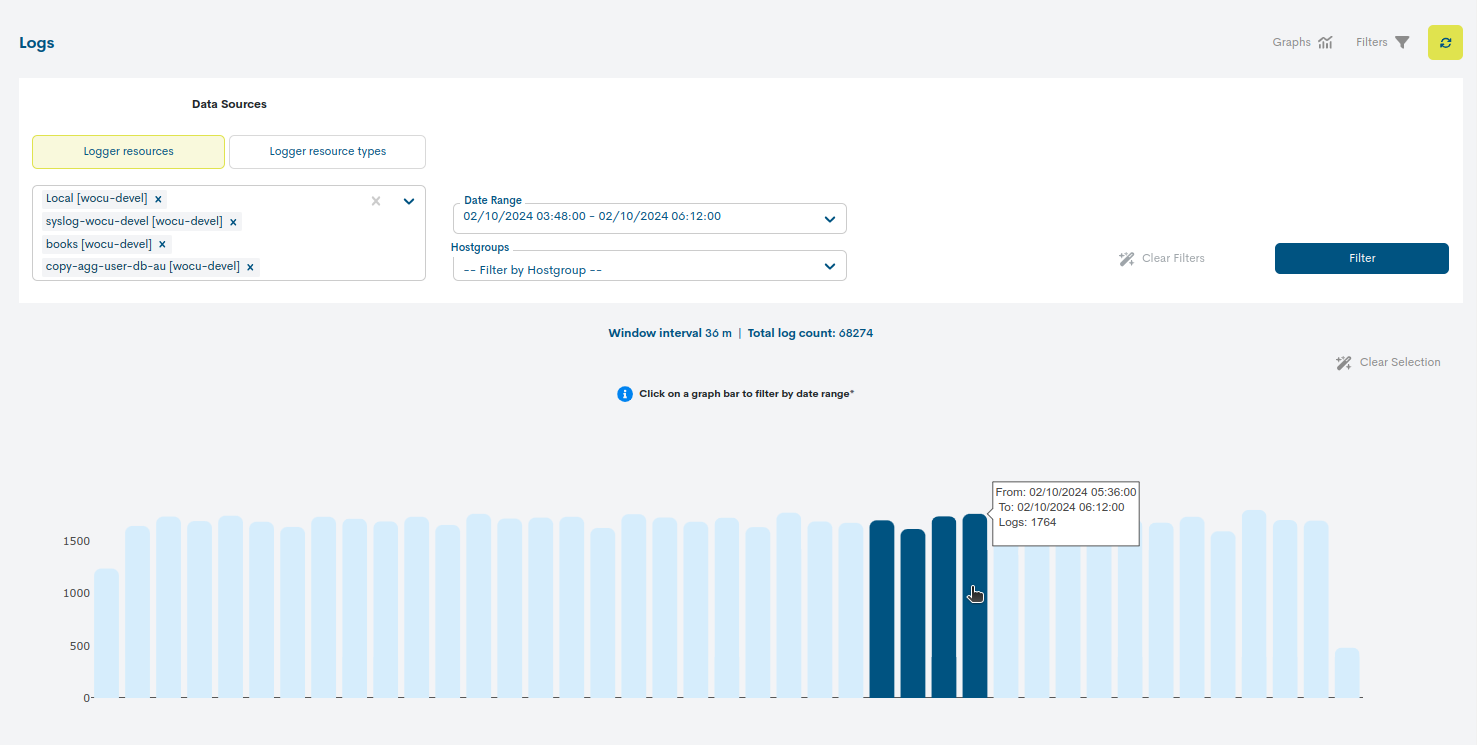
The purpose of this graph is to show the progression of event receipts between two dates for a particular realm. Various filters can be configured that will affect the data displayed in the graph, these are explained in more detail in Filtering of the Log Events list.
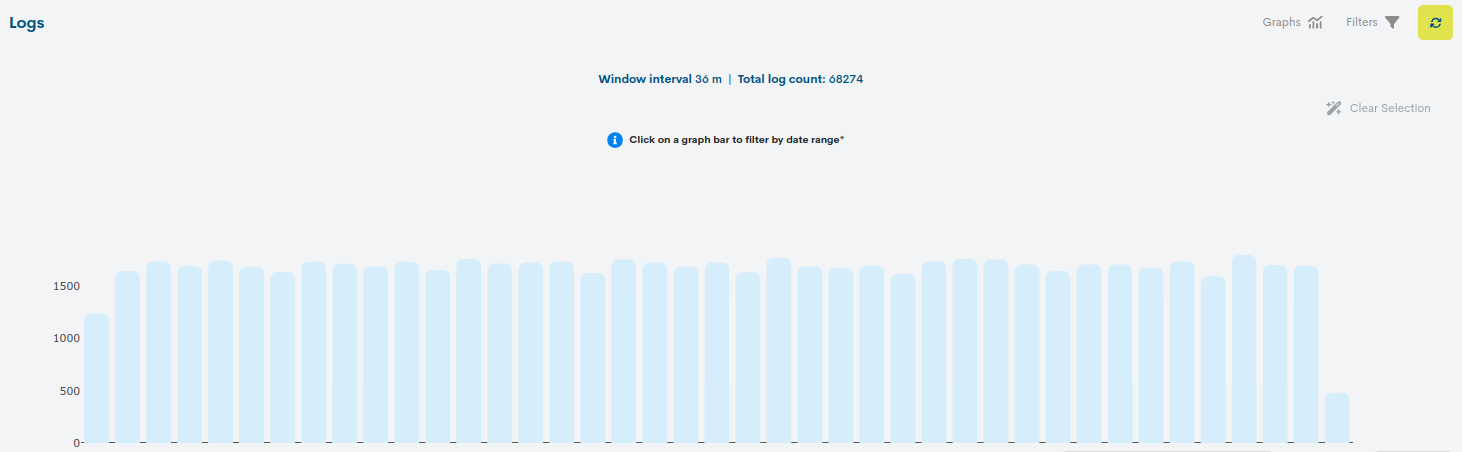
Regardless of the length of the date range, the interval is divided into 40 slices or bars to identify valleys or peaks of events in a very visual way. On the left side of the graph the oldest logs will be shown and on the right side the most recent logs will be shown.
As can be seen in the following image, placing the cursor over a specific bar displays a summary view, which specifies a specific time range (From/To) and the logs that have been recorded in that period. It allows to know when there is more or less activity in a specific time range.
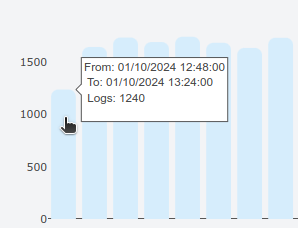
In this way, it is easy to graphically analyse the log input, since it is common that in the event of an incident in the monitored infrastructure, the volume of logs sent by the different Assets increases.
A function that integrates the graph, is to filter logs by clicking on one or more time bars. For this purpose, the Date Range filter will be updated according to the time period covered by the highlighted bar (now highlighted in dark colour). In case two or more consecutive bars are selected, the filter shall nest and record the time period between the bars, i.e. the range starts with the time and time of the first bar and ends with the time and time of the last bar.
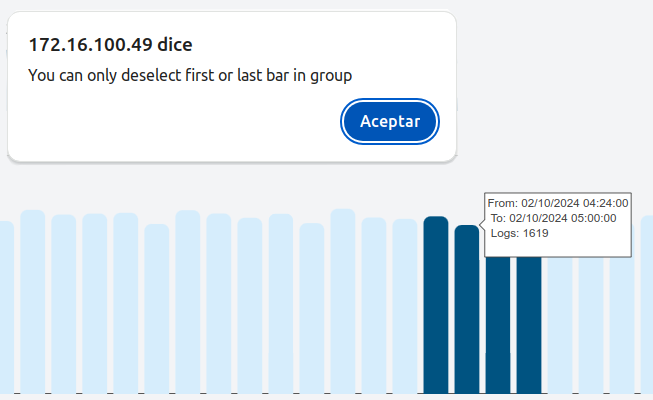
Attention
It shall not be possible to deselect intermediate bars, as this would “break” the selected time range. In such a situation, the system shall notify the following message:
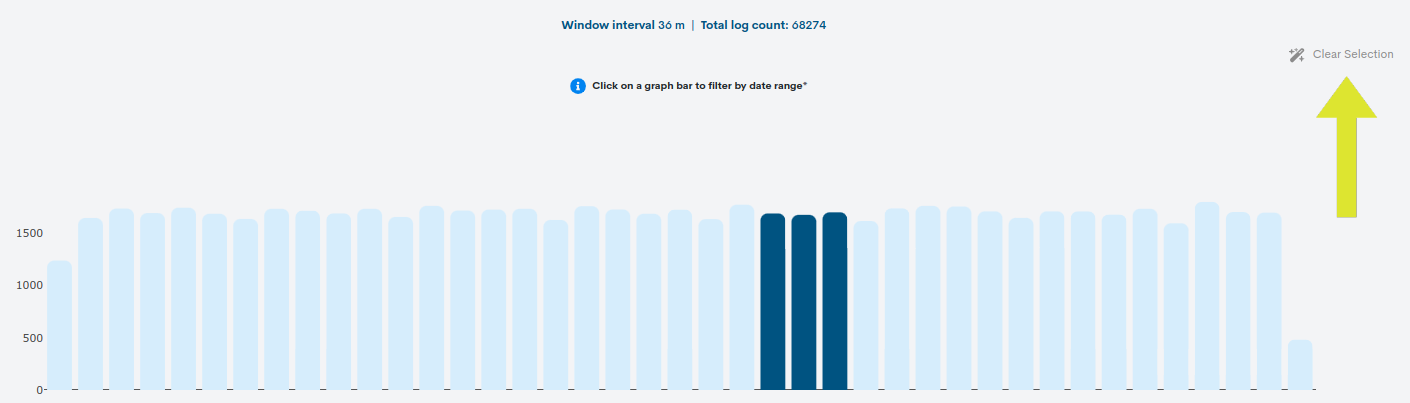
You can also reset the selection applied to the graph using the Clear Selection button. In addition, the Date Filter Range will return to the Last 24 hours option by default. This button will only be enabled when there are marked bars.
Log Event List Fields
The log event listing allows the consultation of all these messages sent by the different monitored elements.
The information is displayed structured in two fields:
Date
This field indicates how long ago the event was received (hours, minutes and seconds since the event was sent).
Event
This field stores the full text of the logs.
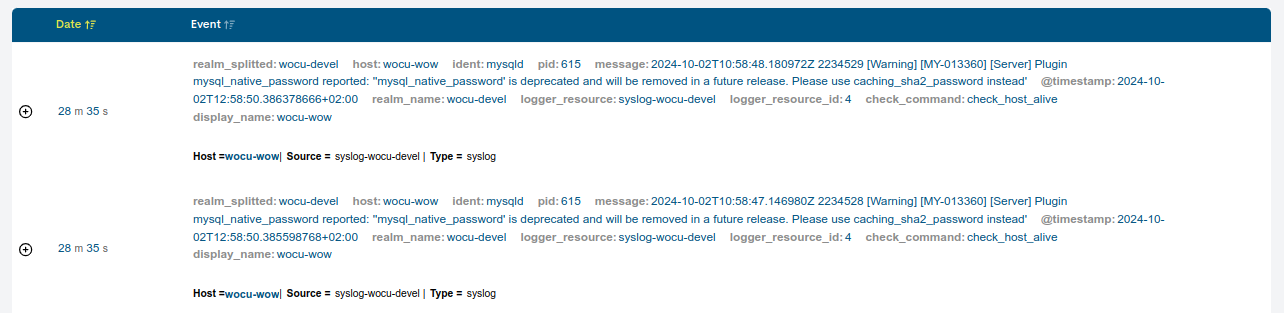
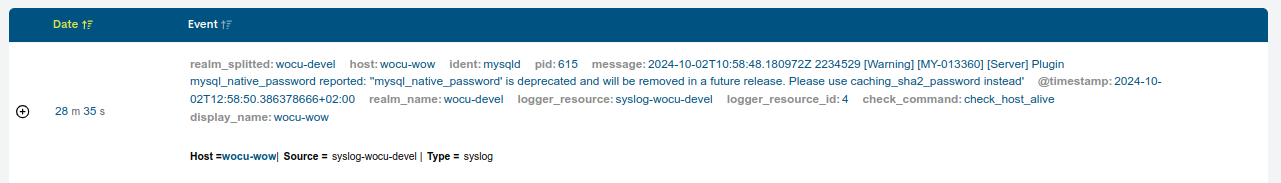
This text is displayed in JSON (JavaScript Object Notation) format, defining a series of fields or variables and their respective values. To facilitate the reading of these fields, WOCU-Monitoring offers a detailed and ordered entry of each log. To do this, you have to click on the entry text and the following data table will expand:
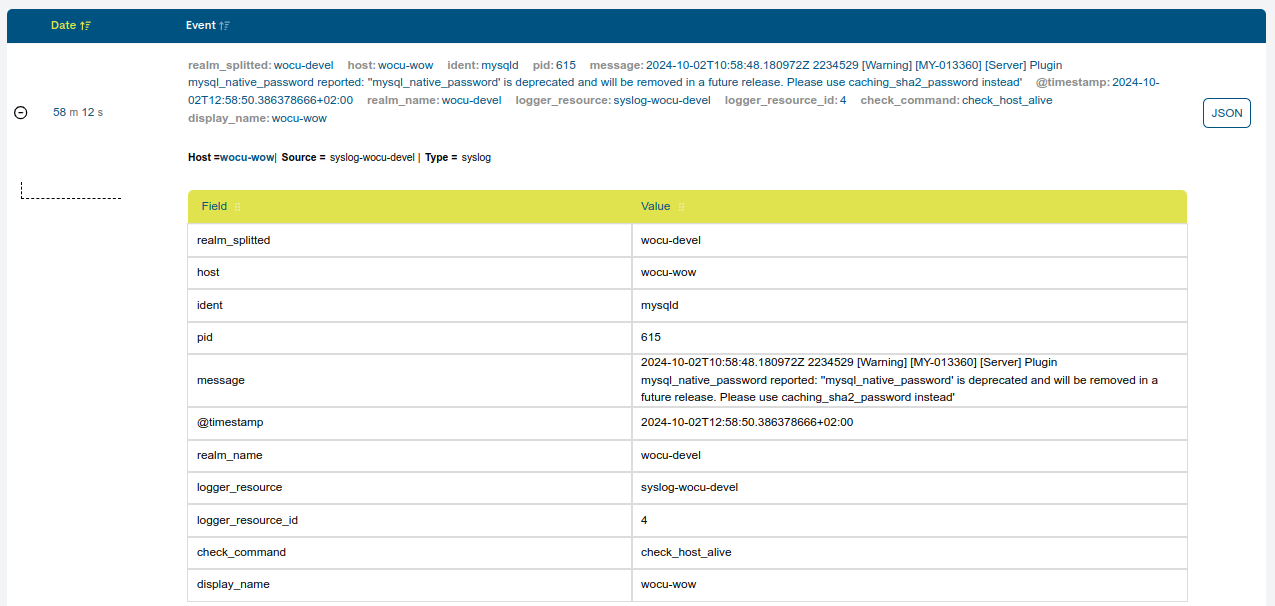
To collapse the information displayed, click on the button identified with a minus sign (-), located to the right of each cell.
At the bottom of each Event field entry are three fields in which WOCU-Monitoring provides information about each of the logs:
Host: Name of the Host to which the log message belongs. Clicking on this Host name accesses the Asset Detail View
Source: Name of the source, item, or host from which each log message was extracted.
Type: category to which the log message belongs based on its type.
Attention
In the process of configuring the log data sources, it is possible to assign a colour to each of them. This colour then appears in each of the entries, on the left-hand side, preceding the Date field. Therefore, the colour associated with each data source is completely configurable and will depend on the criteria of your Administrator.
Button to hide filters
To offer a cleaner and more focused interface, this button allows you to hide the search bar and the export button, prioritizing the display of the main table. Remember that the filter block can also be hidden, leaving the view completely clear.
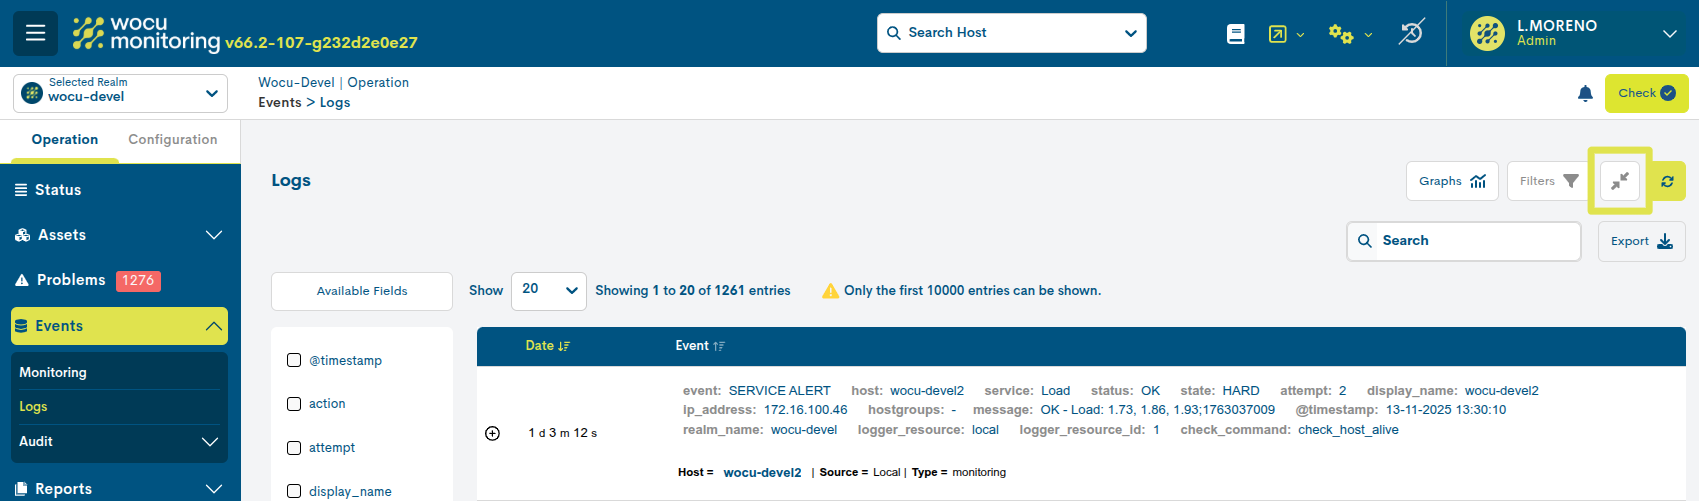
Once activated, a fixed side button will appear, allowing you to redisplay the hidden panel at any time, ensuring quick and flexible access to the filtering options.

Filtering of the Log Events list
Pressing the Show Filters option located at the top right of the screen will reverse the hiding of the Event filters and they will be visible.
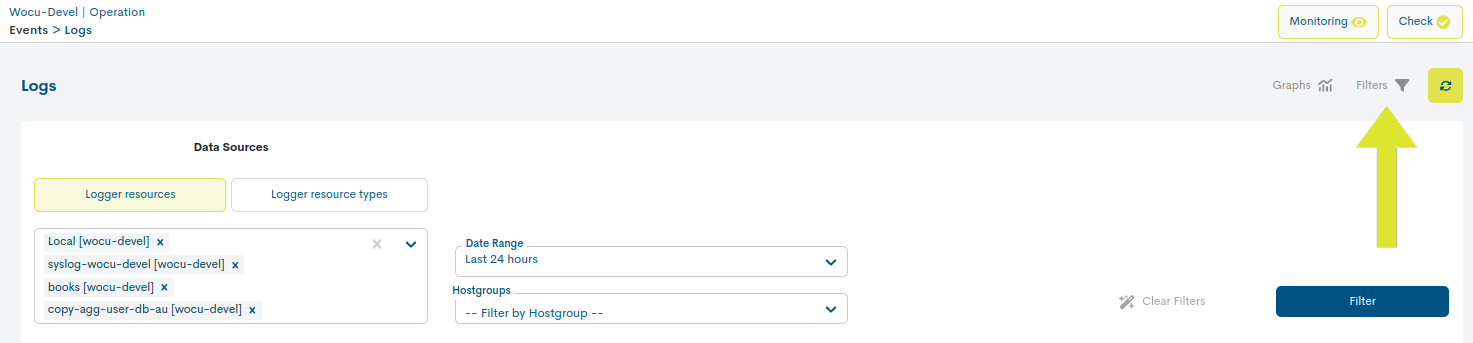
Filtering by Data Sources
By selecting one of the options in this menu, Logger resources or Logger resources types, it is possible to filter the list of logs that come from the selected source or type of source.
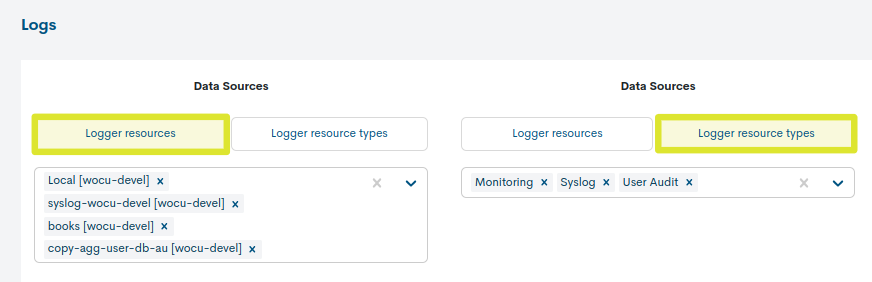
Once you have selected the Logger resources option or the Logger resources types option, you will have to select one or more of the sources or types of sources listed under the buttons (the options selected by default will be highlighted with a grey background and those selected by the user with a blue background). To select multiple options, hold down the CTRL key while clicking on the name of the options you wish to select.
Date Range Filter
Log Events can be filtered according to the dates on which they were generated. The time filter described below is used for this purpose.
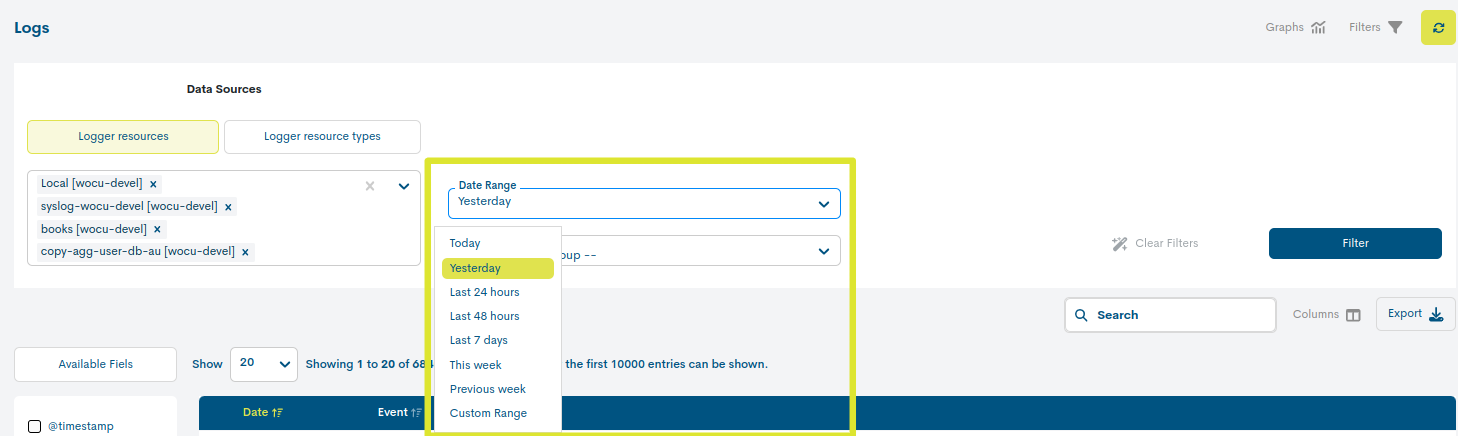
There are several time criteria already set for log filtering:
Today: Filters and displays only log events generated during the time period elapsed in today’s day.
Yesterday: generated yesterday.
Last 24 hours: generated in the last 24 hours.
Last 48 hours: generated in the last 48 hours.
Last 7 Days: generated in the last seven days.
This Week: generated during the period of time elapsed in the current week (from the start day of the week to the current day).
Previous Week: generated in the previous full week (Monday-Sunday).
In case you want to set a specific period of time there is the option Custom Range. To configure the time frame it is necessary to set a start date and an end date. By clicking on one of the days, this date will be set as a selection, being marked with a blue background. In addition to the day, a specific time can be set for that day, using the drop-down menus in the hour, minute and second boxes, until the desired time is set. The selected date and time can be seen both in the upper boxes and in the lower part of the view.
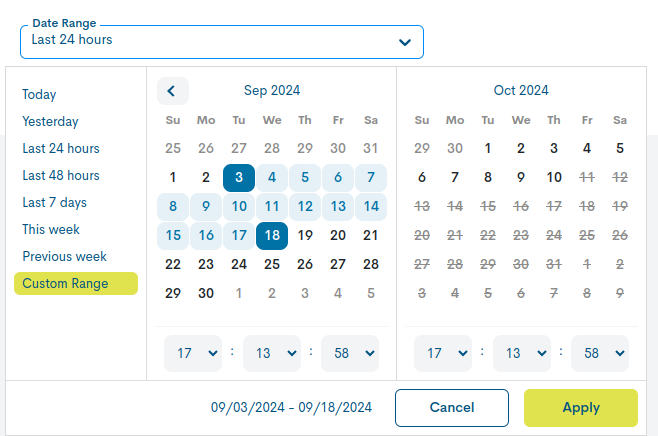
Once the programming has been carried out, click on the Apply button to apply the programming.
Attention
In order to facilitate and alleviate the query computation capacity, the filtering of events by date range is limited to a maximum of seven days, i.e. the defined range may not exceed this interval (seven days).
It is of course not possible to choose start and end dates after the current date, nor to set an end date before the start date.
Filtered by Hostgroup
This action performs a filtering showing only the logs of the elements belonging to the chosen HostGroup. To select a specific group, choose the name of the group you wish to select from the drop-down list. To cancel the filter and show all the hosts, just select the first option in the drop-down list (-No HG filter-).
Filter button
To consolidate the desired filter configuration, it will be necessary to first activate the Filter action to reload the inventory with the new data request launched.
Clear Filter button
When the intention is to clear the applied filters, you can click the Clear filter button, and the configuration will be reset immediately, except for the search performed in the Search bar.
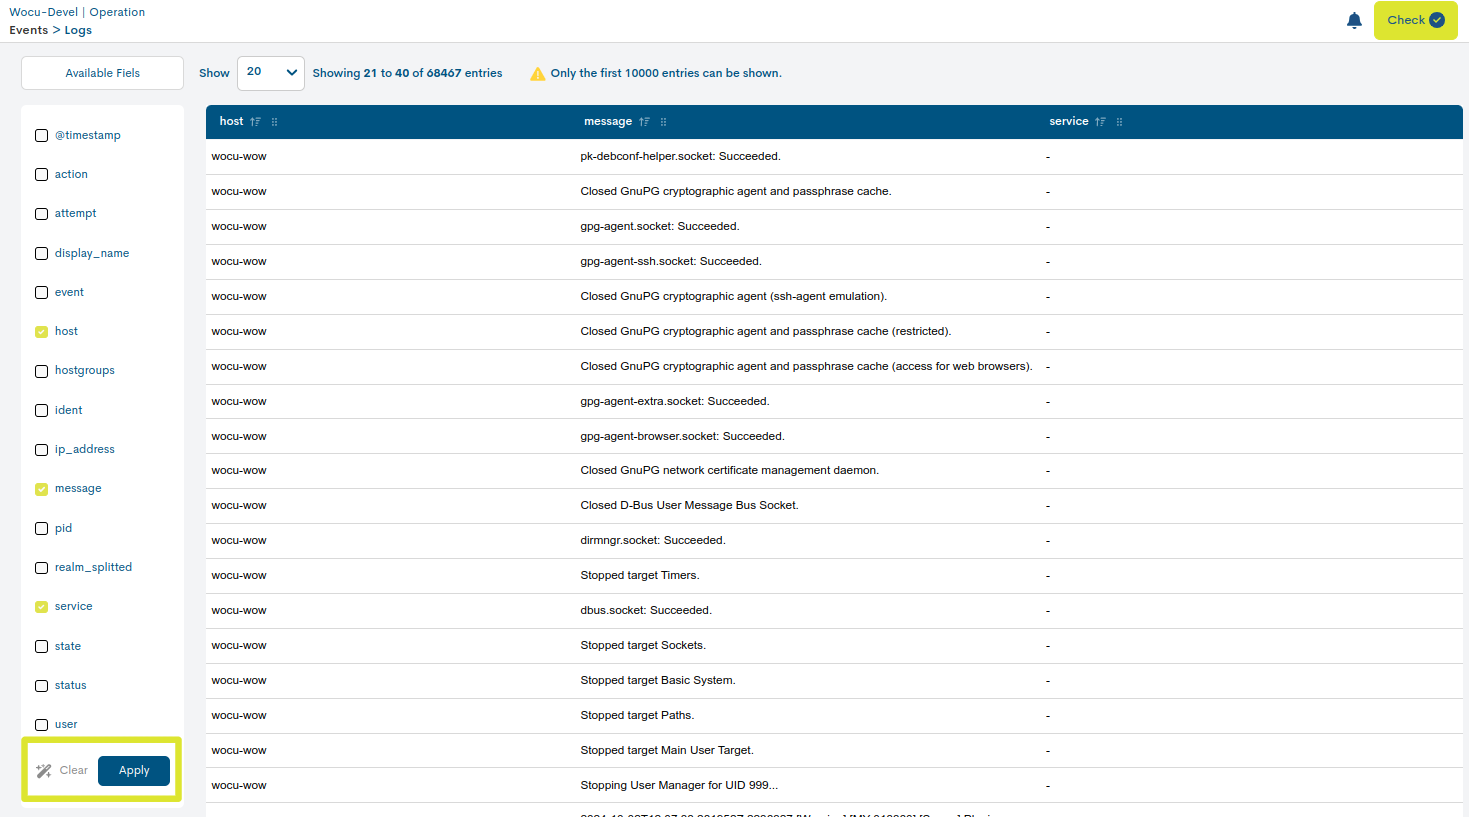
Available fields filter
The Available fields filter allows you to select the information displayed in the Log List. Thanks to this filter it is possible to select which of the information collected in the Event field will be displayed to the user.
To do this, the filter allows you to select from a series of fields that are commonly found in log messages stored in WOCU-Monitoring. Once the fields to be displayed have been chosen and the selection applied.
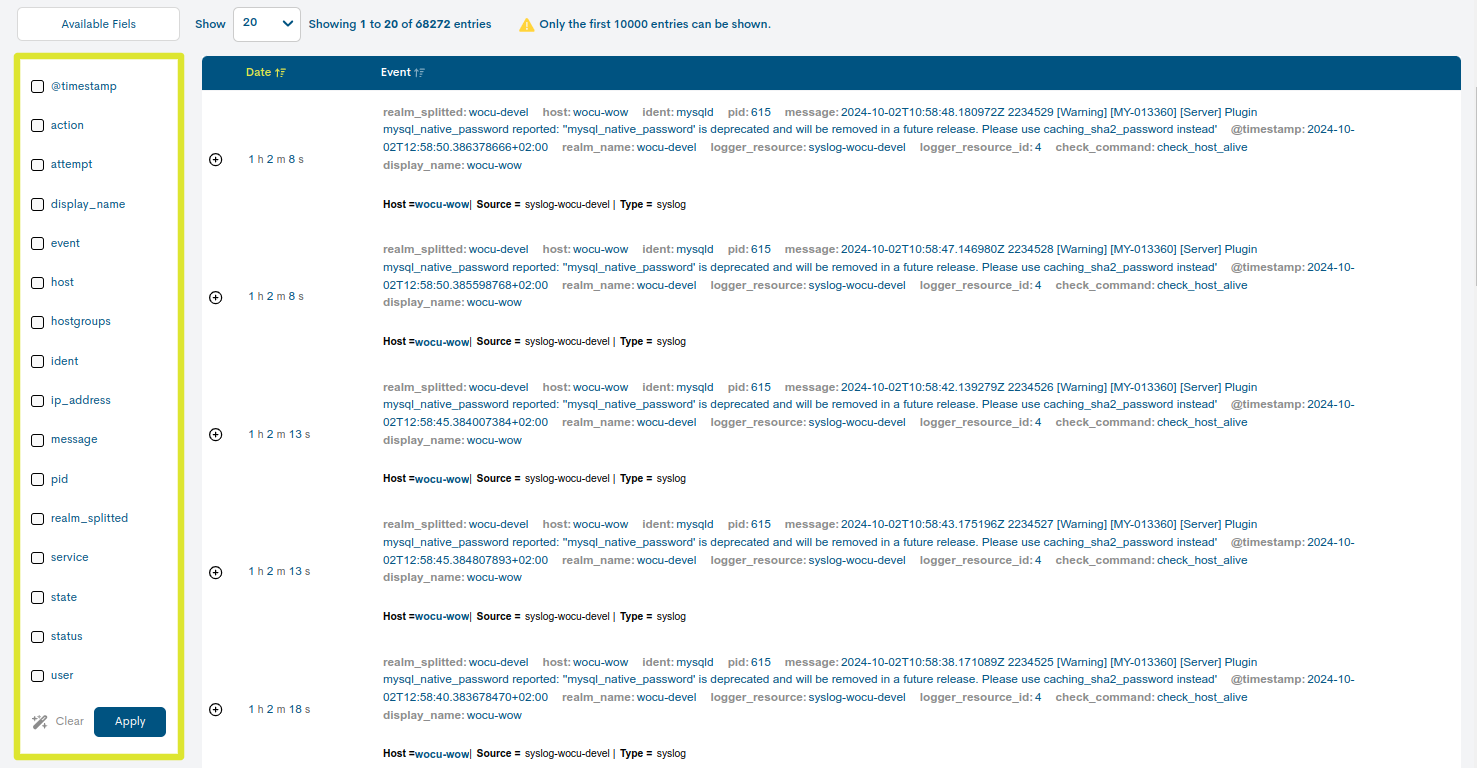
To select the fields to display, simply click on them. These will be marked with a tick. To execute the selection, you will have to press the blue Apply button. Using the Clear option, all fields that have been selected will be deselected.
Note
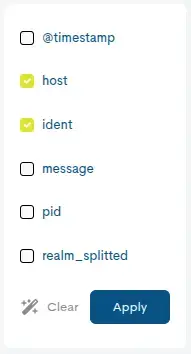
For events with nested objects, the system allows filtering by all the keys that make up these objects.
See the following event as an example:
{
    "event": {
    "message": "WOCU-Monitoring",
    "host": "router_1"
    "@timestamp": "2023-06-11T09:33:54.472577536+02:00",
    }
}
You will be able to filter by your keys as shown in the image:
Export of the list of Monitoring Events
Next to the search bar there are two options for downloading files in CSV and JSON format, useful for processing and managing data in tools external to WOCU-Monitoring or for later use in the system itself.
For the Events view the formats available through the Export option are:
CSV
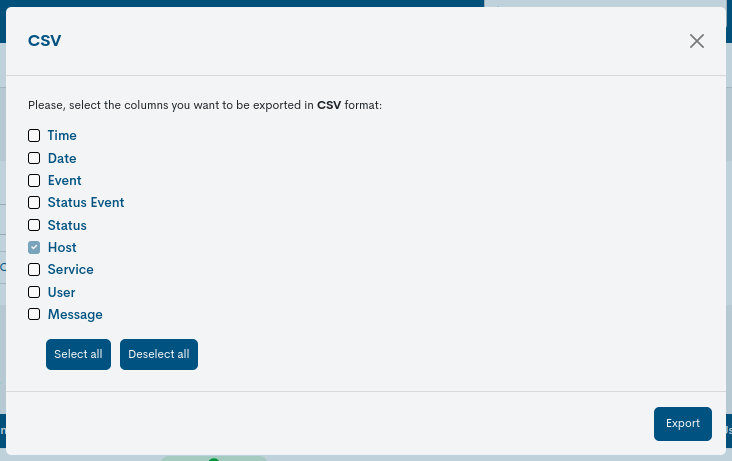
Clicking on the corresponding button will open a new modal for the selection and marking of parameters to be exported at the user’s discretion. The available options are:
Logger resource (Required)
Realm name (Required)
Timestamp
Attempt
Host display Name
Event
Host
Hostgroups
Ip address
Message
Service
State
Status
Audit
Once the selection is confirmed, a file is downloaded in CSV (Comma Separated Value) format, a very simple format that organises the columns by a separator (semicolon “;”) and the rows by a line break.
JSON
This other option follows the same operation as the previous case, but initiates the download of a file in JSON (JavaScript Object Notation) format, a lightweight data exchange format capable of being read by any programming language and, therefore, used to exchange information between different technologies.
Important
If a filter is enabled, only the Events corresponding to the filter criteria shall be included in the export file, i.e. the same filter applied on screen shall be applied in the export.
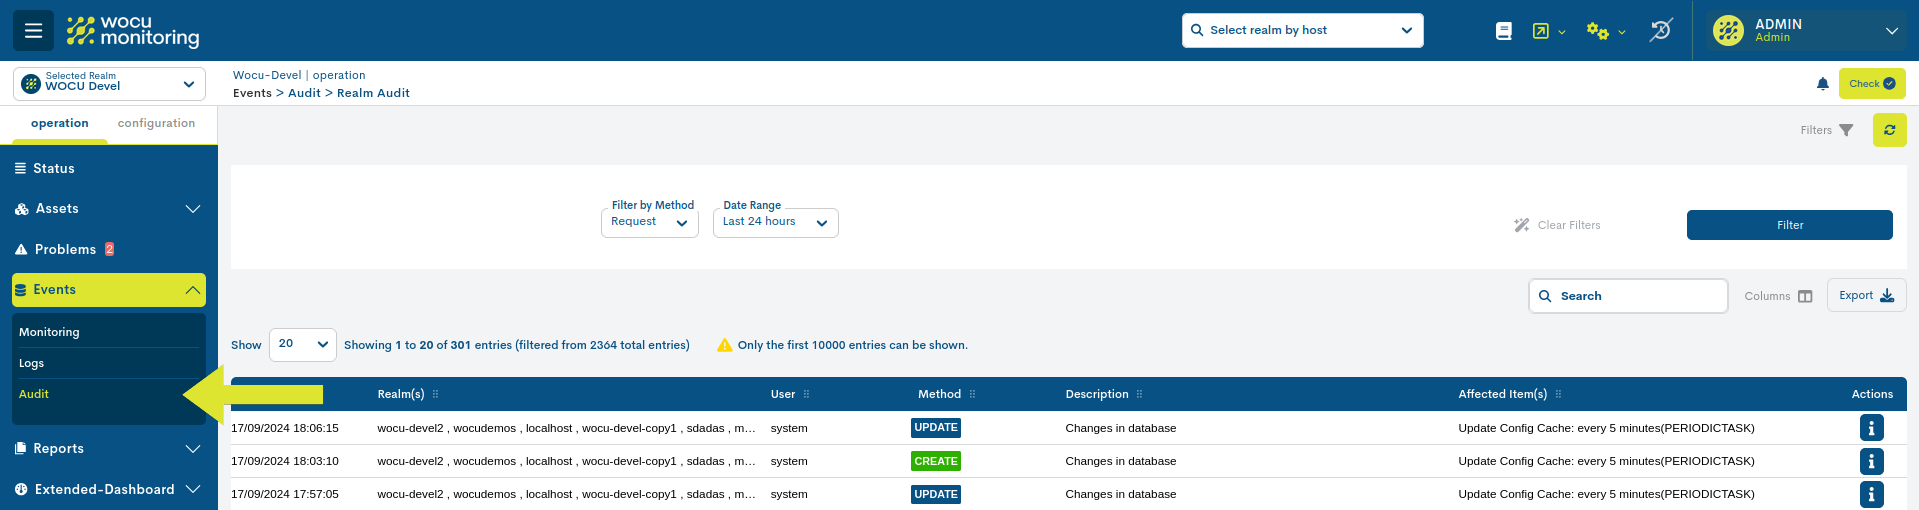
Audit
In this section you can view all the actions and operations carried out on a specific Realm, i.e. the information that is audited at Realm level is provided, with the purpose of making a subsequent audit of the processed information feasible.
Important
This space will only be operational in standard Realms.
Note
As indicated in the text: Only the first 10000 entries can be shown, only the first 10000 entries will be shown, to ease and ease the query computation capacity.
Audit List Fields
The fields that head the table are described below:
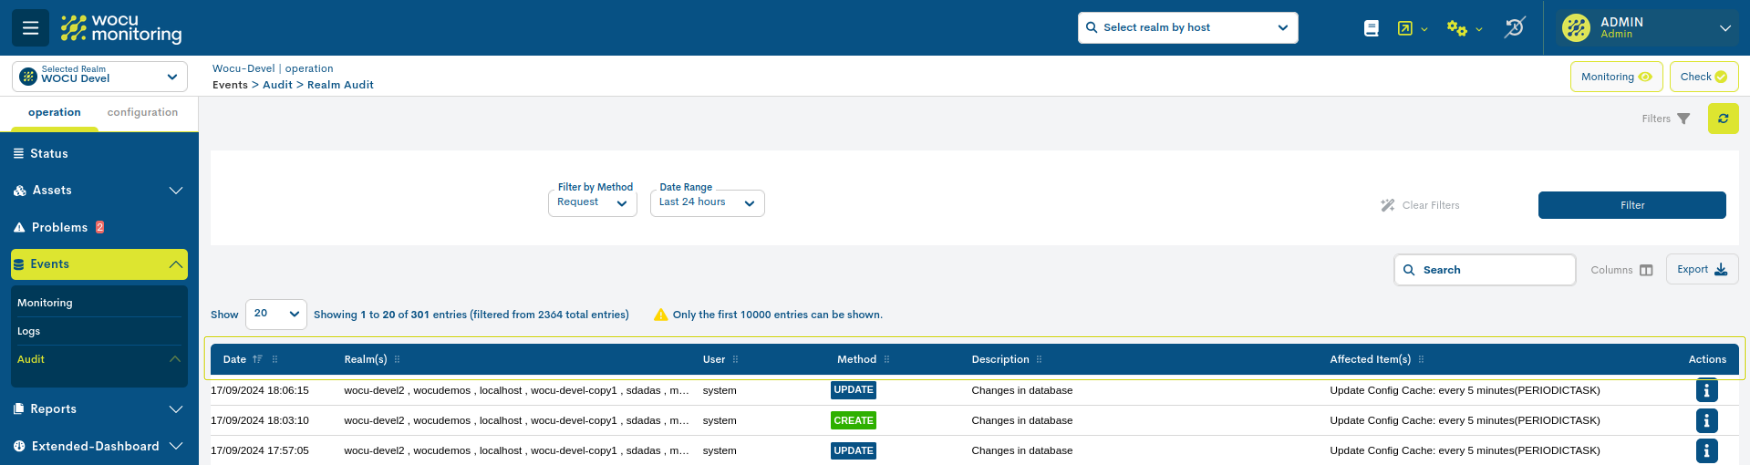
✓ Date: date and exact time when the action was registered in the system, and consequently, a relevant event in the internal functioning and operation of the Realm took place.
✓ Realm(s): entity or set of entities where the action has been registered.
✓ User: user profile that has executed the action registered in the infrastructure.
Note
There is a user called System, author of automatic and periodic tasks managed in the application (launching Import Tasks (Tasks), Schedule, etc.). It is assigned when there is no user behind the action performed.
✓ Method: indicates the method used according to the origin or nature of the audited action. It is categorised as follows:
Changes that occur at the database level, i.e. operations performed on a particular Realm from its Configuration Module.
These are:
CREATE
UPDATE
DELETEAudited requests based on HTTP protocol.
GET
POSTRelating to automatically executed processes (such as Reports and Import Tasks (Tasks)). Possible options include:
SCHEDULED <Name> REPORT: Scheduled Availability Report, Scheduled Multimetrics Report, Top Hosts Report, etc.
<Name> REPORT: Availability Report, Multimetrics Report, Top Hosts Report, etc.
SNMP IMPORT
CSV IMPORT
SNMP IMPORT INVENTORYNote
There is a Filter by Method filter to limit the table by HTTP requests (Requests), database requests by configuration changes (Changes in configuration) or automatic processes (Automatic Process).
✓ Description: contains a general description of the registered operation.
✓ Affected Item(s): type of asset involved in the action performed. There are many types of items stored in the database (HOST, SERVICES, REPORTS, etc.).
✓ Actions: allows to know in detail the characteristics of the action performed on an object.
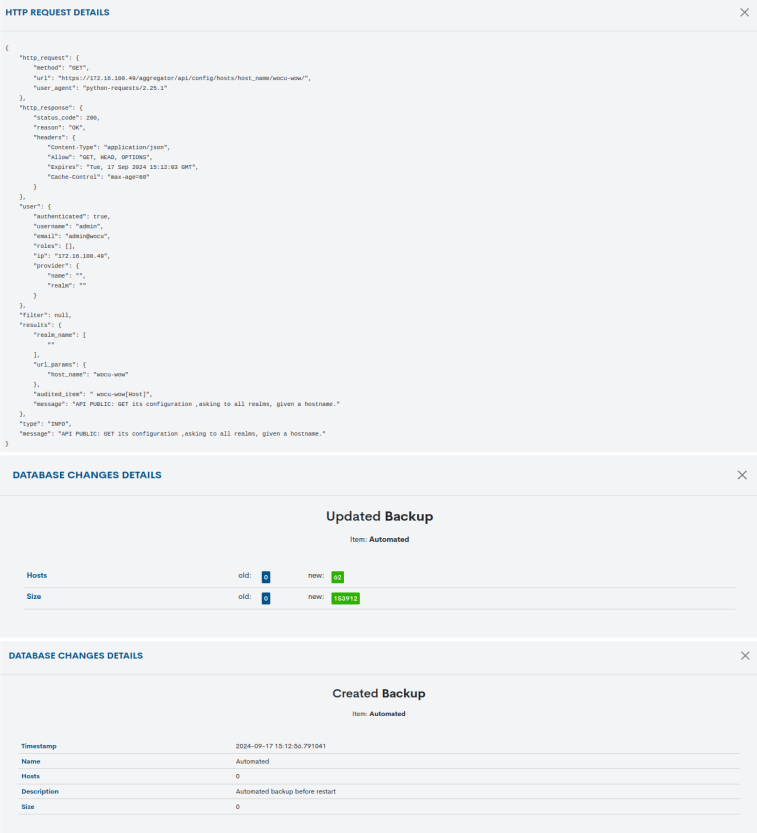
Note
It may happen that the text displayed in any of the columns exceeds the available space, in which case the text will be cut off at the limit of each column, followed by an ellipsis (…) to indicate that the text continues but has been cut off. However, you can view the full information by placing the cursor over the text.
Filtering the Audit List
Filtering of objects in the table is possible from the following drop-downs:
✓ Filter by Method: this selector gathers all possible methods categorised according to the origin or nature of the action:
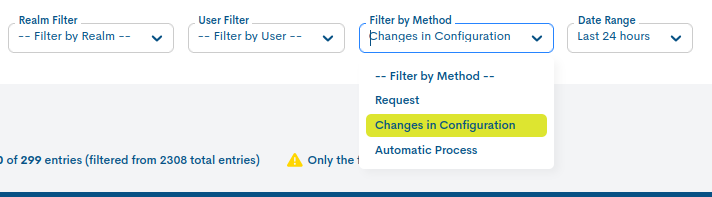
Changes in configuration: encompasses changes that occur at the database level, i.e. operations performed on a particular Realm from its Configuration Module.
These are:
CREATE
UPDATE
DELETERequest: encompasses audited requests based on the HTTP protocol.
GET
POSTAutomatic Process: relating to automatic processes executed (such as Reports and Import Tasks (Tasks)). Some of the possible options are:
SCHEDULED <Name> REPORT: Scheduled Availability Report, Scheduled Multimetrics Report, Top Hosts Report, etc.
<Name> REPORT: Availability Report, Multimetrics Report, Top Hosts Report, etc.
SNMP IMPORT
CSV IMPORT
SNMP IMPORT INVENTORY✓ Date range: audited actions can be filtered according to the dates on which they have been registered. A time filter is used for this purpose.
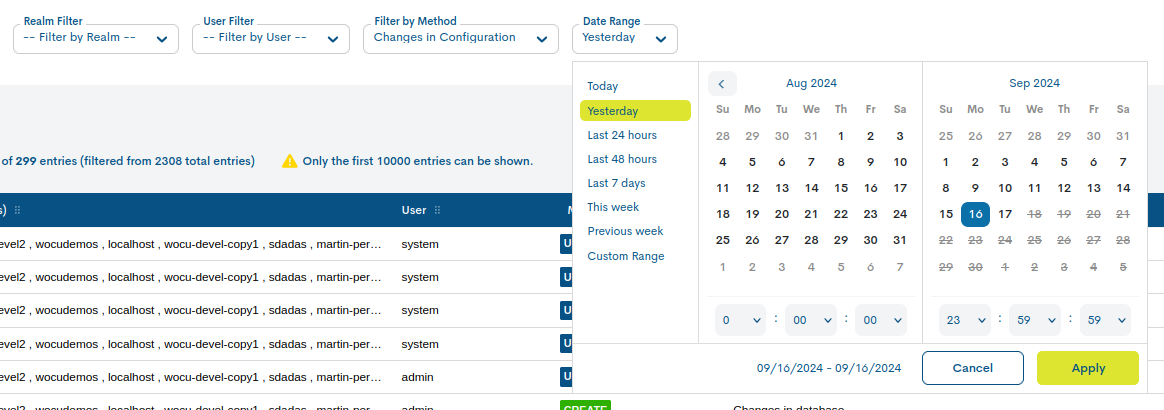
There are several time criteria already set for the filtering of actions:
Today: filters and displays only the audited actions generated during the time period elapsed in today’s day.
Yesterday: shares registered yesterday.
Last 24 hours: actions registered in the last 24 hours.
Last 48 hours: actions registered in the last 48 hours.
Last 7 Days: actions registered in the last seven days.
This Week: actions recorded during the period of time elapsed in the current week (from the start day of the week to the current day).
Previous Week: actions registered in the previous full week (Monday-Sunday).
In case you want to set a specific period of time there is the option Custom Range. To configure the time frame it is necessary to set a start date and an end date. By clicking on one of the days, this date will be set as a selection and will be marked with a blue background. In addition to the day, you can set a specific time for that day. To do so, use the drop-down menus in the hour, minute and second boxes to set the desired time.
Attention
In order to facilitate and alleviate the query computation capacity, the filtering of items by date range is limited to a maximum of seven days, i.e. the defined range cannot be longer than this interval (seven days).
It is of course not possible to choose start and end dates after the current date, nor to set an end date before the start date.
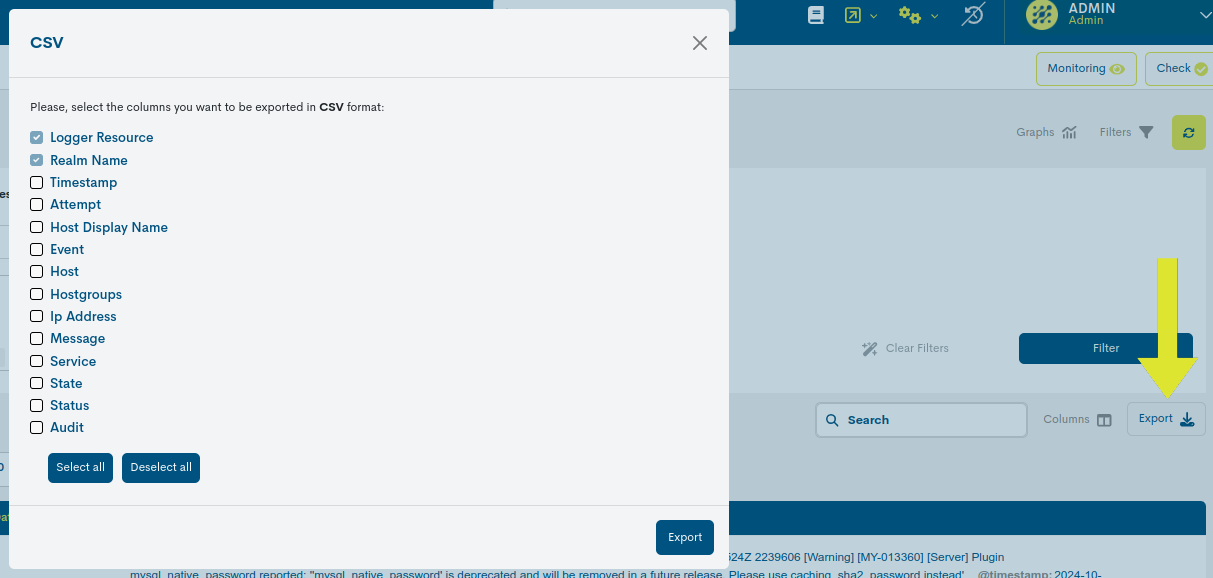
Exporting the list
The two buttons next to the Search bar, CSV and JSON, facilitate the export of data in both formats for further processing or use.
CSV
Clicking on the corresponding button will open a new modal for the selection and marking of parameters to be exported at the user’s discretion. The available options are:
Dates (Required)
User (Required)
Method
Description
Affected Item (Required)
Details
Once the selection is confirmed, a file is downloaded in CSV (Comma Separated Value) format, a very simple format that organises the columns by a separator (semicolon “;”) and the rows by a line break.
JSON
This other option follows the same operation as the previous case, but initiates the download of a file in JSON (JavaScript Object Notation) format, a lightweight data exchange format capable of being read by any programming language and, therefore, used to exchange information between different technologies.
In both options, the system will offer the option to select the directory where to download and store the generated inventory file and to assign an alternative name to it.