Dashboards
From this section the user is able to build their own monitoring page, adding monitoring maps, graphs and real-time status summaries of assets and services managed in the cloud, among other elements.
The system also allows the integration and rendering of components exported from external tools to WOCU-Monitoring, under configuration and choice of the Administrator.
Cloud
This view manages the monitoring of network hosts integrated in different platforms in the cloud, allowing centralised observation of the status, performance and availability of the distributed infrastructure.
This module allows seamless integration with different platforms from a single point.
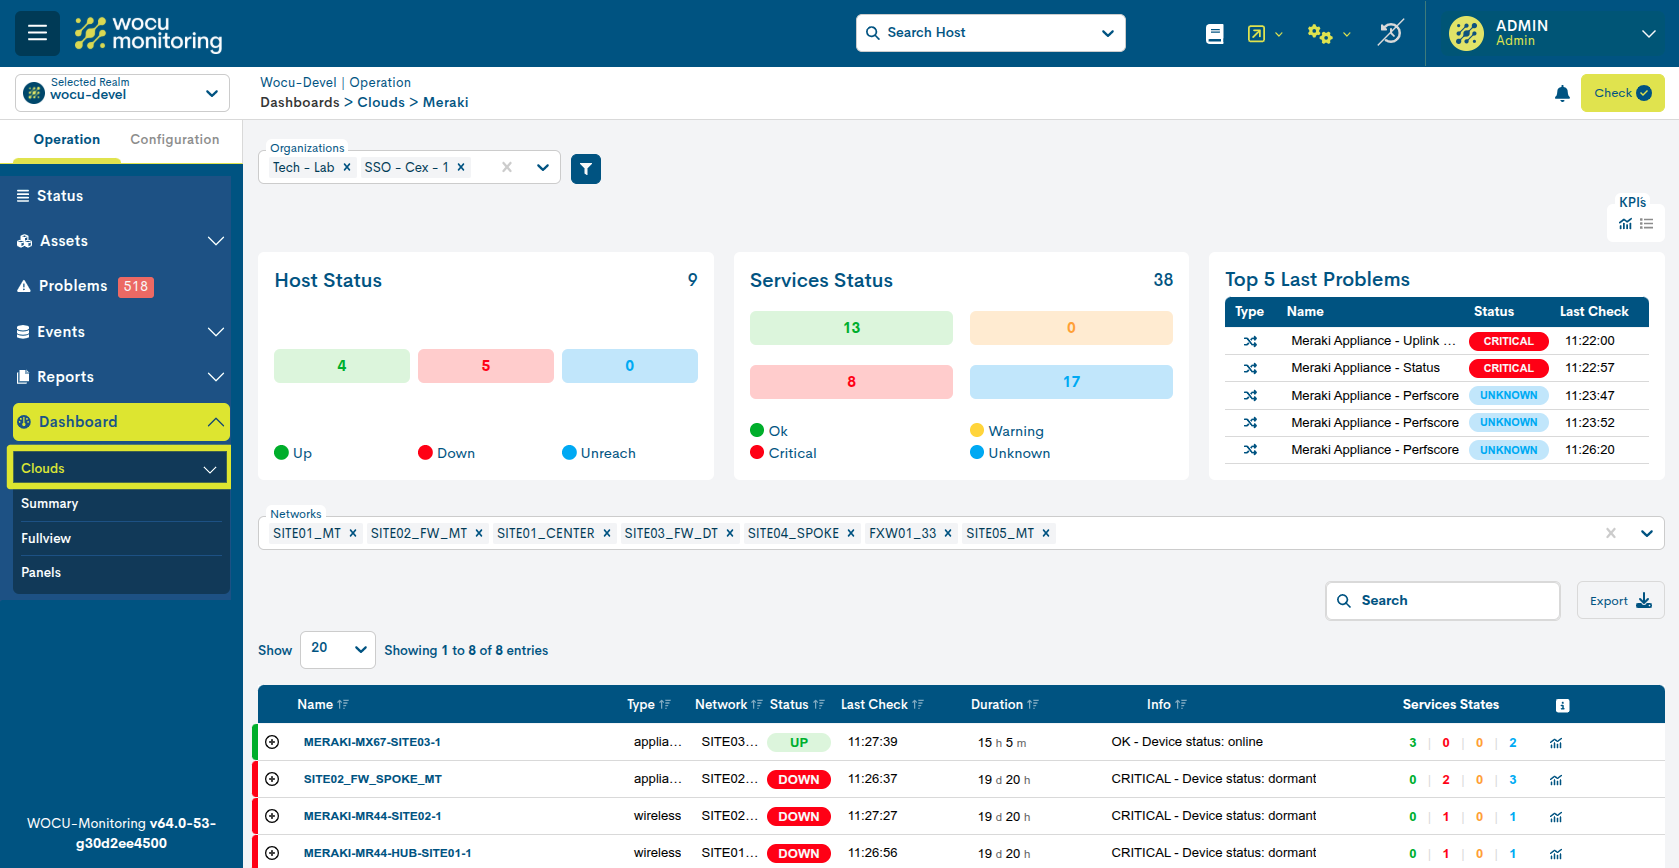
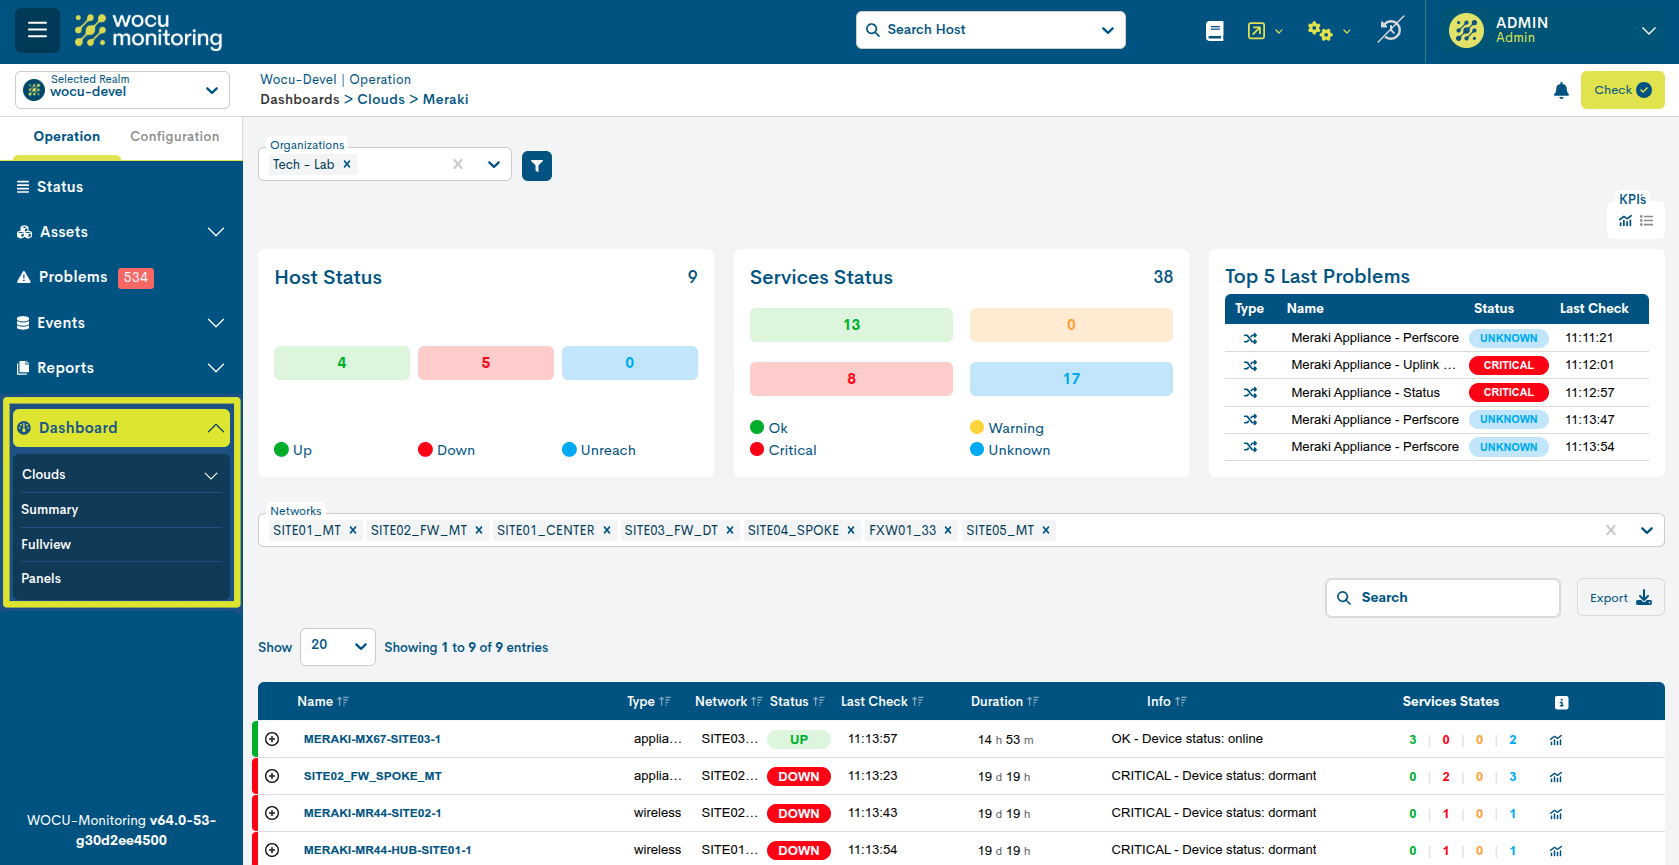
Meraki
This section provides a centralised, real-time view of the operational status of hosts and services managed by Cisco Meraki, one of the most sought-after cloud platforms on the market.
To display data, you must select at least one or more organizations in the Organizations Filtering, explained below.
Integration with WOCU-Monitoring
From the Configuration Module> Clouds> Meraki, integration with Cisco Meraki® is possible. WOCU-Monitoring is able to connect via API to your dashboard to automatically discover devices and put them into monitoring.
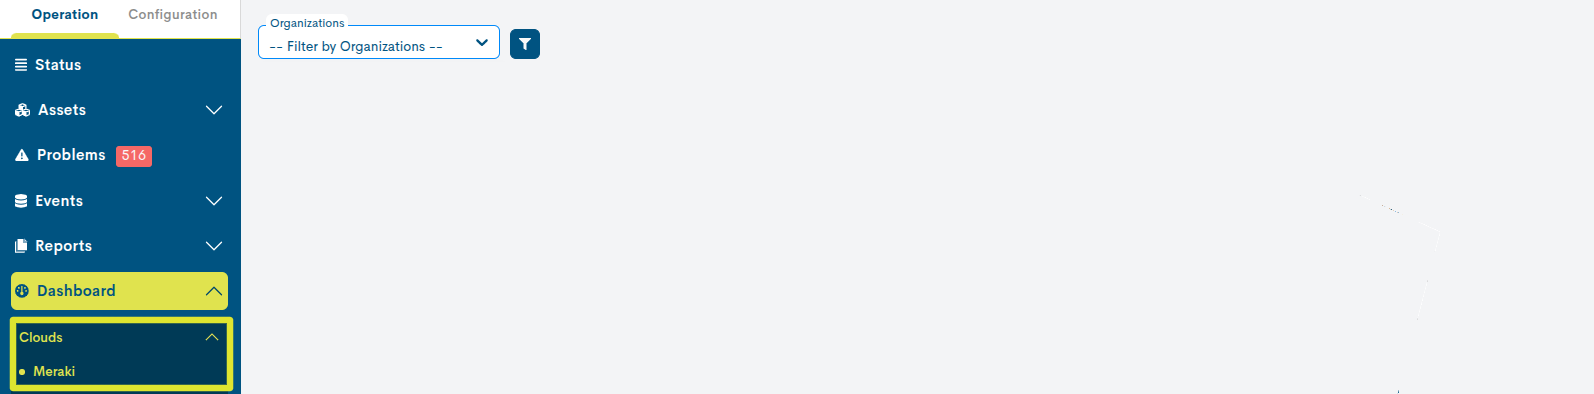
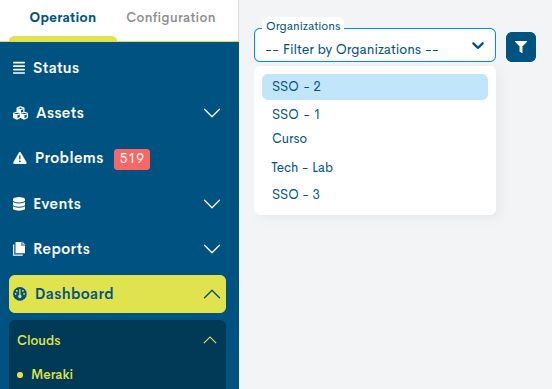
Organizations Filtering
In this scope, an organization is an administrative unit that groups and manages multiple Meraki Networks, whose hosts and services are being monitored in WOCU-Monitoring. Each organization has its own administrators, licenses and general configuration.
By selecting an organization in the Organizations filter, you choose which set of networks and associated hosts within the Meraki environment you want to visualise.
Networks Filtering
Once one or more organizations have been selected in the previous filter, new panels, filters and tables will be loaded. The information displayed will depend on the Networks selected in its own selector.
A Network is a logical unit grouping Meraki hosts that share a functional purpose. Therefore, an Organization can integrate multiple Networks, each with its own hosts, configurations and metrics.
As each Network represents an independent network, granular administration is possible. However, all these networks are centrally managed from the same organization, facilitating the overall control of the distributed infrastructure.
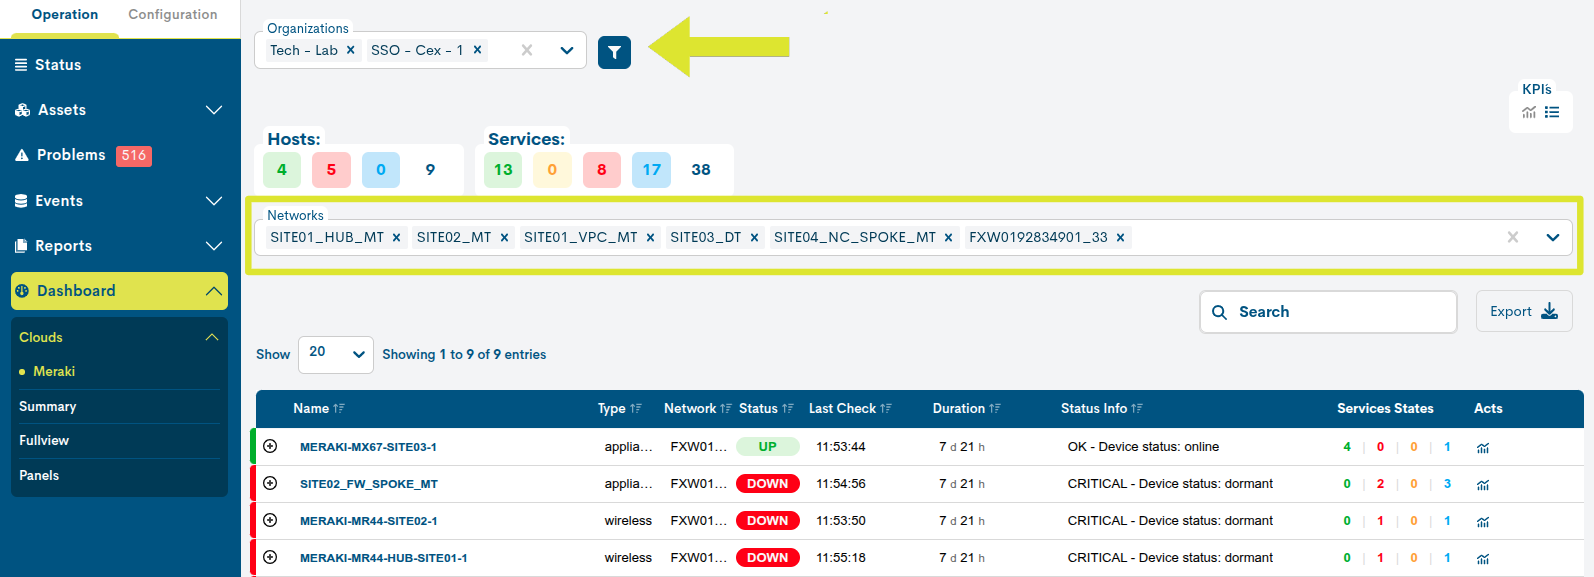
Global table of Meraki devices
Once the Organizations and Networks are selected, this global table lists the devices and services managed in the cloud by Cisco Meraki and that are being monitored by WOCU-Monitoring.
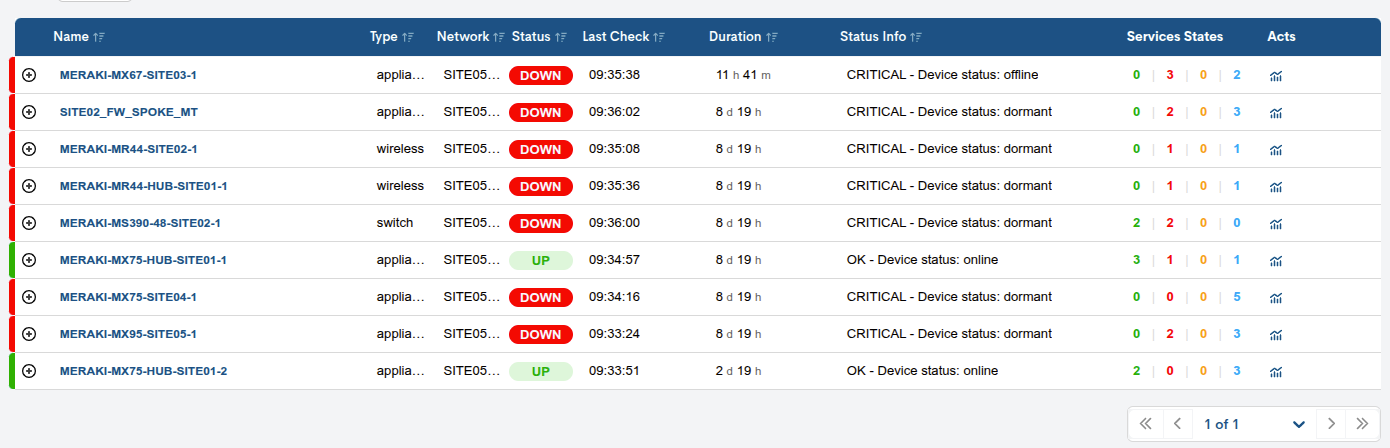
The following information is provided for each asset:
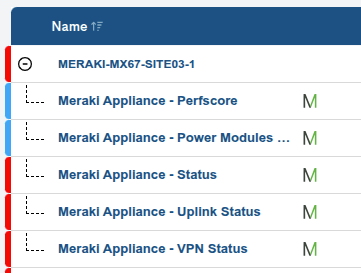
✓ Name: Name of the device in the Meraki environment monitored in the application. It is the main link to access the detailed view Device.
Clicking on the attached + displays the list of associated services. Simultaneously, the same individualized information is recorded and displayed for each service associated with a device.
✓ Type: host type based on a classification that allows to quickly identify the function or role of the equipment within the network. The possible options are: Appliance, Network, Switch, Wireless.
✓ Network: name of the network to which the host belongs.
✓ Status: monitoring status current status of the host.
✓ Last Check: time of the last status check performed by the system.
✓ Duration: indicates how long the host has been active, i.e. without a crash or total failure.
✓ Info: This contains a message that provides more information about the device’s current status. The nature of the messages will vary depending on their type and configuration.
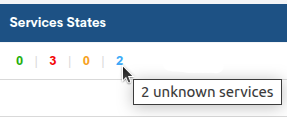
✓ Services States: provides an overview of the status of the services associated with the host. For this purpose, a count is made of the services classified by their different operational states.
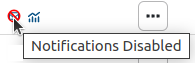
✓ Icons associated with the asset: This field displays the icons of the actions applied to the asset from the hostinventory. More information about each icon displayed can be found in: icons_graph.
You can easily find out what these icons mean by placing your cursor over them.
KPI`s
The KPI block can be presented in two forms:
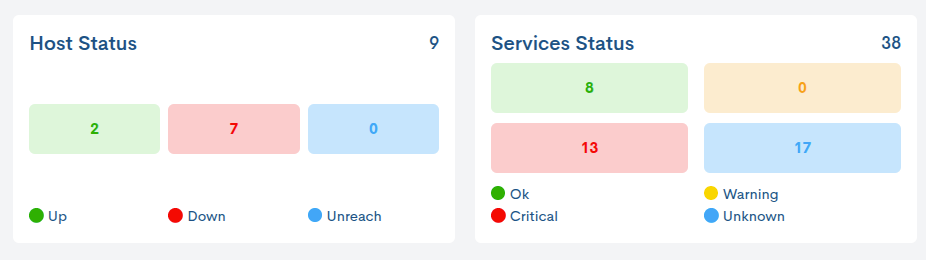
Summary view
By activating the icon marked in the image below, the following KPI is displayed.
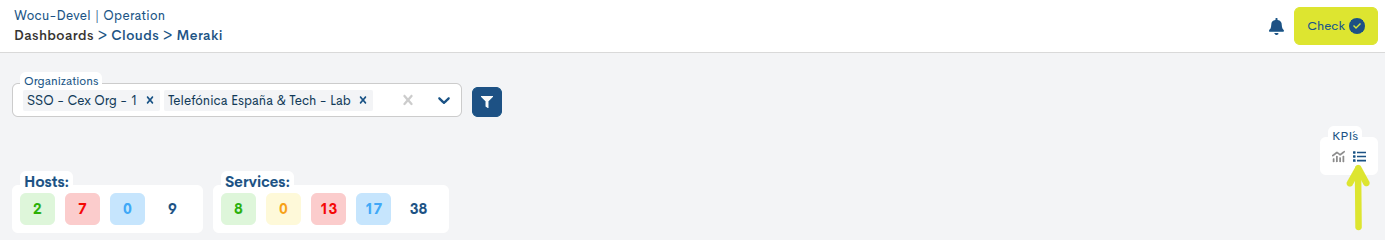
The KPI Hosts/Services provides a quick overview of the monitoring status recorded by the hosts and services in the inventory. A count is made for each of the possible operational states.
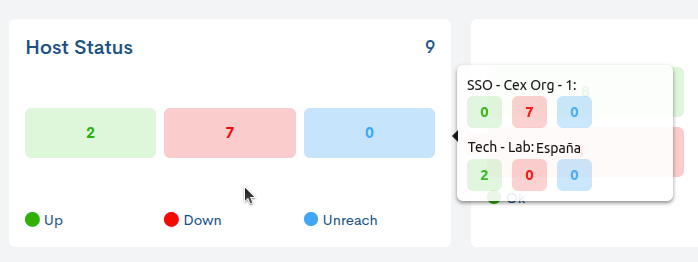
Hovering the cursor over the total value displays a count of hosts/services by status, for each organization selected.
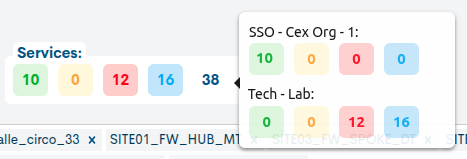
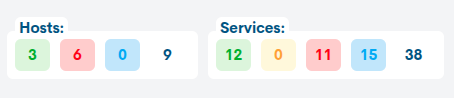
Full view
By activating the icon marked in the image below, the following KPIs are displayed:
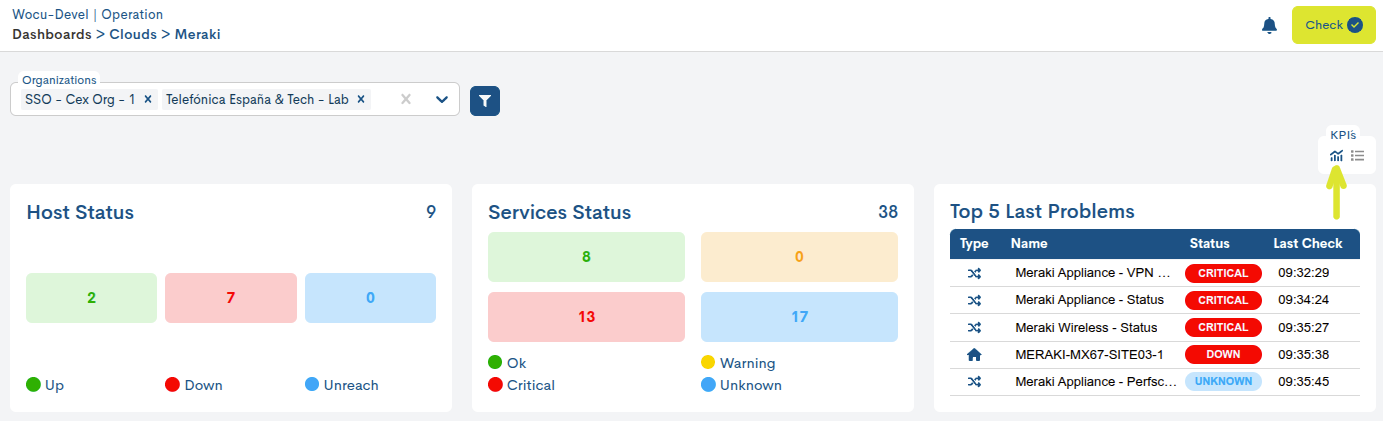
Hosts/Services
Both KPIs provide a count of the total Devices and Services in the inventory, classified according to their monitoring status.
Hovering over the panel displays a count of hosts/services by status, for each organization selected.
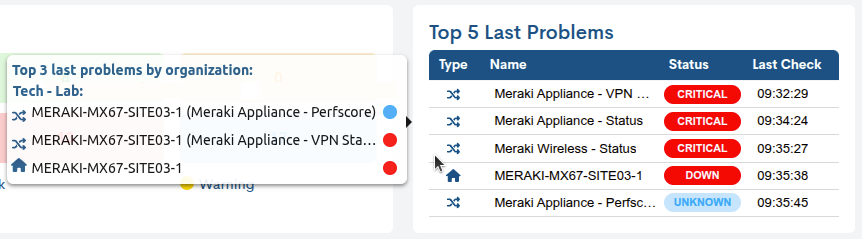
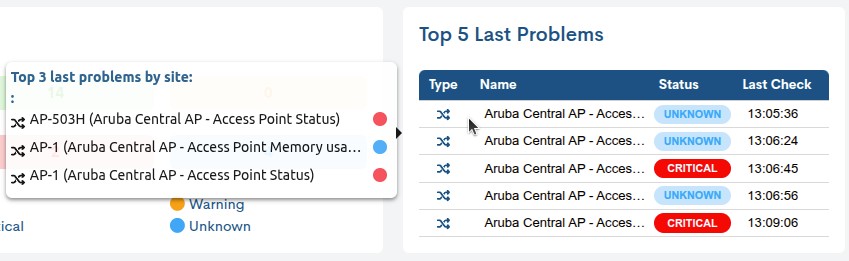
Top 5 Last Problems
This table lists the five most recent incidents detected by WOCU-Monitoring. Each row represents a registered incident, indicating the nature of the asset presenting the incident (column Type), the name of the affected asset (Name), the status assigned by the system (Status) and the time of the last check that registered the incident (Last Check).
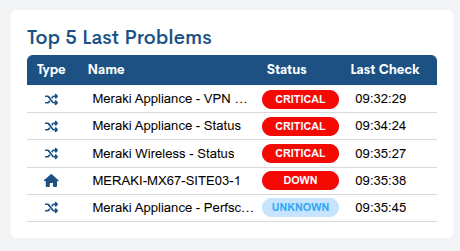
In addition, hovering the cursor over the panel displays a count of the last three incidents recorded in Devices and Services for each organization.
Data export
Although WOCU-Monitoring offers a multitude of functions for the administration of data, metrics, graphs, etc., at some point it may be necessary to use other external tools to process this information. For this purpose, the export function is integrated, which facilitates the download of the inventory data in a file to the hard disk, for later processing or use.
The two buttons next to the Search bar, CSV and JSON, facilitate the export of data in both formats:
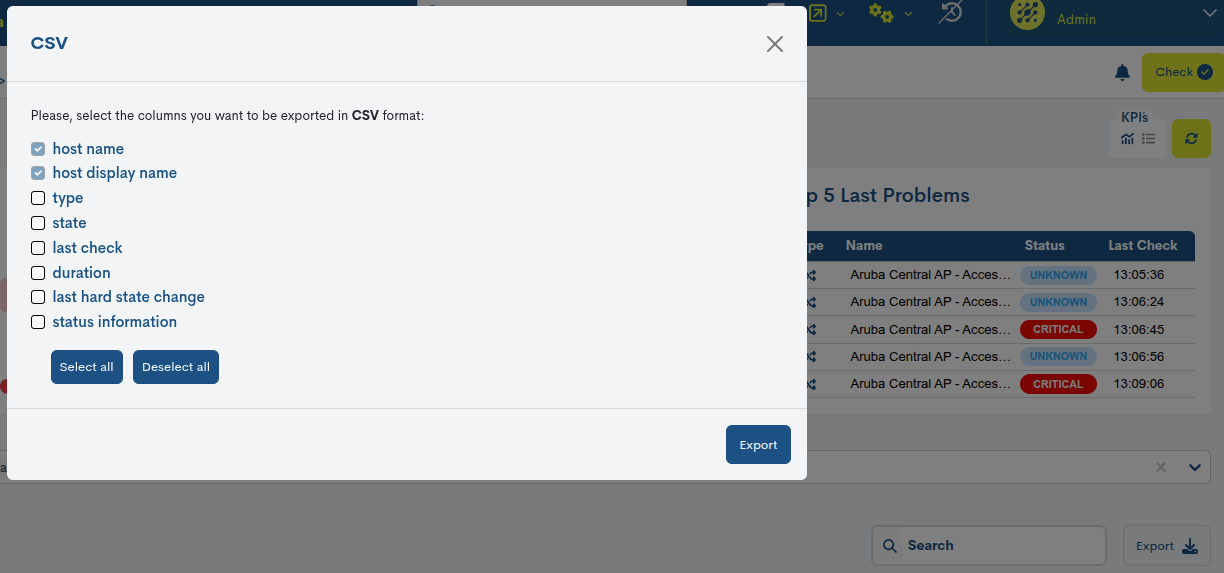
CSV
Clicking on the corresponding button will open a new modal for the selection and marking of parameters to be exported at the user’s discretion. The available options are:
Host Name (Mandatory)
Host Display Name (Mandatory)
Type
State
Last Check
Duration
Last hard state change
Status Information
Services
Services States
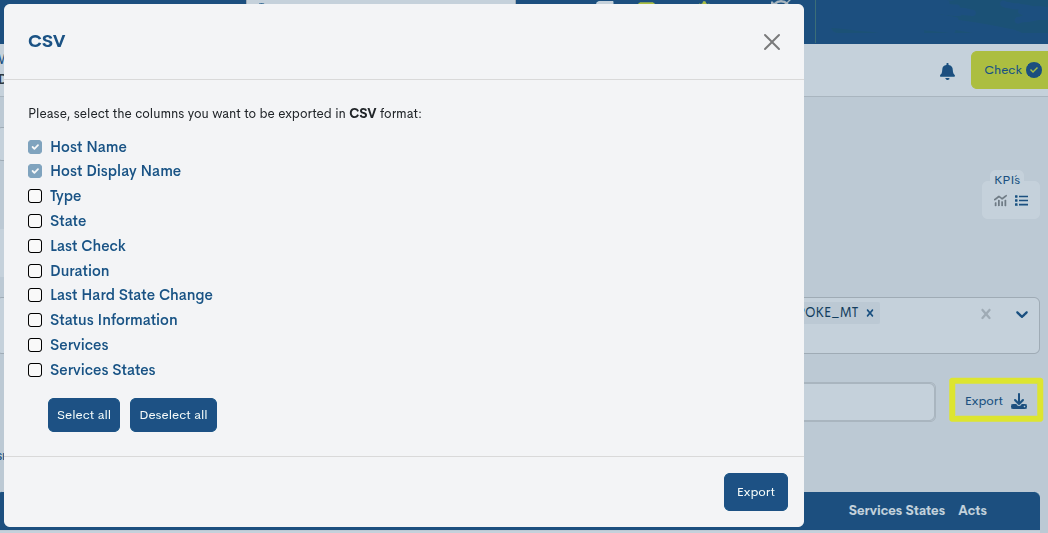
Once the selection is confirmed, a file is downloaded in CSV (Comma Separated Value) format, a very simple format that organises the columns by a separator (semicolon ;) and the rows by a line break.
JSON
This other option follows the same operation as the previous case, but initiates the download of a file in JSON (JavaScript Object Notation) format, a lightweight data exchange format capable of being read by any programming language and, therefore, used to exchange information between different technologies.
In both options, the system will offer the option to select the directory where to download and store the generated inventory file and to assign an alternative name to it. By default, the system assigns the following name:
meraki-devices-table_[nombre del reino]_00h-00min_dd-mm-aaaa y la extensión `.csv` o `.json` según la opción escogida.
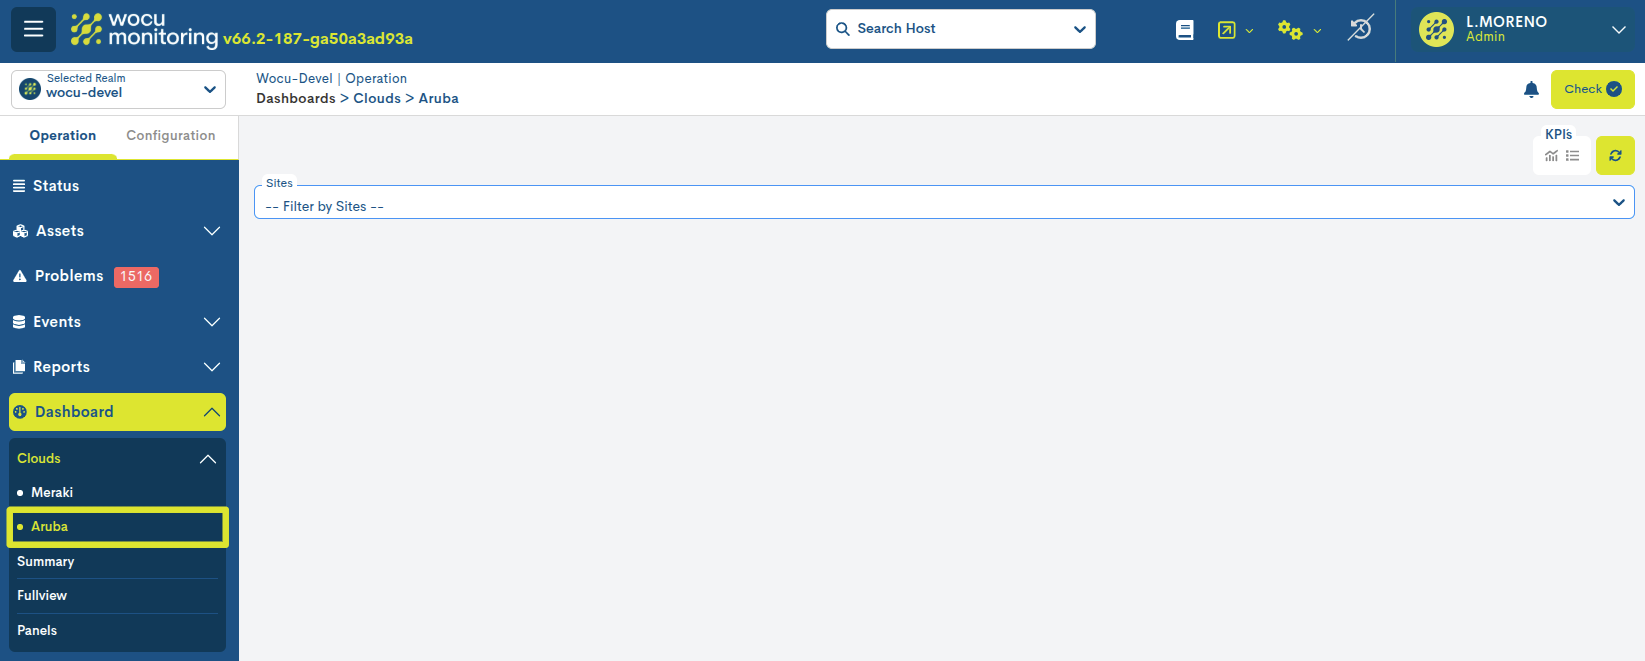
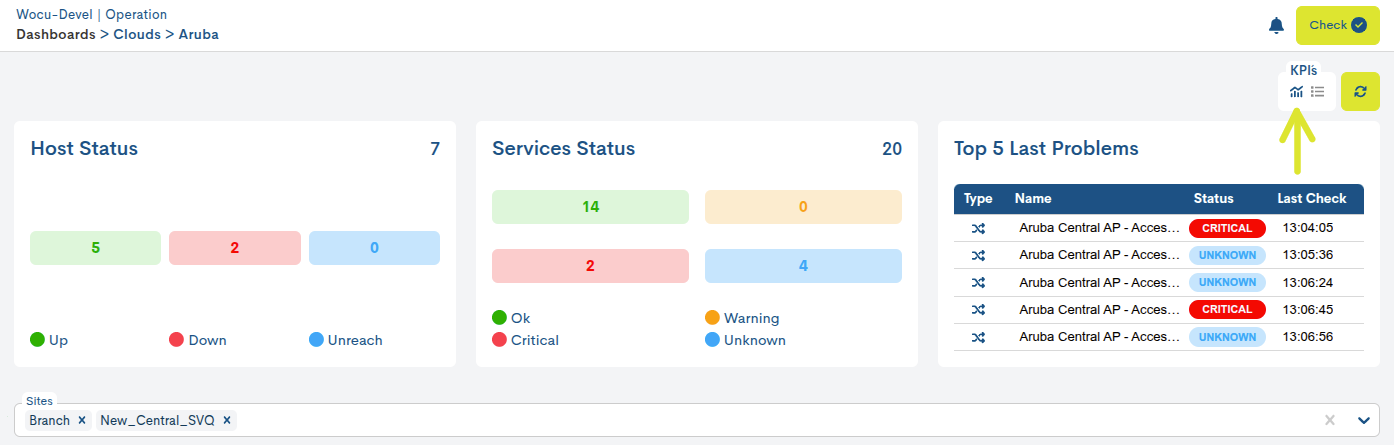
Aruba
This section offers a centralized, real-time view of the operational status of devices and services managed by Aruba, one of the most in-demand cloud platforms on the market. From this section, users can view, filter, and analyze the status of imported equipment.
To display data, at least one or more Sites must be selected in the Sites selector, explained below.
Integration with WOCU-Monitoring
From the module Configuration> Clouds> Aruba, integration with Aruba® is possible. WOCU-Monitoringis able to connect via API to your dashboard to automatically discover the devices and put them into monitoring.
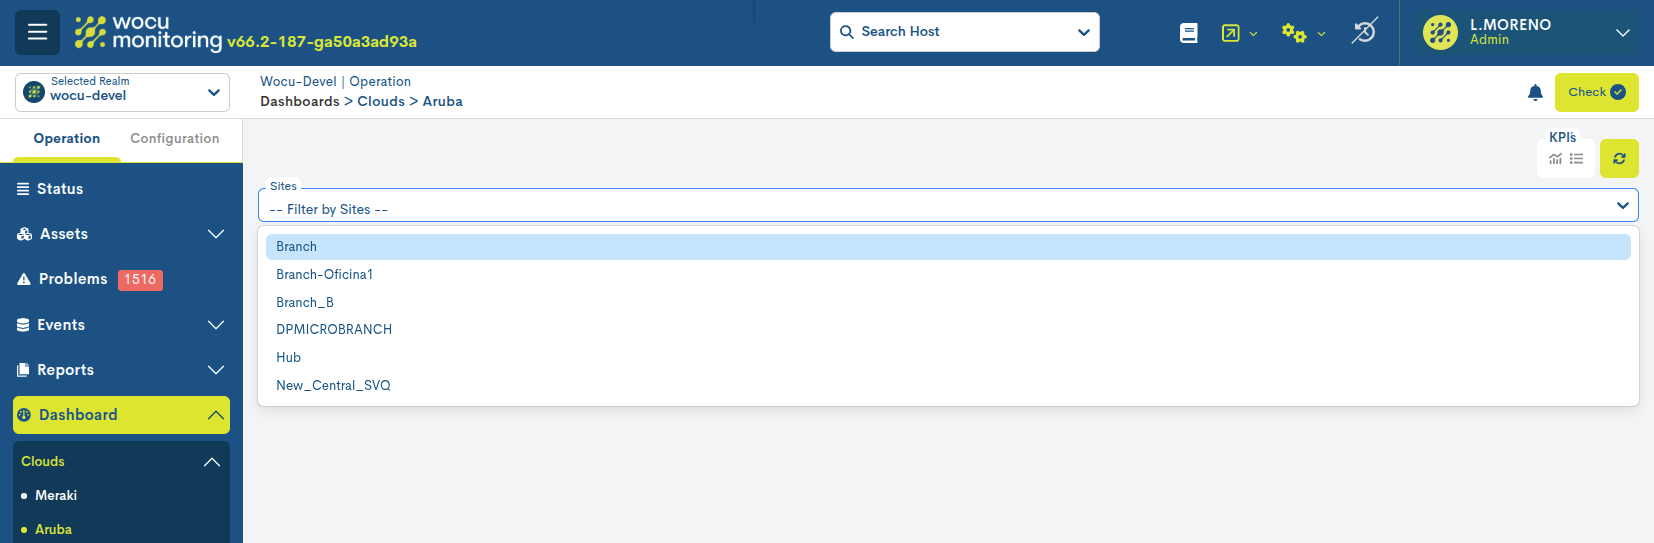
Site Selection
A Site in Aruba refers to a physical location where a set of devices are installed. It can be a branch, a delegation, or any other type of location. Aruba Central uses Sites as a primary element of organization and navigation, allowing the network to be structured according to its geographical distribution.
The Site selector (received from Aruba) allows the user to select/exclude one or more Sites simultaneously. Each Site label displays the name, followed by an X to remove it when necessary.
Note
Site names are obtained directly from the Aruba platform and are stored in WOCU-Monitoring to ensure consistency between both systems.
After selection, WOCU-Monitoring displays the union of all devices belonging to any of the selected Sites in the Table of Meraki hosts. The filtering is applied immediately, so the table is automatically updated.
Table of Meraki hosts
Once the Sites are selected, the central table is updated showing the devices and services managed in the cloud by Arubaand that are being monitored by WOCU-Monitoring.
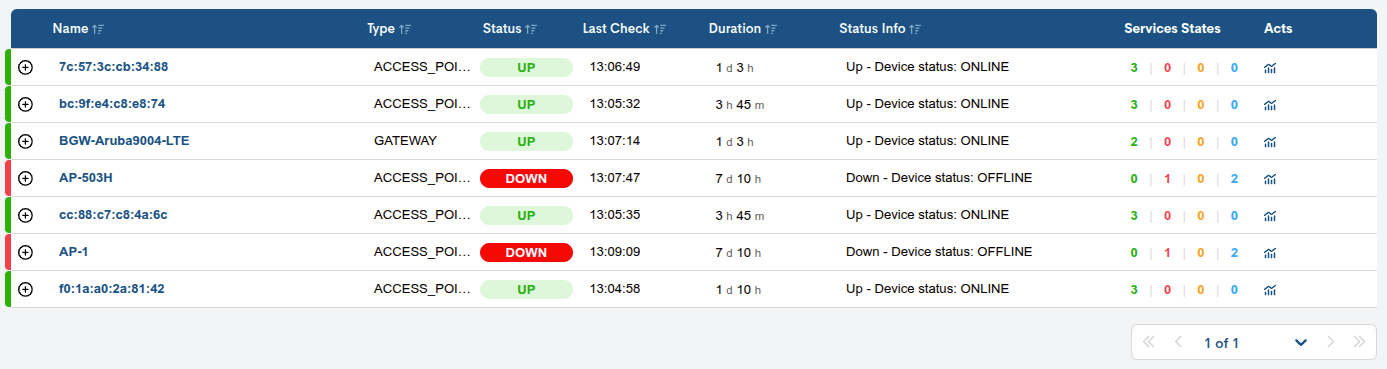
The following information is provided for each asset:
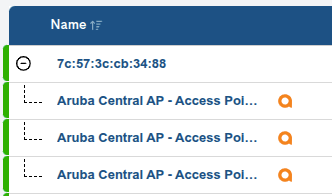
✓ Name: Name of the device in the Aruba environment monitored in the application. It is the main link to access the detailed view of the Device.
Clicking on the attached + displays the list of associated services. Simultaneously, the same individualized information is recorded and displayed for each service associated with a device.
✓ Type: Device type based on a classification that allows quick identification of the device’s function or role within the network. The possible options are:
ACCESS_POINT
GATEWAY
SWITCH
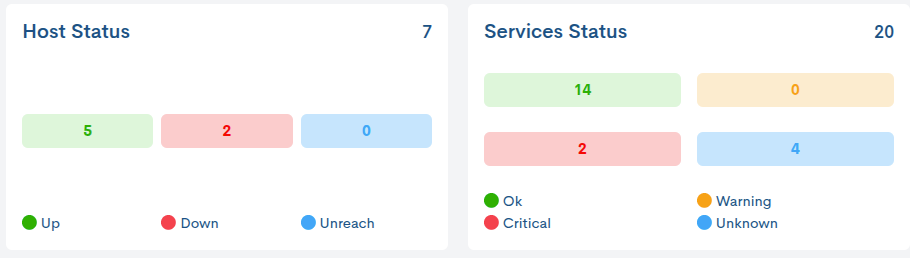
✓ Status: monitoring status current status of the host.
✓ Last Check: time of the last status check performed by the system.
✓ Duration: indicates how long the host has been active, i.e. without a crash or total failure.
✓ Status Info: collects a message that expands the information about the current status of the host. The nature of the messages will vary depending on their type and configuration.
✓ Services States: provides an overview of the status of the services associated with the host. For this purpose, a count is made of the services classified by their different operational states.
✓ Icons associated with the asset: This field displays the icons of the actions applied to the asset from the hostinventory. More information about each icon displayed can be found in: icons_graph.
You can easily find out what these icons mean by placing your cursor over them.
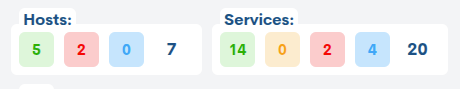
KPI`s
The KPI block can be presented in two forms:
Summary view
By activating the icon marked in the image below, the following KPI is displayed.
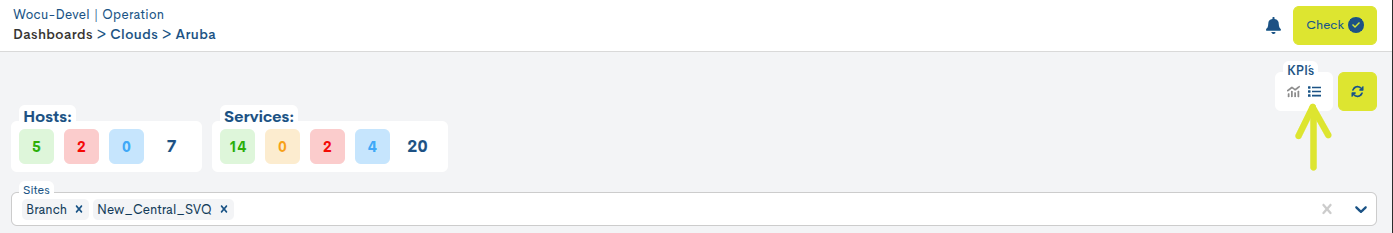
The KPI Hosts/Services provides a quick overview of the monitoring status recorded by the hosts and services in the inventory. A count is made for each of the possible operational states.
When you hover over the total value, a count of the devices/services per state is displayed for each selected site.
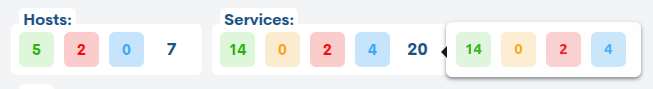
Full view
By activating the icon marked in the image below, the following KPIs are displayed:
Hosts/Services
Both KPIs provide a count of the total Devices and Services in the inventory, classified according to their monitoring status.
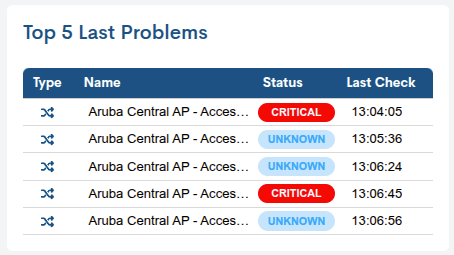
Top 5 Last Problems
This table lists the five most recent incidents detected by WOCU-Monitoring. Each row represents a registered incident, indicating the nature of the asset presenting the incident (column Type), the name of the affected asset (Name), the status assigned by the system (Status) and the time of the last check that registered the incident (Last Check).
In addition, hovering the cursor over the panel displays a count of the last three incidents recorded in Devices and Services for each organization.
Data export
Although WOCU-Monitoring offers a multitude of functions for the administration of data, metrics, graphs, etc., at some point it may be necessary to use other external tools to process this information. For this purpose, the export function is integrated, which facilitates the download of the inventory data in a file to the hard disk, for later processing or use.
The two buttons next to the Search bar, CSV and JSON, facilitate the export of data in both formats:
CSV
Clicking on the corresponding button will open a new modal for the selection and marking of parameters to be exported at the user’s discretion. The available options are:
Host Name (Mandatory)
Host Display Name (Mandatory)
Type
State
Last Check
Duration
Last hard state change
Status Information
Services
Services States
Once the selection is confirmed, a file is downloaded in CSV (Comma Separated Value) format, a very simple format that organises the columns by a separator (semicolon ;) and the rows by a line break.
JSON
This other option follows the same operation as the previous case, but initiates the download of a file in JSON (JavaScript Object Notation) format, a lightweight data exchange format capable of being read by any programming language and, therefore, used to exchange information between different technologies.
In both options, the system will offer the option to select the directory where to download and store the generated inventory file and to assign an alternative name to it. By default, the system assigns the following name:
aruba-devices-table_[nombre del reino]_00h-00min_dd-mm-aaaa y la extensión `.csv` o `.json` según la opción escogida.
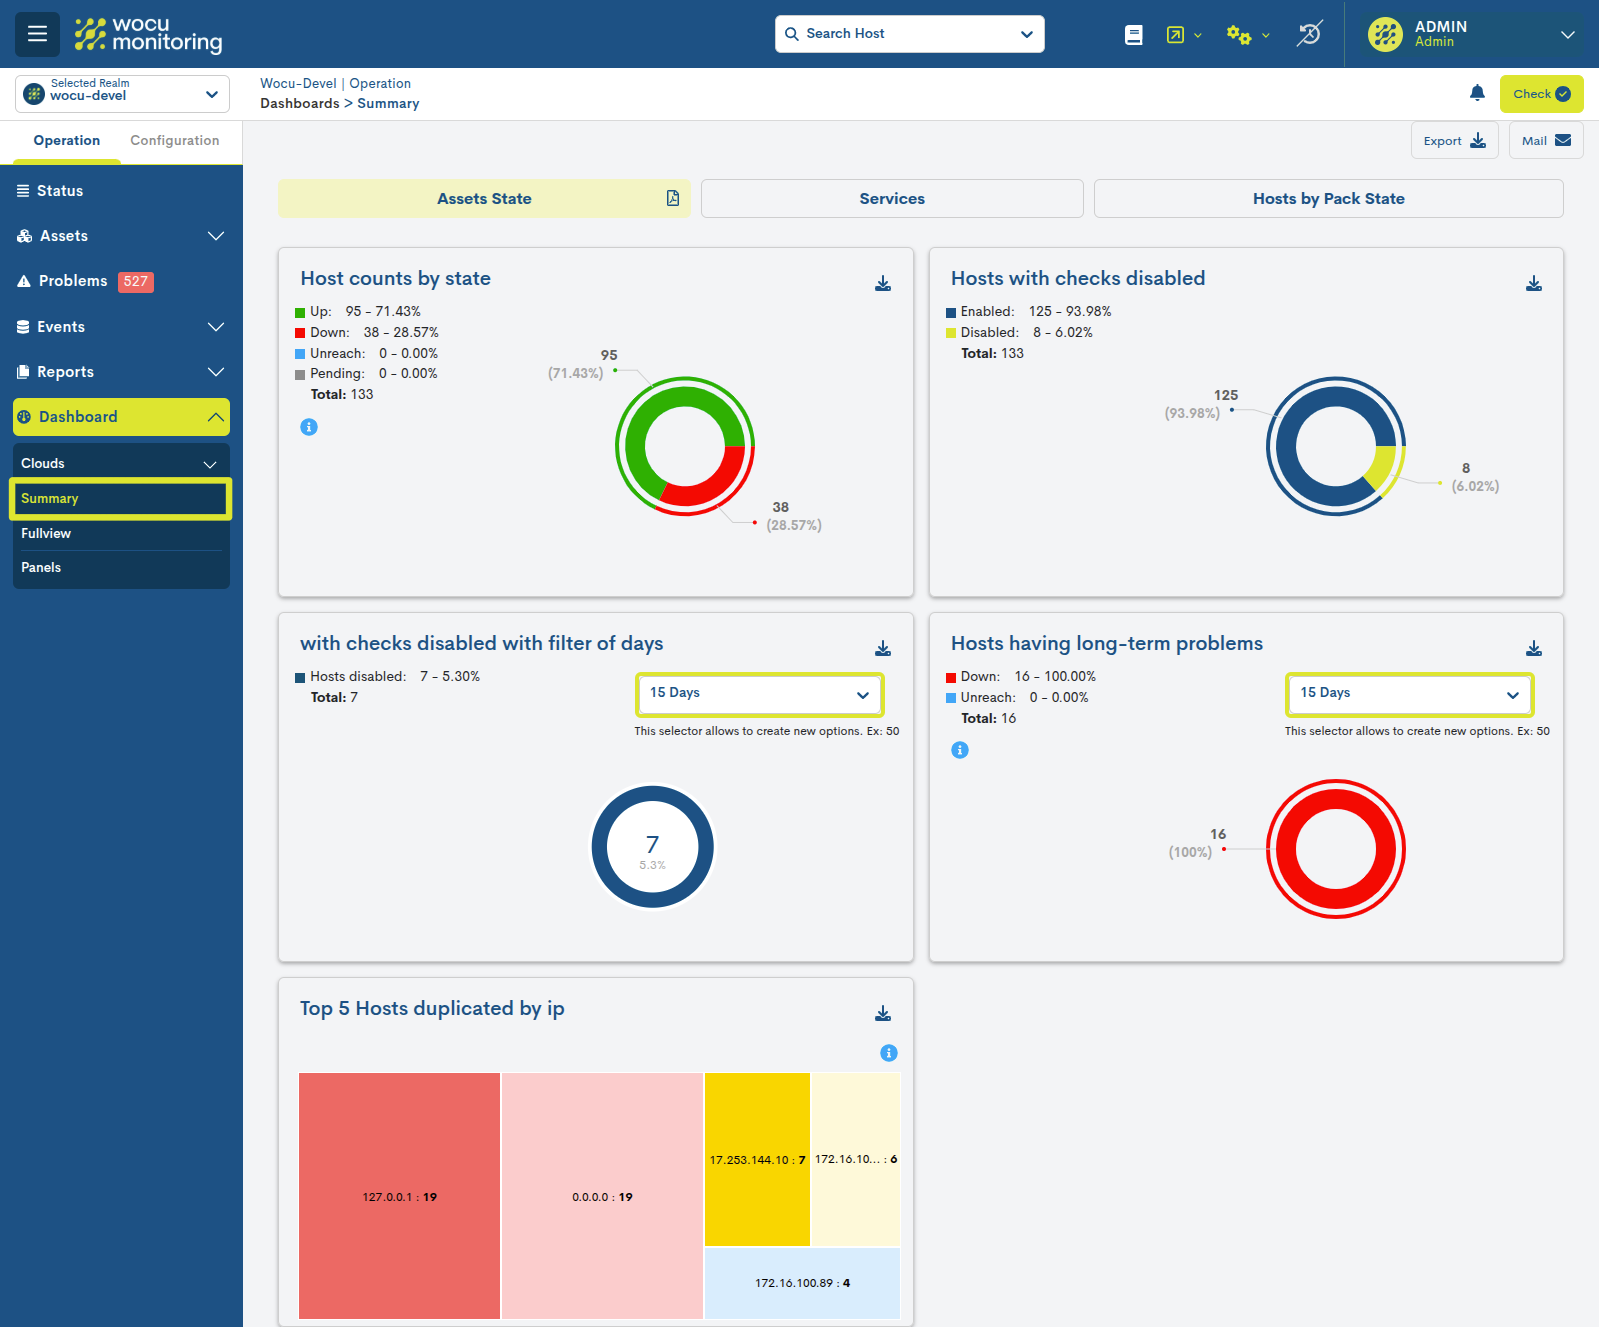
Summary
This view is divided into three main sections. Each of them includes several interactive widgets, together with informative modalities and data export options.
Each of the widgets that make up the view are explained in detail in: Assets Hosts.
Assets State
Integrated by five interactive widgets whose graphics distinguish between Devices according to recorded monitoring statuses, duplicate Devices by name and IP and those with disabled checks.
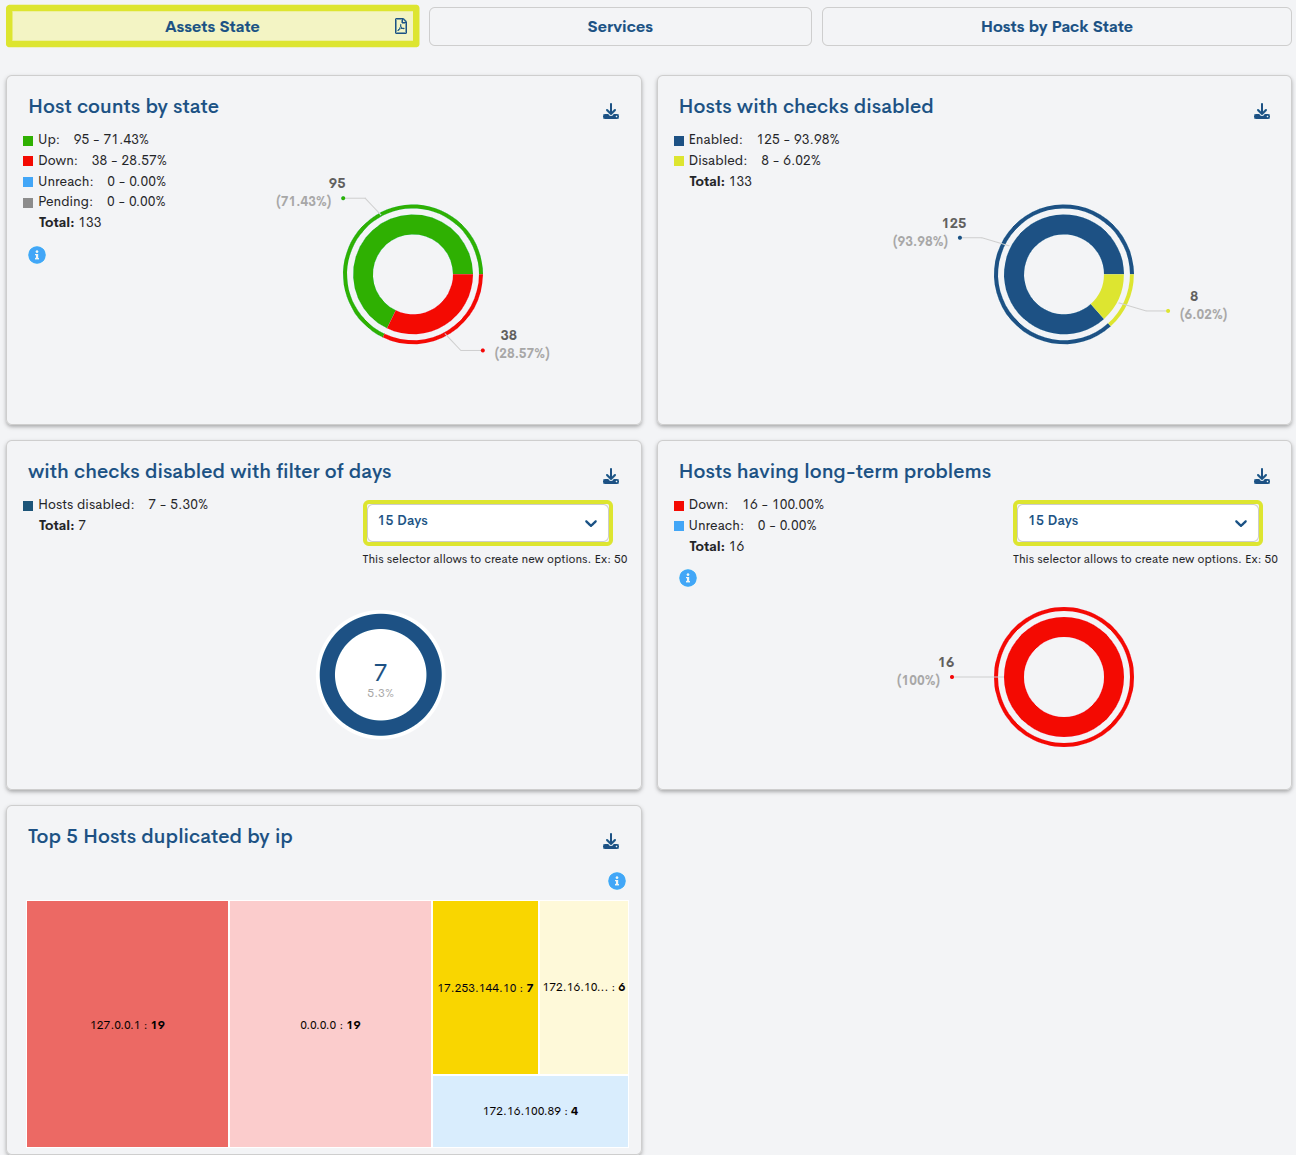
Services
Integrated by four interactive widgets whose graphics make a distinction of Devices by critical monitoring statuses recorded and by services with disabled checks.
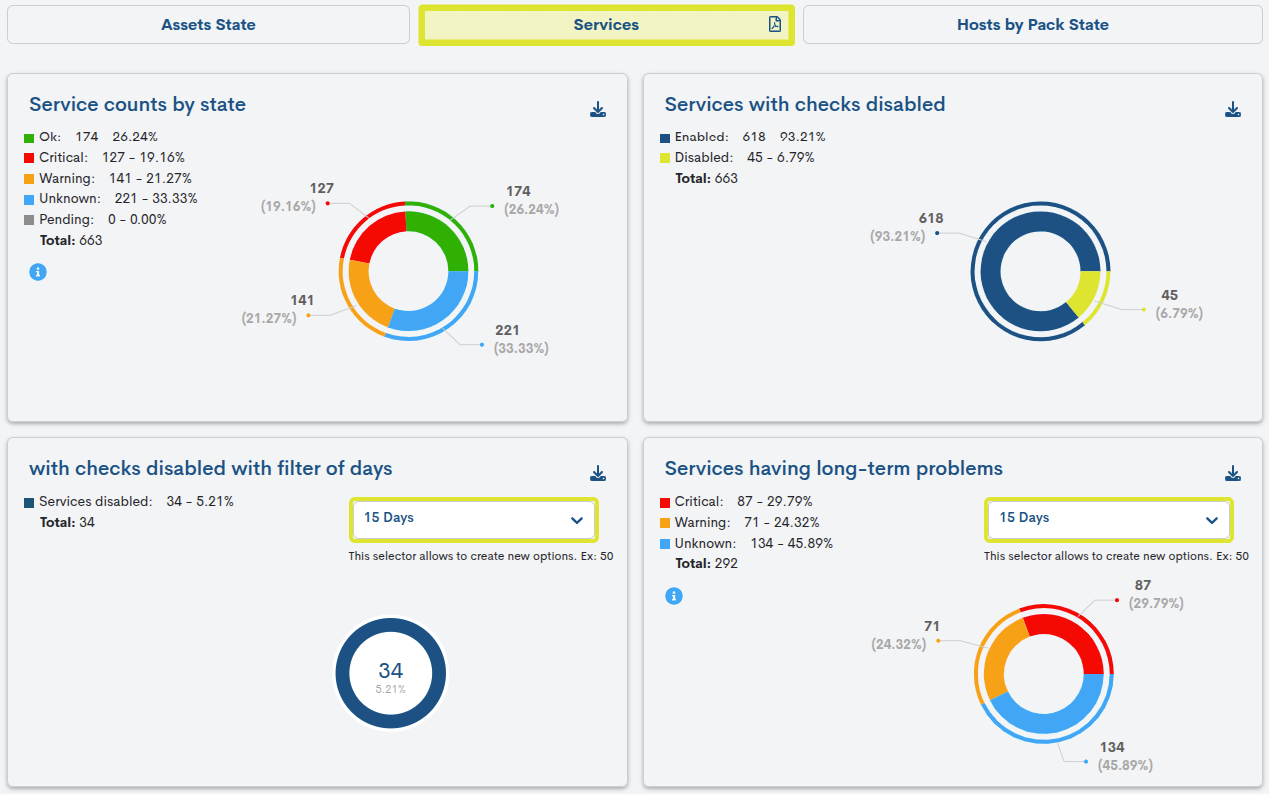
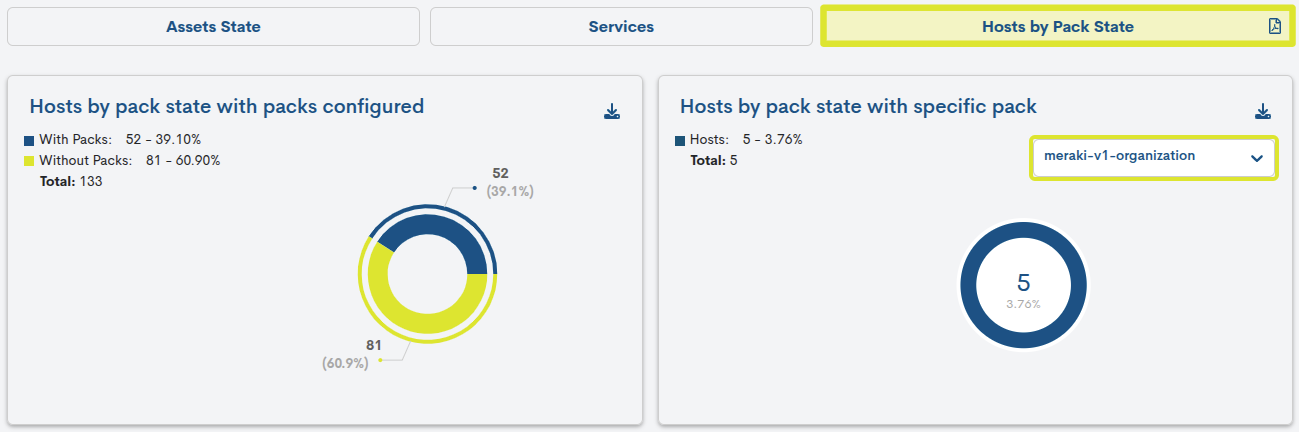
Host By Pack State
Integrated by two interactive widgets whose graphics are linked to the use of Monitoring Packs.
Note
Through the view Aggregator Summary, WOCU-Monitoring offers these same measurements on a global level, i.e. considering all elements of the monitored network (without distinction of Kingdom).
Fullview
This view shows a single panel (with corresponding graphical representations) per dashboard.
The system integrates and renders components exported from external tools, allowing the user to access real-time or historical metrics, interactive graphs, and critical data from various sources within a single interface.
Additionally, it offers the possibility to customize panels according to the user’s needs, integrating specific dashboards designed for different environments or clients, which facilitates more focused and personalized monitoring.
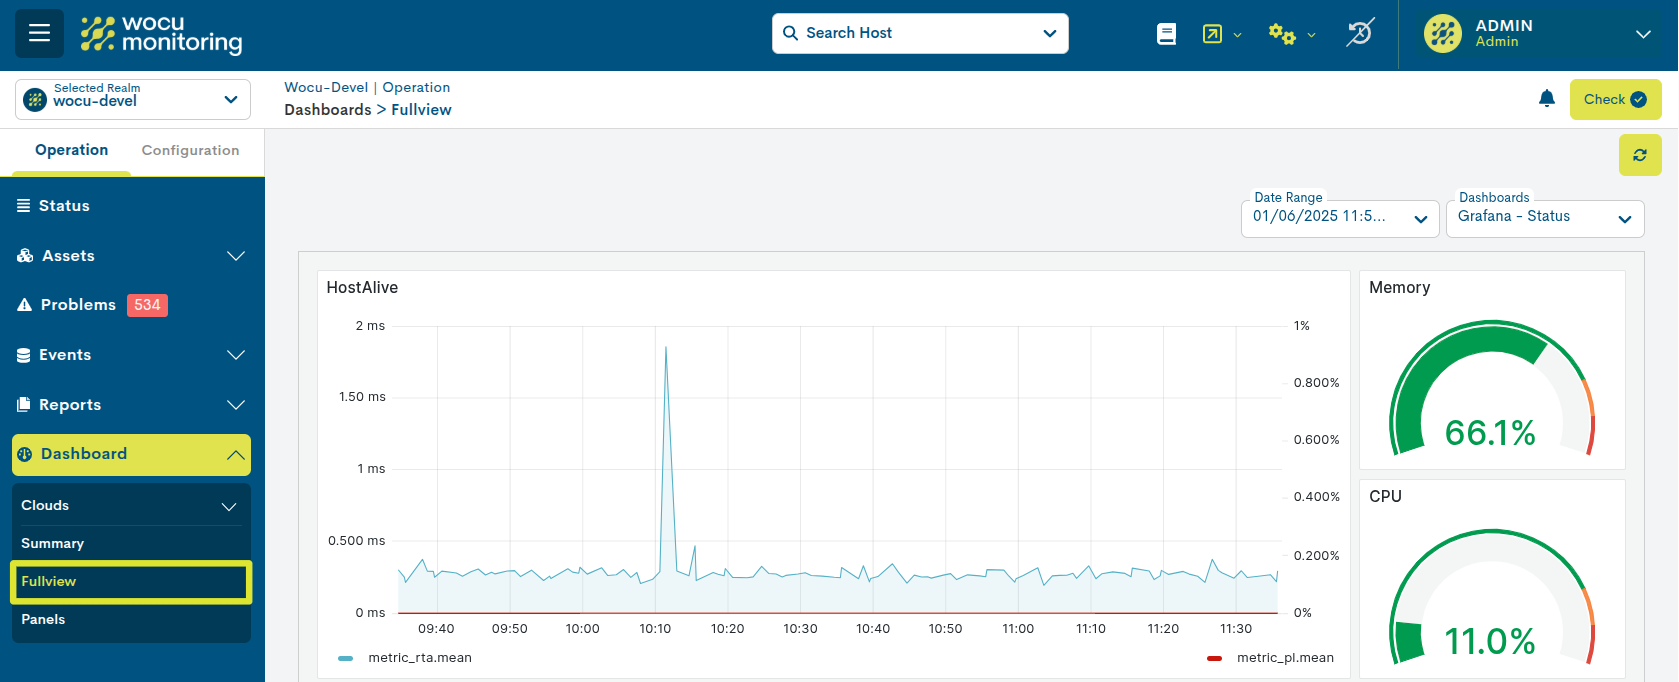
Figure 1: Dashboard exported from Grafana.
Panels
This view displays up to 10 panels per page. If this number is exceeded, the panels will be distributed across multiple pages. To view a specific panel, it must be selected from the Dashboards dropdown menu at the top, and the view will update to display the selected item (hiding the rest of the panels).
This space allows for a more organized navigation between multiple panels, avoiding visual overload and facilitating the individual analysis of each integrated dashboard.
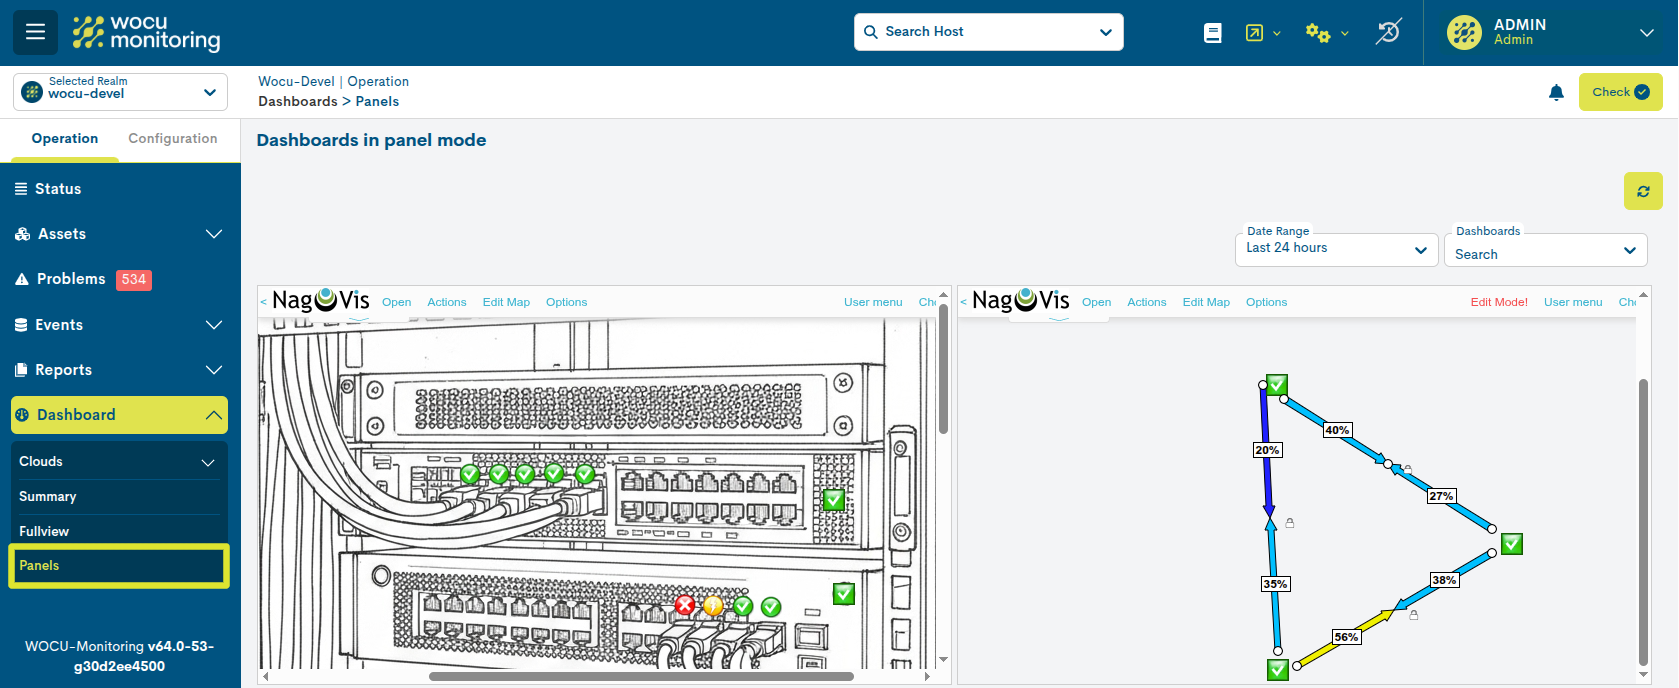
Figure 2: Exported NagVis panels.
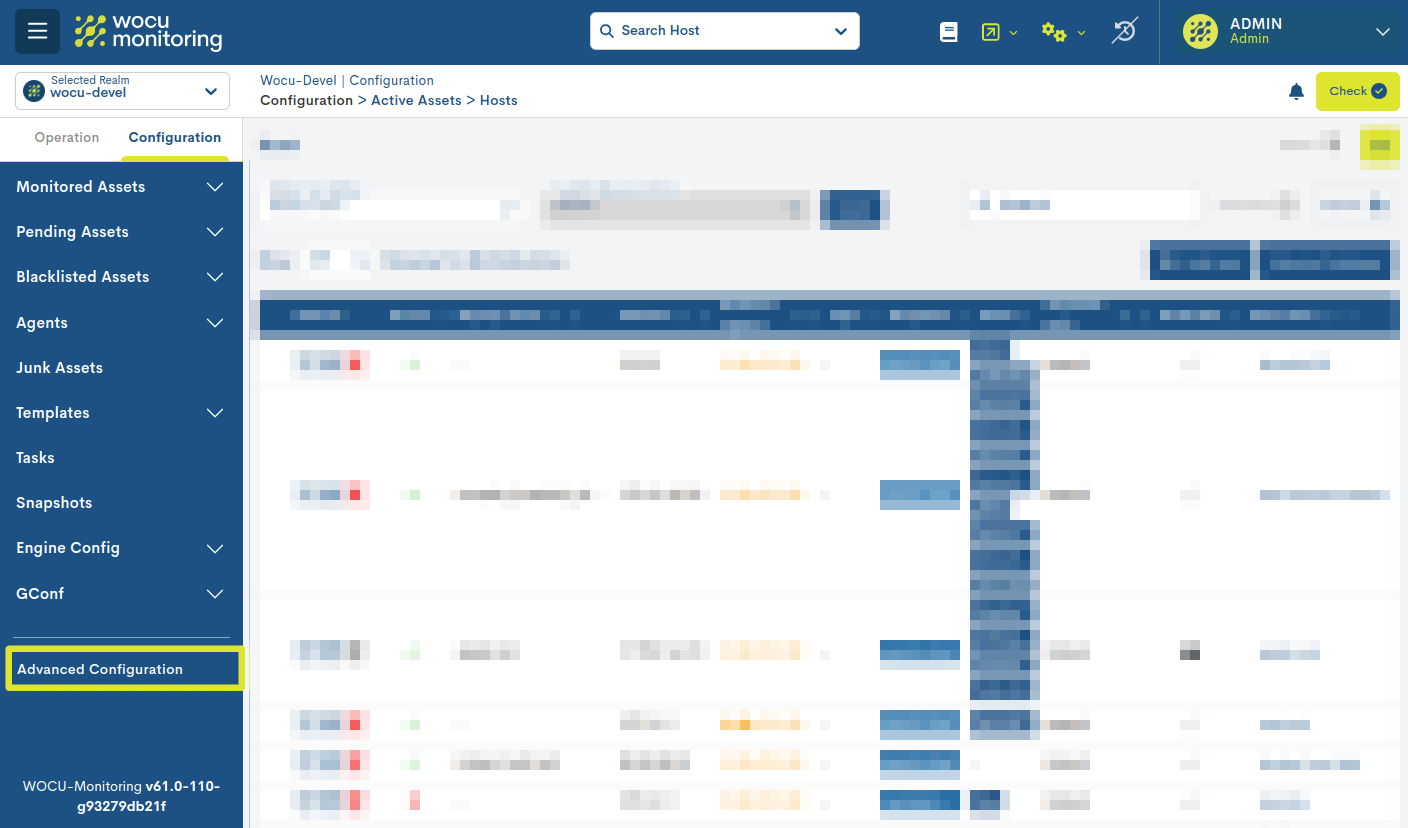
Dashboard configuration
The configuration of the Dashboards module is fully flexible and adapts to the specific needs of the Administrator and various use cases. The addition of panels will be carried out only by system Administrators, but they will be visible to all other users.
By logging into WOCU-Monitoring and accessing the Advanced Settings button, we can link external dashboards.
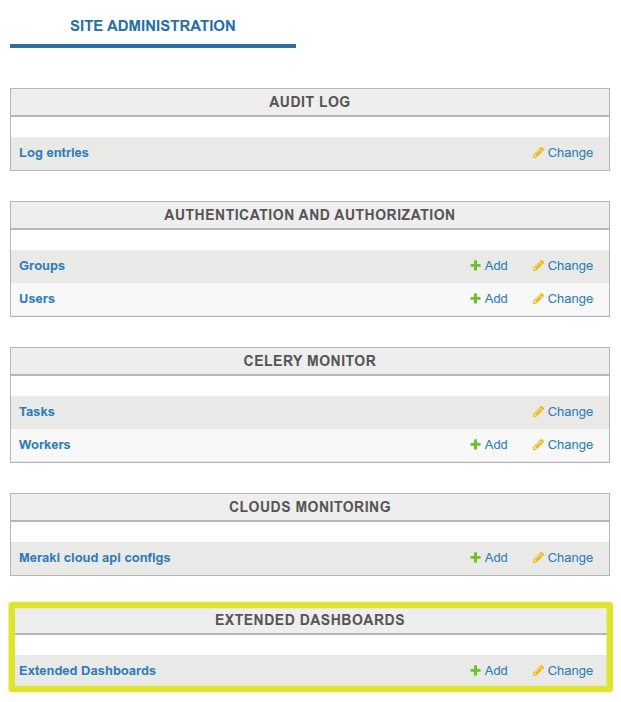
Within the administration view, you need to locate the Extended Dashboards option and click the + Add button located in the same row, as shown in the following image:
Next, a new window will open to register the dashboard, where the fields will need to be filled in manually.
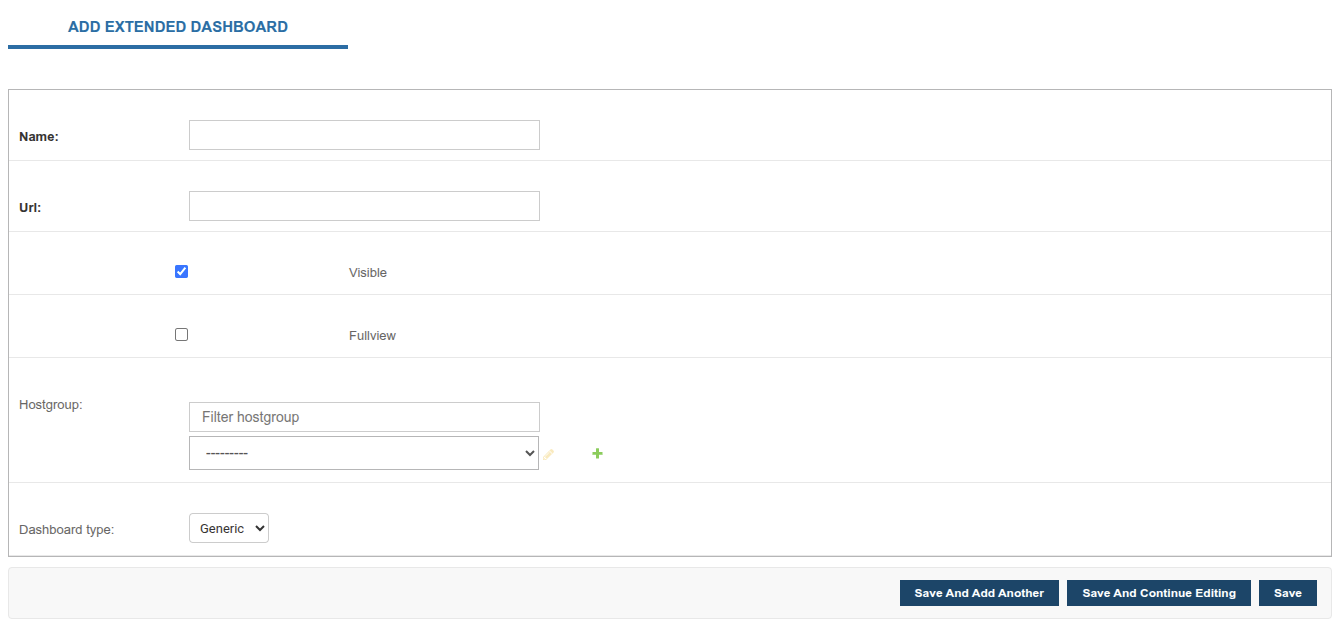
Name: identifier by which the dashboard will be recognized in WOCU-Monitoring.
URL: field to add the web address of the external dashboard to be integrated into the system. In other words, it is the full link to the panel generated in an external tool that will be displayed within the WOCU-Monitoring environment.
Visible: check this box to display the new dashboard. Otherwise, it will be configured but not visible in WOCU-Monitoring.
Fullview: check this box to make the dashboard visible in the Fullview section.
Hostgroup: by selecting a Hostgroup from the dropdown, the dashboard will be visible not only in the Standard Realm but also in the Hostgroup-Based Realm where the selected Hostgroup is integrated.
Once configured, save the changes and log back into WOCU-Monitoring.
Customisation and interactive features
Dashboards are dynamic environments made up of a multitude of interactive components. Likewise, as they support and load a wide variety of widgets, there are a multitude of applicable options that will vary depending on the type of each element and the scope of the tool that provides them to WOCU-Monitoring. Some possible interactions on elements are:
By placing the cursor over any point on graphs, diagrams, maps, etc., an extra information window will pop up. For example: values recorded for the particular point, monitoring status information, geolocation of nodes, etc.
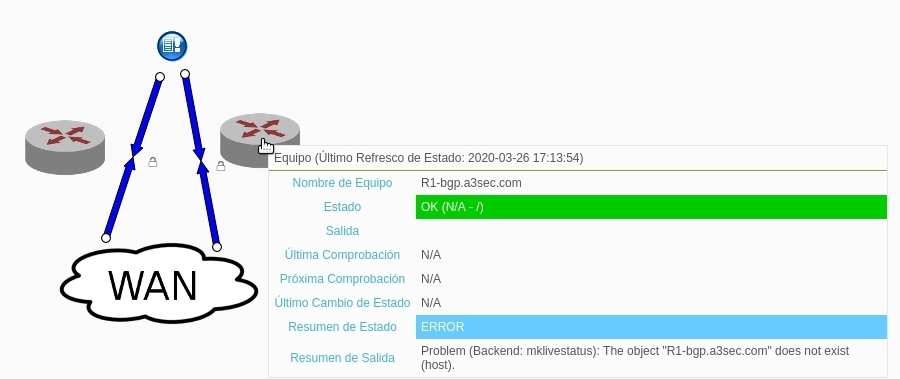
Figure 3: Network topology maps exported from NagVis.
By clicking on one of the series in the legend, only the marked series will be displayed on the graph, clearing the view and hiding the rest of the series. To restore the initial graph, repeat the action by clicking again on the series or refresh the view (🔁).
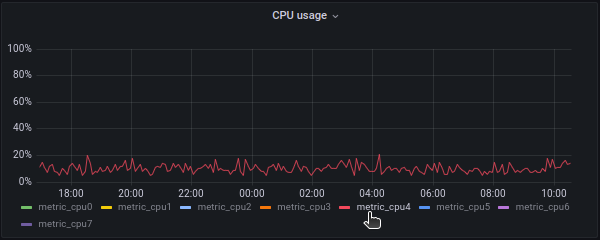
Image 4: Graphic exported from Grafana.
Manual selection of metric data intervals. Clicking and dragging with the left mouse button on a specific area of a graph will select an interval that will result in the updating of the graph with the data corresponding to the marked plot.
This action can be repeated indefinitely, each time obtaining a smaller selected range than the previous one and reaching a high level of detail.
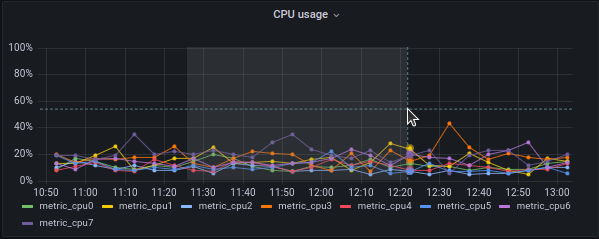
Image 5: Graphic exported from Grafana.
Among many others, there is the possibility to share, delete or duplicate panels, buttons to manipulate the zoom of maps or a multitude of options for panel styling and formatting.
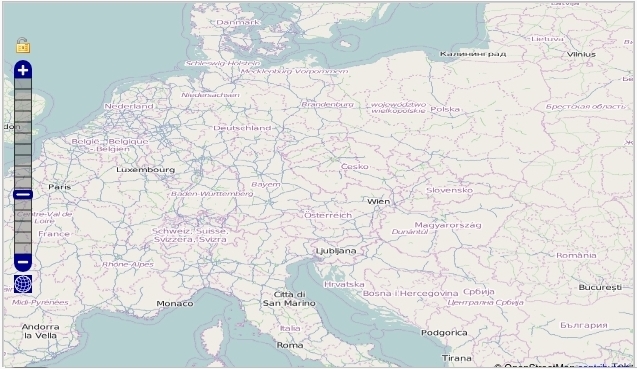
Figure 6: Map exported from Panorama.