Status
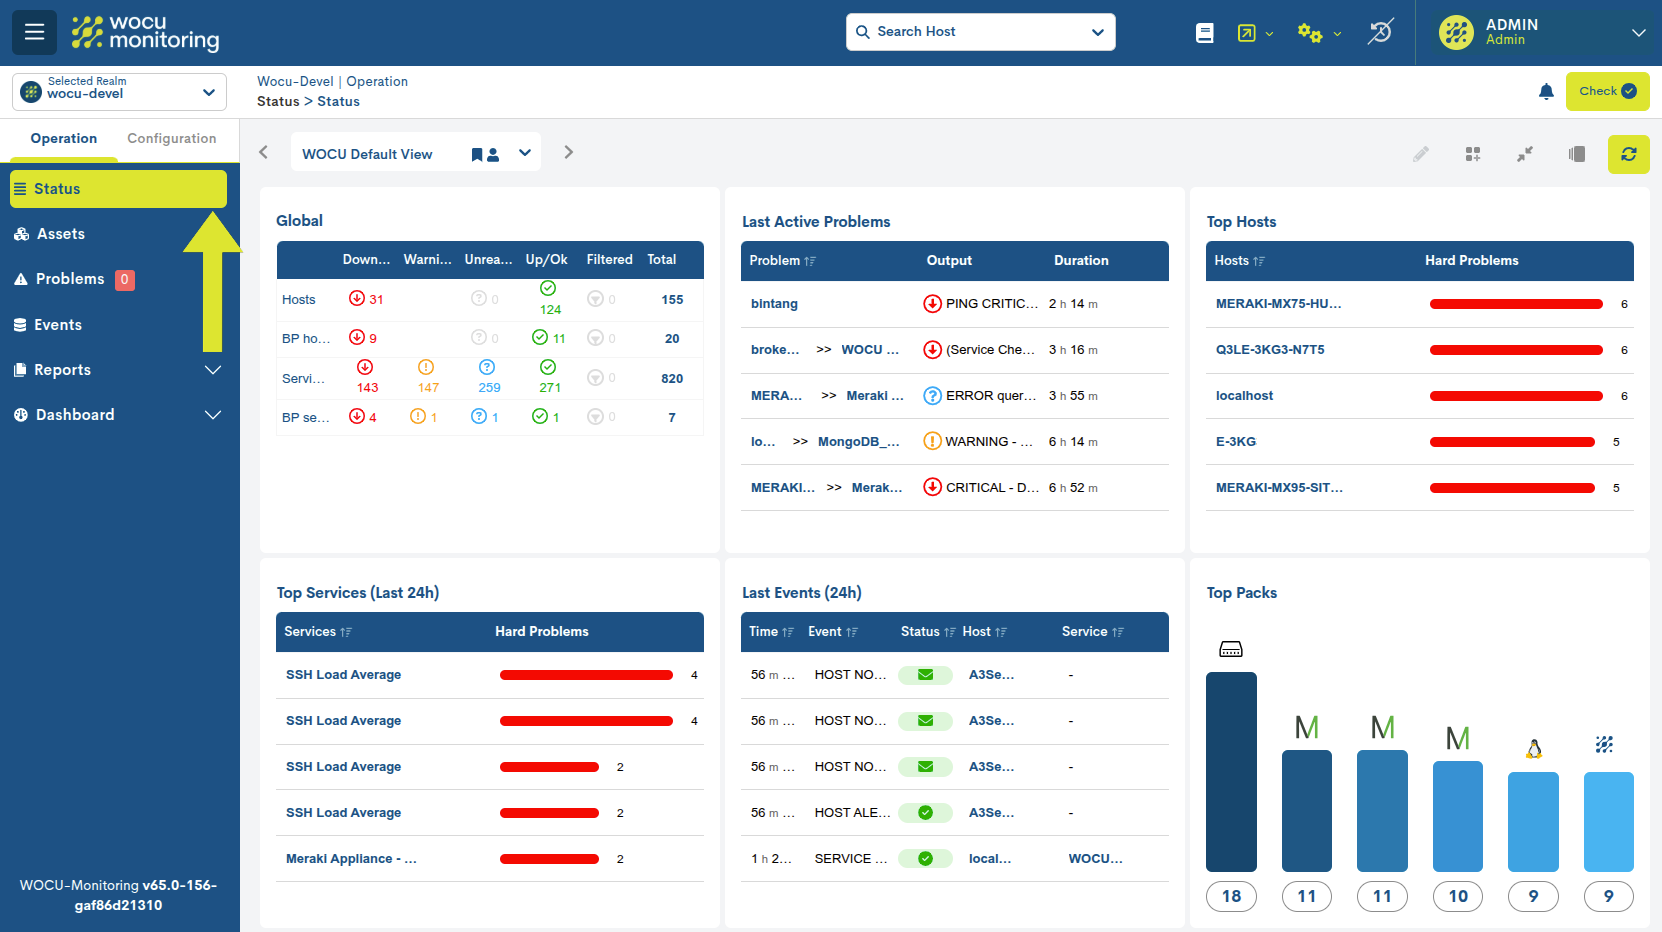
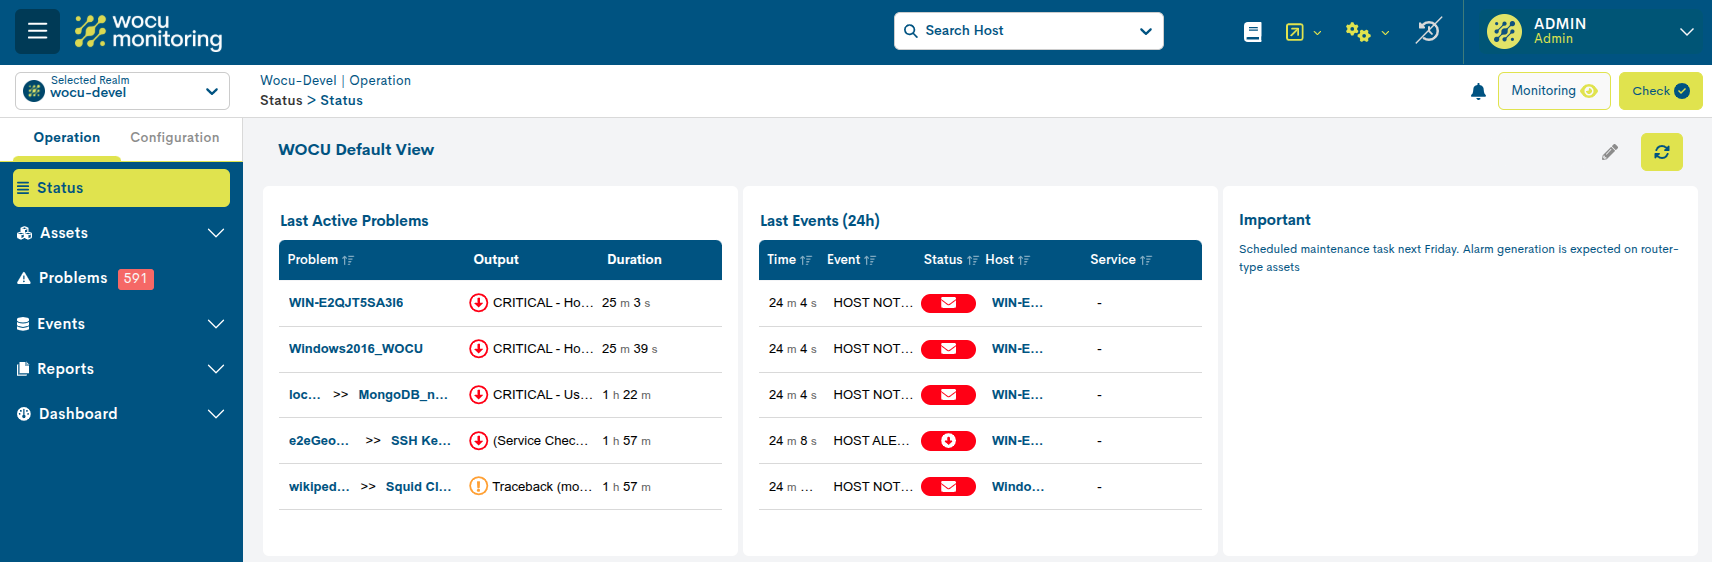
The Status view in WOCU-Monitoring provides a centralized control panel that consolidates essential operational information about the monitored environment. Its purpose is to offer a concise, real-time overview of the availability status of different assets (devices, services, and business processes), allowing you to quickly detect the main problems and the most affected assets, learn about the most recent events, and identify the most used monitoring packs.services, and business processes), allowing you to quickly detect the main problems and the most affected assets, learn about the most recent events,and identify the most used or relevant monitoring packs, among other data. In addition, each dashboard includes direct access to inventories and detailed views,facilitating in-depth analysis.
Overall, this view is established as a key resource for rapid diagnosis and constitutes the entry point to the rest of the features of WOCU-Monitoring.
Dashboard customization
The Status view in WOCU-Monitoring offers a fully customizable dashboard that allows you to adapt the information displayed through different widgets to the user’s operational needs. The main objective is to facilitate the monitoring of the infrastructure in a clear, orderly manner, focused on the most relevant indicators for each work profile.
By default, the dashboard displays a series of preconfigured widgets;however, each Status view (by Kingdom) can be freely modified to display different ones.
Important
There is a maximum limit of 9 widgets. It is not possible to add more widgets to the Status view once this limit is reached.
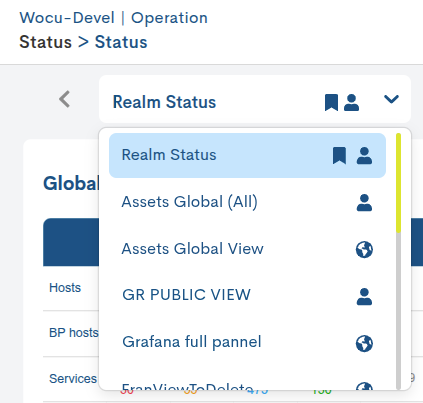
View selector
The view selector facilitates navigation between the different views available in the system.
Each view presents a set of widgets configured to display specific information according to a particular need.
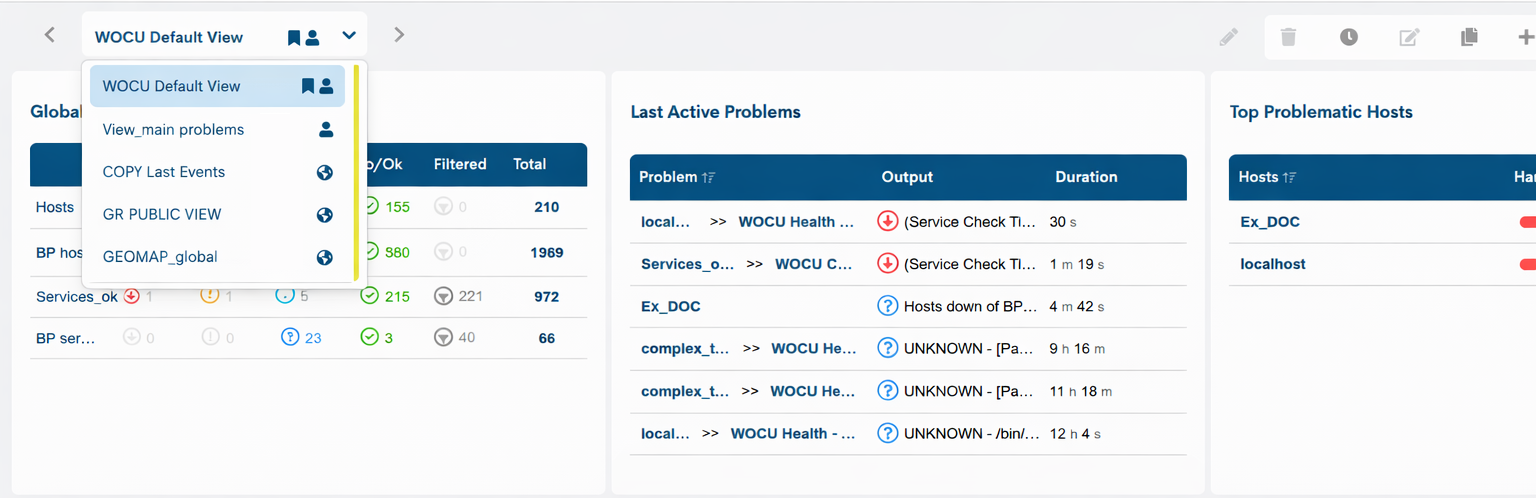
This selector also provides visual information about the configuration of each view:
Visibility of sight
Each view can be public or private, which is identified by the associated icon:
User icon: private view.
Globe icon: public view.
Default View
The view identified by the Realm Status marker icon corresponds to the system’s default configured view, so it is displayed in first position.
This category is configured when creating a view from the action New view by checking the box Set as default view.
Edition Mode
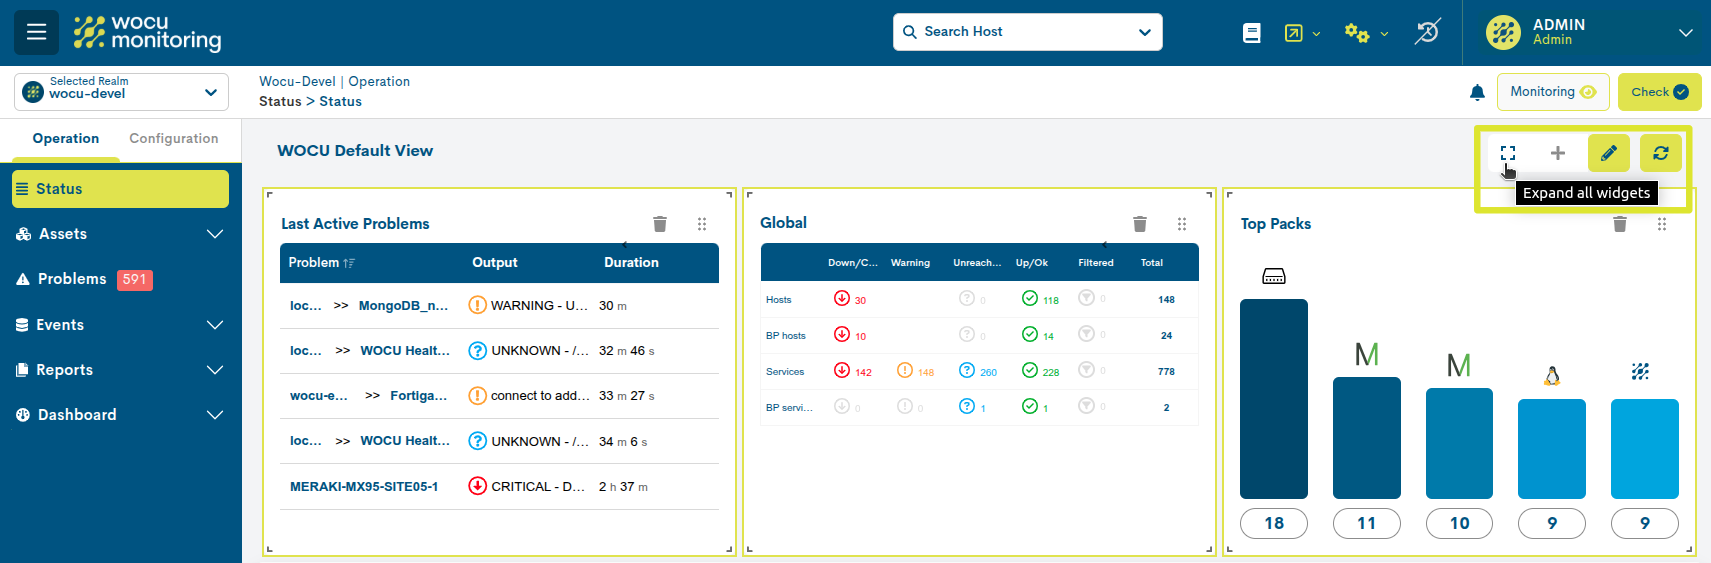
By clicking on the pencil icon located in the upper right corner, you enablethe Enable Edition Mode, from where you can add, remove, create and resize widgets, as well as manage those already configured by default.
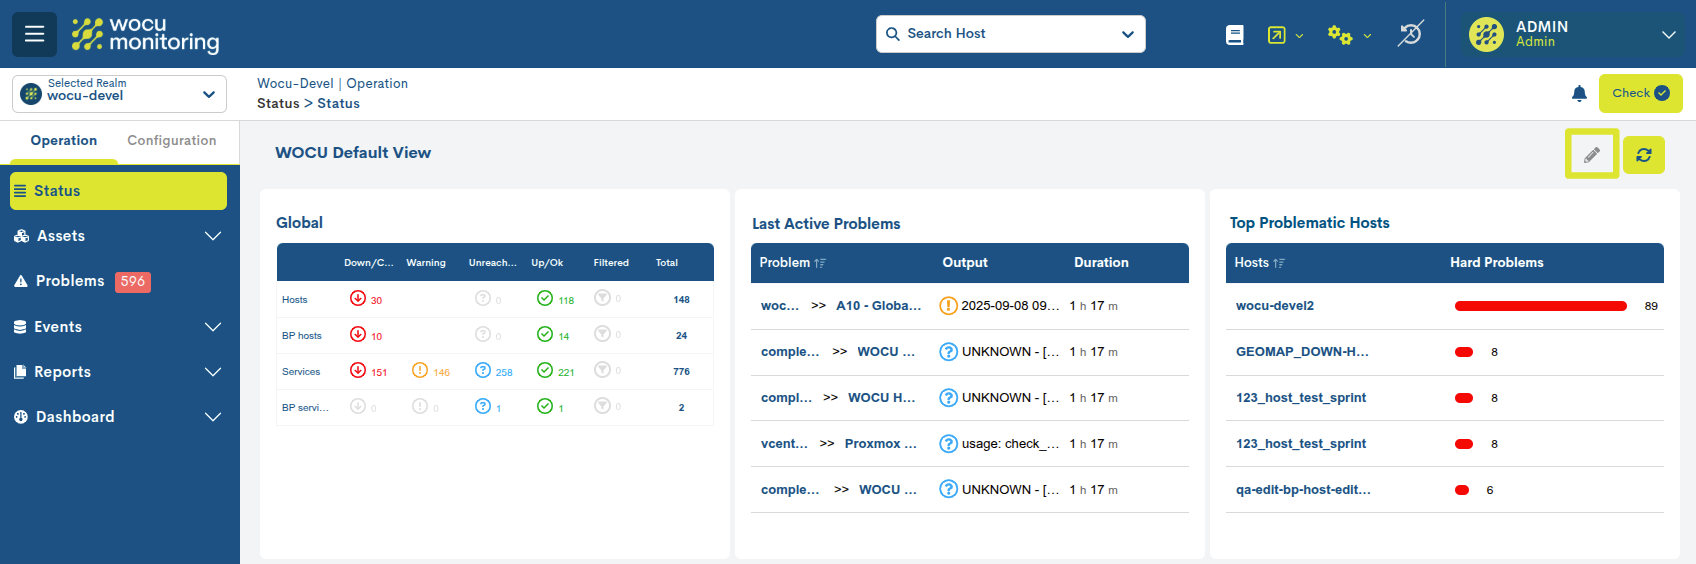
Once this mode is activated, additional controls will appear for each widget, as well as new global options. These are explained in detail below.
Add new widgets
Clicking the + button in the upper right corner opens a selector with widgets for selection or deselection.
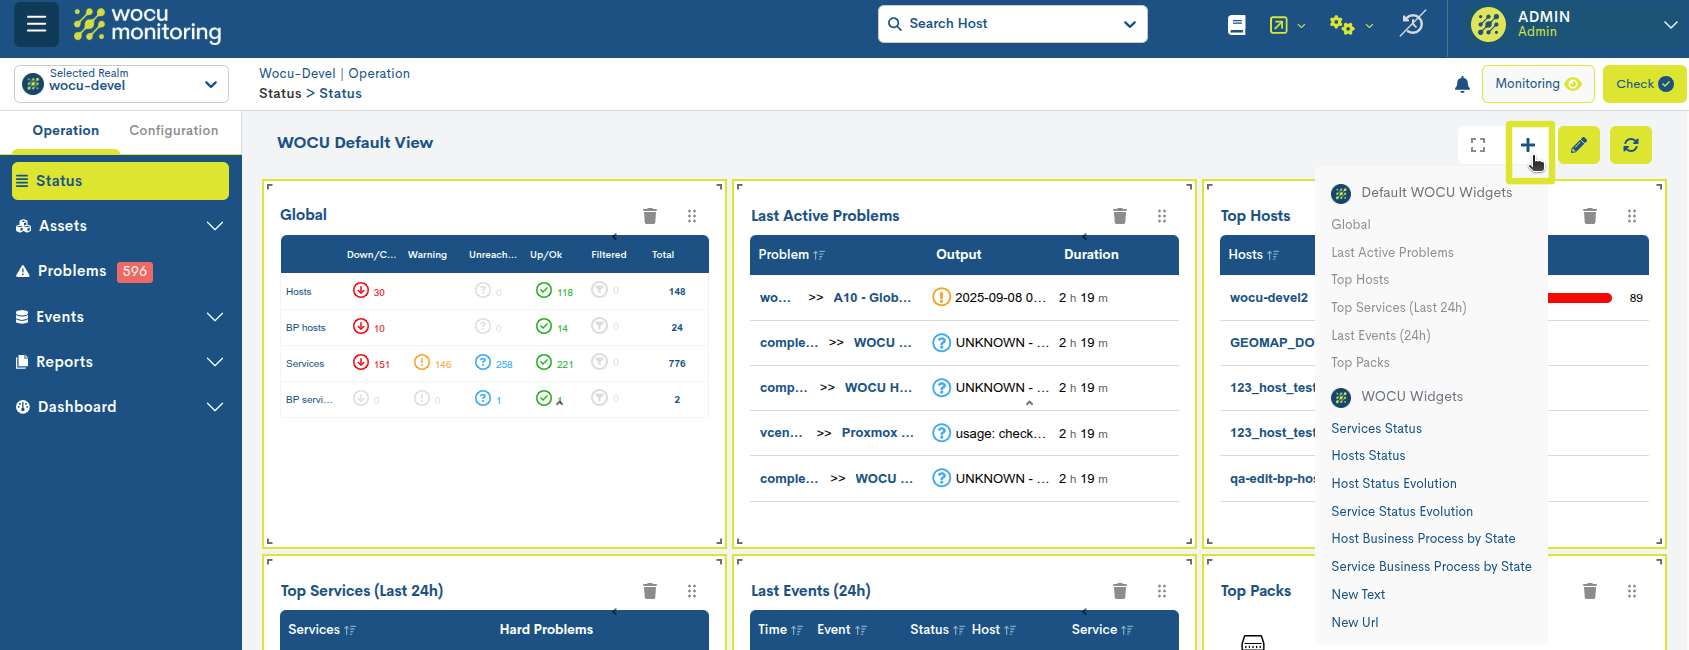
The drop-down menu lists the following categories:
Default WOCU Widgets
WOCU Widgets
When you select a widget, it is automatically added to the dashboard. Status. Notice how widgets already visible to the user are dimmed in the dropdown.
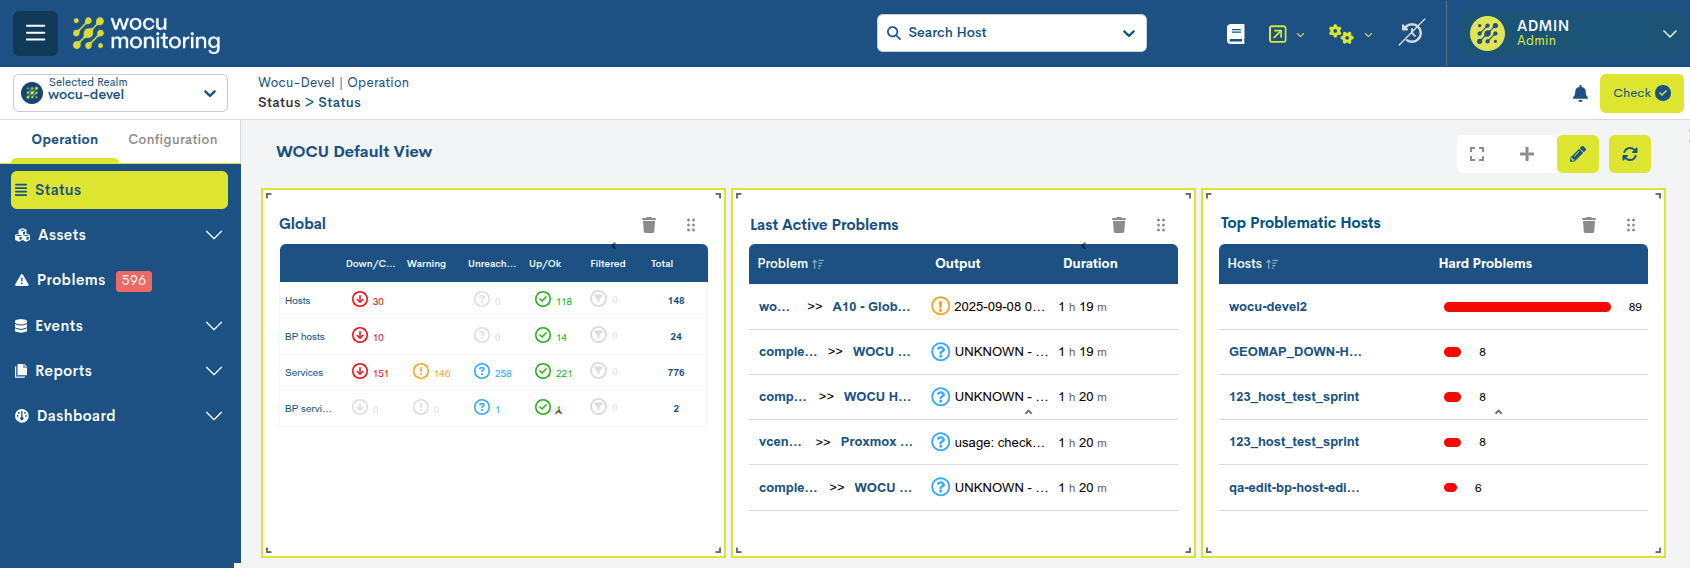
Resize and rearrange widgets
Each widget can be easily resized by dragging its edges or corners. This allows widgets to be highlighted by increasing their size to improve visibility, while less relevant widgets can be reduced.
The panel uses a dynamic grid that makes it easy to move widgets.
To move an entire widget, you can click and hold the drag icon (the six vertical dots) and drag the widget to a new position within the grid.
Note
This option will only be visible when Edition Mode is enabled.
These options provide a more comfortable layout, tailored to your needs.
Remove widgets
At the top right of each widget is a trash can icon, which allows you to immediately remove it from the dashboard.
Note
This option will only be visible when Edition Mode is enabled.
Reset standard size
The Expand All Widgets option returns all widgets to their standard or default size, creating a more harmonious view aligned with the rest of the panel elements.
Data Update
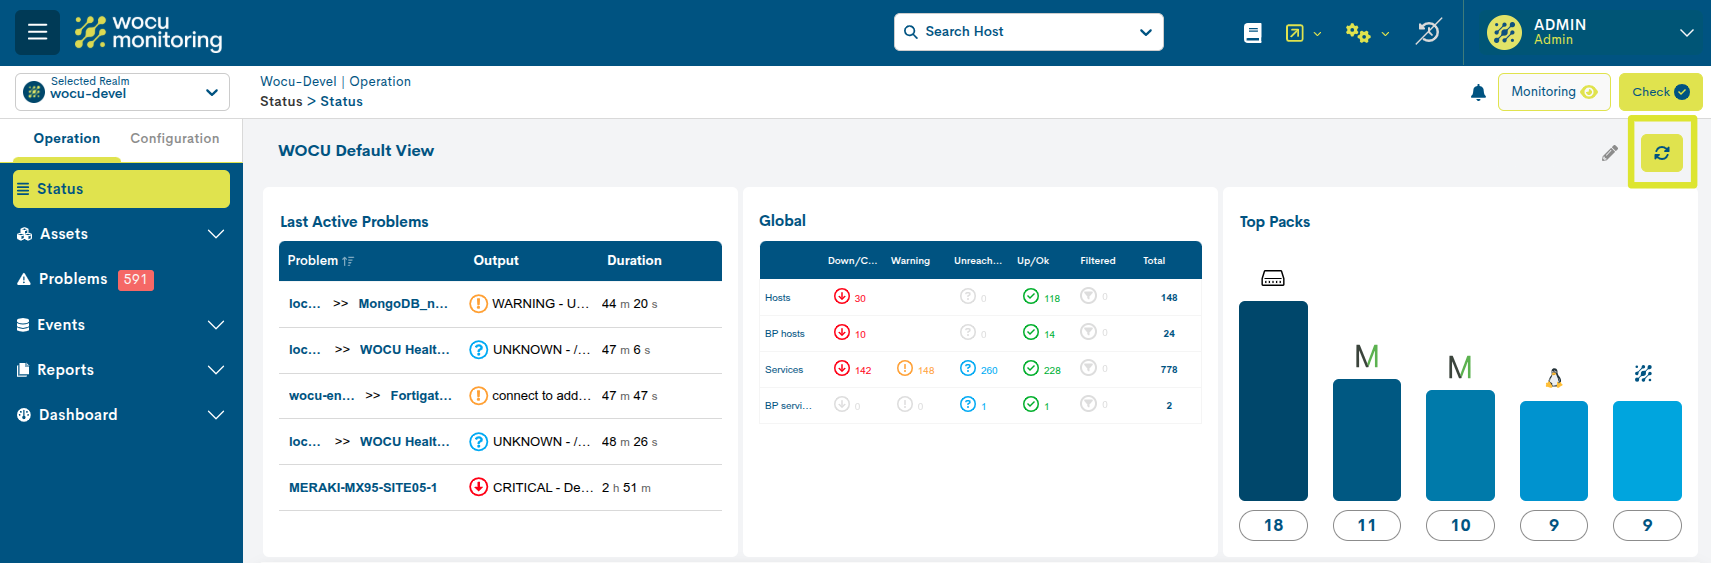
The widgets display information from the last 24 hours. However, there is a refresh button that allows you to force a refresh of the data at any time.
View Settings
The View Settings functionality allows you to create and manage multiple widget views. Each view groups a specific set of widgets tailored to a particular need and can be configured as public or private.
Through the View Settings button, the user can perform various configuration actions:
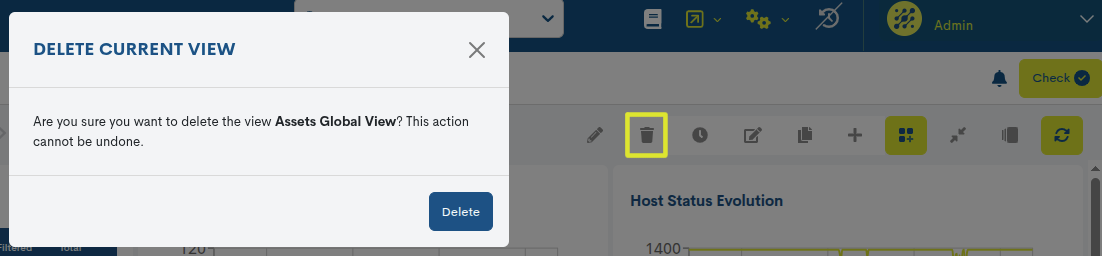
Delete current view
Allows you to delete the active view. To complete the action, you must confirm using the Delete button.
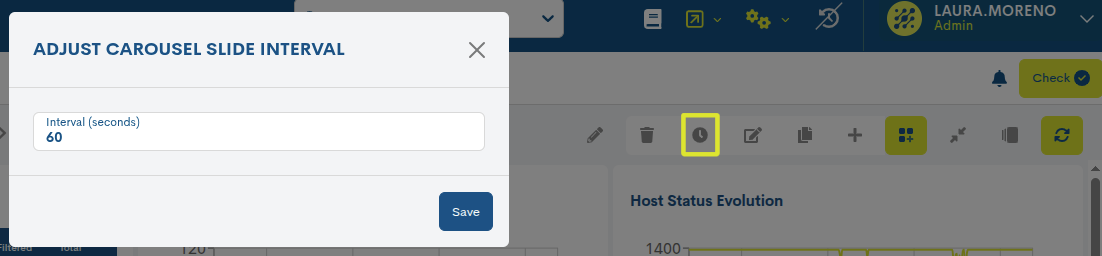
Adjust carousel slide interval
Allows you to define the time interval (in seconds) between the automatic view changes.
To use this option, Carousel mode must be previously enabled via the Enable Carousel field.
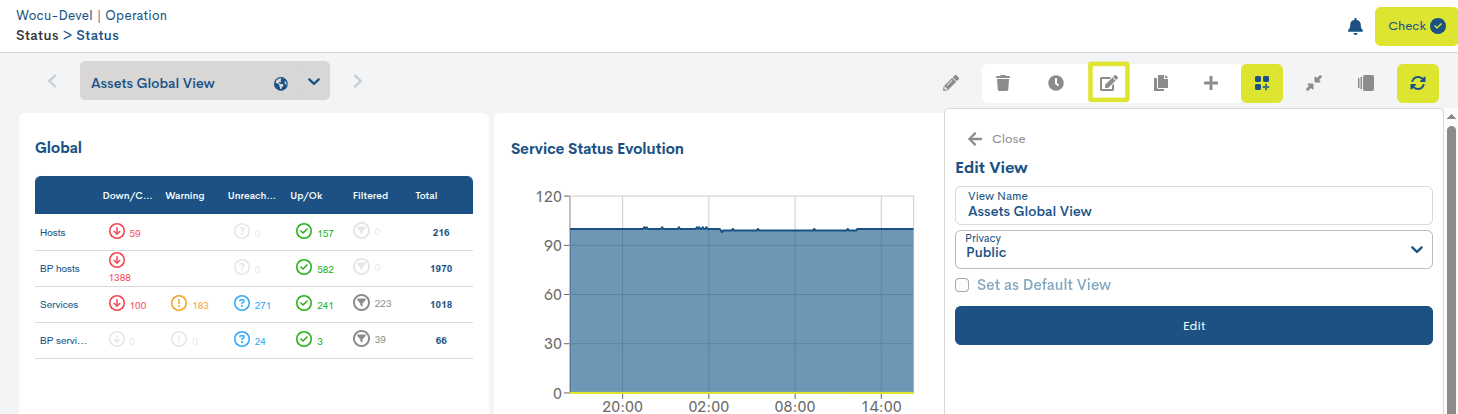
Edit current view
Allows you to modify the settings of the selected view.
Available fields:
View Name: identifying name of the view.
Privacy: defines the visibility of the view (Public or Private).
If the Private option is selected, the Set as ” “default view box is enabled, allowing you to set the view as the default for your initial display.
Copy view
Allows you to duplicate the current view to create a new one based on its configuration.configuration.
Available fields:
View Name: identifying name of the view.
Privacy: defines the visibility of the view (Public or Private).
If Private is selected, the Set as default view option is enabled, allowing you to set the view as the default for its initial display.

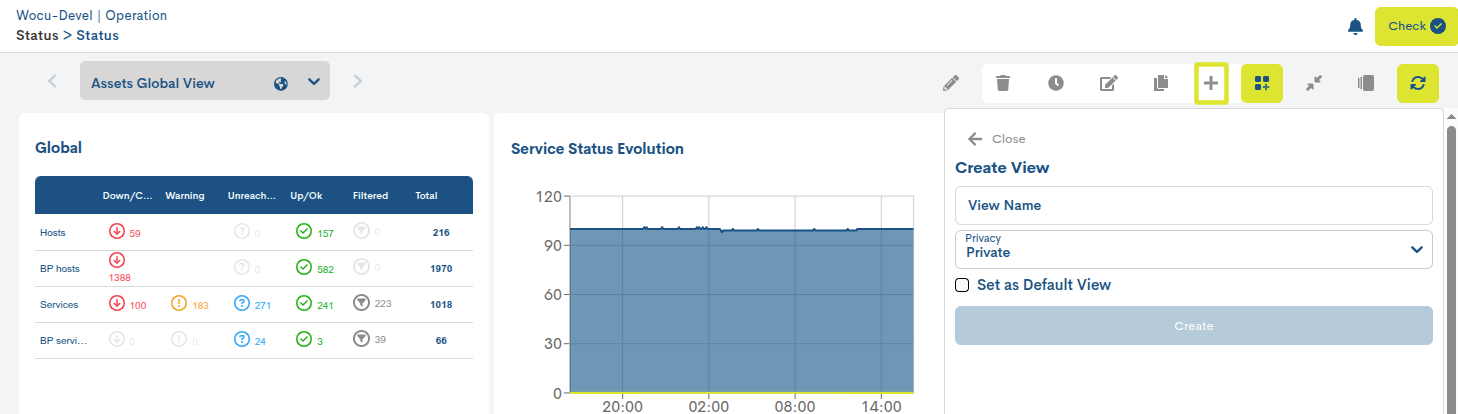
New view
Allows you to create a new view from the currently selected widgets.
Available fields:
View Name: identifying name of the view.
Privacy: defines the visibility of the view (Public or Private).
If Private is selected, the Set as default view option is enabled, allowing it to be set as the default view.
Hide controllers
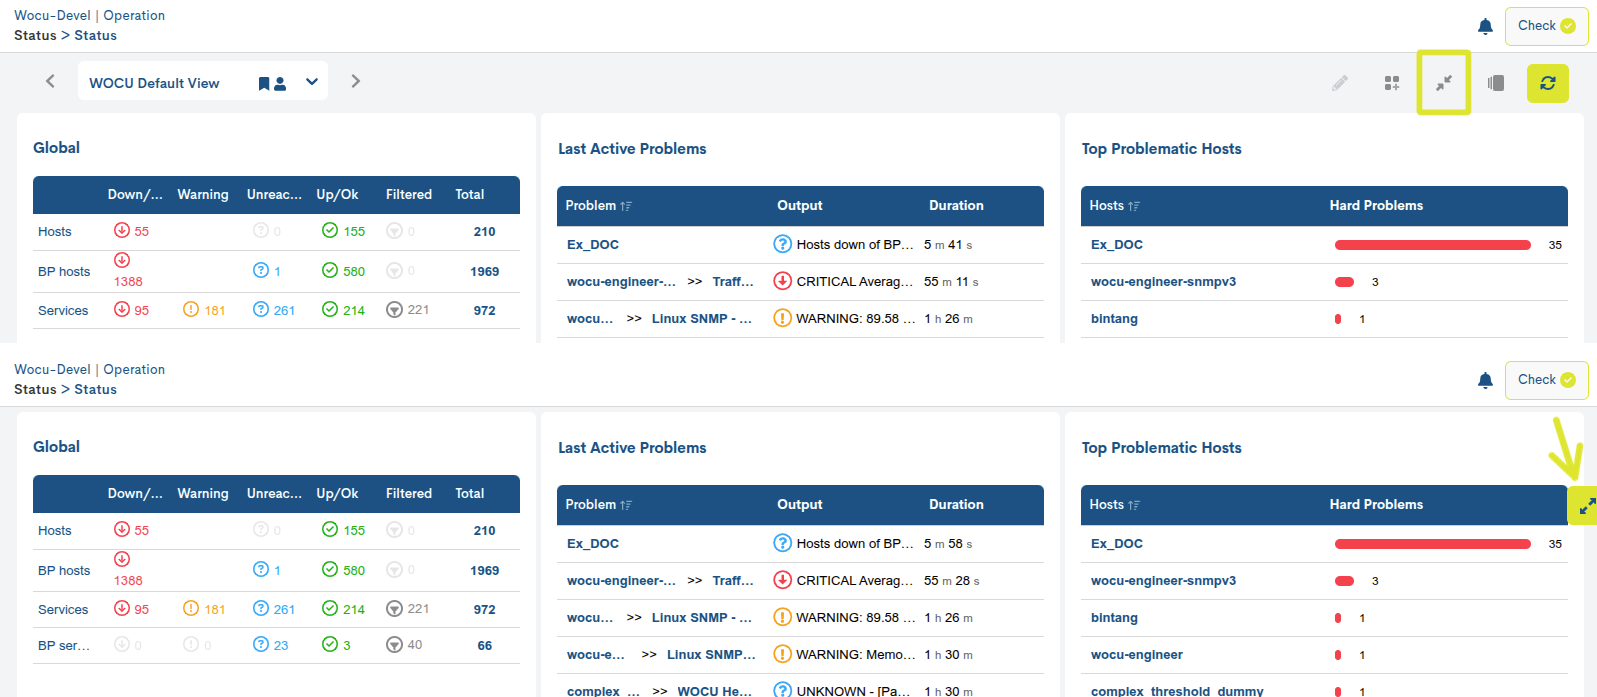
This option allows you to hide the global view controls and the view selector, optimizing the available screen space.
When these controls are collapsed, the top expansion button (diverging arrows) is displayed first, which acts as a switch to expand the full toolbar. Next, two navigation buttons (side arrows) appear, allowing you to quickly and sequentially move between the previous and next views without having to reopen the main menu.
On the other hand, when the controls are visible, they remain fixed even on large dashboards, making them easy to access while scrolling.
Enable Carousel
When activated, it allows the views to be displayed sequentially at a configurable interval via the slide_carousel field (60 seconds by default).
Widgets
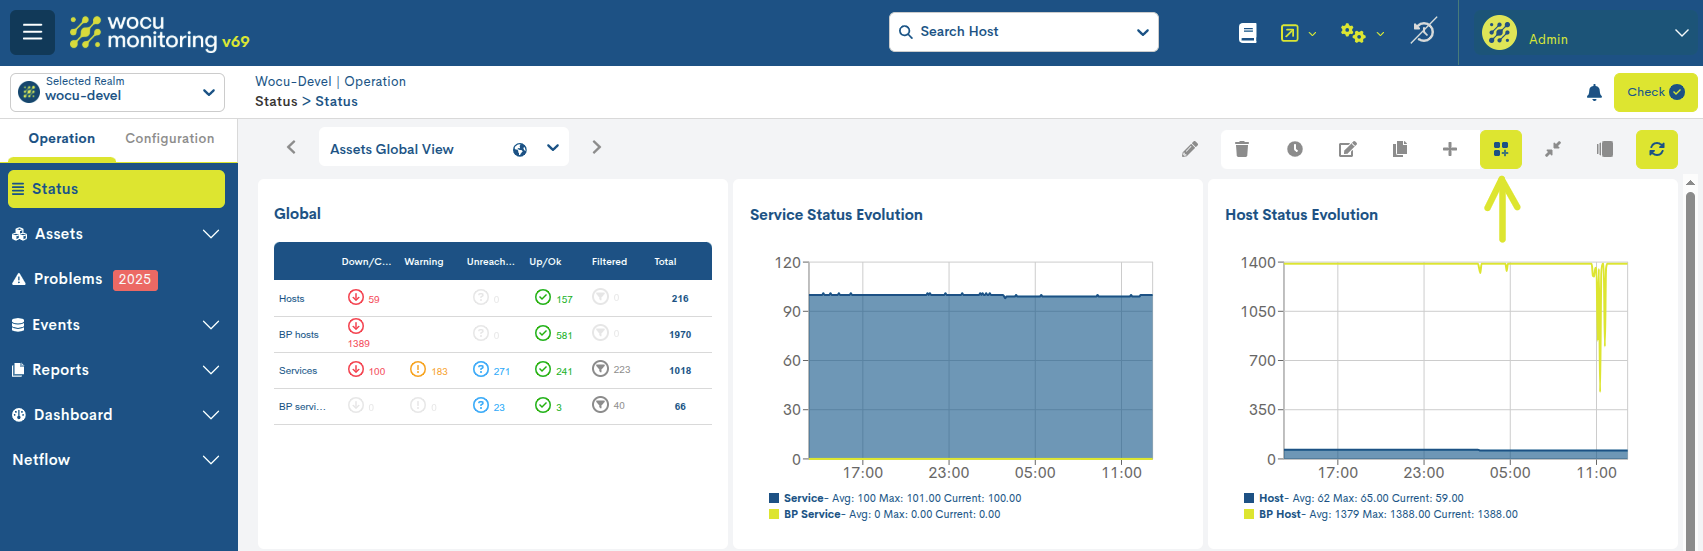
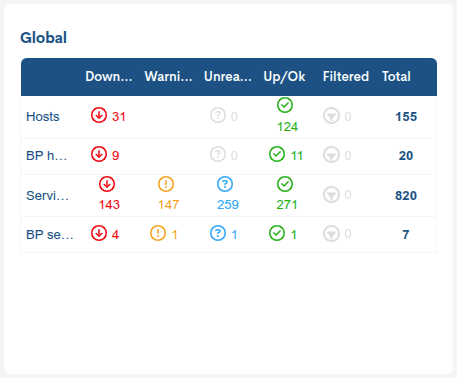
Global
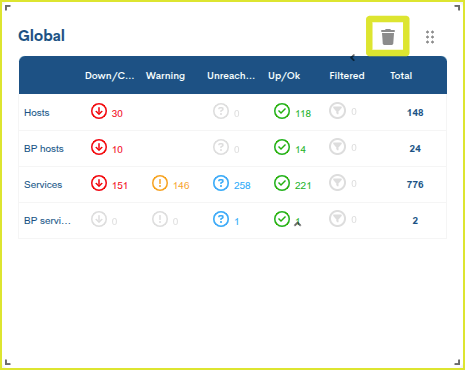
This panel (displayed by default) first displays numerical data about the elements monitored in WOCU-Monitoring for the selected Kingdom via a table.
For each element type (Hosts, BP Hosts, Services, and BP Services), the following information is displayed: how many of them are in one of the four states defined by WOCU-Monitoring (Down/Critical, Warning, Unreachable/Unknown, Up/OK), how many of them have been filtered (Filtered), and the total number of monitored elements.
Attention
The Assets that appear in the Filtered column correspond to those items for which the Apply *acknowledged and/or Disable active checks actions have been selected, both present in the Actions on inventoried hosts. Or after having enabled the Filter acknowledged, Filter disabled checks, and/or Filter problem services if host down options in the User preferences menu.
Last Active Problems
This panel (displayed by default) provides a summary of the latest incidents detected by WOCU-Monitoring in the selected Realm.
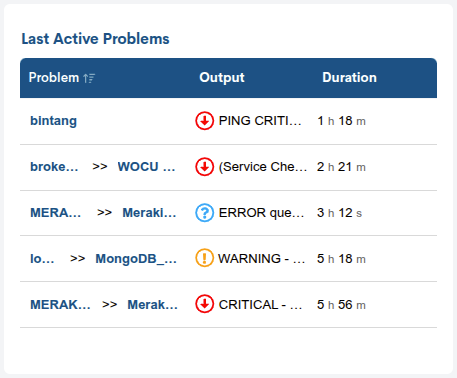
The following information is provided in a tabular format:
By clicking on the panel title (Last Active Problems), the user is redirected to List of alarms on monitored assets.
Problems column: Lists the detected problems. Each entry has two possible links:
Hostname (e.g., 123_h…, local…, complex…): Redirects to the Detailed view of Hosts and Business Processes, where you can analyze the general status and information related to that device.
Associated service name (e.g., Meraki Switch, WOCU Health, etc.): Redirects to the Detail view of Services and Business Processes, where technical information and metrics specific to the affected service are displayed.
Output Column: The result of the monitoring command, script, or plugin executed to check the status of a device or service. This is a technical description of the error detected during the check.
Duration column: shows how long the incident has been active.
Note
It may happen that the text displayed in any of the three columns exceeds the space available on your monitor, then the text will be cut off at the limit of each column. In this case, an ellipsis (…) is always included to indicate that the text continues but has been cut off. However, the full text can be consulted by placing the cursor over the text.
Attention
Enabling the options Filter acknowledge, Filter disabled checks, and/or Filter problem services if host down in User preferences may affect the data displayed in this panel.
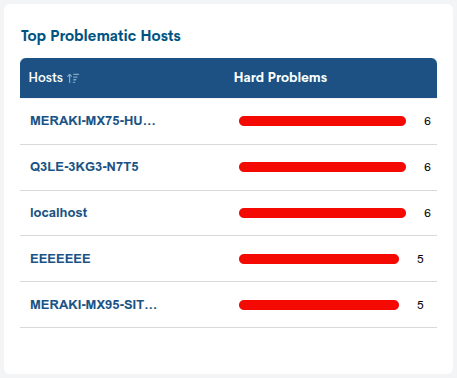
Top Problematic Hosts
By default, this panel shows the 50 most active hosts based on alarms triggered in the selected Realm over the last 6 hours.
Clicking on the panel title will grant access to the Hosts Inventory.
On the other hand, by clicking on the indicator of a Host in the Hosts column, you will access its Detailed view of Hosts and Business Processes.
Attention
Enabling the options Filter acknowledge and/or Filter disabled checks in User preferences may affect the data displayed in this panel.
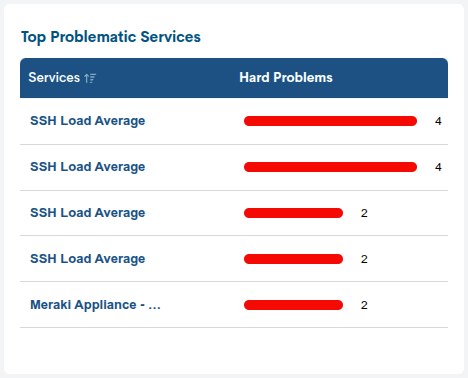
Top Problematic Services
By default, this panel shows the 50 most active services based on alarms triggered in the selected Realm over the last 6 hours.
Clicking on the panel title will grant access to the Services Inventory.
On the other hand, by clicking on the indicator of a Service in the Services column, you will access its Detail view of Services and Business Processes.
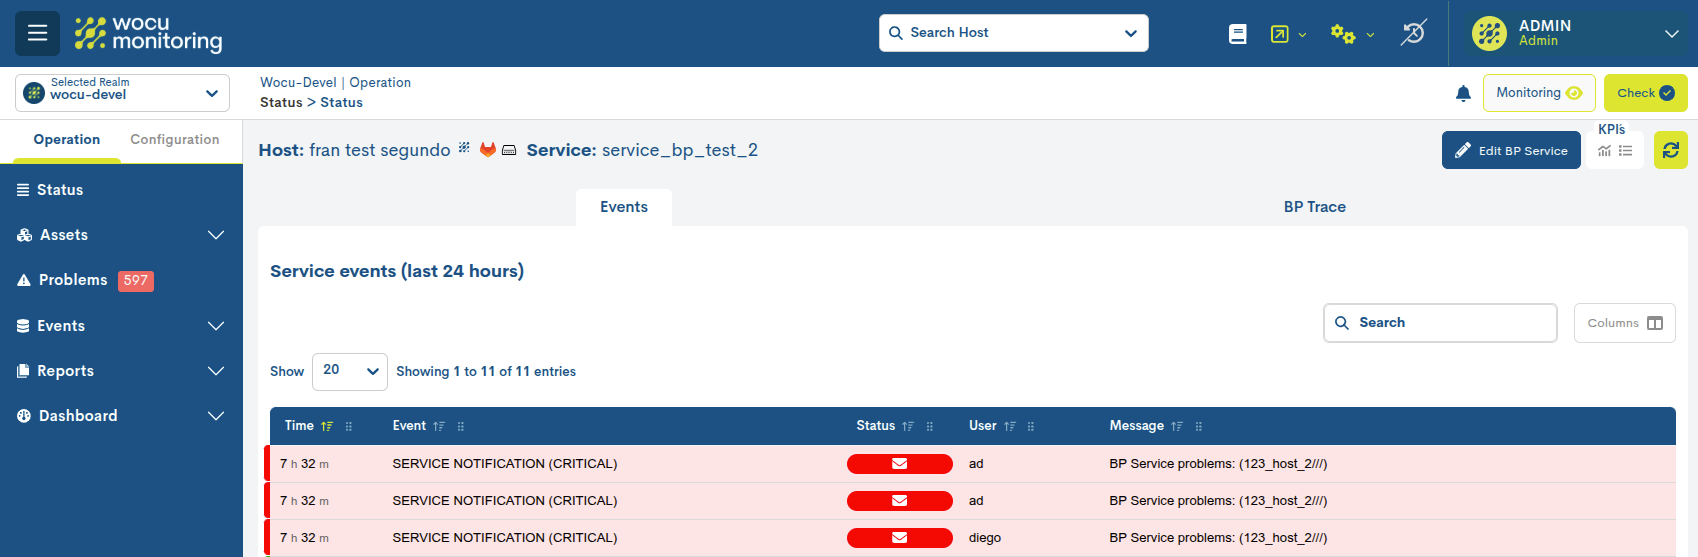
Last Events
This panel (displayed by default) provides a ranking of the latest events recorded during the last 24 hours in the selected Kingdom.
Clicking on the panel title will grant access to the Monitoring Events (Monitoring).
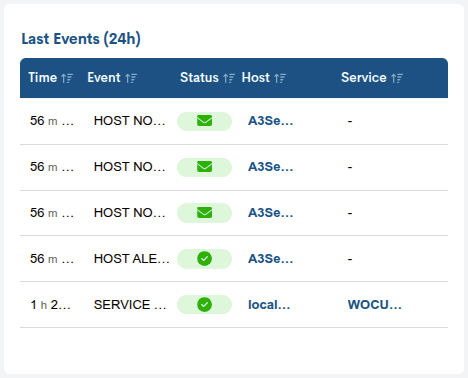
For each event, the following is recorded:
Time: indicates how long ago the event was received (days and hours since the event occurred).
Event: describes the type of event. Below are the details of the existing types of events:
Alert Type Event (ALERT):
This Event informs of an occurrence that causes a change in the Status calculation in WOCU-Monitoring, for example, the transition from a normal operating state (Up/OK) to a total loss of availability (Down, Critical). The types of messages that the Event field can contain to classify this type of Alerts are as follows:
HOST ALERT: message related to an Alert on a Device when a change in its Status occurs.
SERVICE ALERT: message related to an Alert on a Service when a change in its Status occurs.
HOST FLAPPING ALERT: message related to an Alert on a Device when there is a rapid alternation of States (Flapping).
SERVICE FLAPPING ALERT: message related to an Alert on a Service when there is a rapid alternation of States (Flapping).
Notification Type Event (NOTIFICATION):
This Event informs of the sending of a notification message due to a change in Status on an Asset to the individuals listed in the Contacts field for that Asset. In other words, it is a purely informational Event regarding the sending of a notification (email, SMS), which originates from a Status change Event (Alert). The types of messages that the Event field can contain to classify this type of Notification are as follows:
HOST NOTIFICATION: message related to a Notification regarding a Device when a change in its Status occurs.
SERVICE NOTIFICATION: message related to a Notification regarding a Service when a change in its Status occurs.
External Command Type Event (EXTERNAL COMMAND):
This event informs of the execution by a WOCU-Monitoring user of any of the actions performed through the Actions on monitored Assets (Hosts and Services) that trigger the sending and execution of commands and instructions in WOCU-Monitoring. In this way, the actions performed by WOCU-Monitoring users are also recorded. For example, applying Acknowledgement to an Alarm will result in an event that will be identified with this label “EXTERNAL COMMAND”.
Status: informs of the status calculated by the system for the Asset at the time the Event was received.
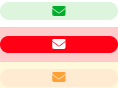
To do this, an icon is used to indicate the impact of each Event on the Status determined by WOCU-Monitoring. The following icons are available:
Normal operating status (Up/OK), identified by the green checkmark icon:

Total loss of availability status (Down/Critical), identified by the red downward arrow icon:

Warning status in the operation of a Service (Warning), identified by the yellow exclamation mark icon:

Loss of contact status (Unreachable/Unknown), identified by the gray question mark icon:

Rapid state alternation status (Flapping), identified by the blue rotating arrows icon:

Notification of message sent due to a change in the Status of an Asset (Notification), identified by the envelope icon:
Notice of actions executed on monitored Assets by a WOCU-Monitoring user (Commands), identified by the gears icon:

Host: this field includes the name of the Host that has generated the event (clicking on the name will take you to the Detailed view of Hosts and Business Processes).
Services: this field indicates which Service of the Host corresponds to the event (clicking on the name will take you to the Detail view of Services and Business Processes).
Top Packs
This panel (displayed by default) displays, through a bar graph, the most frequently used and most widely used Monitoring Packs within the Kingdom in question. Clicking on the panel title will take you to the General Info.
Each bar represents a specific pack, and its size will vary according to its application to more or fewer Hosts.
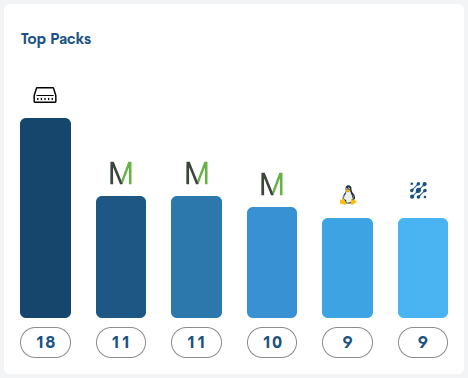
An identifying icon for the pack accompanies each bar. Placing the cursor over the icon or text will bring up an information window with the technology represented and the total number of devices that are using the pack.
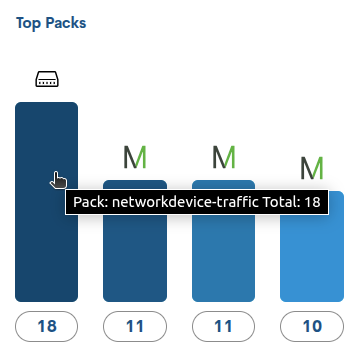
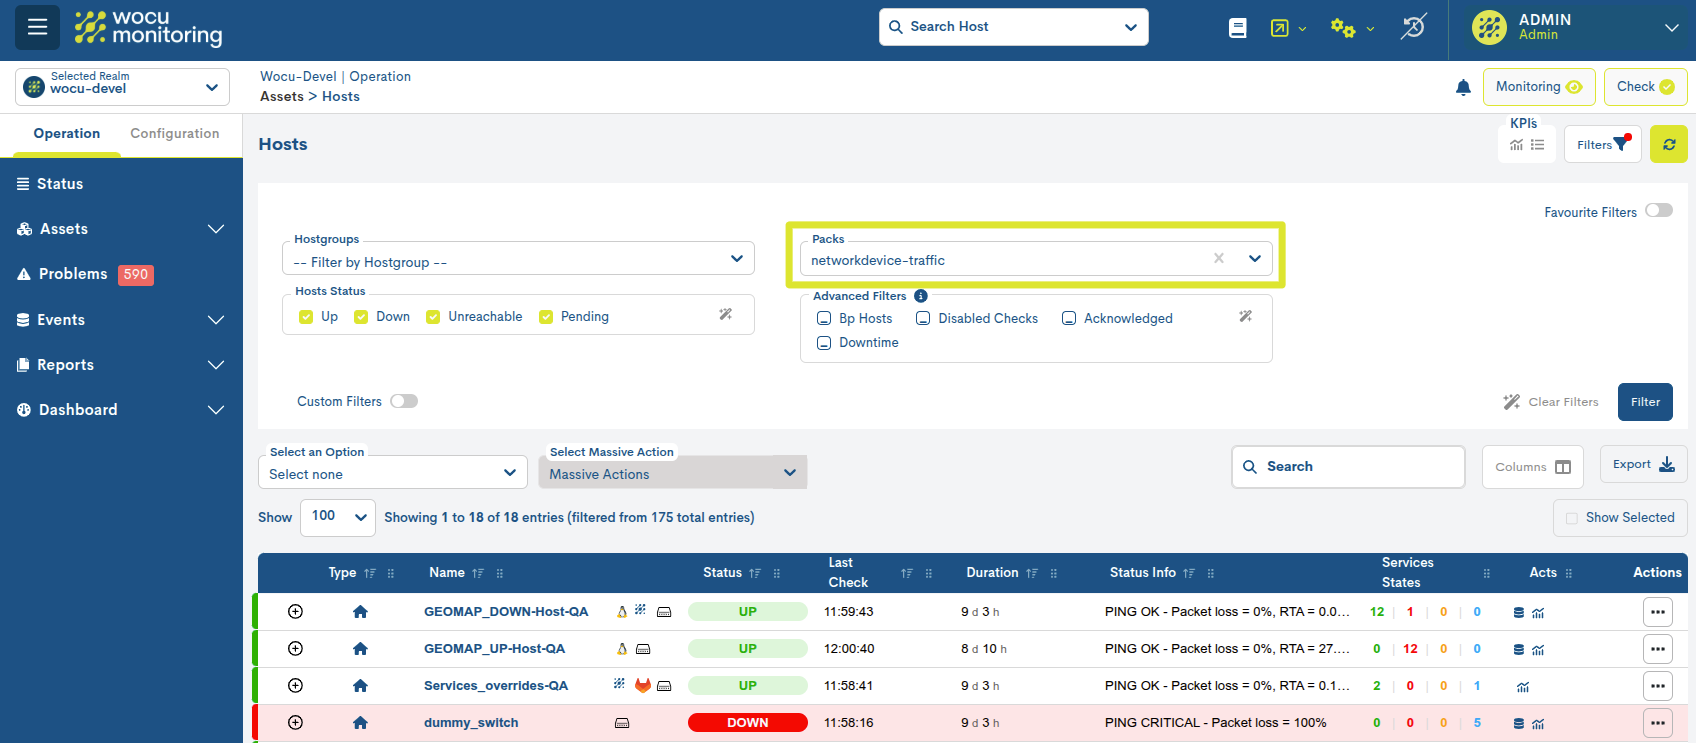
This panel also acts as a filter, since clicking on a specific bar redirects the user to Hosts Inventory, where only the list of devices that have that particular pack configured is displayed. The Filter by Monitoring Packs will also register this pack. See the following image:
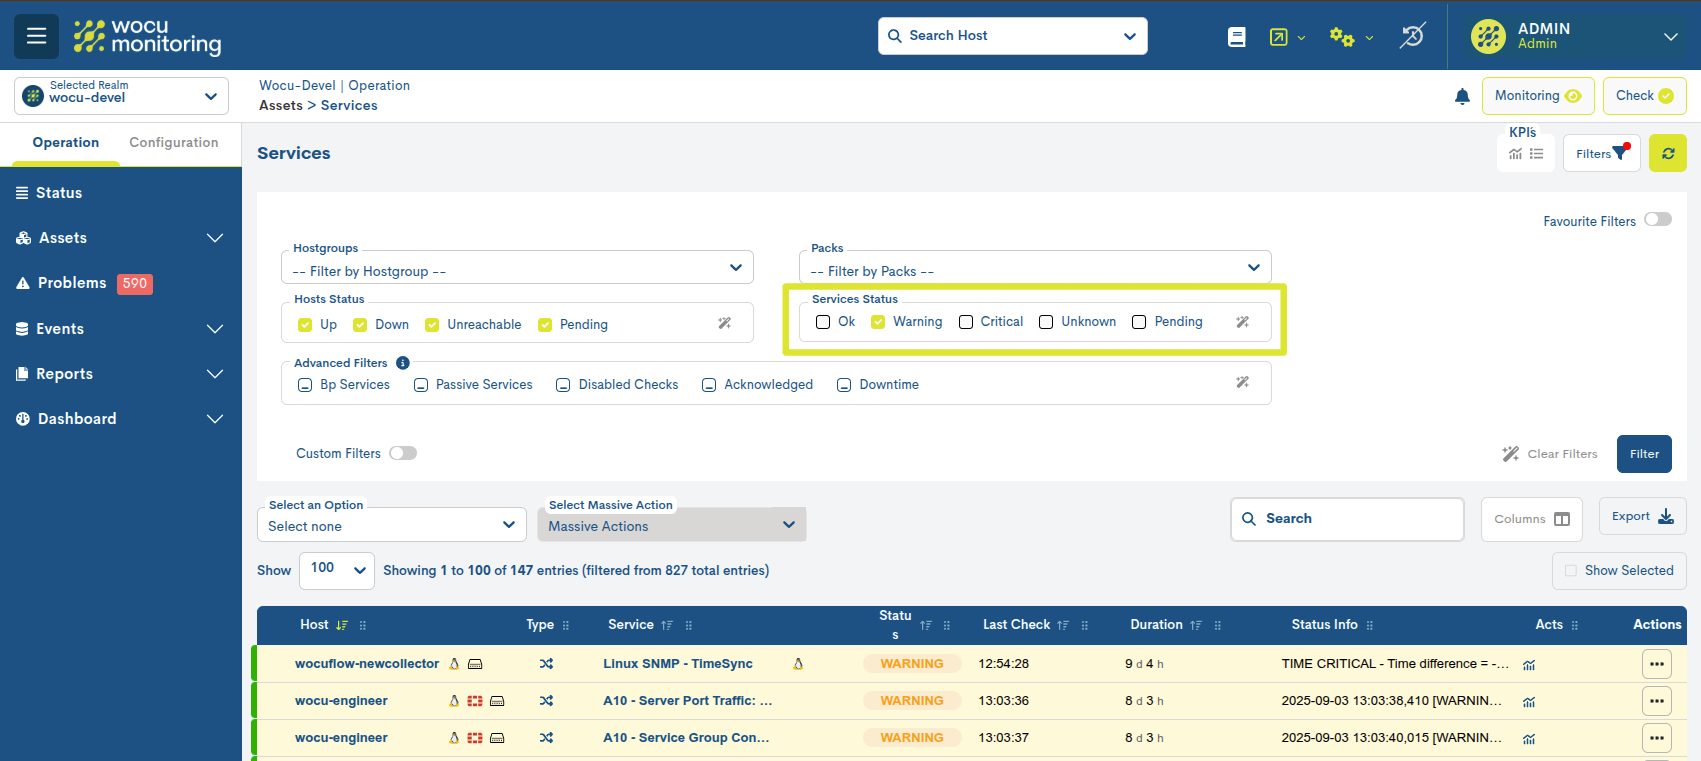
Services Status
Note
This panel is not displayed by default. To view it, you must use the Edition Mode option and select the + icon, where all the available widgets are displayed. Clicking on the corresponding widget will add it to the overview for reading and interaction.
This pie chart segments all monitoring services (value indicated within the chart) according to their current availability status. It provides a comprehensive view of the services in the selected Realm, identifying how many are functioning correctly, how many are experiencing issues, and how many require review to confirm their operational status.
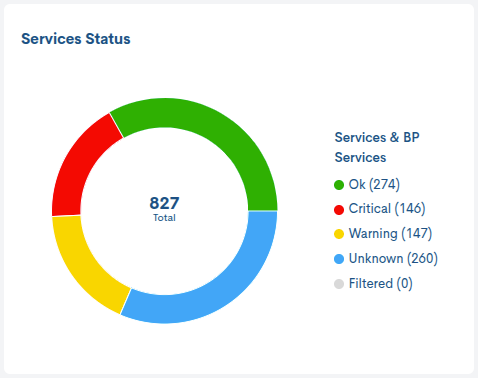
Clicking on any of the different statuses associated with the services in the panel will redirect the user to their respective inventories, applying the corresponding filters. For example, selecting the Warning status icon will redirect the user to the Services Inventory filtered by the services that currently record that status.
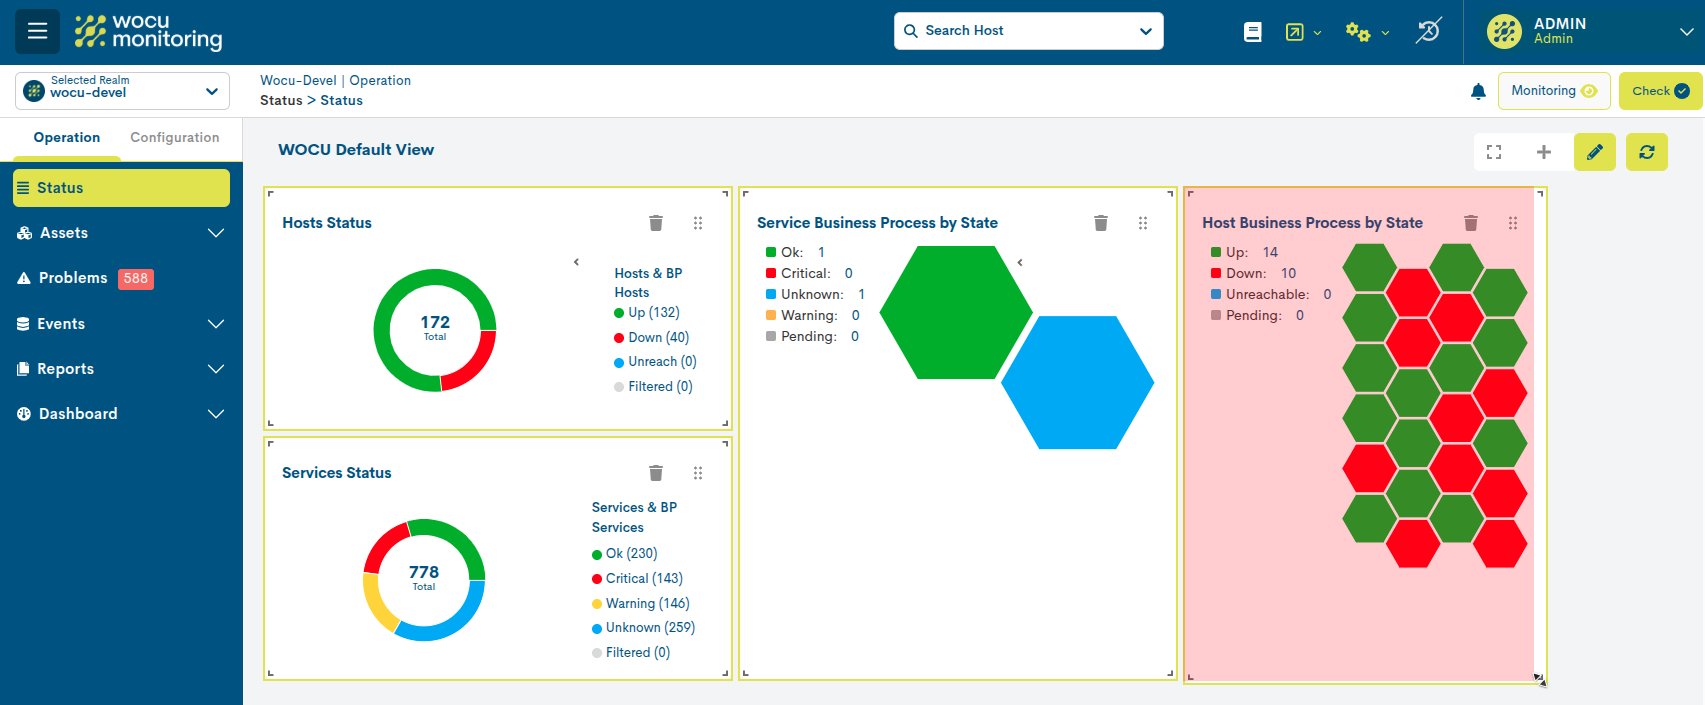
Host Status
Note
This panel is not displayed by default. To view it, you must use the Edition Mode option and select the + icon, where all the available widgets are displayed. Clicking on the corresponding widget will add it to the overview for reading and interaction.
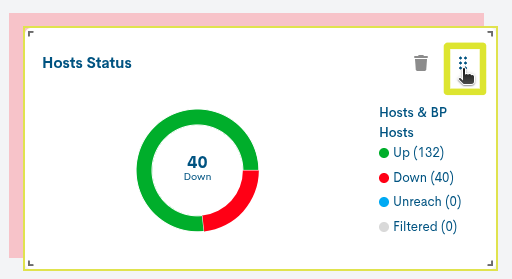
This pie chart segments all monitoring devices (value indicated within the chart) according to their current availability status. It provides a comprehensive view of the devices in the selected Realm, identifying how many are functioning correctly, how many are experiencing issues, and how many require review to confirm their operational status.
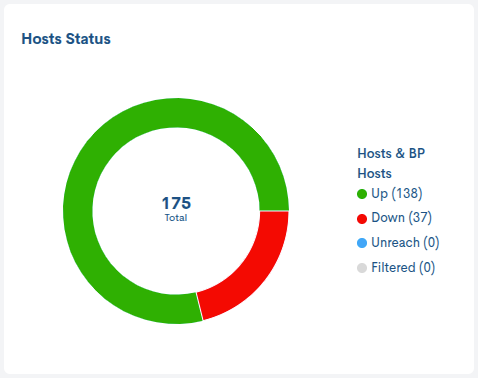
Clicking on any of the different statuses associated with the devices on the dashboard will redirect the user to their respective inventories, applying the corresponding filters. For example, selecting the Warning status icon will redirect the user to the Hosts Inventory filtered by the devices currently recording that status.
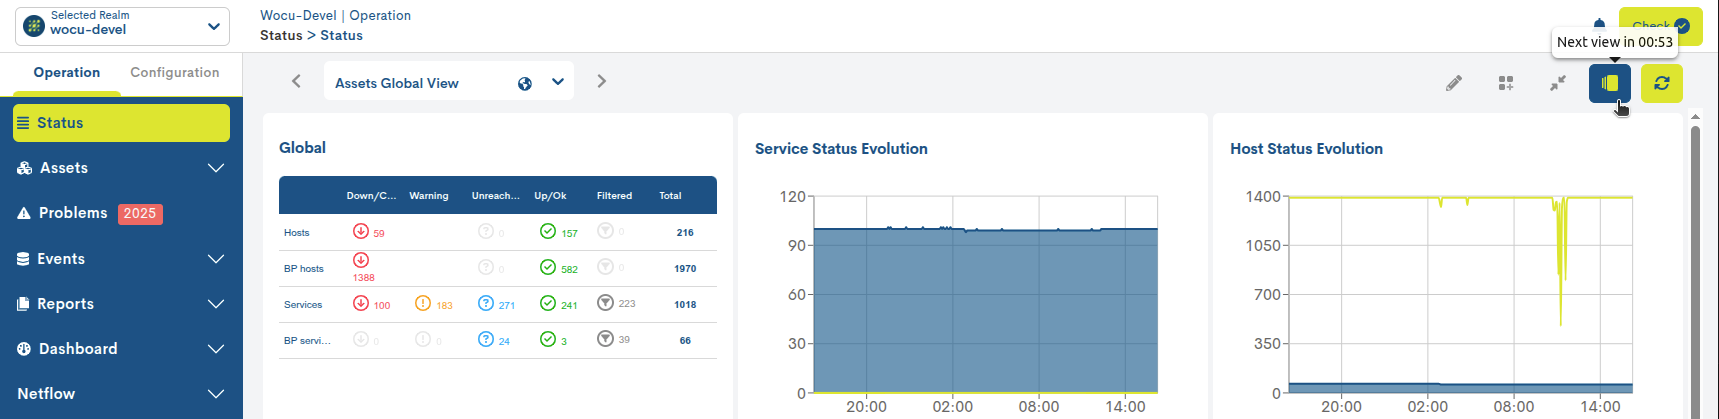
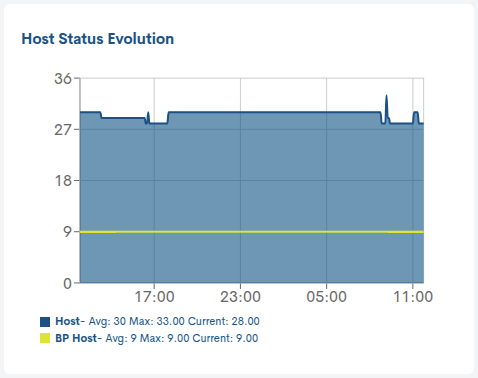
Host Status Evolution
Note
This panel is not displayed by default. To view it, you must use the Edition Mode option and select the + icon, where all the available widgets are displayed. Clicking on the corresponding widget will add it to the overview for reading and interaction.
This graph represents the evolution of the number of devices and business processes down over the last 24 hours.
The Y-axis (vertical) records the total number of Hosts (blue area) and Business Process Hosts (yellow area) that are inactive at any given time. The X-axis (horizontal) represents the elapsed time within a monitoring interval spanning the last 24 hours.
When you hover the cursor over a point on the graph, a box appears with details for that point in time:
Host Down: number of devices down at that exact moment.
BP Host Down: Number of business processes down at that exact moment.
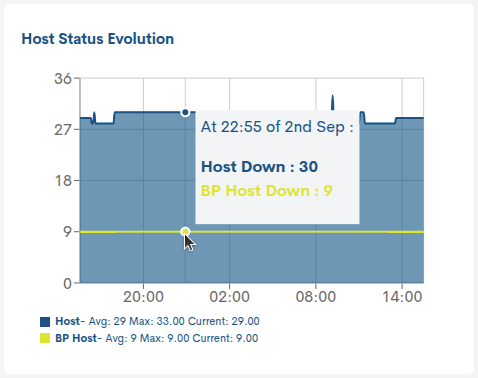
This way, the graph allows you to clearly identify how many devices and business processes were down and when they occurred within the period analyzed.
Important
This widget is not available in Host Group-based Realms or Multi-Realms.
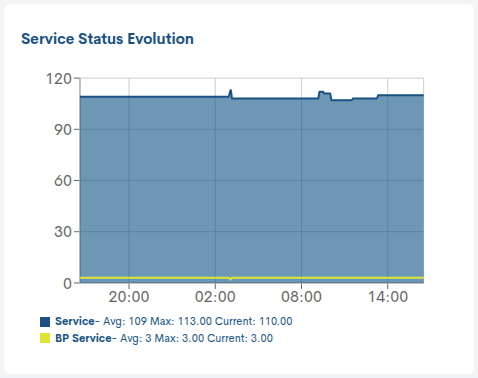
Services Status Evolution
Note
This panel is not displayed by default. To view it, you must use the Edition Mode option and select the + icon, where all the available widgets are displayed. Clicking on the corresponding widget will add it to the overview for reading and interaction.
This graph represents the evolution of the number of services and business processes that have been down over the last 24 hours.
The Y-axis (vertical) records the total number of Services (blue area) and Business Process Services (yellow area) that are inactive at any given time. The X-axis (horizontal) represents the elapsed time within a monitoring interval spanning the last 24 hours.
When you hover the cursor over a point on the graph, a box appears with details for that point in time:
Service Critical: Number of services currently down.
BP Service Critical: Number of business processes down at that time.
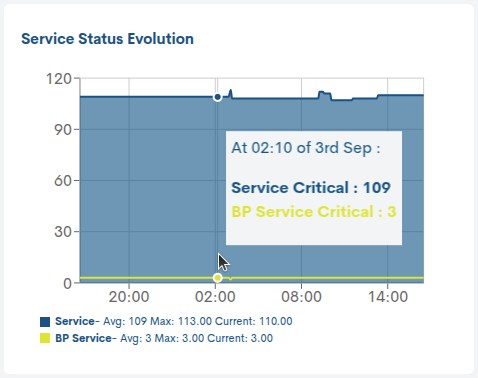
This way, the graph allows you to clearly identify how many services and business processes were down and when they occurred within the period analyzed.
Important
This widget is not available in Host Group-based Realms or Multi-Realms.
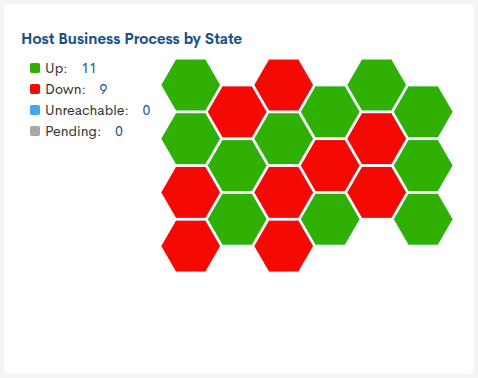
Host Business Process by State
Note
This panel is not displayed by default. To view it, you must use the Edition Mode option and select the + icon, where all the available widgets are displayed. Clicking on the corresponding widget will add it to the overview for reading and interaction.
This hive chart segments all device business processes according to their current monitoring status. Each hexagon corresponds to a specific process, and its color indicates the current availability status.
In addition, the legend makes it easy to identify the meaning of each color and to see the total number of processes grouped in each state.
Hovering the cursor over a specific hexagon displays a detailed view related to the operational status of the business process and the monitoring checks performed on it. For more information, see here.
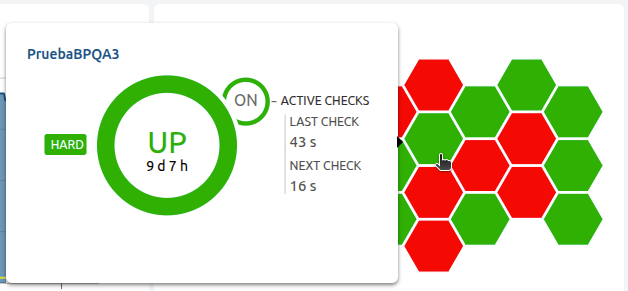
Finally, clicking on this pop-up window will redirect the user to their Detailed view of Hosts and Business Processes, with new detailed information about the specific business process.
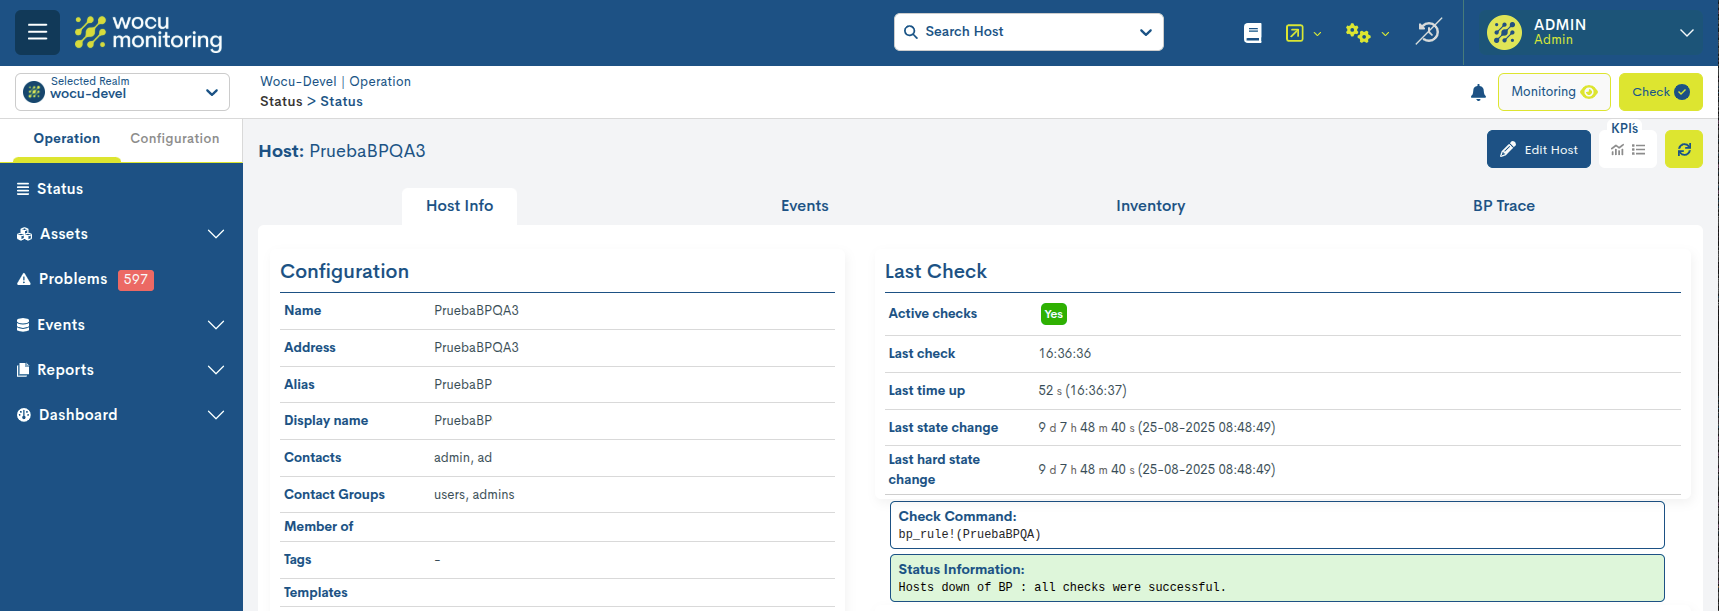
Services Business Process by State
Note
This panel is not displayed by default. To view it, you must use the Edition Mode option and select the + icon, where all the available widgets are displayed. Clicking on the corresponding widget will add it to the overview for reading and interaction.
This honeycomb chart segments all business processes for services according to their current monitoring status. Each hexagon corresponds to a specific process, and its color indicates the availability status recorded at that moment.
In addition, the legend makes it easy to identify the meaning of each color and to see the total number of processes grouped in each state.
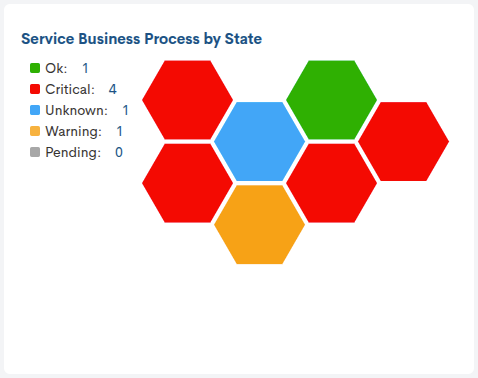
Placing the cursor over a specific hexagon displays a detailed view related to the operational status of the business process and the monitoring checks performed on it. More information: here.
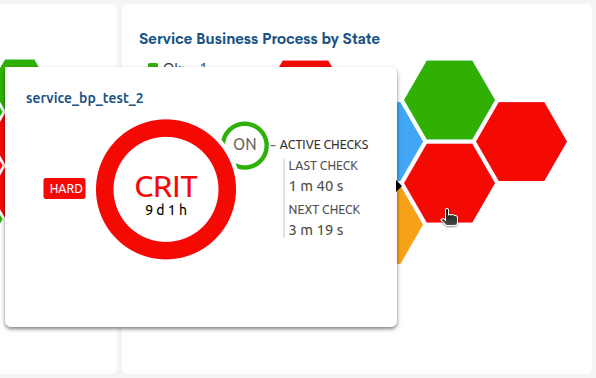
Finally, clicking on this pop-up window will redirect the user to their Detail view of Services and Business Processes, with new detailed information about the specific business process.
New Text
Note
This panel is not displayed by default. To view it, you must use the Edition Mode option and select the + icon, where all the available widgets are displayed. Clicking on the corresponding widget will add it to the overview for reading and interaction.
With the New Text widget, users can insert blocks of text without predefined formatting restrictions. This component allows you to supplement existing visual information with annotations, operational descriptions, or contextual references, thereby enhancing the content within the dashboard.
In the configuration window, you can define a title (Widget Title) and a body of text (Text), as well as the font size (Font Size) for both elements.
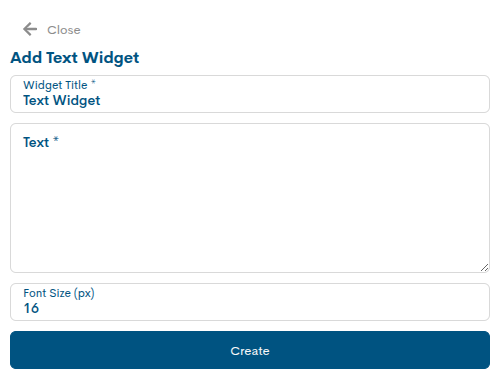
The ability to add free text provides an additional level of customization, facilitating the interpretation of metrics, the communication of incidents, and the incorporation of specific instructions directly in the Status view.
New Url
Note
This panel is not displayed by default. To view it, you must use the Edition Mode option and select the + icon, where all the available widgets are displayed. Clicking on the corresponding widget will add it to the overview for reading and interaction.
The New Link widget allows you to add shortcuts to resourcesboth within the application (detailed views of specific assets,event listings, reports, audit module, etc.) and external resources,integrating them into the Status view.
The user can define a title and a destination URL, with theoption to embed content in embedded format.
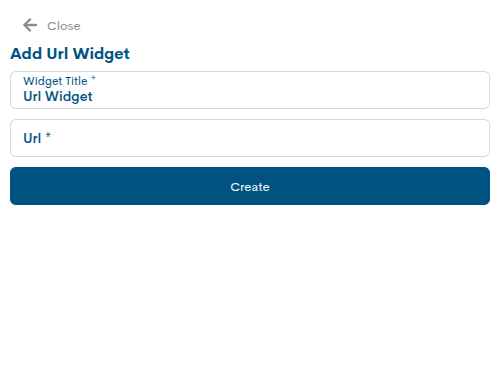
Its function is to centralize navigation to relevant links belonging to WOCU-Monitoring, as well as to facilitate the integration of third-party content without leaving the WOCU-Monitoring environment.
Single Metrics Graph
Note
This panel is not displayed by default. To view it, you must use the Edition Mode option and select the + icon, where all the available widgets are displayed. Clicking on the corresponding widget will add it to the overview for reading and interaction.
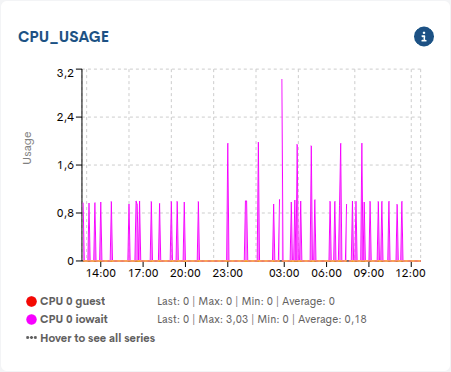
It graphically and in detail represents the temporal evolution of a specific metric, whose performance values have been collected during checks performed on a monitored device.
This type of widget allows you to analyze the historical behavior of a specific metric within a given time interval, facilitating the detection of trends, anomalies, or degradation of the service.
The graph displays data collected over specific time periods, in addition to indicating defined thresholds for Warning and Critical states (amongothers), among other things, facilitating the identification of deviations from expected values.
The fields to configure are the following:
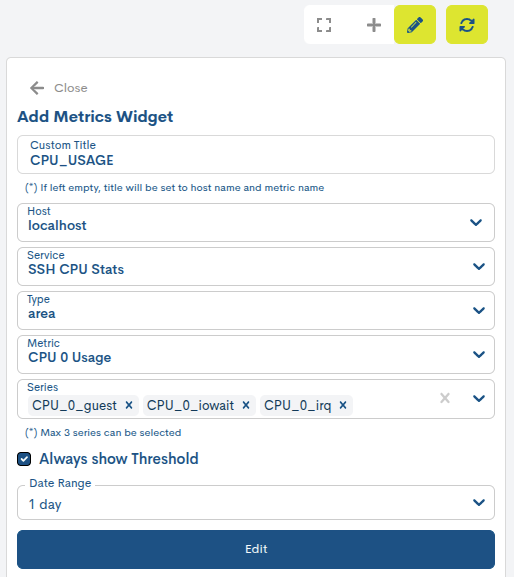
Custom Title: Text field where you define the name that will appear as the widget header.
Host: browser of the device from which you want to view the metrics. You must enter at least three characters to start the search.
Services Selector: List of all monitoring services associated with the selected device. Choose the service that contains the desired metric.
Selector Type: selector of the type of graphic representation, allowing you to choose between Line (lines) or Area (areas).
Metric Selector: for selecting the metric you want to display, for example: RTA (Round-Trip Average) or PL (Packet Loss).
Series Selector: Allows you to choose which data series within the metric (previously selected) you want to display. There is a limit of three series per graph.
Always show threshold checkbox: By checking this option, the line corresponding to the configured threshold for that metric will be displayed on the graph, allowing you to visually identify when the defined values are exceeded.
Date range: Selector of the time range over which the collected metric values will be displayed (4 hours, last day, last week, last month, and a custom period).
Once all fields are completed, the widget can be created and added to the dashboard for viewing and ongoing analysis.
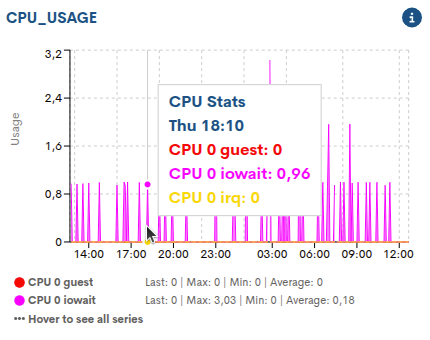
Specific data points from the series can also be viewed. By placing the cursor over any point on the graph, detailed information about the value and the specific moment of the measurement will be displayed.
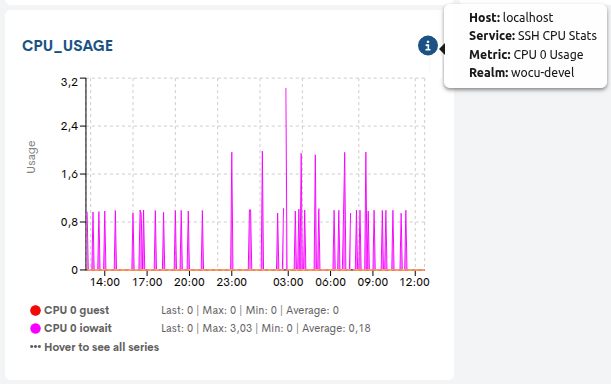
Finally, there’s the widget’s contextual information button (i),where a quick summary of the widget’s origin is displayed: host, service, metric, and realm.
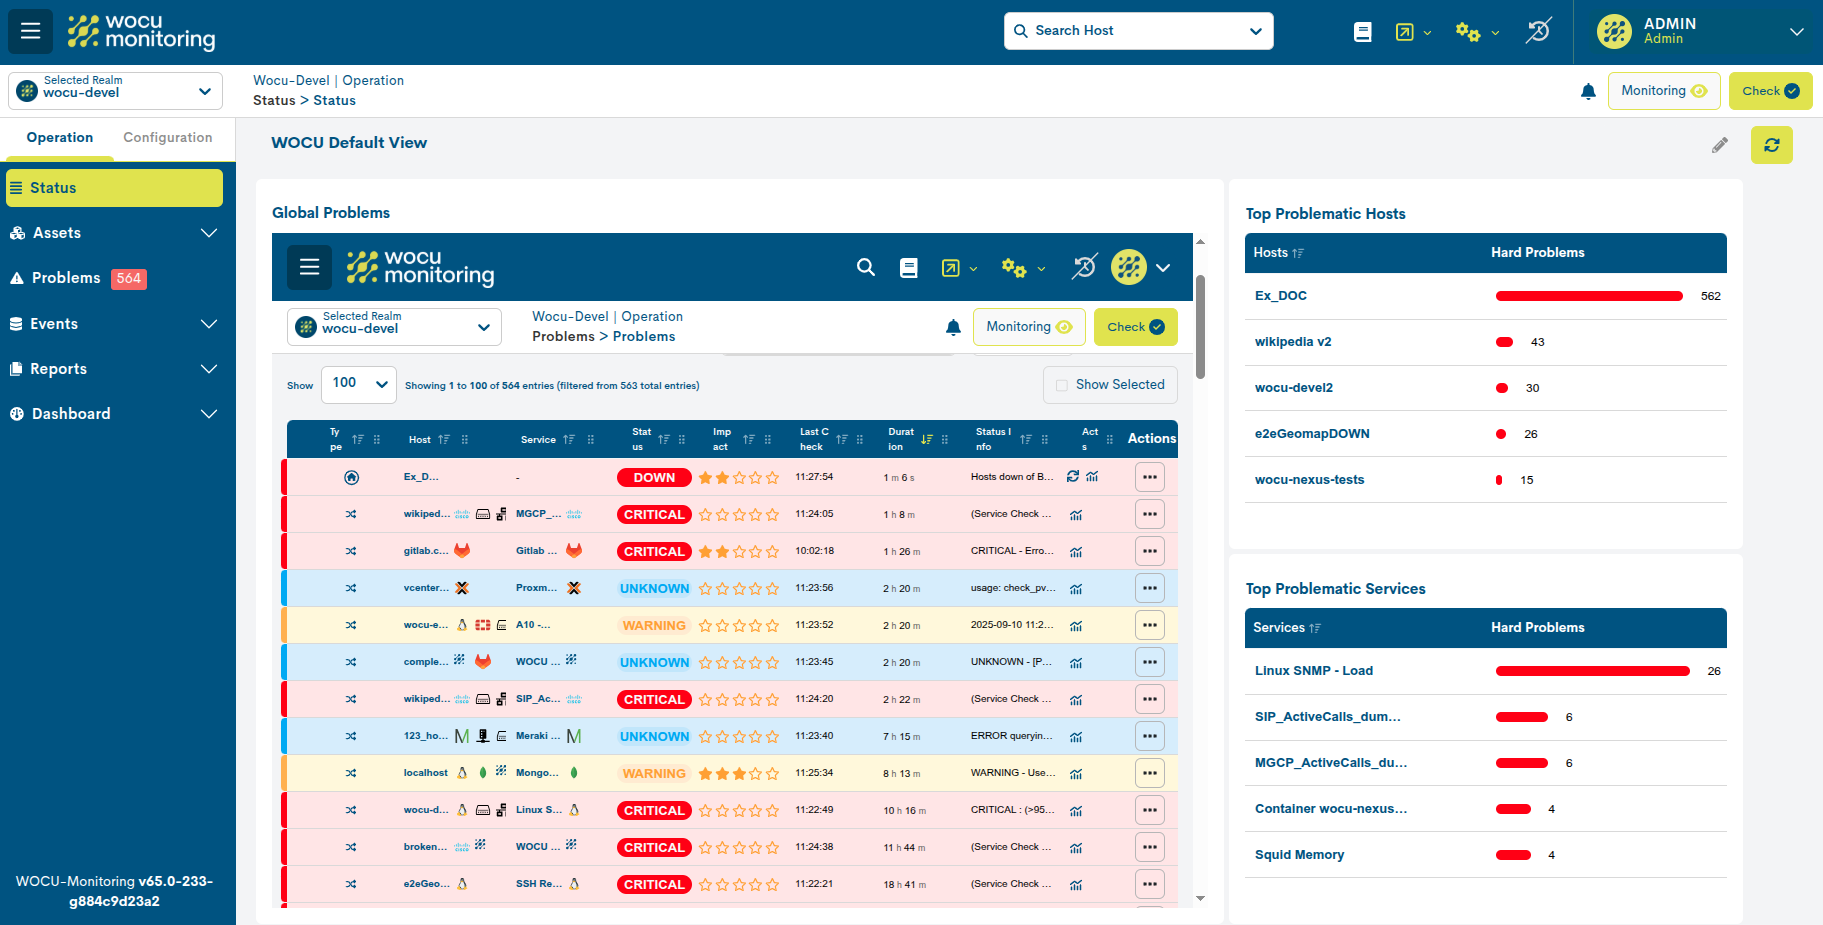
Problems
Note
This panel is not displayed by default. To view it, you must use the Edition Mode option and select the + icon, where all the available widgets are displayed. Clicking on the corresponding widget will add it to the overview for reading and interaction.
This widget allows you to adapt the Problems view to a widget format, with the particularity of preconfiguring the table according to a wide set of options and parameters, which facilitates building a custom view tailored to the required operational scenario.
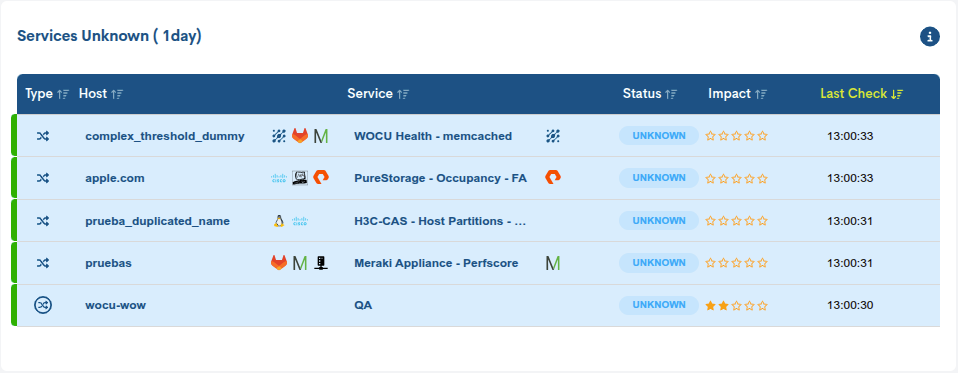
The fields to configure are the following:
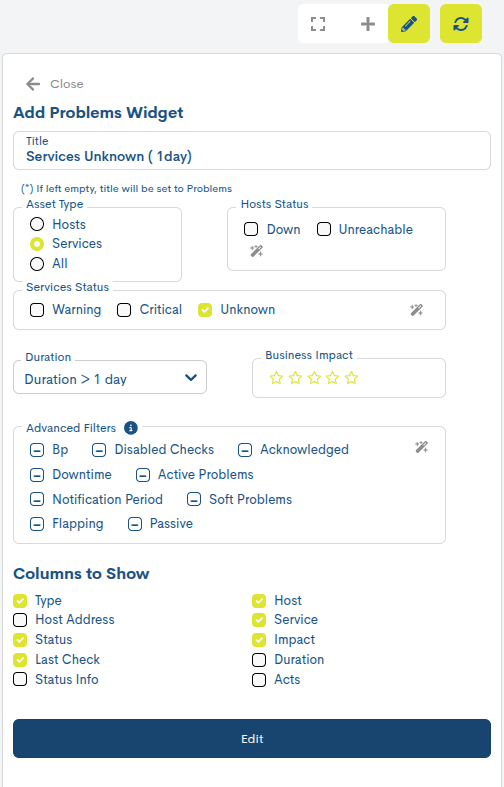
Title: Text field where you define the name that will appear as the widget header. If left empty, the system will automatically assign the title Problems.
Asset Type: Allows you to select which type of asset will be displayed.the problems:
Hosts: only incidents associated with devices.
Services: only incidents associated with monitored services.
All: includes both hosts and services.
Host Status: filters problems according to the monitoring status of the device. One or more statuses can be selected simultaneously:
Down: The host is down.
Unreachable: The host is not accessible from the monitoring system.
Service Status: Filters problems based on the service monitoring status. One or more statuses can be selected simultaneously:
Warning: warning status.
Critical: critical state.
Unknown: unknown status (e.g., check failure).
Duration: defines the minimum time the incident must be active for it to be displayed. This is useful for prioritizing persistent incidents over recent events.
Business Impact: Allows you to filter problems according to their impact. Only incidents from devices whose degree of criticality or impact is equal to or greater than the selected value will be displayed.
Advanced filters: opciones adicionales para refinar el listado de incidencias:
BP: Issues related to Business Processes. More informationabout asset representation and identification in Type (ℹ).
Disabled Checks: filtering of assets where the user has suspended the active monitoring tasks that the system is performing, i.e., the Disable active checks for services has been applied.
Acknowledged: filtering of alarms that have been acknowledged, i.e., in which the user has applied the action Apply acknowledged to service for that Asset.
Downtime: filtering of alarms that are in downtime or maintenance time, i.e., those in which the user has applied the action Schedule downtime to service.
Active Problems: Filtering of currently active alarms. Incidents where the user has not yet taken any action or treatment will be filtered out.
In Notification Period: Filtering alarms with a configured notification period. The list will only show alarms that are currently within their notification period.
Include softproblems: The main table Host Problems displays by default alarms generated from both types
SOFTandHARD. This filter includes all alarm entries of typeSOFTin the list, and excludes those of typeHARD.Flapping: filtering of alarms associated with devices that experience a rapid alternation of state changes in monitoring, known as Flapping.
Passive: filtering of alarms associated with passive services (originating from passive monitoring, via SNMP Traps).
These filters allow the widget to be adapted to very specific operational needs, thanks to the concatenation of filters, offering different combinations to the operator for the direct visualization of data of interest.
Likewise, the user can define the visible columns, adjusting the level of detail to their analysis needs, through the Column to Show option.
Type: type of asset (host or service).
Host Address: IP address or host identifier.
Status: current state of the problem.
Last Check: date and time of the last check.
Status Info: Detailed status message.
Acts: Available actions.
Host: host name.
Service: name of the service.
Impact: business impact.
Duration: the length of time the problem has been active.
Only the selected columns will be displayed, allowing for a cleaner and more focused view.
Geomap
Note
This panel is not displayed by default. To view it, you must use the Edition Mode option and select the + icon, where all the available widgets are displayed. Clicking on the corresponding widget will add it to the overview for reading and interaction.
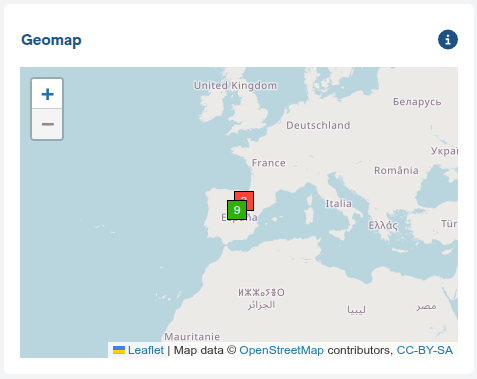
The Geomap widget allows you to create custom geographic maps for device viewing.
Using this widget, you can view specific groups of devices, display devices associated with certain monitoring packages, and filter them according to their availability status.
The fields required for its configuration are described below:
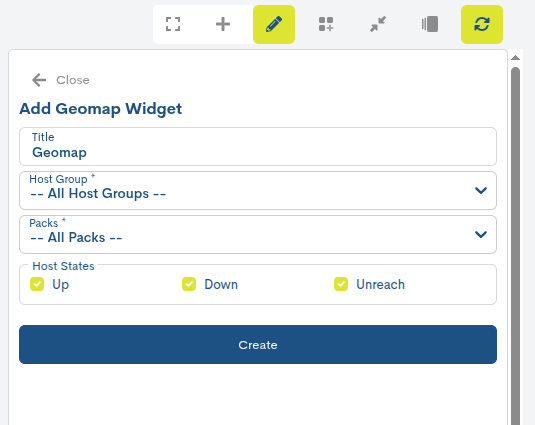
Title: Identifying name of the widget. This title will be displayed in the widget’s header within the view.
Host Group: Allows you to select one or more groups of devices that you want to display on the map. If no specific group is selected, all available groups will be included.
Packs: Allows you to filter devices based on their associated monitoring packages. This option is useful for displaying only devices with a specific type of monitoring.
Host States: Allows you to filter devices according to their availability status. The available options are:
Up: operating devices.
Down: Devices are unavailable or malfunctioning.
Unreach: inaccessible or non-communicative devices.
Once the fields are configured, you must press the Create button to add the widget to the view.