Release Notes 67
Publication Date: 26/01/2026
This document provides a detailed summary of the new features, functionalities, improvements, and fixes included in version 67 of WOCU-Monitoring. With this update, we address the requests and suggestions of our users, while also aligning with current market trends and needs.
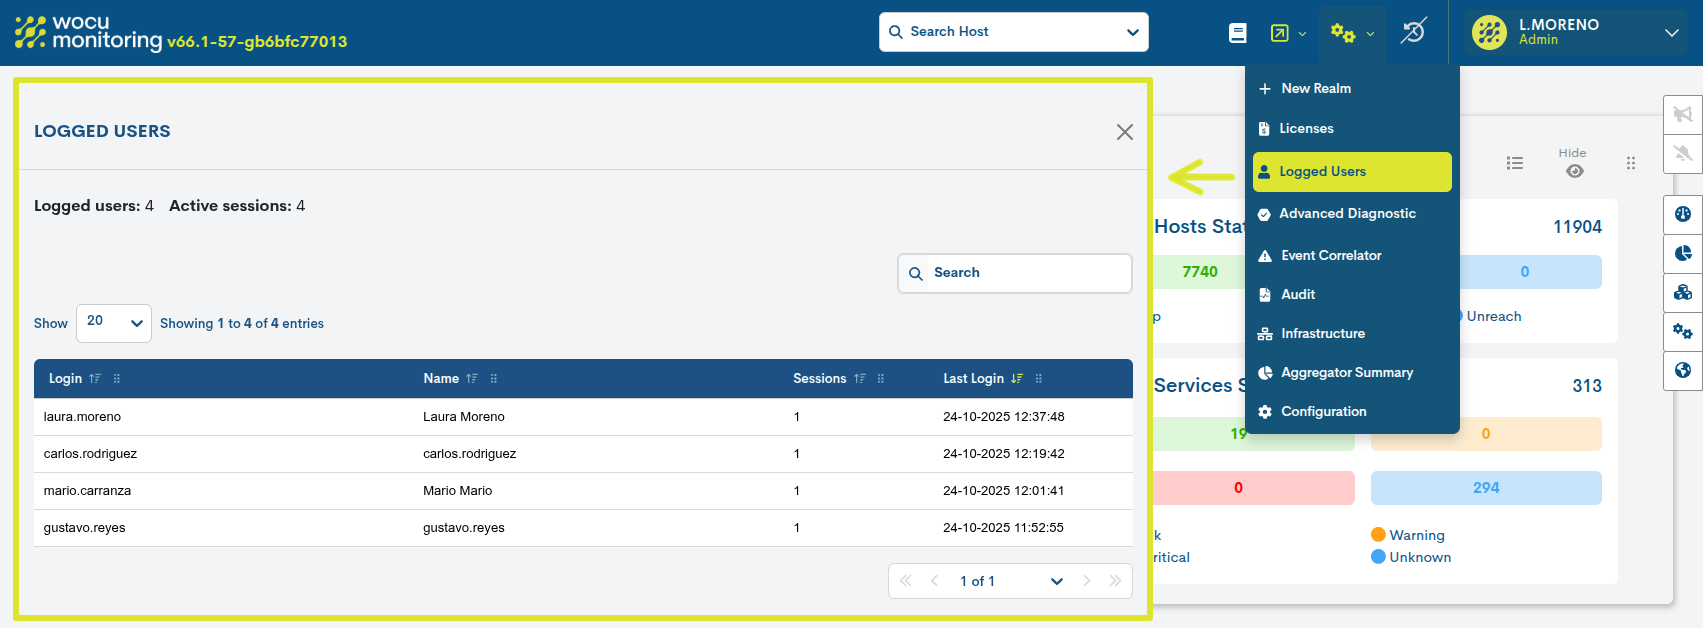
1. New view Logged Users
A new view called Logged Users, has been added, accessible only to Administrators, where it is possible to view in real time the complete list of users with active sessions in WOCU-Monitoring.
Its purpose is to provide a clear and centralized view of the concurrent use of the application, enabling:
Verifying the current status of user sessions.
Control of simultaneous sessions associated with the same account.
The registration and consultation of access times and effective use of the application.
2. New option to show/hide the filter block
With the aim of improving the user experience and offering a cleaner, more focused interface, a new button has been added that allows you to show or hide the filter block in the most frequently used views of the application. This improvement facilitates the complete viewing of the main table, allowing you to focus solely on the most relevant operational information.
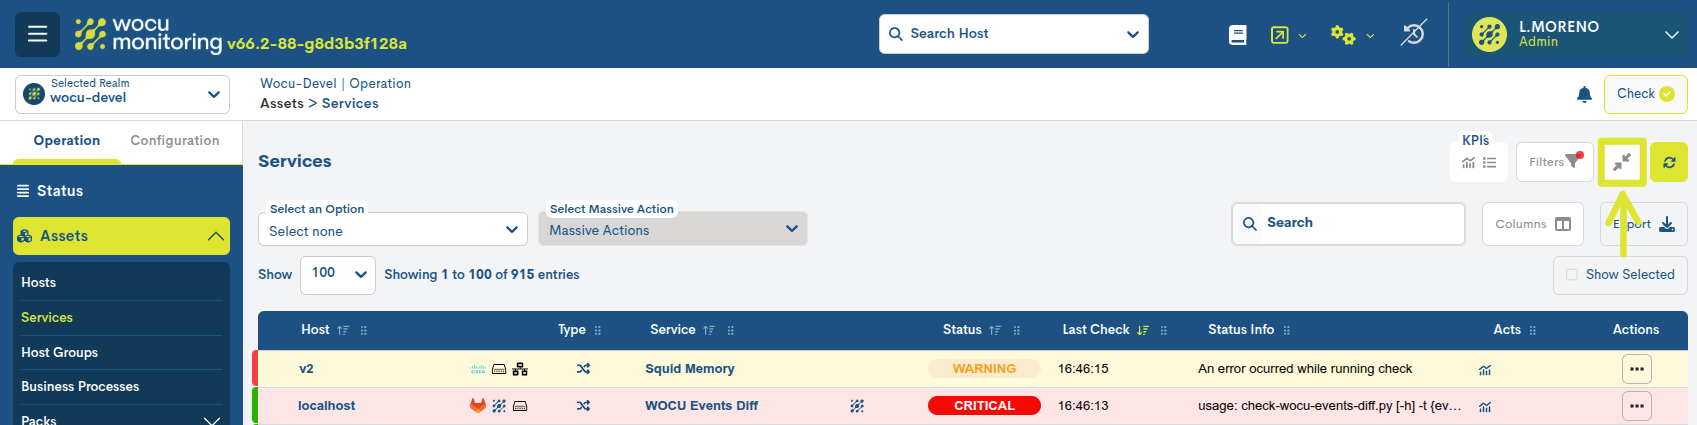
This functionality is available in the following views:
By enabling this option, the system hides the top panel that contains the filters, leaving only the main table visible. Simultaneously, a fixed side button is enabled that allows you to reactivate the hidden panel at any time, ensuring quick and flexible access to the filtering options.
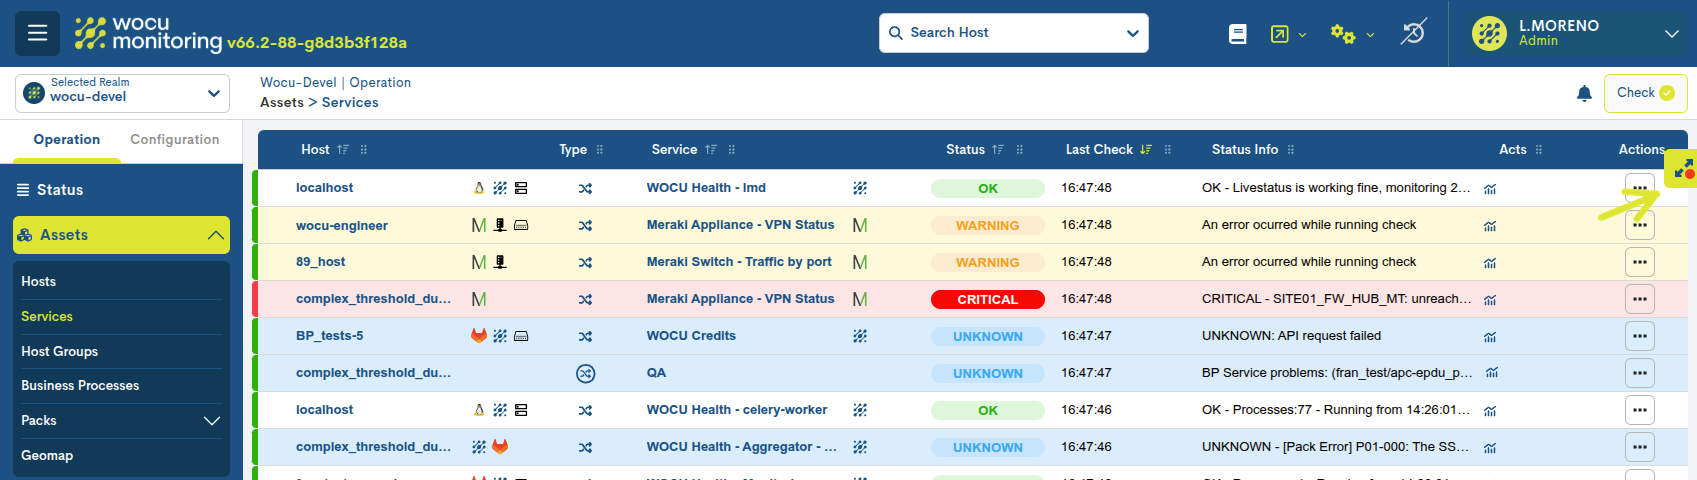
This improvement offers a more efficient browsing experience, especially in views with large volumes of data, and helps to optimize the use of screen space.
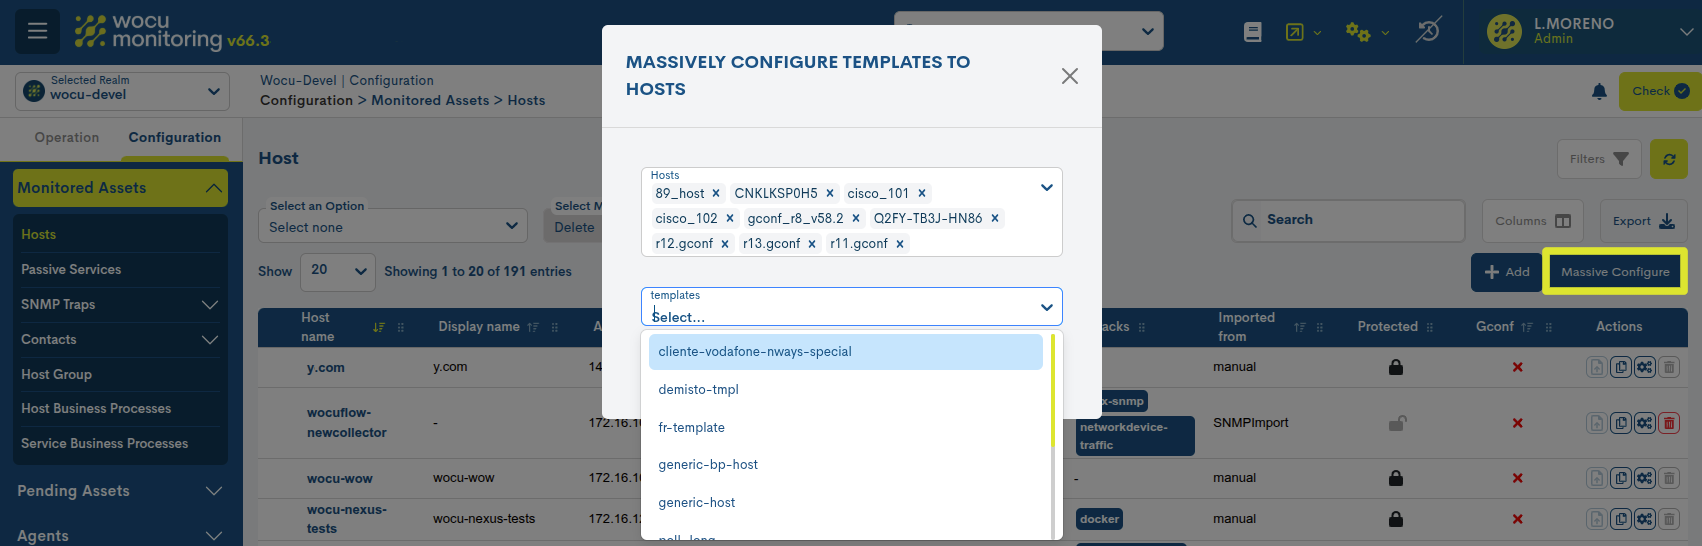
3. Bulk Configuration of Templates in Monitored Assets
In the view Monitored Assets > Hosts, the new functionality of massive configuration of Templates is incorporated, which allows assigning or removing templates simultaneously on multiple devices, without needing to modify each element individually.
A Template is a configuration model that groups macros, checking commands, and predefined parameters for application on devices. Its use facilitates the standardization of configurations on devices with similar characteristics.
Therefore, this improvement streamlines and ensures a consistent configurationacross a large number of monitored assets, especially useful inenvironments with extensive infrastructures.
Using this feature is simple and intuitive: simply select the desired devices and apply or remove the corresponding templates from the following form:
4. Customizing the format of dates and numeric values
The new Selector del formato fecha y número (Date and number format) has been added to User preferences. This functionality is designed to adapt the display of information to the most common regional conventions internationally.
Each available format combines a predefined date and number style, facilitating consistent and standardized reading across all WOCU-Monitoring modules.
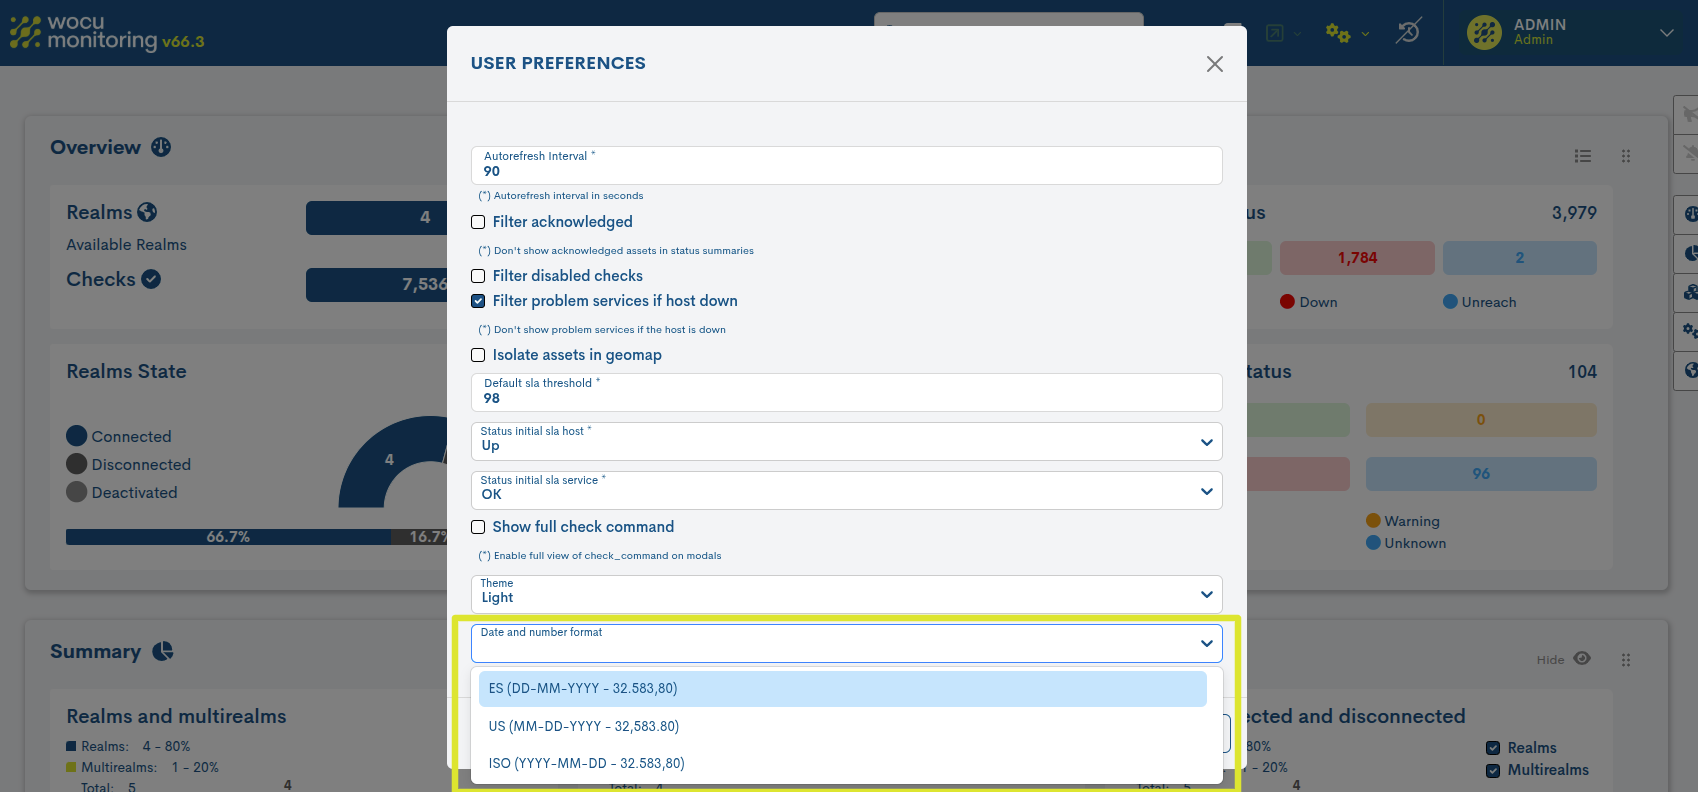
The possible options are:
ES (DD-MM-YYYY / 32,583,80): Commonly used in Spain and most European countries. most European countries.
US (MM-DD-YYYY / 32,583.80): Standard in the United States and English-speaking countries.
ISO (YYYY-MM-DD / 32,583.80): Recommended for systems requiring reliable chronological ordering.
Once the desired format is selected, the changes will be applied immediately throughout the application after saving the configuration in the user preferences, automatically updating listings, panels, reports, graphs, and any element that displays dates or numerical values.
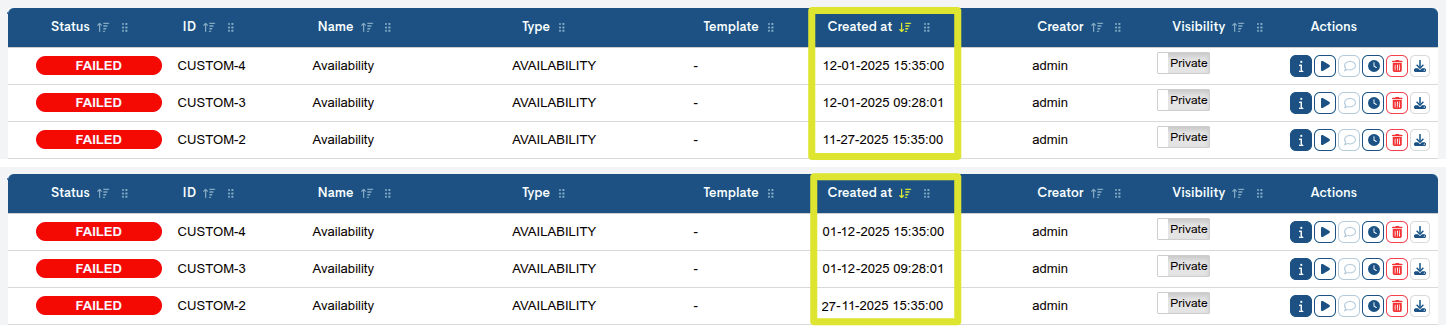
Created at field in US and ES formats.
This new functionality expands WOCU’s customization options—Monitoring and contributes to a clearer and more standardized presentation of the data.
5. Configuring timeouts (Delay) in fall notifications
Two new configuration parameters have been included in the creation and editing of a Notification Way, designed to improve control and accuracy in sending notifications within WOCU Monitoring.
Host Down Notification Delay: To define a waiting time (expressed in minutes) before sending a notification when a host registers a DOWN monitoring state. This prevents premature notifications of momentary outages or false alarms.
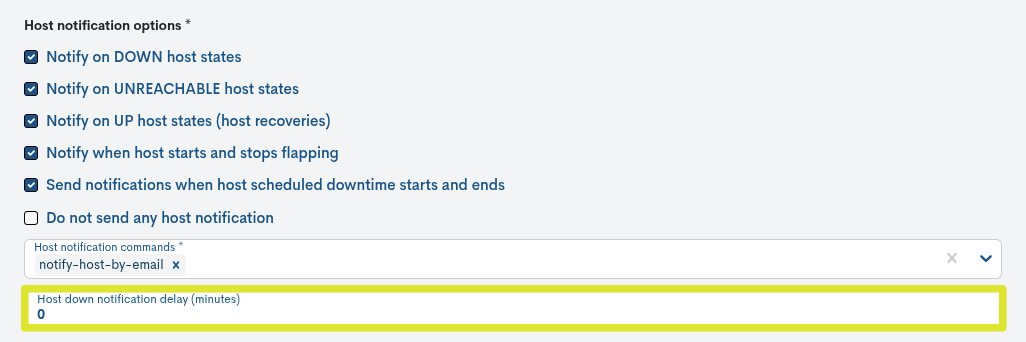
Services Critical Notification Delay: defines a delay before sending notifications about services that change to a critical monitoring state. It is especially useful in environments where certain services may experience brief fluctuations that do not require immediate notification.
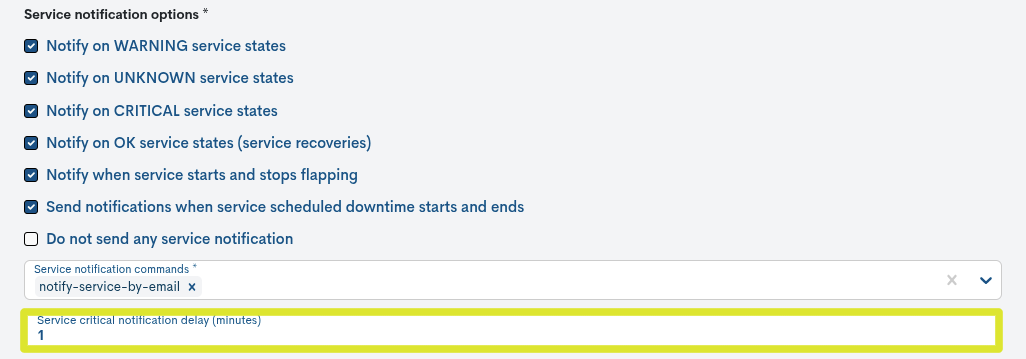
Taken together, these parameters allow us to reduce the noise of alerts caused by transient events, as well as facilitate the creation of notification strategies that are more consistent with operational needs.
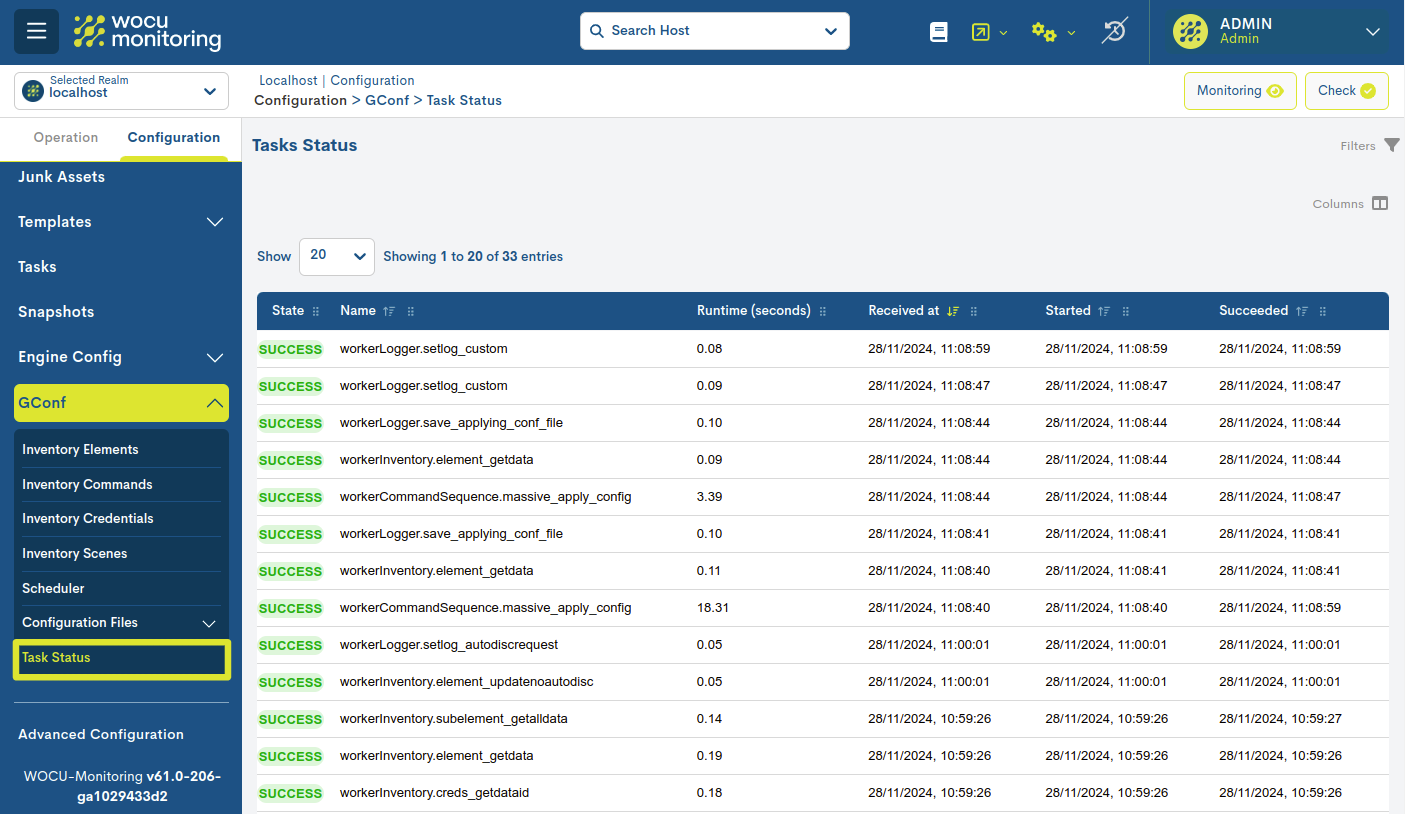
6. Refactoring the Task Status view in Gconf
Optimizing the loading of the Task Status view
The backend logic of the Task status view has been redesigned to drastically reduce load times for this view, especially when handling bulk tasks.
The response time of the view no longer depends on the total number of existing tasks, but solely on the number of visible records in the table. This limits the load to the configured pagination (e.g., 20, 50, or 100 rows), ensuring predictable and scalable behavior even with a high volume of tasks.
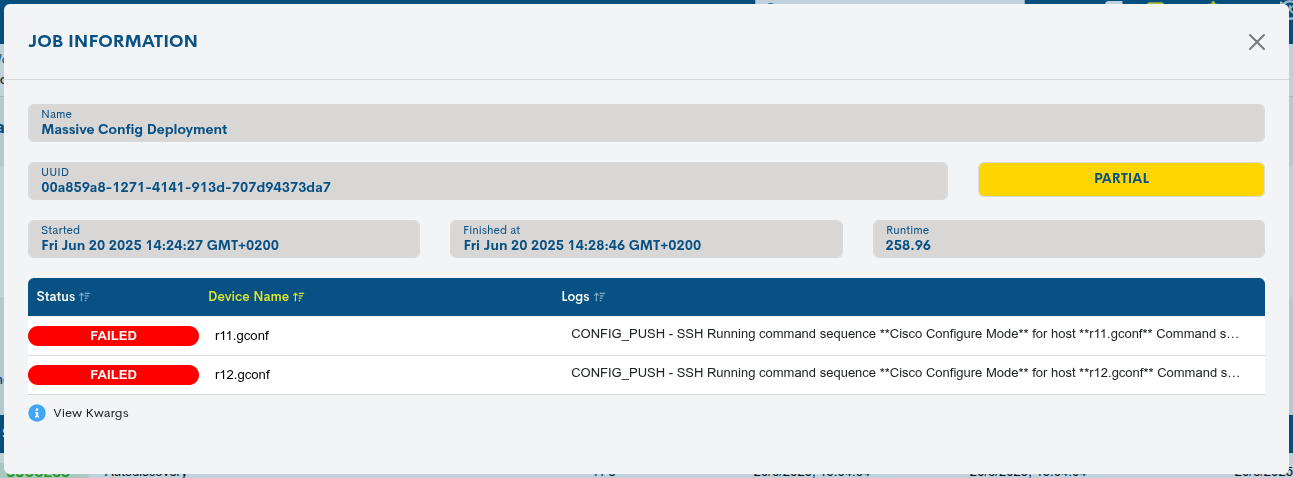
Optimizing the Job Information view
The results table of the Vista Job Information also showed long load times in runs with many devices.
Therefore, the same optimization approach has been applied to improve its performance: pagination implemented in the backend to alleviate computing load and achieve a progressive recovery of the results.
Associated functional and visual changes
As a result of the refactoring and to improve the clarity of the information presented, the following changes have been introduced:
The + icon that allowed you to expand subtasks has been removed. Now, each subtask is displayed as a separate entry in the table.
New summary graph in the Vista Job Information: which provides a visual summary of the overall execution result. The graph shows the number and percentage of devices in OK and KO status, plus the total number of devices processed.
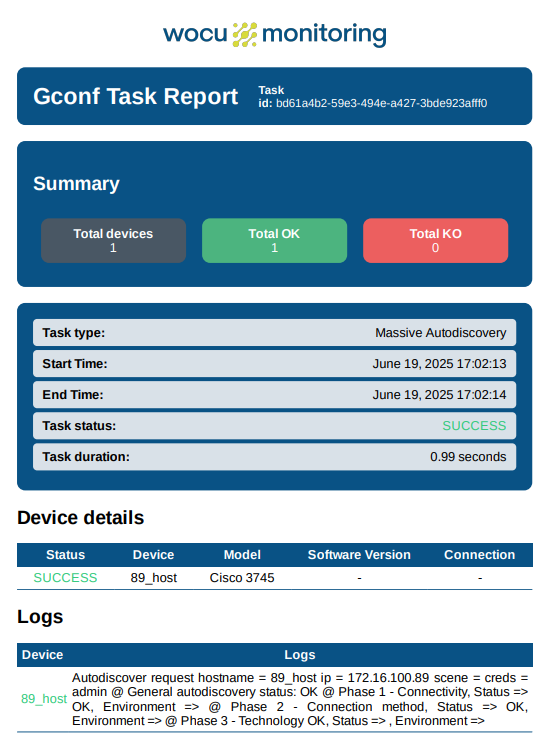
Refactoring of the downloadable PDF report: with the aim of significantly reducing generation time. In addition, the design has been unified with a clearer presentation, homogeneous and aligned with the rest of the application’s reports.
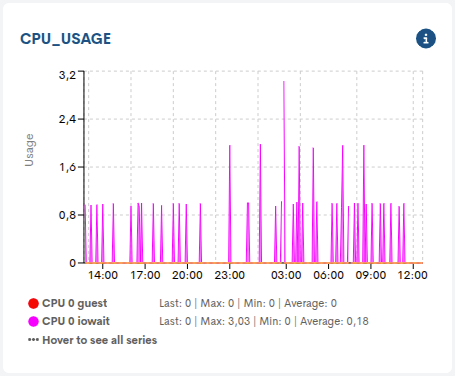
7. New widgets in the Status view: Metrics graph and Issues
In this version, we have continued working on the evolution of the Status view, incorporating two new configurable widgets. This functional expansion allows you to build highly customizable operational dashboards to adapt the view to the specific monitoring and analysis needs of each user or team. Among other possibilities, these widgets allow you to evaluate the historical behavior of a service through its performance metrics or list the incidents associated with a set of assets.
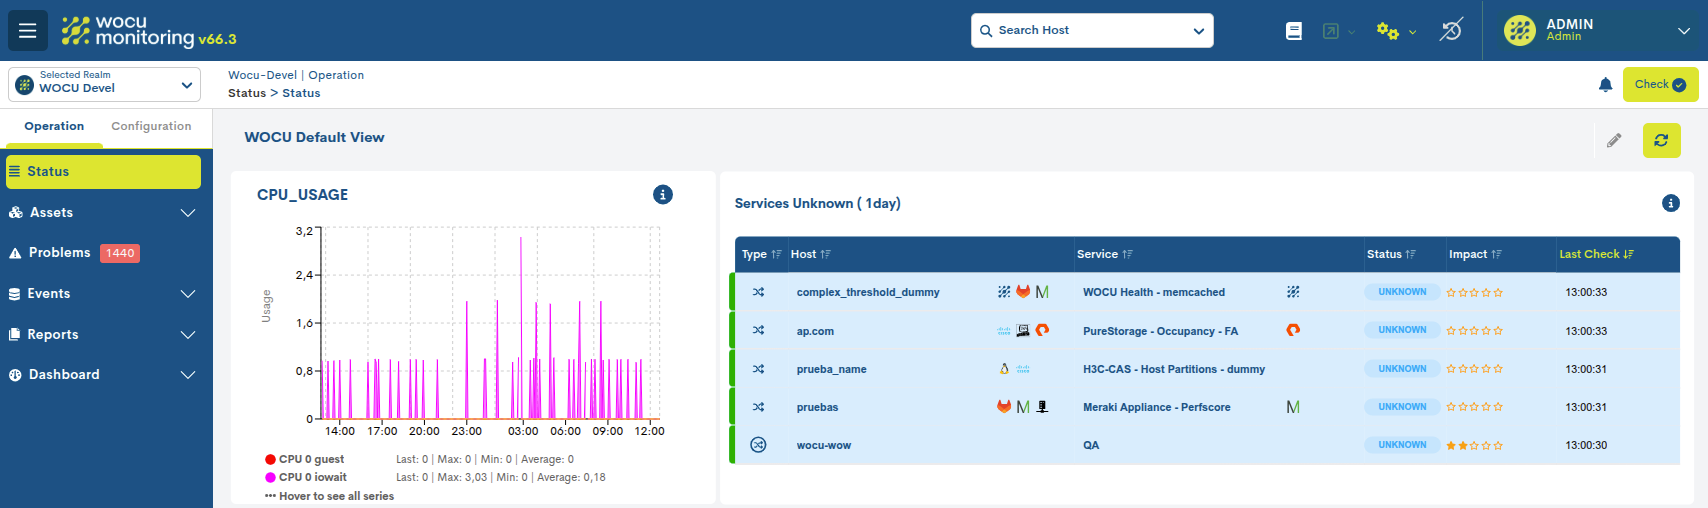
Designed to graphically and in detail represent the temporal evolution of a specific metric, whose performance values have been collected during checks performed on a device.
During its configuration, it will be necessary to select a device, its associated monitoring services, and metrics for its representation in the new widget.
The graph displays data collected over specific time periods, in addition to indicating defined thresholds for Warning and Critical states (among others), facilitating the identification of deviations from expected values.
Specific data points from the series can also be viewed. By placing the cursor over any point on the graph, detailed information about the value and the specific moment of the measurement will be displayed.
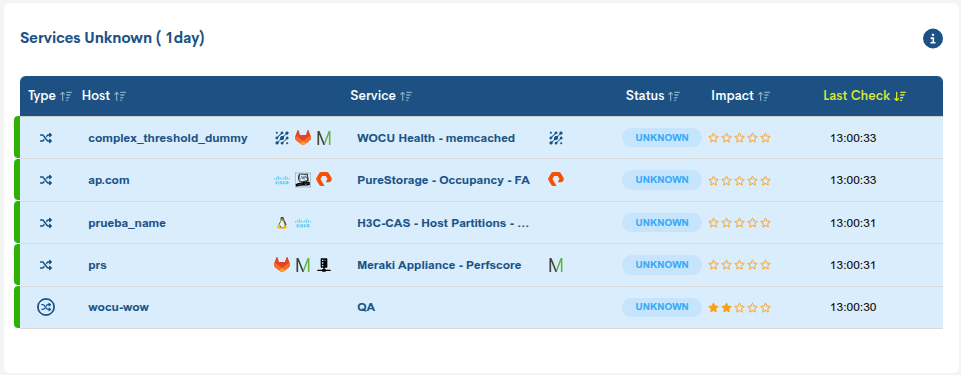
This widget allows you to adapt the Problems view to a widget format, with the particularity of preconfiguring the table according to a wide set of options and parameters, which facilitates building a custom view tailored to the required operational scenario.
Available configuration criteria include: the type of asset (hosts, services, or both), the specific monitoring status to display, the duration of the incident, a specific Business Impact and additional filters to further refine the sample.
Likewise, the user can define the visible columns, adjusting the level of detail to their analysis needs.
Thanks to this level of customization, the Problems widget allows for focusing on specific critical issues.
Other improvements and repairs
Every new version is full of small changes, fixes, and optimizations that are worth briefly highlighting. We’ll now list the most notable ones in this version:
Searches performed using the Search bar are no longer saved between sessions. Filmerging filter management has also been isolated, as previously applied filters were retained across different realms. Starting with this version, each realm maintains its own configuration, ensuring that changes in one do not affect the others.
The dark theme has been applied to Advanced Diagnostic.
Fixed an error that prevented the auto-refresh action from working correctly in the Problems table.
From this version onwards, in the table Problems, the monitoring status indicator (colored vertical bar that appears at the beginning of each row in the table) refers exclusively to the availability of Hosts and Host Business Process.
In this version, the functionality of Custom Tags has been improved, now allowing the creation and assignment of tags that include special characters. This improvement expands the system’s flexibility, facilitating a more precise and customized description of monitored objects, and thus optimizing their organization and search within WOCU-Monitoring.
During the scheduling of a report specifically in the Presets parameter, the Last week option has been updated so that the week starts on Monday, instead of Sunday as in previous versions.
The search experience in tables has been improved. Previously, when applying Filtros avanzados (Advanced Filters), the search function was disabled, limiting data retrieval. Starting with this version, the search function remains operational even with these filters active, maintaining all available features.
An error that prevented changes made when editing widgets in the Status view from being saved has been fixed.
Email notifications generated in ‘scheduled reports’ have been updated. These emails now incorporate the updated WOCU-Monitoring theme and logo, providing a more consistent and uniform appearance with the rest of the application.
During the Creating New Reports (+ Add), the Templates and Covers selectors, now display all available items, instead of being limited to the first 100 as before.
Fixed a bug that blocked editing of a modal/form when a notification was generated in the application. Now the notification is received correctly, but the table is not updated while the editing is in progress.
An error that prevented changes to the show/hide Columns function from being correctly applied to different tables in the application has been fixed. The function now works consistently again.
The component Show entries is working correctly again, as it was displaying incorrect information about the display of items in inventories.
Routing has been added to cells displaying the names of services or devices. Now, when you click on the name of an asset in the tables while holding down the Ctrl key, the information view will open in a new window.
A layout issue in the audit-view: detail view has been corrected, where the text was extending beyond the allocated area. Now the content is correctly displayed within the view boundaries.
The icons in the BP Trace were modified to remove the background lines connecting the tree, thus improving visual clarity.
Software updated
As always, other pieces of software have been incorporated and updatedin this new version of WOCU-Monitoring:
Software |
Previous version |
Current version |
Observations |
|---|---|---|---|
Redis |
6.2.14 |
7.2.11 |
|
MongoDB |
4.2.22 |
4.4.30 |
https://www.mongodb.com/try/download/community-edition/releases |
About WOCU-Monitoring
WOCU-Monitoring is a multipurpose monitoring tool that integrates the latest Open Source technologies for monitoring, visualization, metric graphing, and log management, providing broad visibility into the status and availability of network elements, servers, databases, and workstations (among others) using custom Monitoring Packs.
In addition to the Free version, the Enterprise version of WOCU-Monitoring allows the deployment of thousands of IP devices in a distributed environment, with customizations tailored to each client’s infrastructure.