Release Notes 66
Publication Date: 13/10/2025
This document provides a detailed summary of the new features, functionalities, improvements, and fixes included in version 66 of WOCU-Monitoring. With this update, we address the requests and suggestions of our users, while also aligning with current market trends and needs.
1. Customizable dashboards in the services-status-evolution view
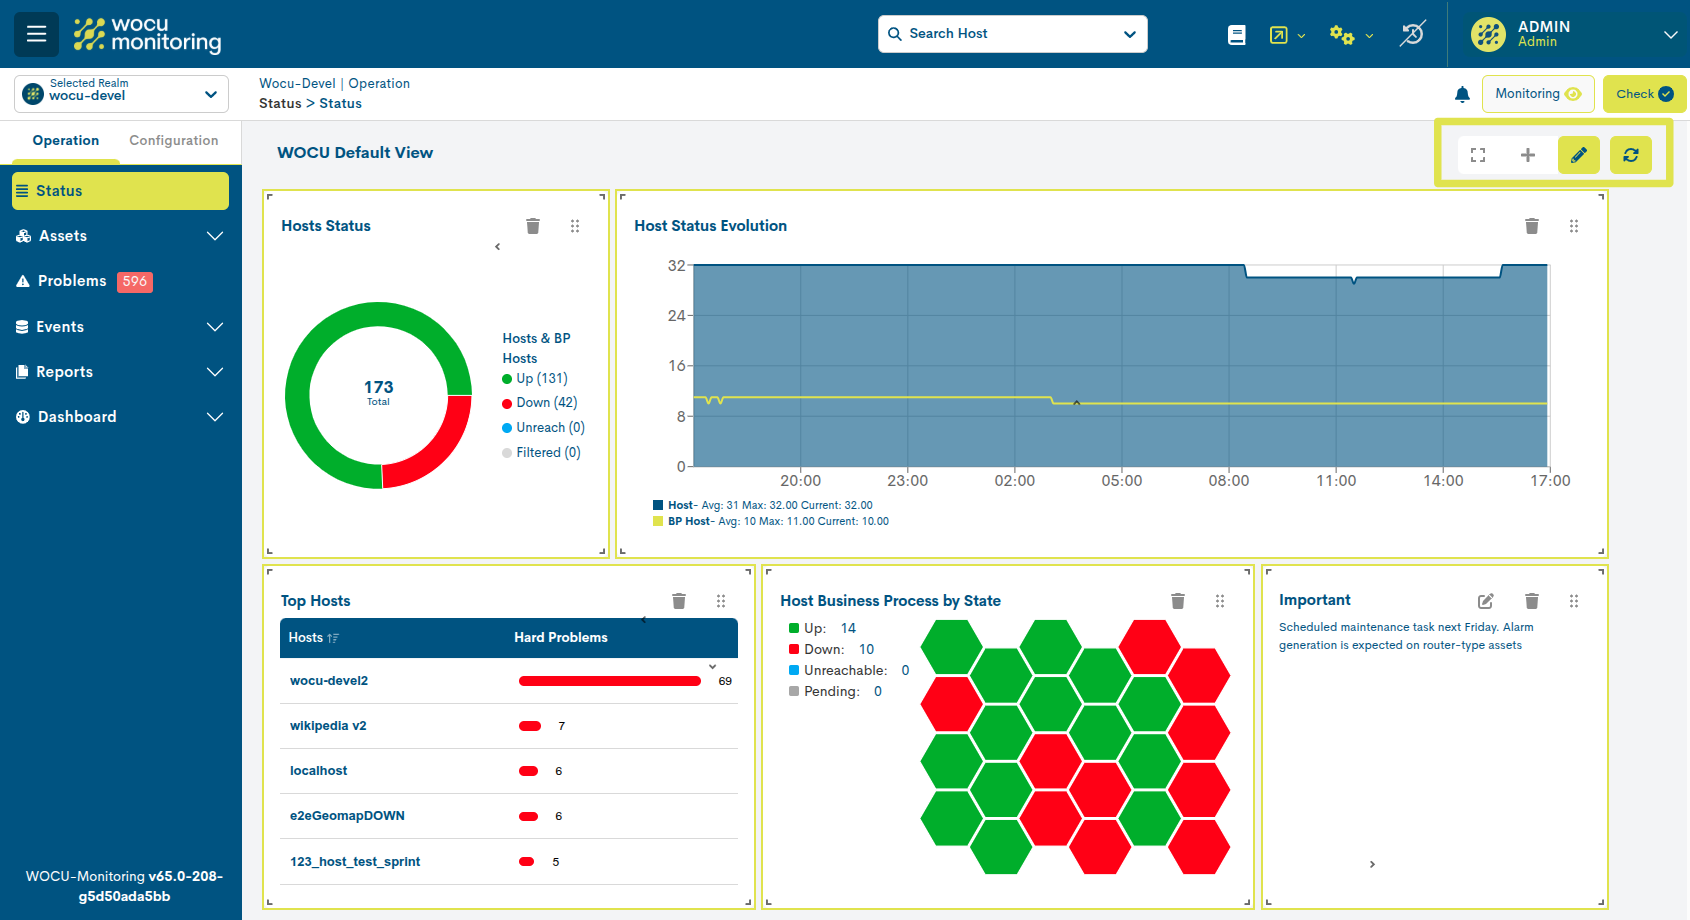
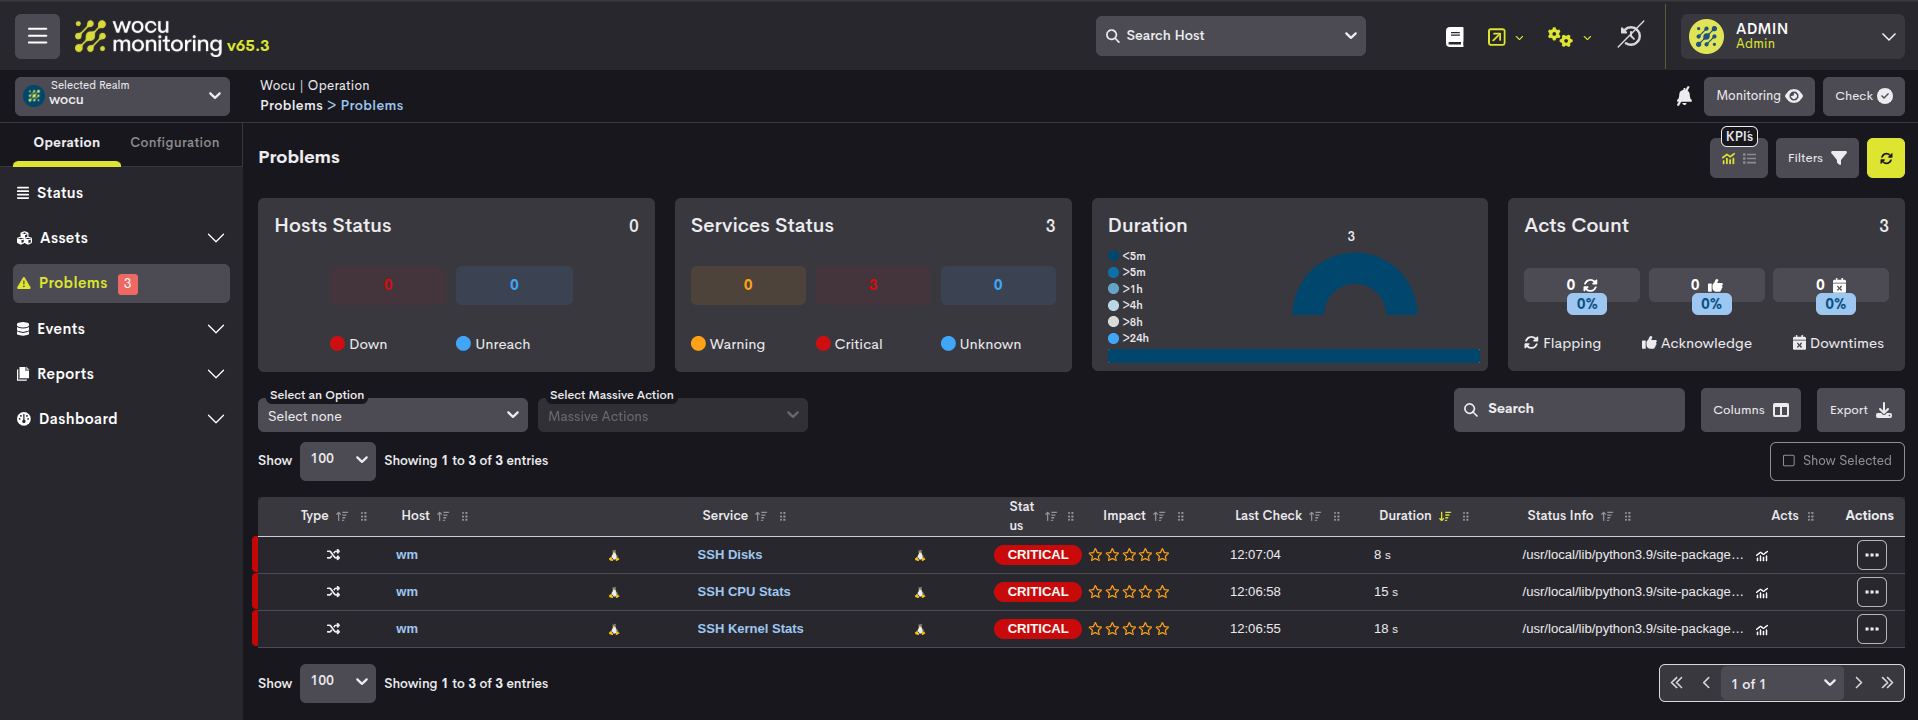
The WOCU-Monitoring Status view now includes a fully customizable dashboard, allowing the information displayed through various widgets to be adapted to each user’s operational needs. This new approach transforms the view into a flexible and dynamic environment, where it is possible to build a personalized view that optimizes workflow and facilitates decision-making in the operation and supervision of the monitored environment.
Main new features
Preconfigured initial layout: The dashboard includes by default a set of Widgets that the user can freely modify according to their priorities and build a customized workspace.
New Edition Mode: When enabled, advanced dashboard management features are enabled. You can add, delete, create, resize, and move widgets, including those configured by default. Additionally, each widget now includes additional controls, and global options are added that significantly expand customization possibilities.
New widgets have been added to enhance the monitoring experience.
Widgets are interactive and display more detailed information or allow for drill-down, making it easier to analyze information and allowing for more fluid navigation between global and specific data.
This new feature, which will continue to evolve in subsequent versions, with new widgets and the ability to configure multiple views, represents a qualitative leap in the monitoring experience with WOCU Monitoring.
2. New custom reports
This version incorporates significant improvements to the Reports Module aimed at increasing the tool’s customization, flexibility, and reach.
Multiple Report Generation
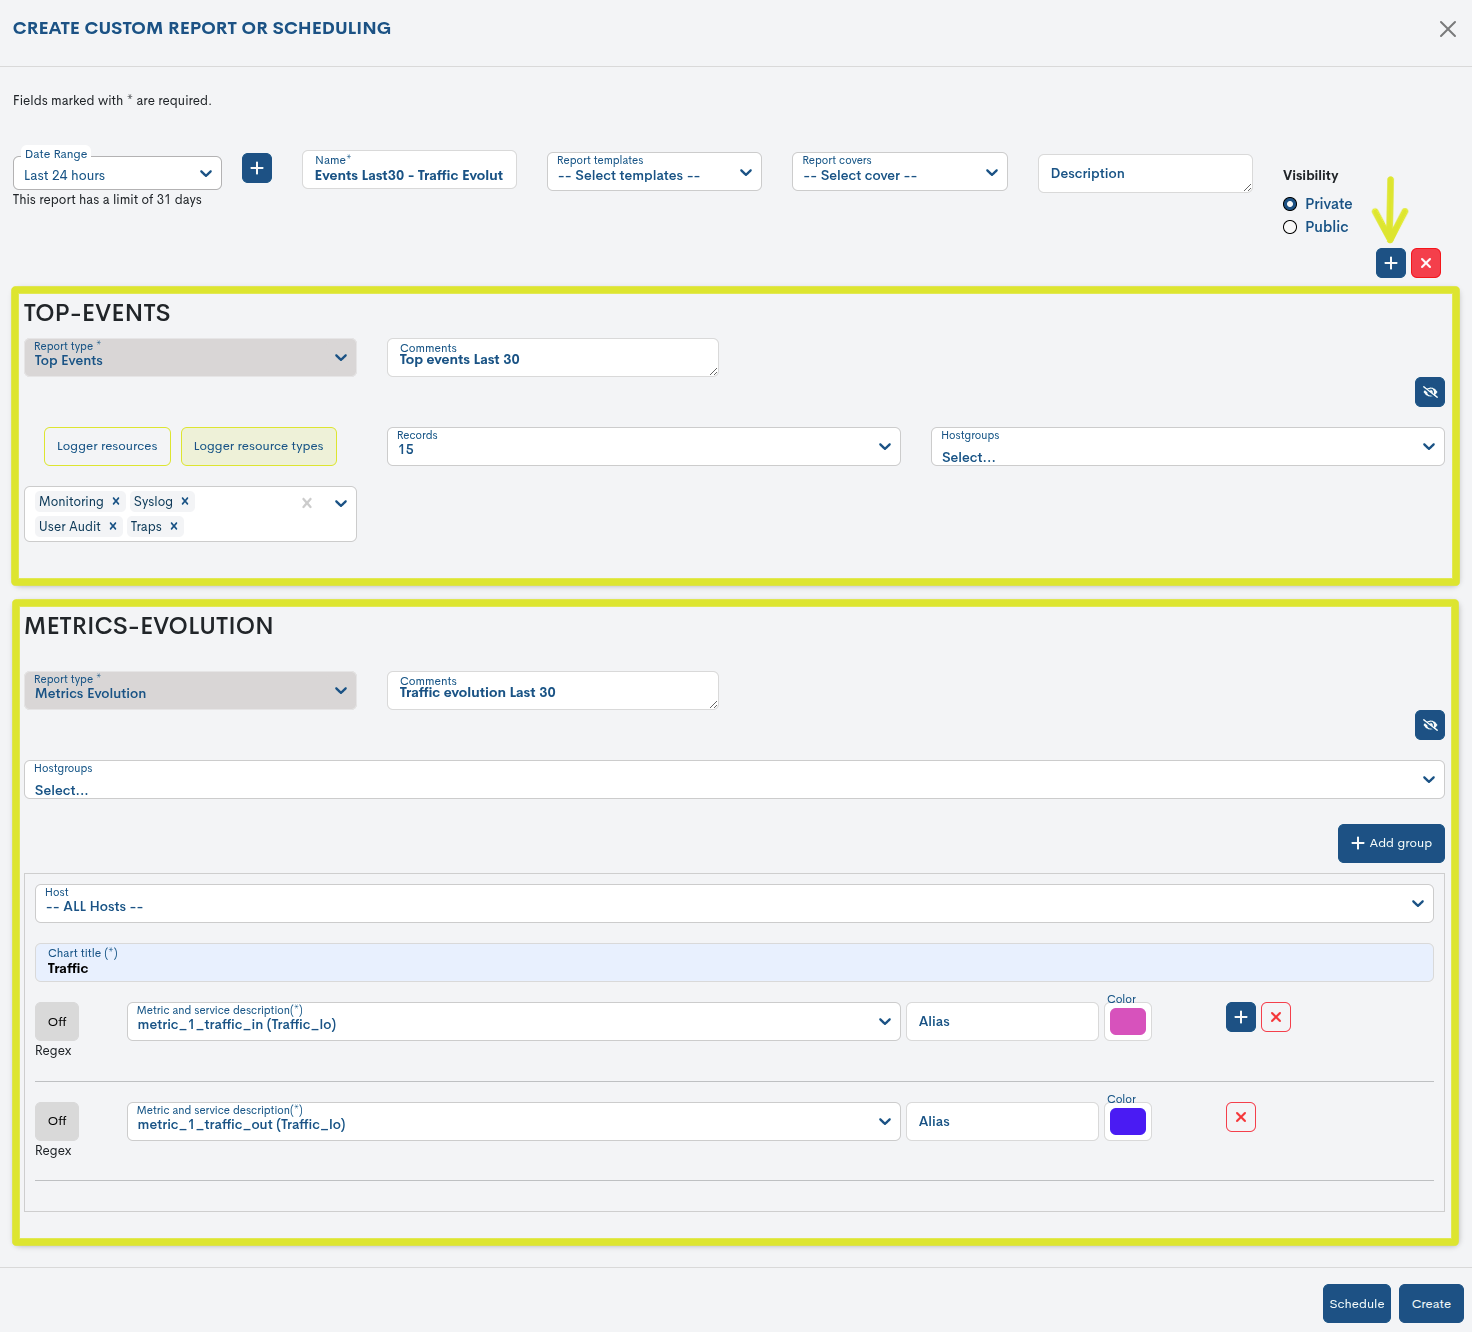
Creating multiple reports in a single operation is now available. Previously, each report had to be configured individually; now it’s possible to define multiple reports of different types from a single configuration form.
The new operation is simple and intuitive: using the + button, you can add additional reports until you have a complete set. The system allows you to combine the seven types of reports available.
Additionally, in the Report Type column of the global tables Reports and Templates, all reports included in multiple configurations are listed, for greater user awareness.
Creating and assigning covers in reports
A new section called Covers has been added, allowing you to further customize PDF reports. With this feature, you can define an image to act as the document’s cover, another image to serve as the header for the various pages within it, a main title, and a footnote.
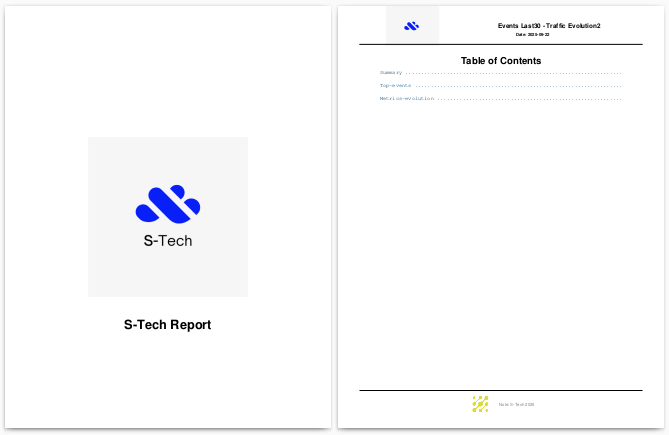
Covers are managed in this new section, and later, during report configuration, the user can select which one they wish to apply. This gives the reports a corporate and professional touch, as each document can be adapted to the organization’s visual identity.
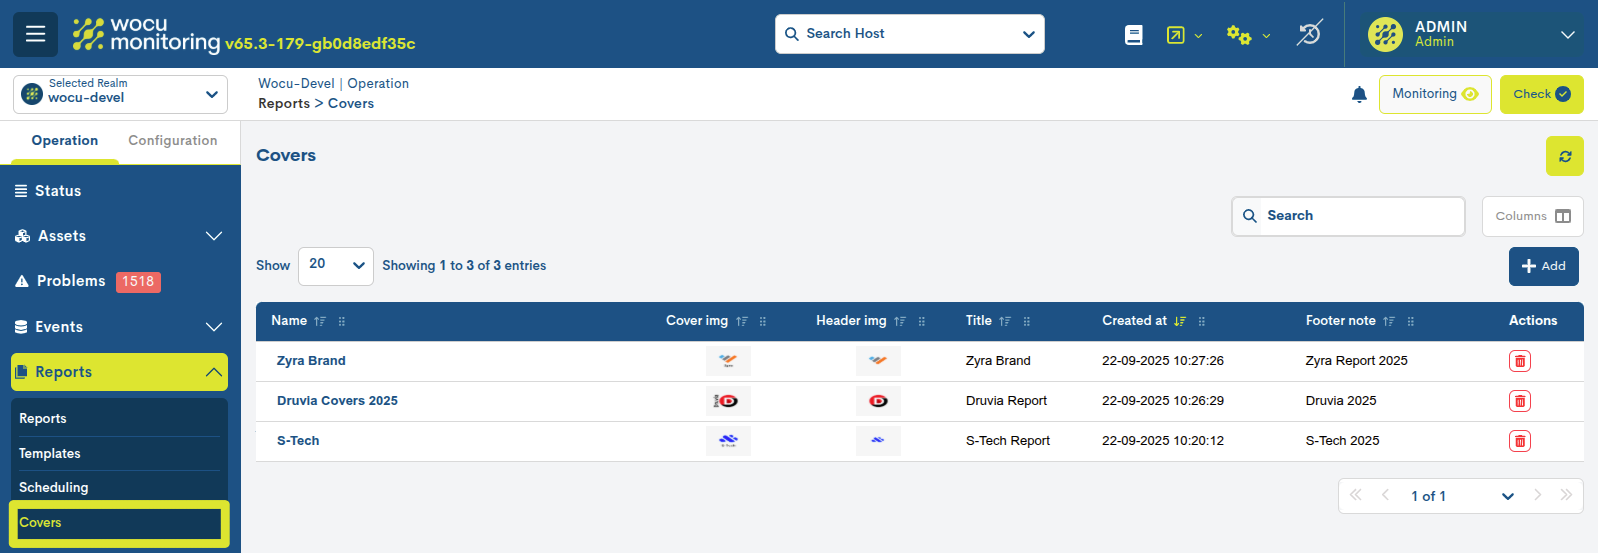
In line with this improvement, the Covers column has been added to both the Reports and the Templates global tables. This reflects the cover page assigned in each case.
New report export format
Report exports have been expanded with the addition of the XLSX format. This new file type is especially useful for multiple reports, as each report is organized into a separate spreadsheet within the same Excel document.

Reporting Module Routing
Starting with this version, the Reports Module has its own routes, incorporating a routing system that offers more coherent and consistent navigation within the application.
With this change, each report now has a dedicated URL, which offers several benefits in terms of usability and information management:
Browsing History: Visited reports are recorded in your browser history, allowing you to return to them using the back and forward buttons.
Unique and persistent URLs: Each report has its own address,making it easy to share with other users.
Integration with routing logic: When fully routed, the module behaves consistently with the rest of the application.
Overall, the reports gain customization, flexibility, and accessibility,improving usability and alignment with the corporate identity andWOCU-Monitoring navigation patterns.
3. New system for defining and assigning custom tags
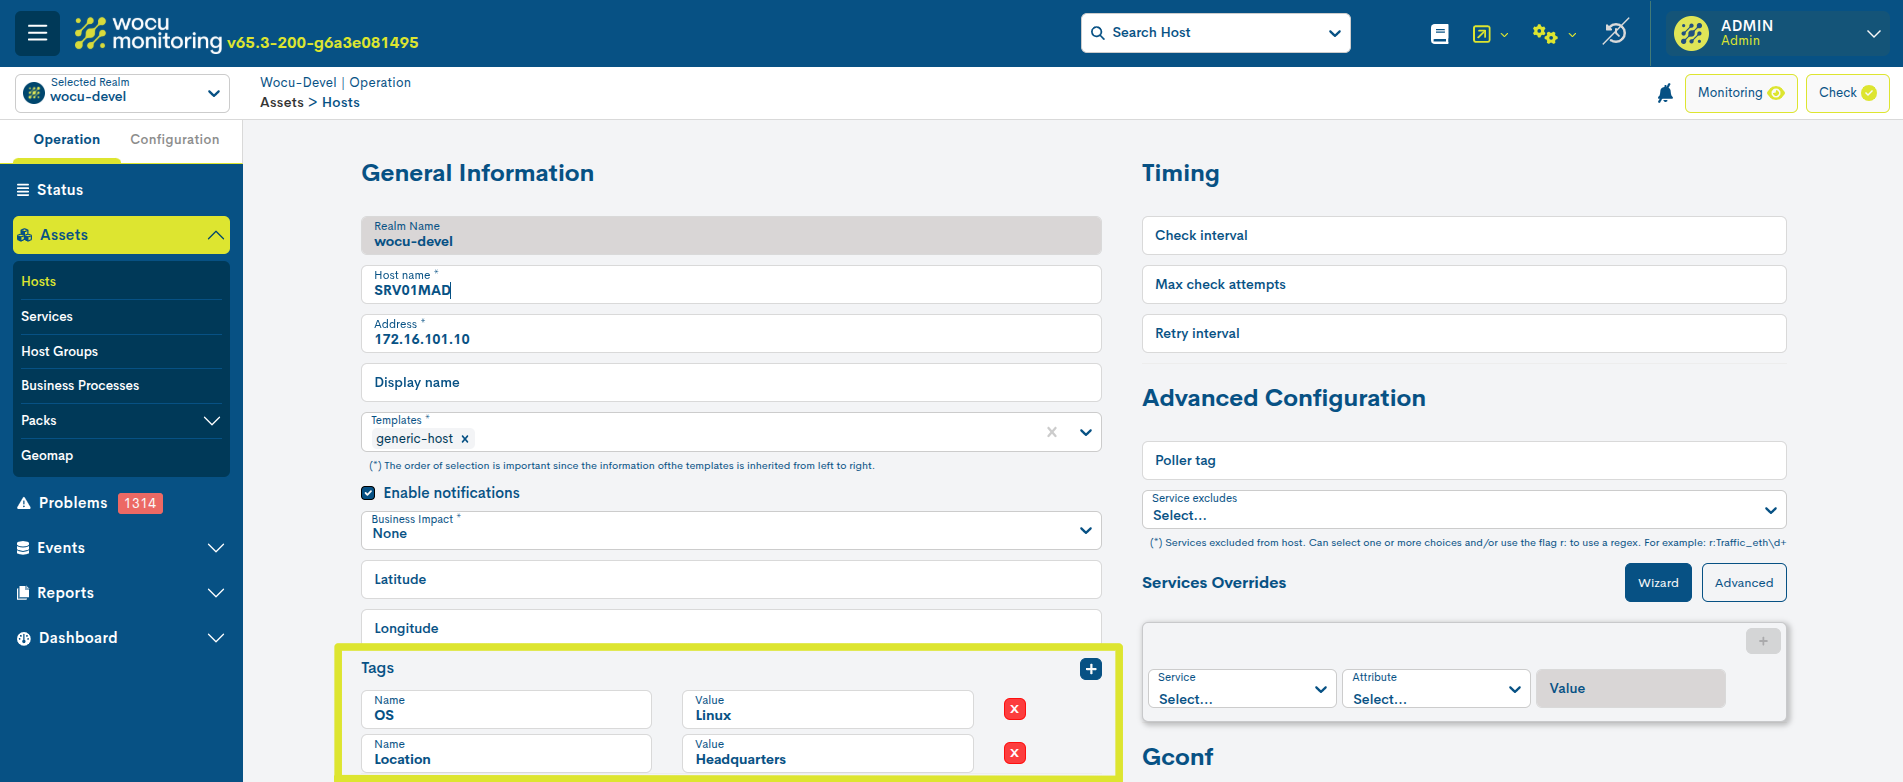
In complex monitoring environments, where multiple domains, clients, and services coexist, efficient information management is key. To address this need, the user has the ability to freely create and assign custom tags. These tags act as descriptive elements that provide metadata for the monitored objects, enriching their information and, therefore, facilitating their subsequent location within the system.
Creating it is very simple. You must follow the Name = Value format, where:
Name: corresponds to the name of the attribute or category you wish to describe.
Value: corresponds to the specific value assigned to that attribute.
Tags are defined from the following locations and, once created, will be present in a multitude of inventories:
Proper use of these elements favors the segmentation and search for assets within the system. This is why the new filtering criterion Tags has been added to the Custom Filters tool. Thanks to this option, it is possible to retrieve assets through custom (or less common) attributes, as shown in the following image:
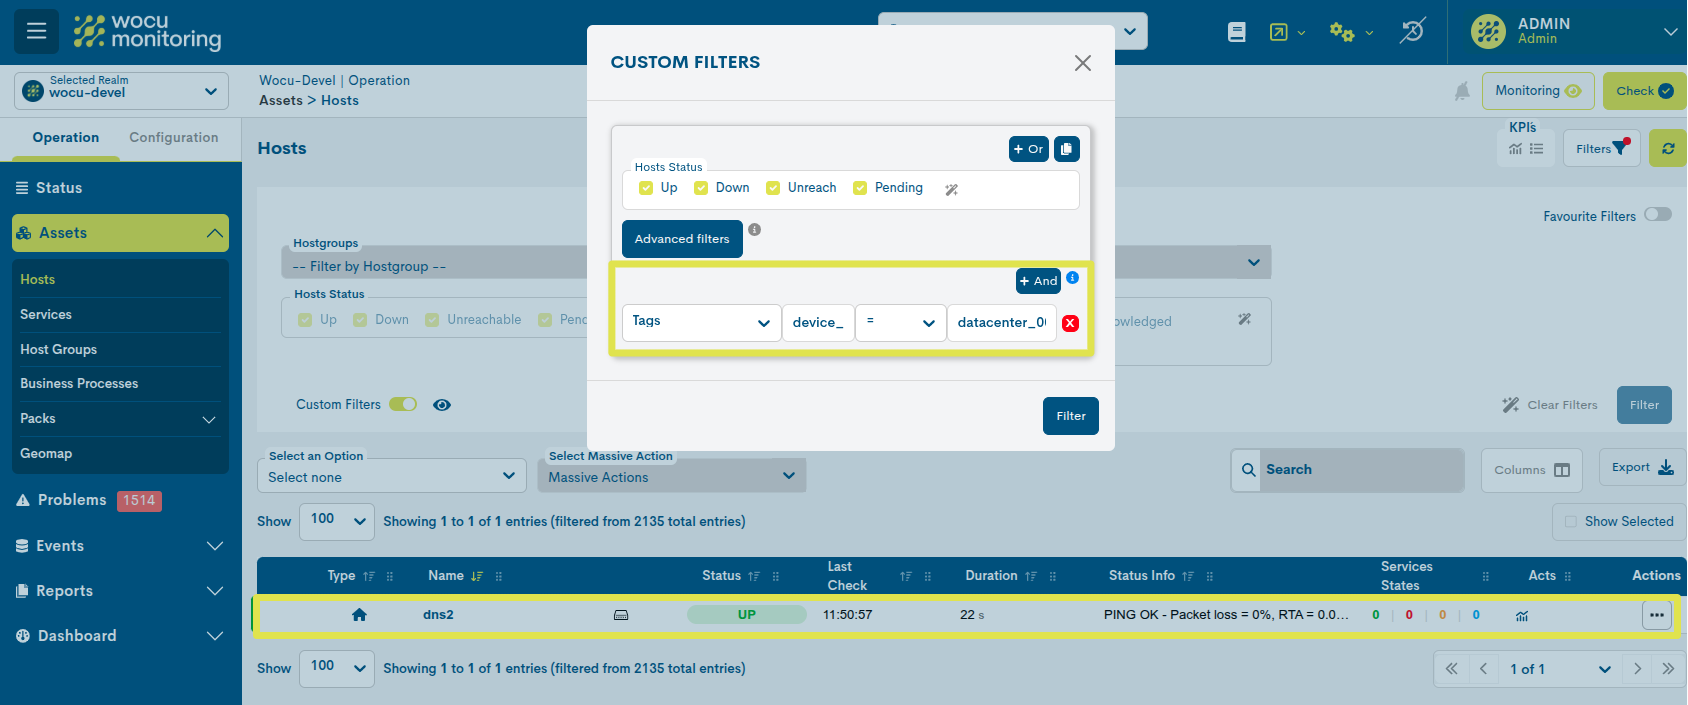
Until now, labels were auto-generated by WOCU-Monitoring, with no customization option. This new feature provides greater flexibility and more precise control over monitored objects.
4. New event correlation module
The new Event Correlation Module: Event Correlator has been added, designed to detect massive device crashes by creating configurable correlation rules based on the custom tangs used.
These rules allow for the discrimination of sets of devices based on their configured tags, generating events if they exceed defined percentage limits for devices in a critical state.
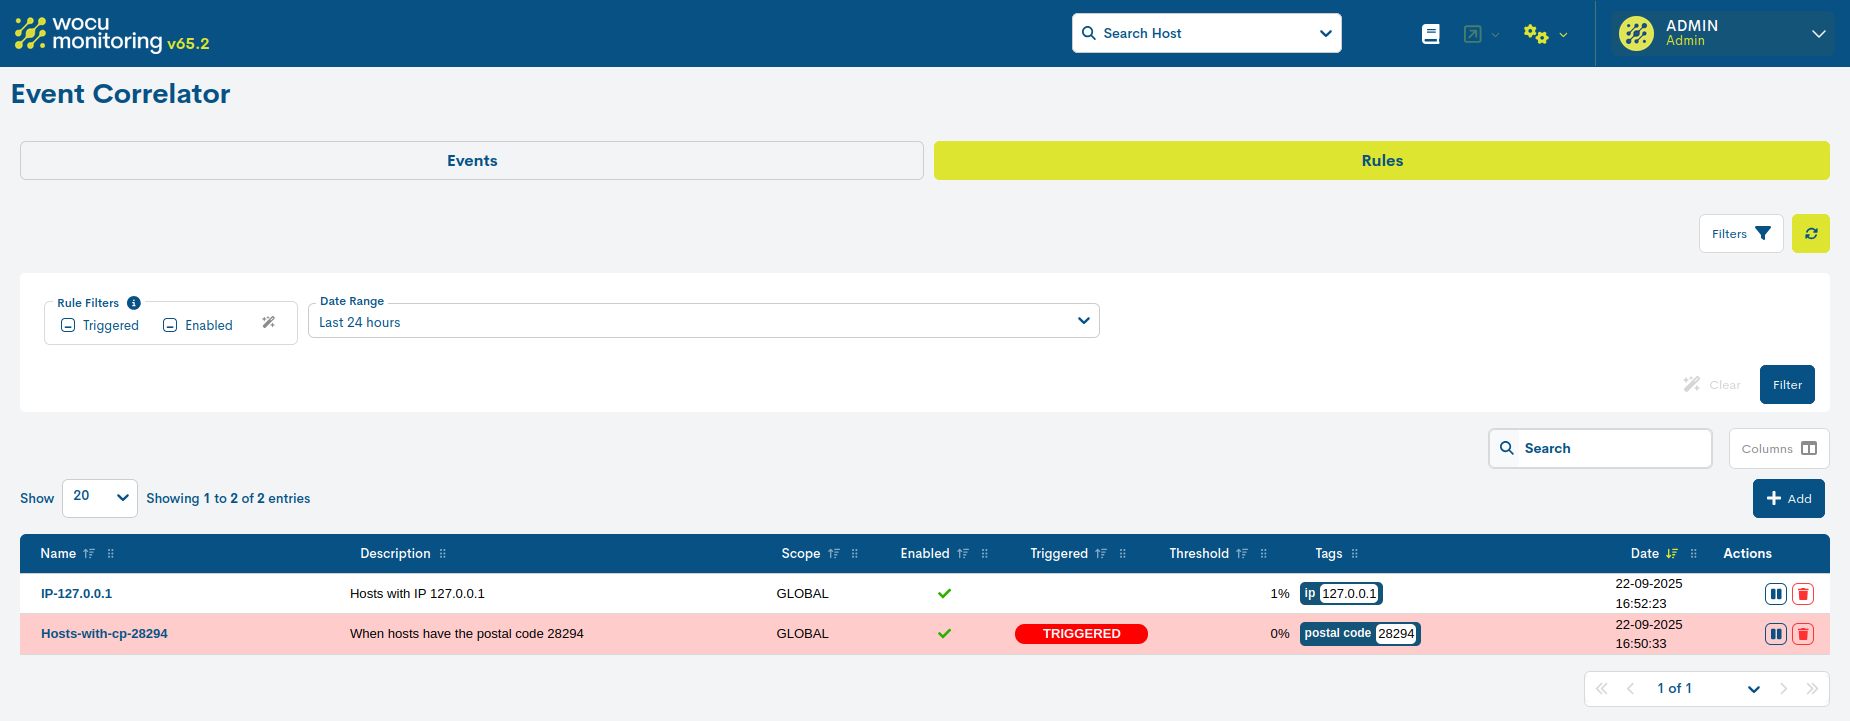
Correlations can be applied both globally and within specific monitoring realms, offering greater granularity and precision in the management of relevant events. This enables a faster and more efficient response to massive incidents.
The system generates a specific event associated with the correlation and issues the corresponding notifications, including console alerts, emails, and displays in the new global view, thus ensuring timely detection and effective incident management.
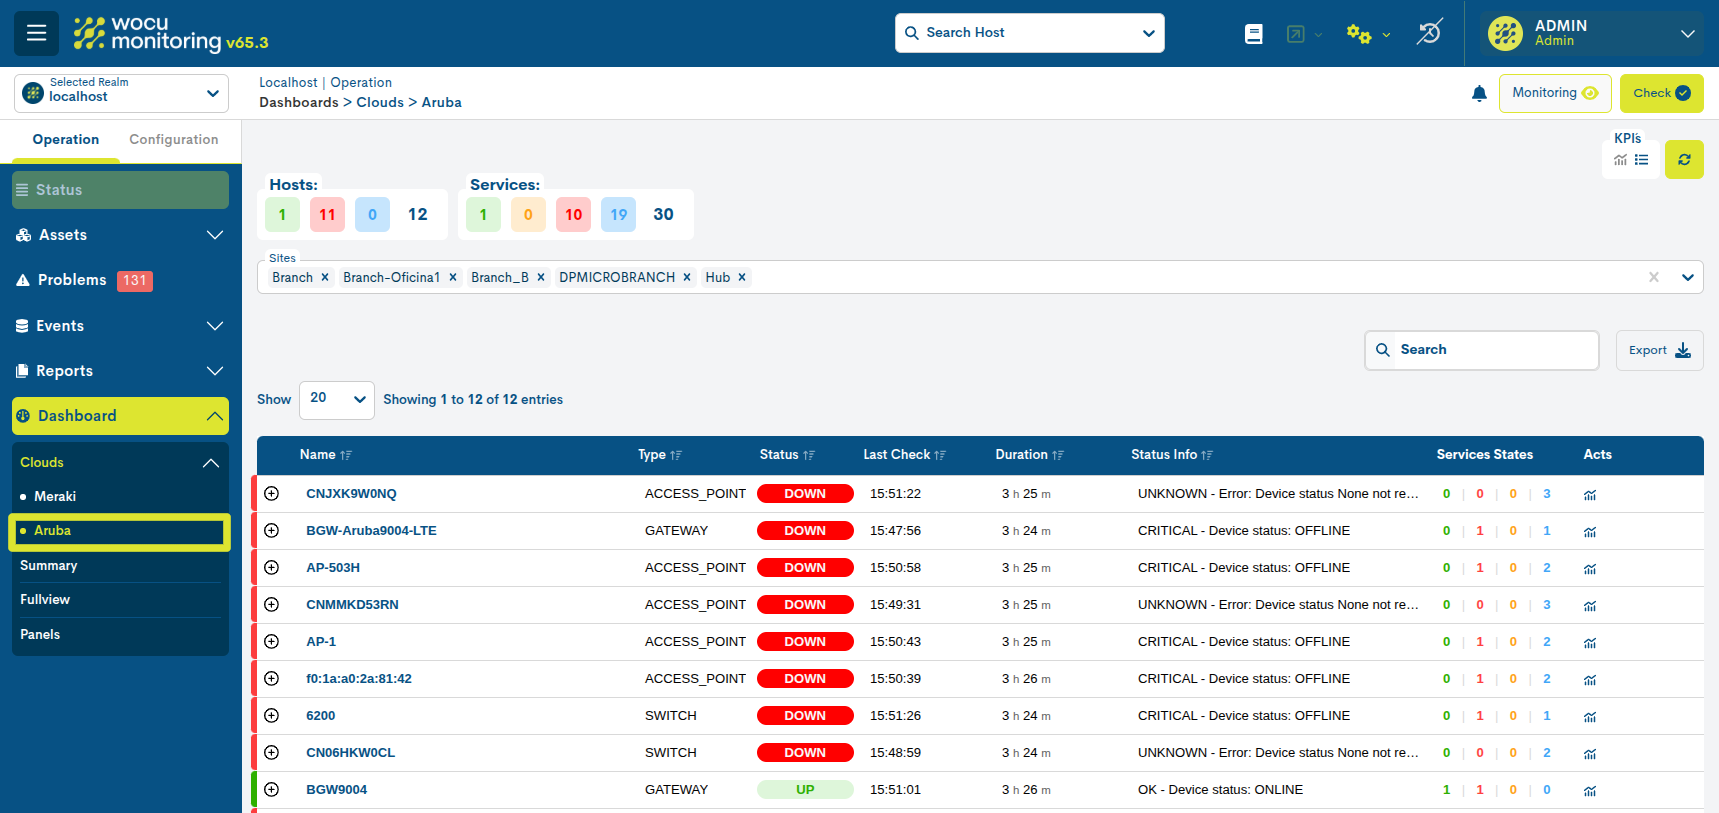
5. Evolution of the Cloud Module: Integration with Aruba©
Monitoring capabilities in cloud environments are expanded with the integration of the Aruba platform, one of the most widely used solutions for centralized network management. With this addition, the Cloud module for monitoring cloud-managed devices is strengthened, adding Aruba a to the already supported Meraki©.
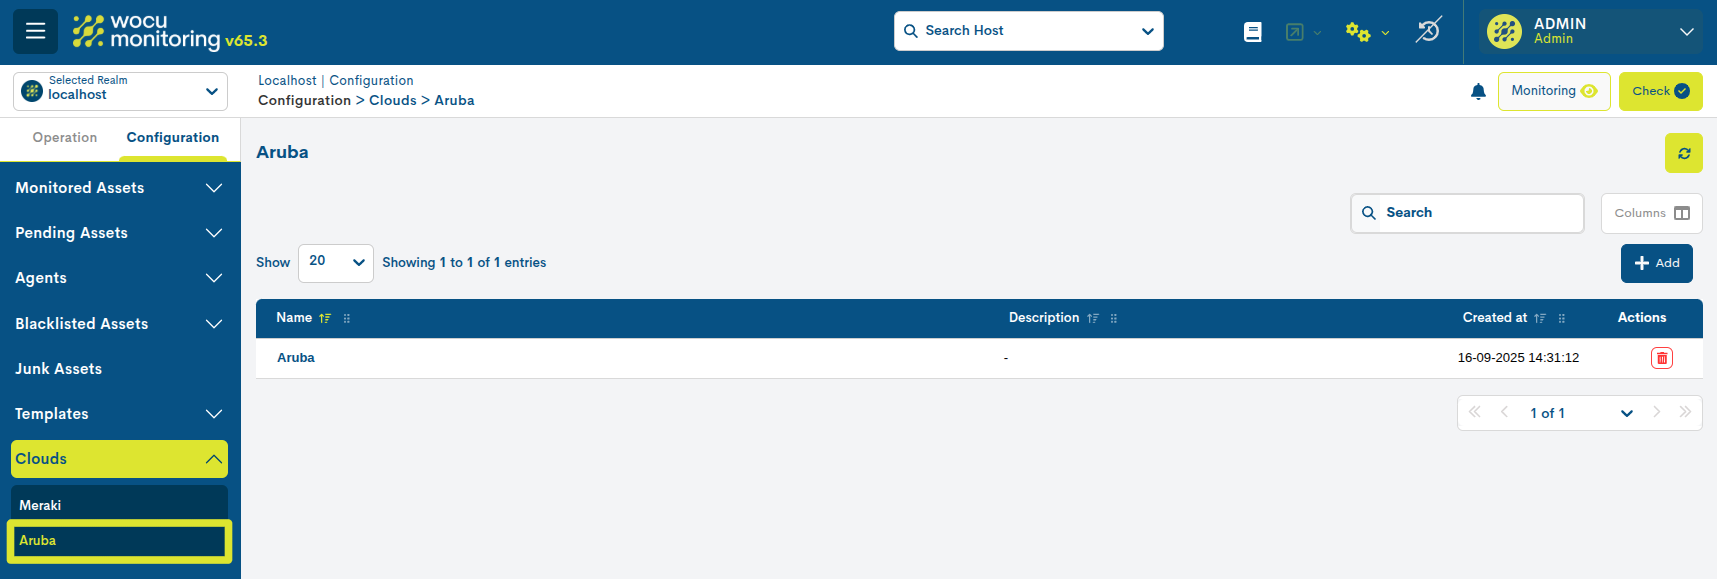
This module fully automates the monitoring process of Aruba devices managed through the cloud, significantly reducing human intervention and facilitating real-time incident detection.
With this integration, we take another step forward in the evolution of the cloud monitoring module, offering users broader coverage aligned with the main platforms on the market.
6. Implementing one-time backups of network equipment in Gconf
Starting with this release, WOCU-Monitoring adds one-time backup management to the configuration management tool GConf.
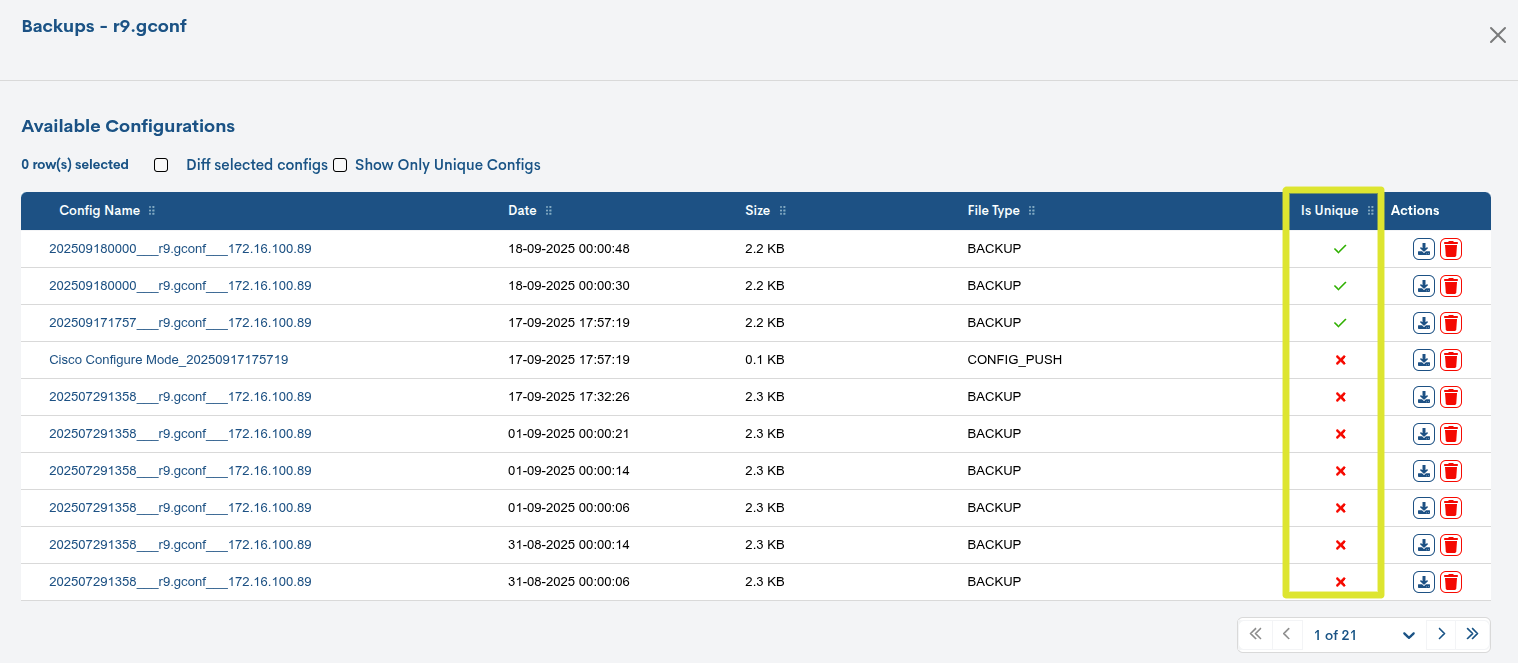
A unique backup is one that contains a different configuration compared to previously stored copies. During periodic backups, if no changes are detected in the device’s configuration, new backups do not replace the existing one, as they do not provide different information. Thus, the first backup detected as valid is marked with a unique status and maintains this status until a change is recorded on the asset. At that time, a new unique backup is generated that reflects the detected change and is added to the configuration history.
New specific mechanisms have been designed for accessing this information:
In Backups, where the history of a computer’s configuration backups is displayed, you can quickly identify unique backups using the new Is Unique column. Here you specify which copies have the unique status.
You can also filter the table using the filter Show Only Unique Configs. By checking this box, the list returns only the unique copies along with the generation date.
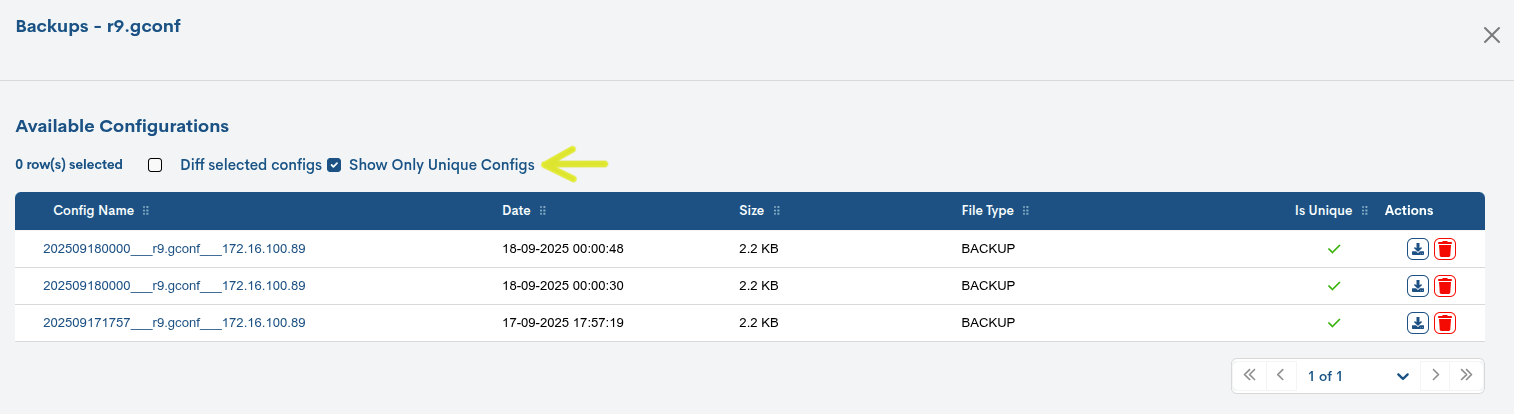
This feature optimizes backup management by reducing the redundancy of stored information and making it easier to identify relevant configurations in the lifecycle of each network device.
7. New dark theme in WOCU-Monitoring
The Dark theme is now available in WOCU-Monitoring. It has been designed to offer an optimized interface in low-light conditions, reducing eye strain and improving readability during extended sessions.
The new theme can be activated from the User preferences, via the Themes selector, where you can toggle between the two currently available modes:
Light: Light theme, provides a standard display and is implemented by default.
Dark: Dark theme, provides greater visual comfort.
Theme selection is stored in individual preferences and is immediately applied throughout the application interface, without the need to log back in.
Attention
This option will not be available to customers who already have their own corporate theme applied.
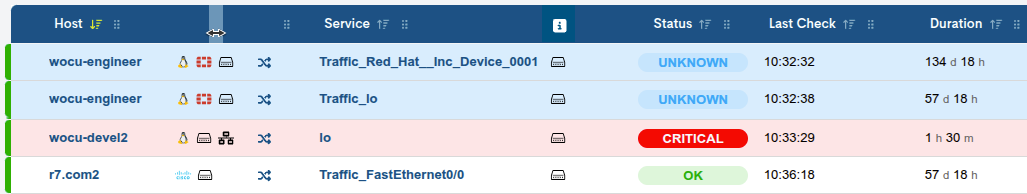
8. Manually resizing columns in tables
Starting with this version, WOCU-Monitoring incorporates support for dynamic column resizing of the application’s various tables, allowing the user to manually adjust the width of each column according to viewing needs.
To resize a column, the user must position the cursor over the right edge of the column header. When the cursor changes to a resize indicator, simply click and drag sideways to set the new width.
This feature significantly improves readability in tables with high information density, offering granular control over column widths and a responsive interface without the need for reloading or additional configuration.
This functionality is perfectly complemented by the Columns option, which allows the user to dynamically select which columns to show or hide. By combining both capabilities, an advanced level of customization is enabled in data visualization, optimizing both screen space and the relevance of the information presented.
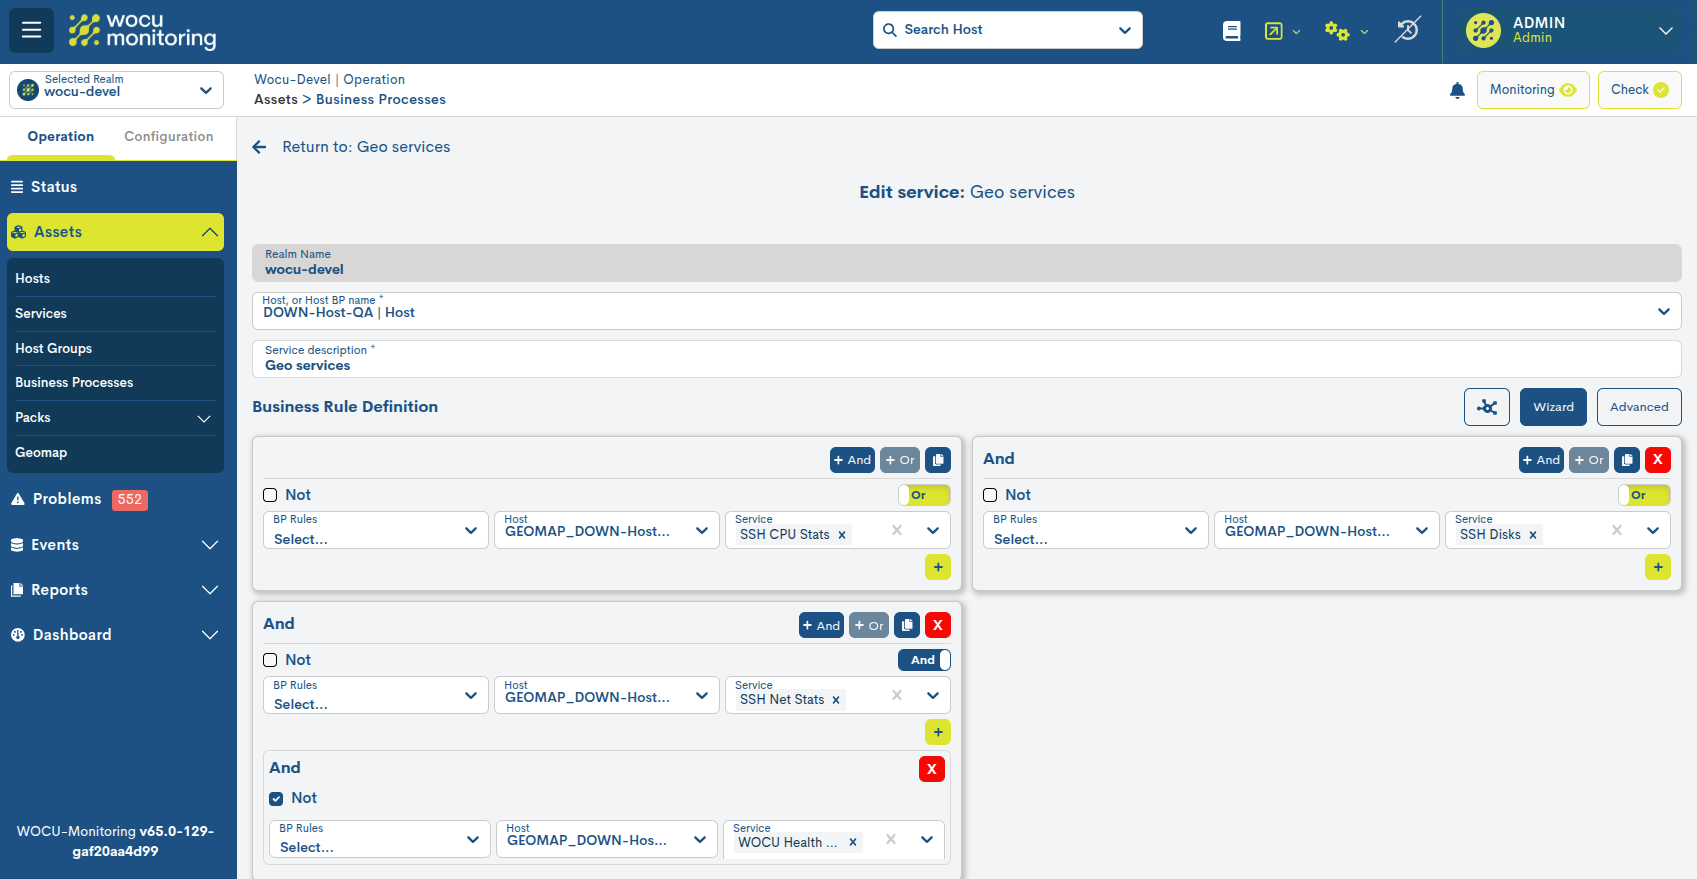
9. BP Services editing capability
Within the Services Business Detail View`Processes, a new editing option is added using the Edit BP Services button.
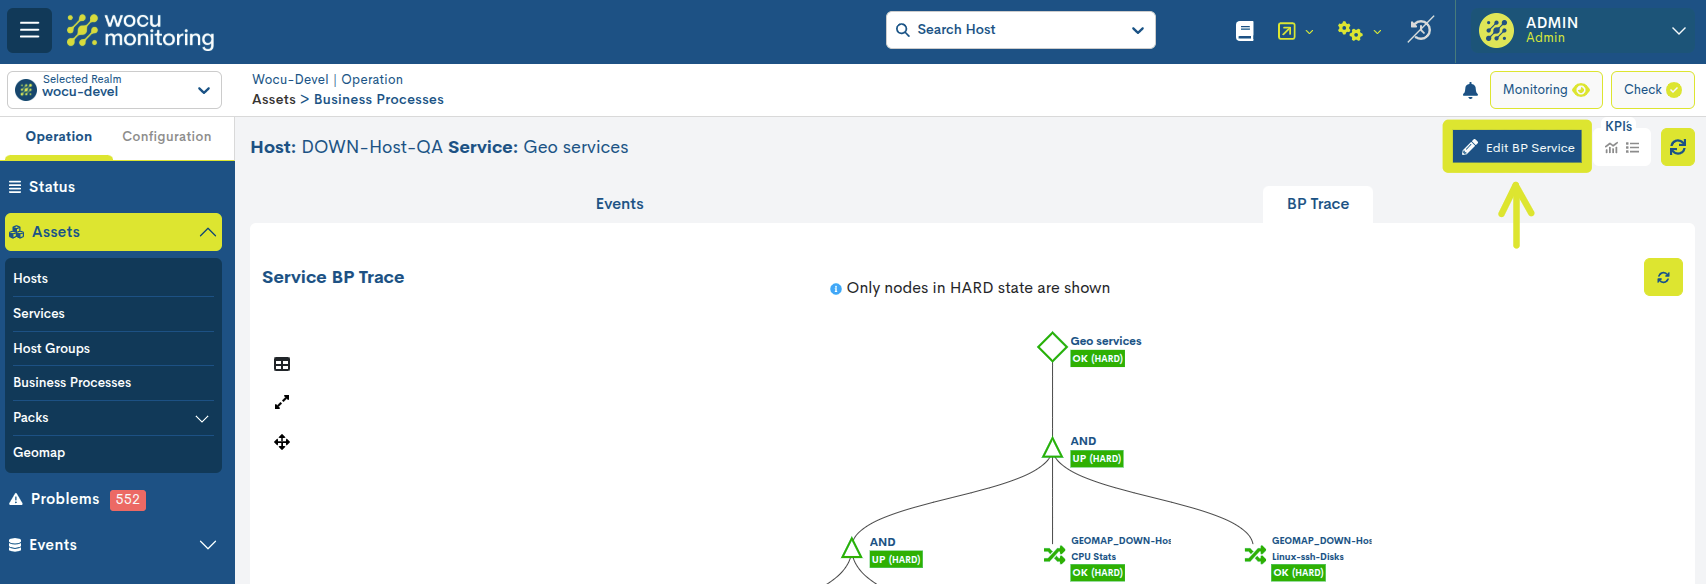
From the edit form, you can modify the current asset configuration, as well as the configuration and dependencies of the business process, as appropriate.
This new feature facilitates the comprehensive management of business processes directly from your modal, without having to go to the Configuration Module. This way, users can optimize time and keep the relationship between processes and associated services up to date.
10. Updated the frequency of active checks on monitored devices
In order to prevent and reduce potential performance issues, the active check interval for devices monitored in WOCU Monitoring has been updated.
The check_interval parameter defines how often scheduled checks on an asset’s status will be performed. Previously, this value was set to 1 minute, but starting with this version, it has been set to 5 minutes by default.
This change implies an 80% reduction in the number of checks per asset, which translates to:
A significant reduction in the workload on the system.
An improvement in overall monitoring performance.
Greater efficiency in the use of platform resources.
However, this value can be configured for a specific device if more or less frequent checking is required. From the Edit Host form, in the Timing section, you can set the check_interval parameter to the desired value.
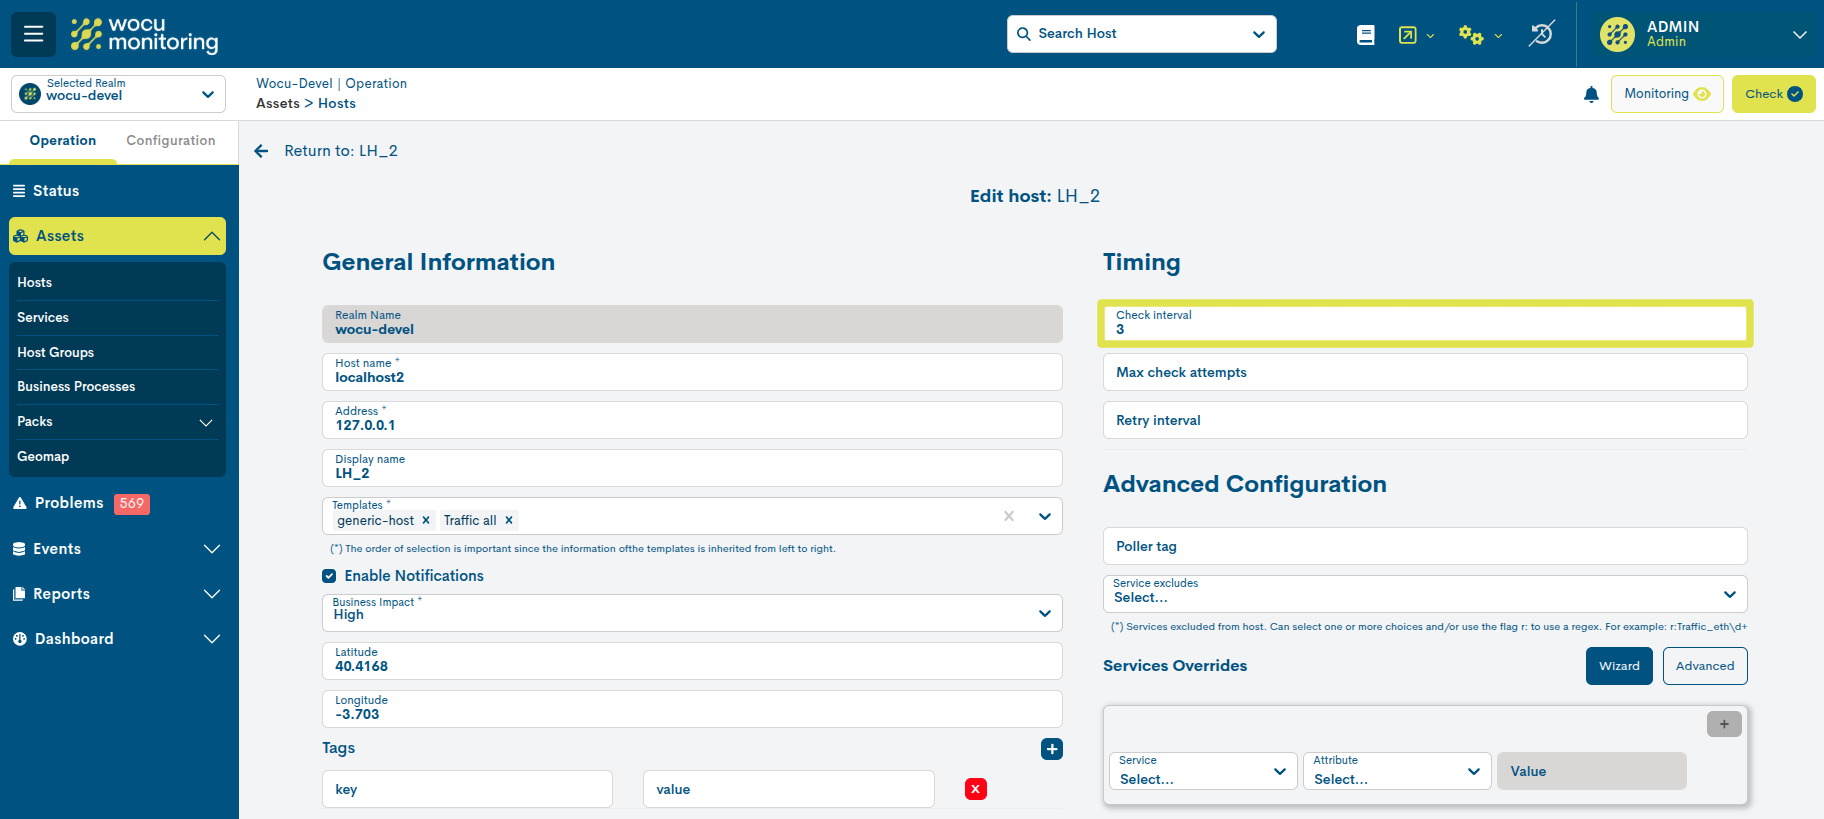
In this way, the system offers a balance between optimal performance and flexibility in configuration according to the needs of each environment.
11. Addition of new default loggers to the Free version
Starting with this version, the WOCU-Monitoring Free license includes loggers of the traps and syslog types by default, and not just the events specifically known as Monitoring.
With this integration, logging and tracking coverage is expanded, offering a greater level of traceability and visibility in event management, while facilitating integration with external systems via syslog.
This way, even in the free version, administrators will be able to benefit from a more complete view of the status and operation of their infrastructure.
12. Integrations and improvements to the Monitoring Pack Catalog
Check out our Monitoring Packages catalog at the following link.
Improvements in remote execution of monitoring packs
In order to optimize remote script execution on satellites and avoid issues arising from the use of special characters in macros, we have incorporated a new password macro with Base64 encoding in certain packages.
This improvement offers greater robustness in password management and greater compatibility in scenarios that require avoiding special characters.
Additionally, to ensure a smooth transition for packages already used by the client, an automated script is being developed that:
Gets the value of the original password macro.
It automatically encodes it in Base64.
Save the result in the new
password_base64macro on all devices where applicable.
New macro for secure password management in the Fortinet-licenses package
The use of special characters in WOCU-Monitoring monitoring package macrosdedicated to storing passwords, such as backslashes, periods, asterisks, ampersands, dollars, among others, can cause problems when running scripts in distributed WOCU-Monitoring installations.
As a workaround, a macro has been added to the Fortinet-licenses pack to store the password encoded in Base64 format (_SSH_PASS_BASE64). Base64 is an encoding format that does not contain any characters considered special by the operating system.
New services in the Fortigate-switch-controller pack
The following new monitoring services have been added to the Fortigate-switch-controller pack:
Info: Displays the serial number and join time of the switch.
Switch Count: Muestra el número total de switches gestionados por el Fortigate. Alerta si este número es mayor al número de switches descubiertos y monitorizados por el pack.
Support for Huawei Yunshan OS
Support for the Huawei Yunshan OS vendor has been added to the Networkdevice-cpu and Networkdevice-mem monitoring packages.
This enhancement enables the collection and visualization of metrics on devices running Huawei Yunshan OS, expanding support and monitoring in multi-vendor environments.
Nuevo Pack Fortigate-wifi-controller
The new Fortigate-wifi-controller package has been created to monitor WTP (Wireless Termination Point) or FortiAP managed by a Fortigate. AP and Wi-Fi client discoverers are included. The services included are the following:
AP Info: Displays the following information for each discovered AP: unique identifier, uptime, profile, model, hardware and software version.
AP Count: Total number of APs managed by Fortigate. Alert when this number is not equal to the number of discovered APs.
AP Online Count: Total number of APs online. Alert if this number is less than the value configured in the macro
_FORTIGATE_WIFI_ONLINE_AP_COUNT_MIN.AP CPU: Monitors the CPU usage of each discovered AP. Alerts based on configured thresholds.
AP Memory: Monitors the memory usage of each discovered AP. Alerts based on configured thresholds.
AP Radio: Monitors the radio channels and the power of each one on which each discovered AP transmits. Alerts if the power is lower than the thresholds configured.
AP Stations Count: Monitors the number of Wi-Fi clients (stations) connected to each discovered AP. Sorts the number of clients by radio channel and SSID.
AP Status: Monitors the status of each discovered AP. Alerts when the status is not online.
Station Info: Displays the following information for each discovered Wi-Fi client: hostname, MAC address, IP address, Radio ID, AP ID, channel, SSID, status, CP Auth, signal, noise, RX Bandwidth, and TX Bandwidth.
Total Stations: Displays the total number of Wi-Fi clients connected to all APs managed by Fortigate.
Stations Data Summary: Displays metrics for all Wi-Fi clients connected to any AP managed by Fortigate. The metrics returned are: signal power, noise power, RX bandwidth, and TX bandwidth.
Stations Info: Displays information for all Wi-Fi clients connected to any AP managed by the FortiGate. The information displayed for each Wi-Fi client is: user, hostname, MAC address, IP address, radio ID, AP ID, channel, status, CP auth, SSID.
Stations Info: Displays information about all Wi-Fi clients connected to any AP managed by Fortigate. The information displayed for each Wi-Fi client is: user, hostname, MAC address, IP address, radio ID, AP ID, channel, status, CP auth, SSID.
A new HWgroup Poseidon2 package has been developed to monitor the status and values of sensors installed in HW-Group devices, specifically Poseidon2 devices.
The pack allows you to discover and select the sensors installed on the device. To do this, discover itself consults the configured limit_min and limit_max parameters and, based on those values, creates range-type thresholds in WOCU-Monitoring so that the services associated with each sensor alert without the need for additional configuration.
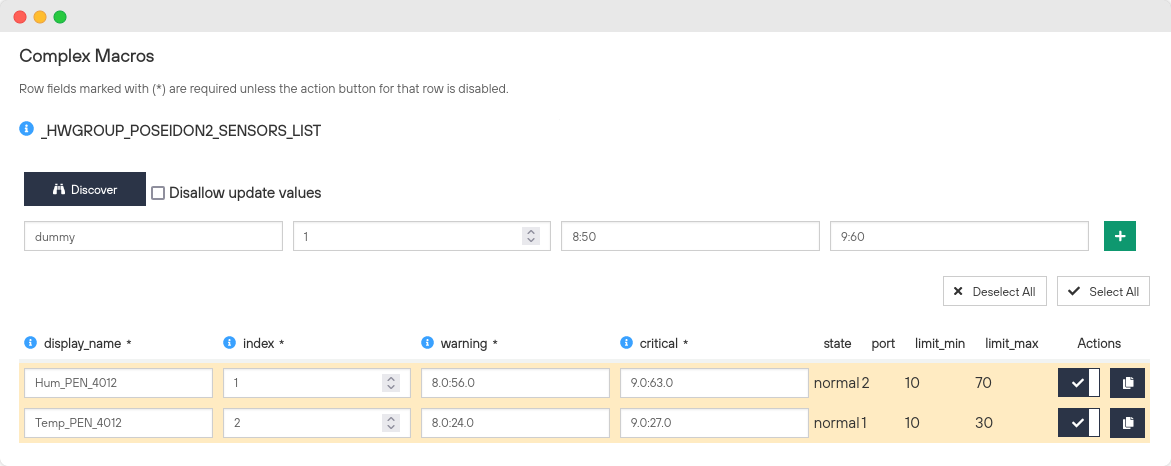
El pack de monitorización crea un servicio por cada sensor seleccionado. El servicio mostrará tanto el estado del sensor, como el último valor medido.

The monitoring package creates a service for each selected sensor. The service will display both the sensor status and the last measured value.
The new Guardicore package has been developed to discover and monitor the status of agents deployed in the client’s infrastructure.
The package includes the following services:
Guardicore Agents Number Diff: Monitors the number of installed agents and alerts you when this number changes. The pack includes a Discover button to complete this value during initial setup and when it needs to be updated.

Guardicore Online Agents Diff: Monitors the number of installed agents in an online state. The package alerts you when this number decreases by more than a certain percentage between two consecutive checks. This parameter is configurable as a package macro:

Guardicore Critical Agent Status: Monitors the status of critical agents discovered and selected in the package configuration:
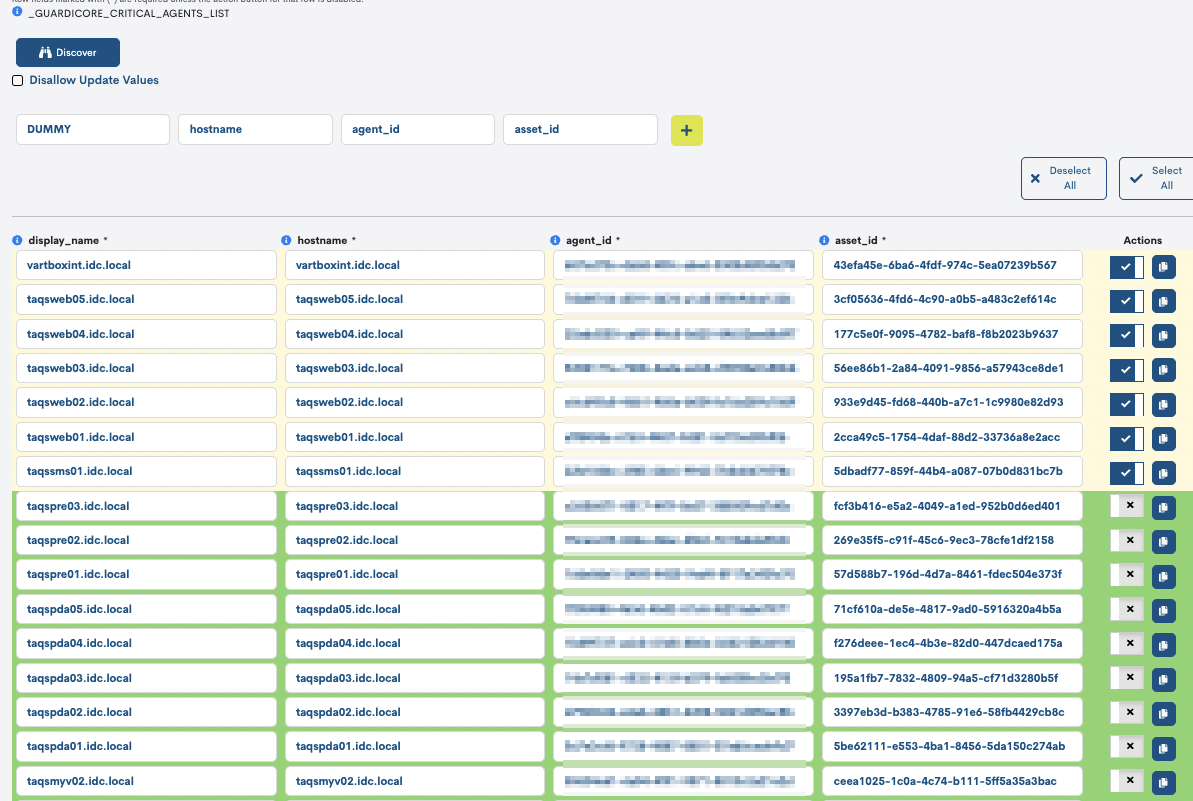
Additional metrics have also been added to the Agents Number Diff service, which stores the number of agents in each state for each check performed.
New Pack Snmp-generic-rate
This new package has been designed to monitor SNMP counters without the need to use temporary files. It allows you to configure one or more counter-type OIDs and also adds several additional fields for each OID.

Name: Name to be displayed in the Assets view of WOCU-Monitoring.
OID: OID of the counter to monitor.
Warning: Threshold to alert with WARNING status when the calculated rate value does not meet it. Nagios format is allowed for range-type thresholds.
Critical: Threshold to alert with CRITICAL status when the calculated rate value does not meet it. The Nagios format is allowed for range-type thresholds.
Unit: The unit of measurement for the metric represented in the queried counter. It will be added to the output and the metric returned by the service.Can be left blank if the metric has no unit.
Label: Label to indicate the name of the metric the counter refers to. It will be used both in the output and in the metric returned by the service. If left blank, the OID will be used.
Type: You can choose between rate and diff. If rate is chosen, the data will be calculated by subtracting the counter value between two consecutive checks and dividing by the time elapsed between the two checks. If diff is chosen, the division will not be performed; only the counter difference between the two consecutive checks will be displayed.
The package will create one service for each OID configured in the complex macro _SNMP_GENERIC_RATE_LIST.
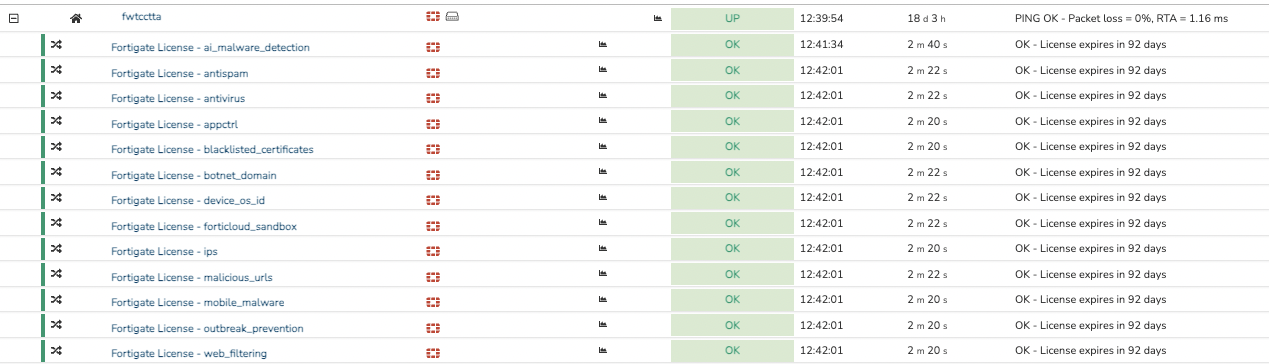
New Pack Fortigate licenses api
The Fortigate Licenses API package has been developed to discover and monitor installed licenses and their expiration dates on Fortigate devices through queries to the FortiOS API.
Once the licenses have been discovered and selected for monitoring, the package will create a service for each one. The service will alert based on the thresholds defined in the complex macro for each license.
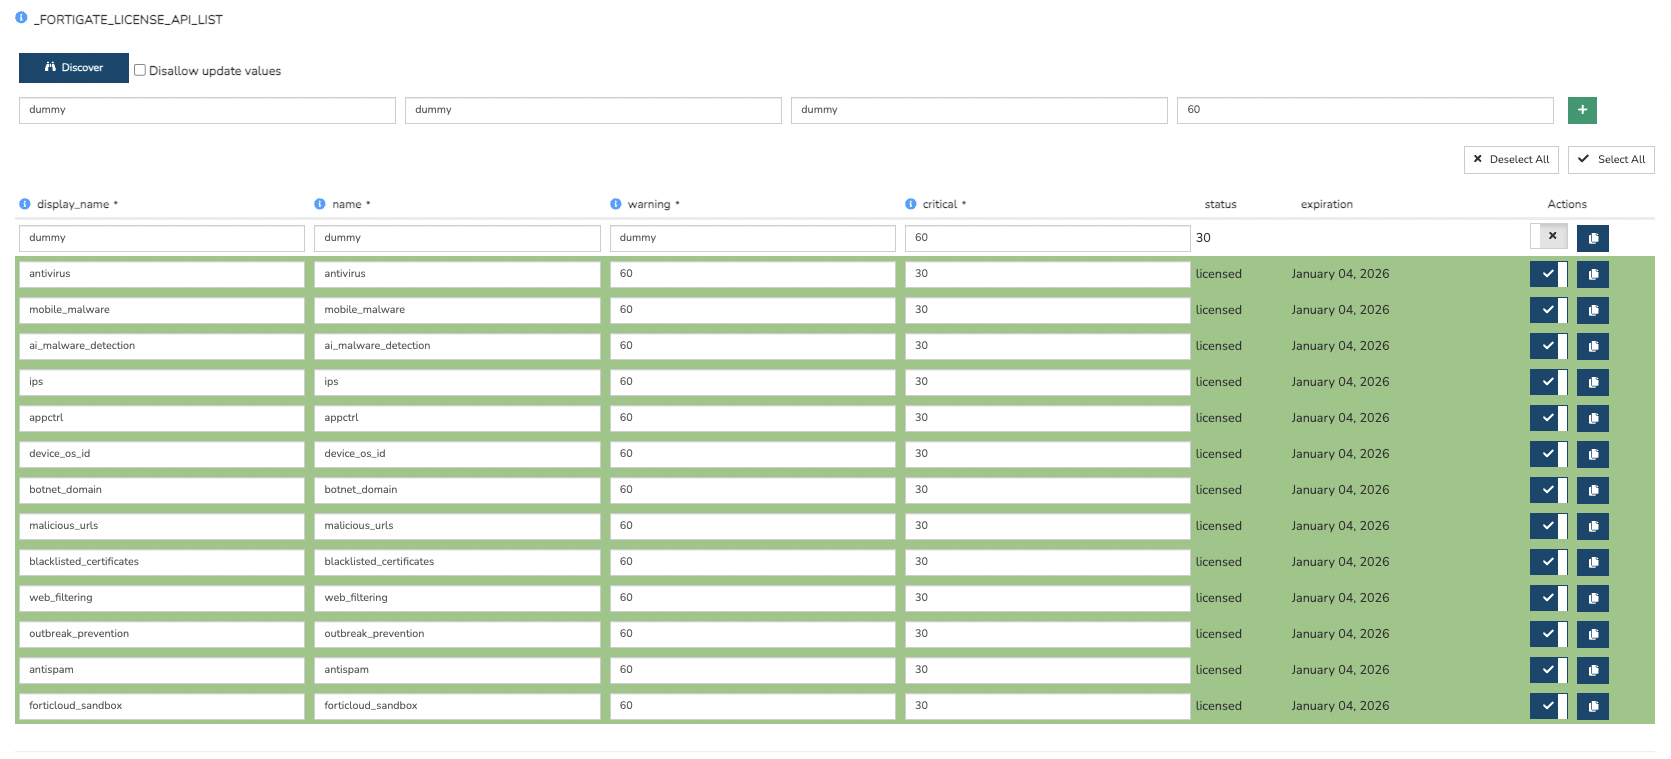
The package includes the following services:
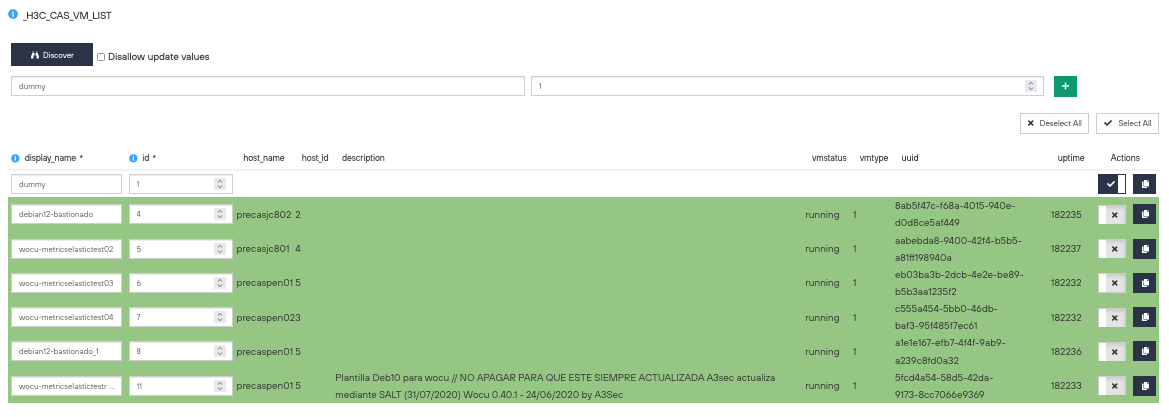
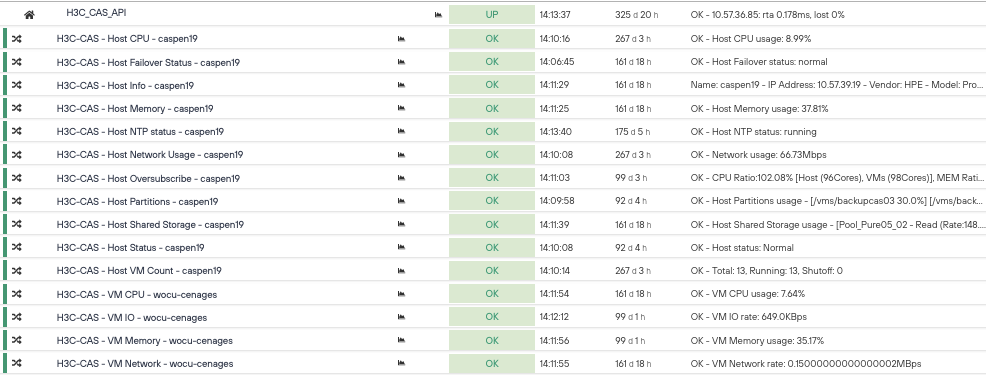
New Pack H3C CAS
A new package has been added to the catalog for monitoring H3C CAS virtualization environments. The package includes device and virtual machine discoverers. Monitoring services will be created for each of the selected devices and virtual machines.
The package includes the following services:
Host CPU: Monitors the CPU usage of the device.
Host Failover Status: Monitors the Failover status of the device.
Host Info: Gets device information: Name, Identifier, IP Address, Uptime, Vendor, Model, and Version.
Host Memory: Monitors the device’s memory usage.
Host Network Usage: Monitors the memory usage of a device.
Host NTP status: Monitors the NTP status of a device.
Host Oversubscribe: Checks if a device is oversubscribing CPU or memory resources.
Host Partitions: Monitors the partition usage of a device.
Host Status: Monitors the status of a device.
Host VM Count: Monitors the number of virtual machines on a device and the status of each one.
Host Shared Storage: Monitors a device’s shared storage usage.
VM CPU: Monitors the CPU usage of a virtual machine.
VM IO: Monitors the input/output rate.
VM Memory: Monitors the memory usage of a virtual machine.
VM Network: Monitors the memory usage of a virtual machine.
Other improvements and fixes
Every new release is full of small changes, fixes, and optimizations that are worth briefly highlighting. Here’s a list of the most notable ones in this release:
A set of improvements to the log management system have been implemented, including:
Plugin Execution Decoupling: Added the option to run monitoring plugins independently of the agent’s execution interval, allowing for greater flexibility and performance optimization.
Integrated documentation: A detailed user guide has been included within the agent itself.
Per-plugin scheduling for smarter monitoring: Improvements have been made to the monitoring agent, allowing each plugin to run on its own custom schedule. This means you can now define specific execution intervals per plugin, for example, memory checks every 120 seconds and CPU checks every 60 seconds, optimizing performance and reducing unnecessary load while ensuring a timely view of system status.
A global 2-minute timeout has been added to all WOCU Monitoring requests to prevent infinite loads and improve system stability.
A timeout has been added to connections to InfluxDB, so that if it doesn’t respond, an error is thrown instead of leaving requests waiting indefinitely.
To manage user load and maintain optimal web server performance, configuration rules have been implemented to limit resource-intensive requests, such as report generation and KPI queries. As of this release, the following restrictions apply:
Concurrent connections from the same client (IP) to endpointsrelated to reports and KPIs: 6
Simultaneous requests from the same client (IP) to endpoints related to reports and KPIs: 12 requests per second.
Starting with this release, the Cloud section will be hidden within Hostgroup-based Realms.
The current version of WOCU-Monitoring is now displayed in the top header instead of the side menu.
Starting with this release, at least one column will always remain visible in data tables, correcting a bug that allowed all of them to be removed from the Columns filter.
Fixes an issue in the Security Module that caused some options to not appear in the Settings dropdown menu.
Fixed a bug where, when a service recorded a status flapping in the KPI Status, the text would overlap with the Next check information.
A new confirmation message has been added when performing a Packs on a specific device, to warn the user that the operation may increase execution times and temporarily impact system performance.
Service information tooltips have been restored in Top Hosts Reports, allowing the user to once again access additional descriptions by hovering over each item.
The bug that marked Import Tasks (Tasks) as successful with failed subtasks has been fixed; the final status now correctly reflects the result.
The efficiency of the Availability Hosts public API endpoint has been improved, optimizing queries and reducing response times to provide faster and more reliable access to information.
The backup deletion action for GConf has been fixed, ensuring that they are permanently deleted.
The element selection action in Device Inventory is now working normally again.
The Vista Job Information in the Task status table expands the number of items displayed. Additionally, pagination and a search bar have been added to improve navigation. The Logs column has also been added to the table, making it accessible to all users.
Fixed an issue that prevented filtering from the Global.
Clicking on the Metrics icon for each Device or Service takes the user directly to their respective Metrics view, where they can view and analyze the associated metrics in detail.
Fixed a bug where the BP Trace tree was not displayed when creating or editing rules from the Configuration module.
The metric graph reports resulting from the PDF Export in the Metrics view have had their design updated to maintain visual consistency and align with the style of the Reports performance reports.
The design of several import buttons has been updated to align them with the style used throughout the rest of the application.
Fixed a bug that blocked the send button, so the action to send reports from Aggregator Summary is now available again.
The captcha component in the login interface has been redesigned with a new visual style that significantly improves character readability.
Software updated
As always, other pieces of software have been incorporated and updatedin this new version of WOCU-Monitoring:
Software |
Previous version |
Current version |
Observations |
|---|---|---|---|
Node |
18.18.1 |
20.19.4 |
|
React router |
6 |
7 |
|
wocu-agents |
1.2.0 |
1.1.0 |
|
django-simple-captcha |
0.5.17 |
New modified version of the project (WOCU-Monitoring) |
|
New django-unfold library |
0.39.0 |
About WOCU-Monitoring
WOCU-Monitoring is a multipurpose monitoring tool that integrates the latest Open Source technologies for monitoring, visualization, metric graphing, and log management, providing broad visibility into the status and availability of network elements, servers, databases, and workstations (among others) using custom Monitoring Packs.
In addition to the Free version, the Enterprise version of WOCU-Monitoring allows the deployment of thousands of IP devices in a distributed environment, with customizations tailored to each client’s infrastructure.