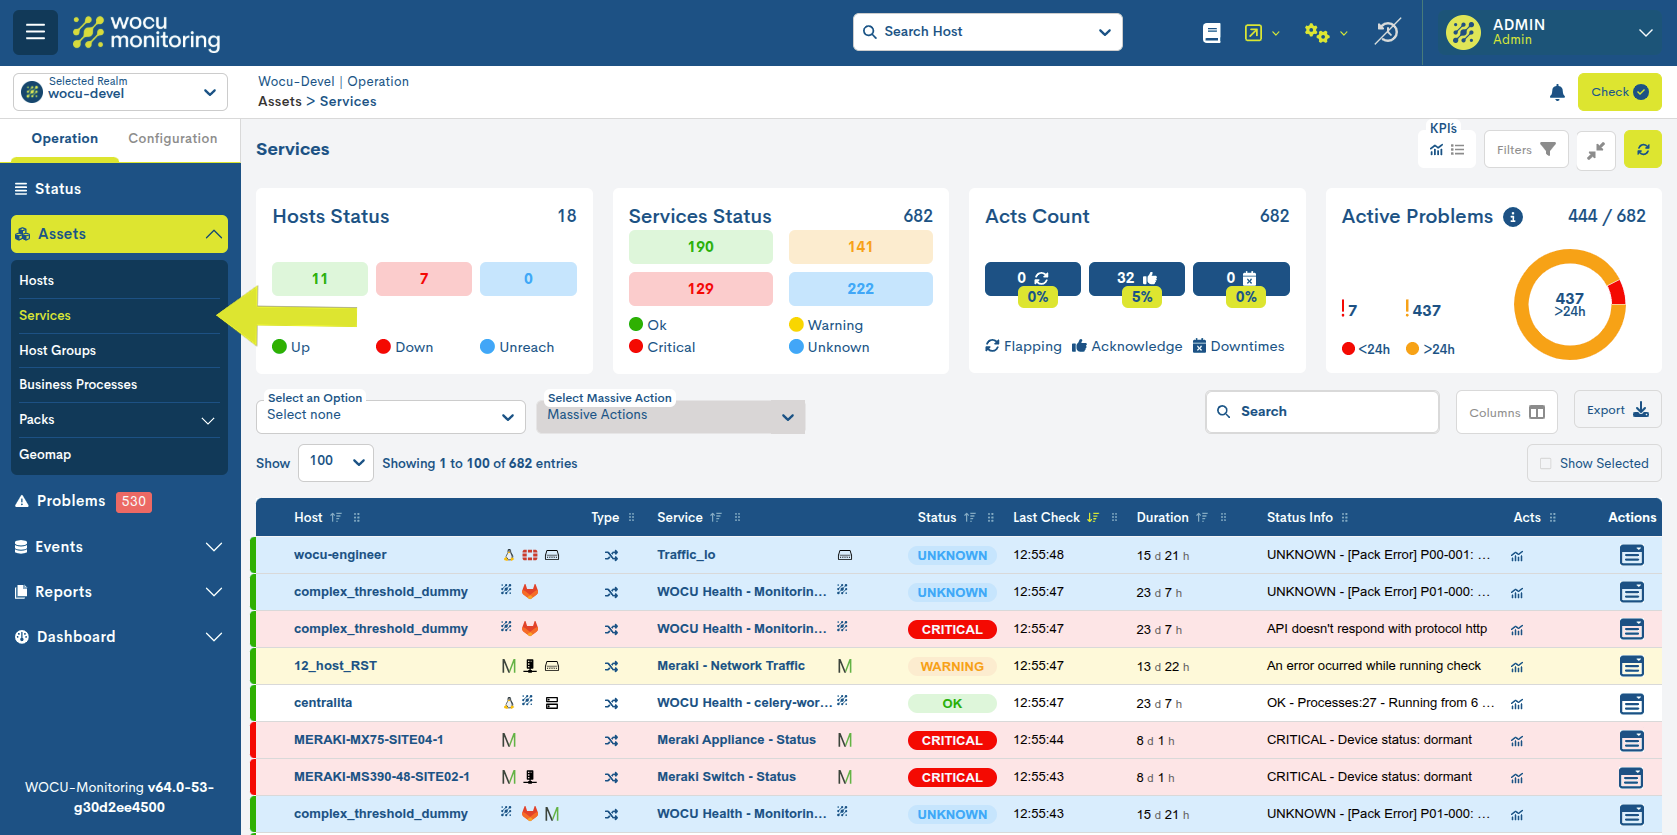
Services Inventory
This section contains the complete list of Services associated to network hosts that are being monitored in WOCU. By drilling down into each of the existing Services, a more in-depth analysis in terms of availability is achieved.
In addition to linking Services and Hosts, the view includes specific information on the operational status of the Service, checks executed, as well as the output obtained.
Service Inventory Fields
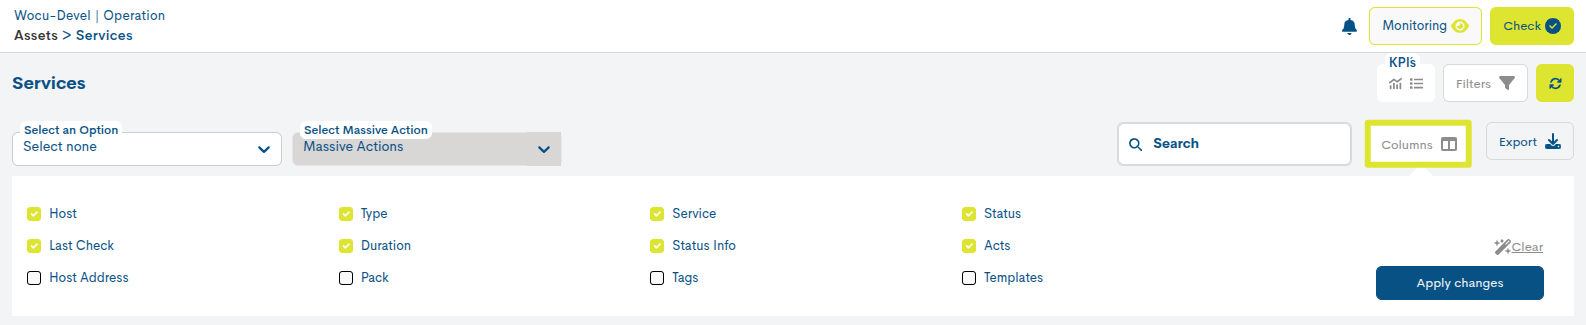
The display of inventory fields (columns) is configurable using the Columns option. This feature allows the user to dynamically select which columns to display in the table view and which ones to remain hidden. More information at: Customizing table display: Columns.
Attention
There is a maximum restriction of 9 columns visible at a time,to preserve the readability and performance of the interface.
Además, la aplicación incorpora soporte para el redimensionamiento dinámico de columnas de la tabla, permitiendo al usuario ajustar manualmente el ancho de cada columna según las necesidades de visualización. Más información aquí.
The possible fields are:
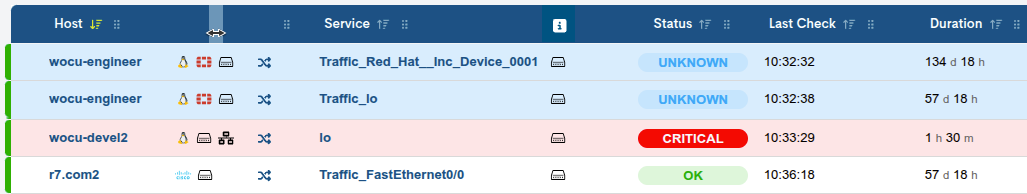
✓ Host: records the formal identifier of the Host to which the Service in question is associated.
Clicking on the name tag will redirect the user to the corresponding Detailed view of Hosts and Business Processes.
Clicking on one of the cells in the Host column will automatically select all the Services associated to the Host.
✓ Packs Icons (ℹ): only when the Host has Monitoring Packs associated, the system shall set after the name of the Host, identifying icons (of manufacturers, technologies, operating systems…) referring to these applied packs.
Placing the cursor over a particular icon will bring up a text alluding to the technology represented.
More information can be found at: 1. Display technology identification icons on Assets, Problems and Events pages..
✓ Type (ℹ): this field contains an icon identifying the type of Service according to its nature. The possible options are:
Independent services: identified by the crossed arrows icon.

Business Process Services (BP Services): identified by the icon of crossed arrows framed in a circle.

An icon represented by the capital letter P shall be assigned to identify Passive Services. This indicates that these services come from passive monitoring, via SNMP Traps.

This condition implies the following limitations:
Disabling the Enable active checks for service and Reschedule next check for this service actions executable on the service.
Disabling the Check Now button of the widget Status, blocking forced refresh for real-time service status.
✓ Service: records the name of the Service linked to the parent Host that heads the table row. Clicking on the name tag will take you to its corresponding Detail view of Services and Business Processes with detailed, complete and updated information about it.
Next to the name of the Service, the system displays identifying icons (for manufacturers, technologies, operating systems, etc.) related to Monitoring Packs. Placing the cursor over a specific icon will reveal text related to the represented technology.
✓ Status: through this field, WOCU informs about the current status (in terms of availability) of the Service. There are four basic statuses:
OK
Critical(Critical)
Warning(Warning)
Unknow(Unknown)
For better compression, the background colour of each row of the Status column corresponds to one of the possible statuses that the Service can reach. For example, a pink colour for those Services in Critical status. More information can be found in: Statements of Assets in WOCU.
✓ Last Check: this field records the exact time of execution of the last Service status check.
✓ Duration: this field indicates how long the Service has been in the registered state after the last check.
✓ Info: output message obtained with information related to the current status of the Service. The nature of the messages will vary depending on the type of asset and its configuration.
When the text exceeds the available space and appears truncated (…), the user will be able to consult its detail through a pop-up text when placing the cursor over this field.
✓ Icons associated with the service (ℹ): This column provides visual information for the user in the form of icons. The icons located furthest to the left indicate whether Acciones have been applied to the corresponding item in that row.
These icons directly correspond to those used in the Acciones column, which will be described later.
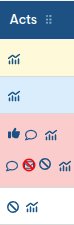
You can easily find out the meaning of these icons by hovering your cursor over them.
Attention
Clicking on the metrics charts icon will redirect the user to the Metrics section.
✓ Tags: Tags assigned by WOCU-Monitoring after the import or discovery of the Device. These tags correspond to the type of Device automatically determined by the tool, typically the Operating System or manufacturer. To view this field, use the Columns function.
When the text exceeds the available space and appears truncated (…), the user will be able to consult its detail through a pop-up text when placing the cursor over this field.
✓ Templates: Tags that inform the user about the configuration templates used and assigned to the device. To display this field, use the Columns function.
When the text exceeds the available space and appears truncated (…), the user will be able to consult its detail through a pop-up text when placing the cursor over this field.
✓ Packs Icons(ℹ): Tags that inform the user about the monitoring profile configuration assigned to the device.
To view this field, use the Columns function.
When the text exceeds the available space and appears truncated (…), the user will be able to consult its detail through a pop-up text when placing the cursor over this field.
✓ Host Address: This field contains the IP address of the Device. To view this field, use the Columns function.
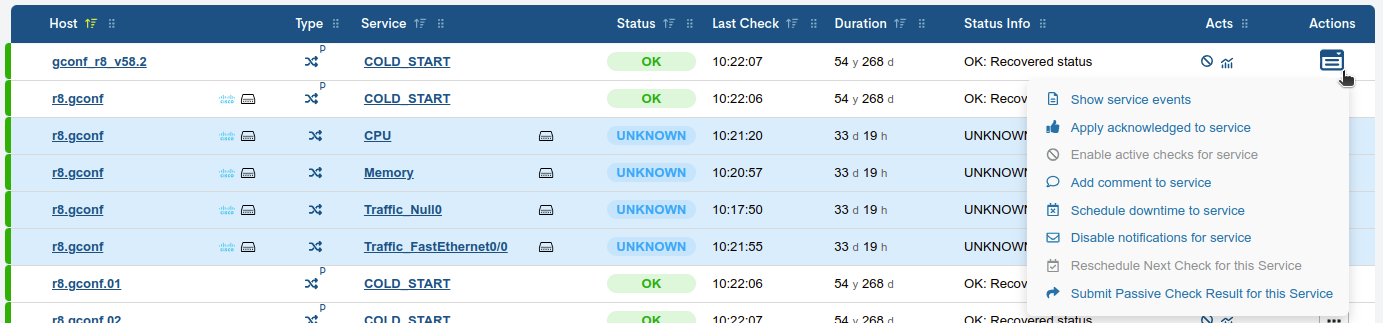
Actions on inventoried services (ℹ)
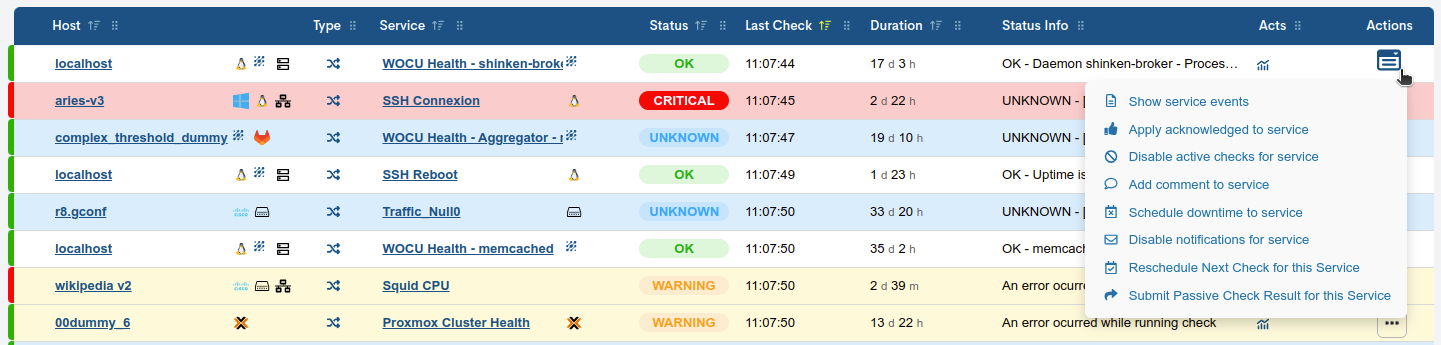
Show services events
The system shall display the Show services events action in the first position.
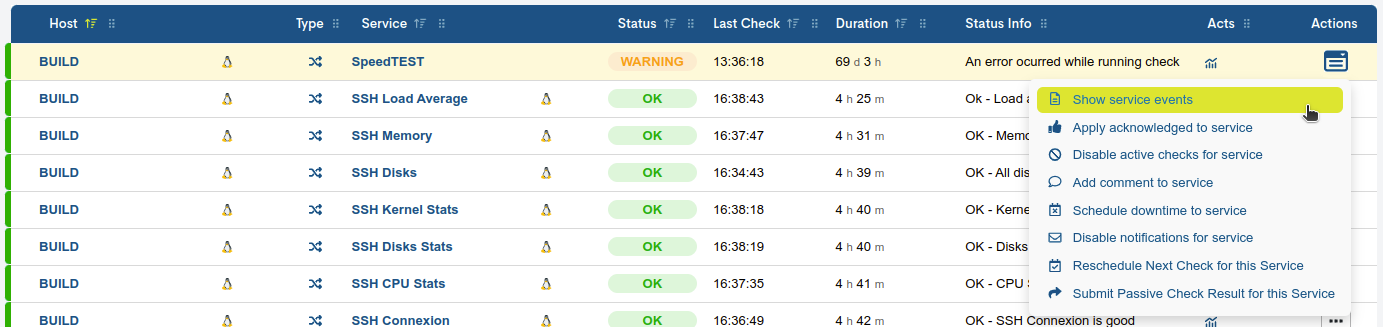
Activating the function will result in a view of the Service’s own events, collected over the last twenty-four hours.
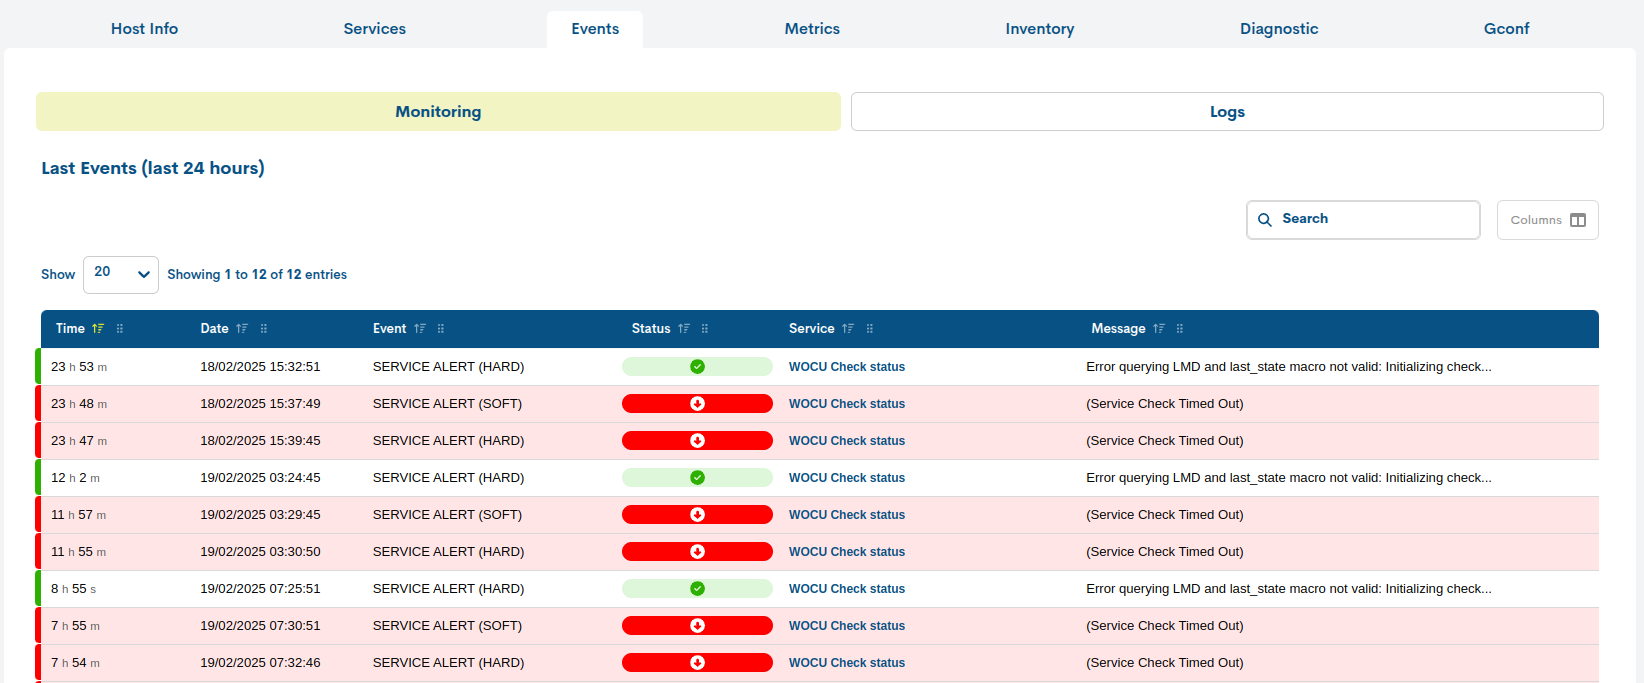
This view is explained in detail in Events, as it provides the user with information similar to that provided in the above referenced section.
Attention
The Show Service Events action performs a simple event query without affecting the operation and display of Problems.
Apply acknowledged to service
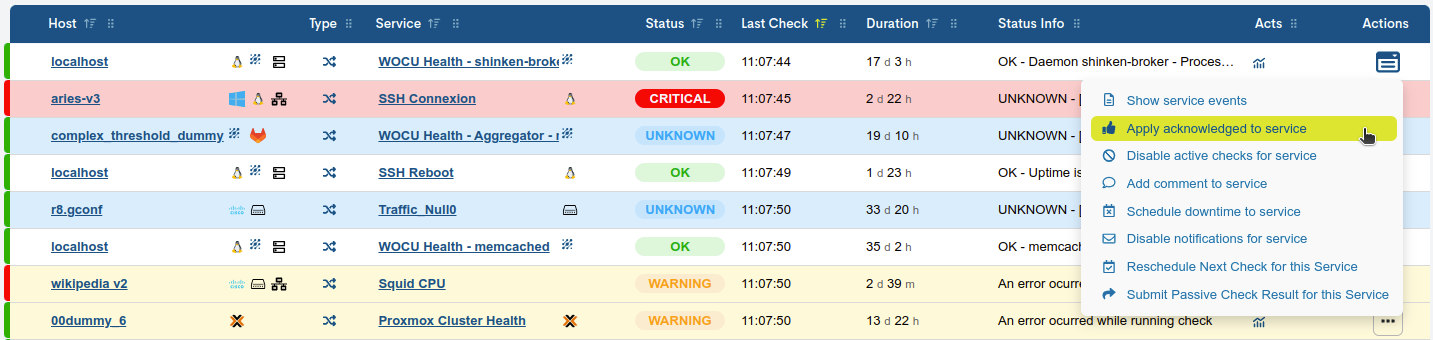
The Apply acknowledged to Service option will set the acknowledgement label to the assigned Service. Once this action is applied, the Service will show the thumbs-up icon in the column of icons and graphics mentioned above. This will make it easier to know in advance which Problems have already been dealt with and which have not.
After selection, a small window will appear with a form where the user can record in more detail the operation to be completed, as well as modify the treatment of the Problems in future occurrences.
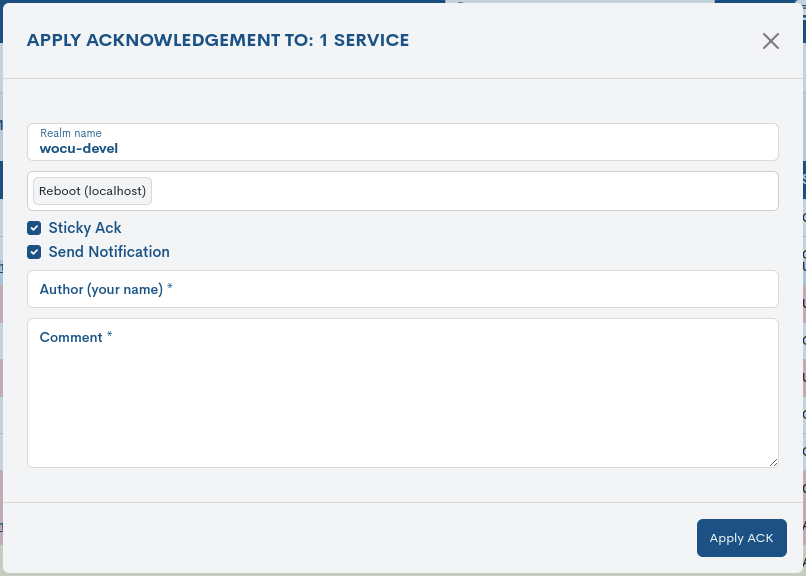
The configuration form has the following fields:
Realm name: Field automatically filled in by the system with the Realm to which the Service corresponds.
Service name: Field automatically filled in by the system with the name of the Service in the tool.
Sticky Acknowledge (Sticky Ack): Selectable option to preserve acknowledgement of Service Alarms in future occurrences until the option is disabled. The option shall prevent constant acknowledgement of an Alarm in the system, in case of repetitive problems already known to the operator.
Send Notification: Selectable option to send the notification preset in your configuration (email, SMS, etc.). The option will prevent constant sending of messages for an Alarm or in case of repetitive known problems.
Author your name: This is the space where the user must enter his/her name or identifier in order to register in the system who has acknowledged the Alarm in the Service.
Comment: This is the space in which the operator must enter a text explaining, generally, the reasons for the recognition action. This space will usually be used to note down the number of the incident generated, if working with a ticketing tool (incident log) or any other information considered appropriate to keep the other users of the monitoring tool informed.
Once you have completed (at least) the required fields, those marked with asterisks, by clicking on Apply ACK (Apply ACK) the recognition will be applied to the Service in question.
Note
Acknowledgement is a common task in the daily operation of alarm handling and WOCU-Monitorin integrates this function through this action.
To undo the acknowledged status, the Remove Acknowledged to Service option shall be selected. The user shall then be prompted for final confirmation.

Disable active checks for services
The option Disable active checks for services immediately suspends the active monitoring tasks that the system is performing on the Service in question.
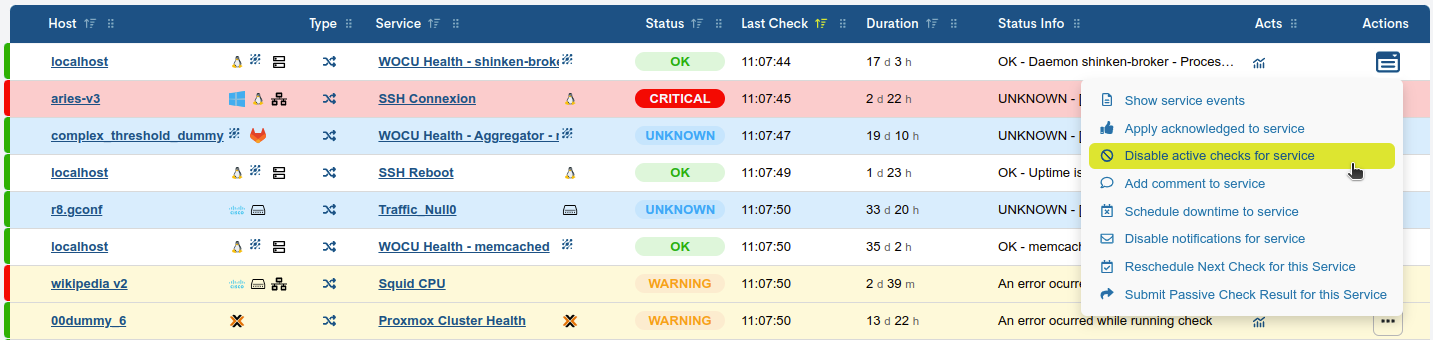
Active monitoring in WOCU-Monitoring is based on a set of checks performed to assess the connectivity of Hosts and the operational status of the Services associated to them.
Attention
This action shall not be available for passively sourced services, i.e. coming from passive monitoring via SNMP Traps. This blocking also extends to Masive actions.
Once this action has been applied, the Service will show the icon of the prohibition signal in the column of icons and graphics discussed above. This will make it easier to know in advance which Services have the active monitoring option disabled.
Whether you disable or re-enable active monitoring of a Service, the system will display the following notification:
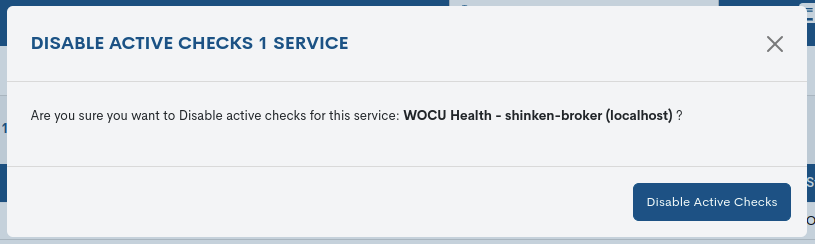
(“Are you sure you want to disable active checks for this service: [Service Name (Host Name)]”).
Add comment to service
The Add comment to Service option in Services allows you to reflect information as a note associated with a particular Service.
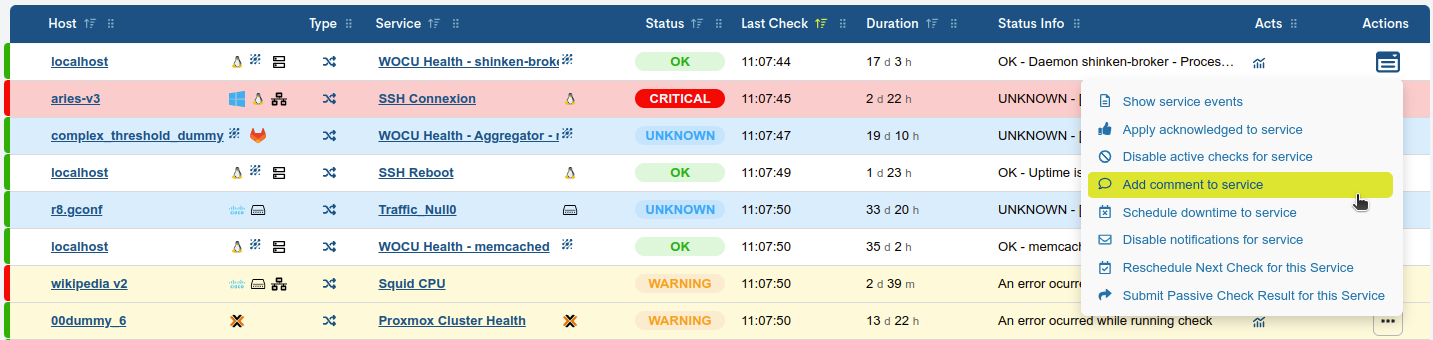
Once this action has been applied, the Service will display the speech bubble icon in the icons and graphics column discussed above. This will make it easier to know in advance which Services have notes or comments.
Attention
This option can be used to record an important event or circumstance relating to the Service. It is a very useful tool for transmitting and sharing information through work teams that share the use of the tool. It is also useful as a reminder.
Once the option is selected, a small window will pop up with a form where the user can register the note he/she wishes to add.
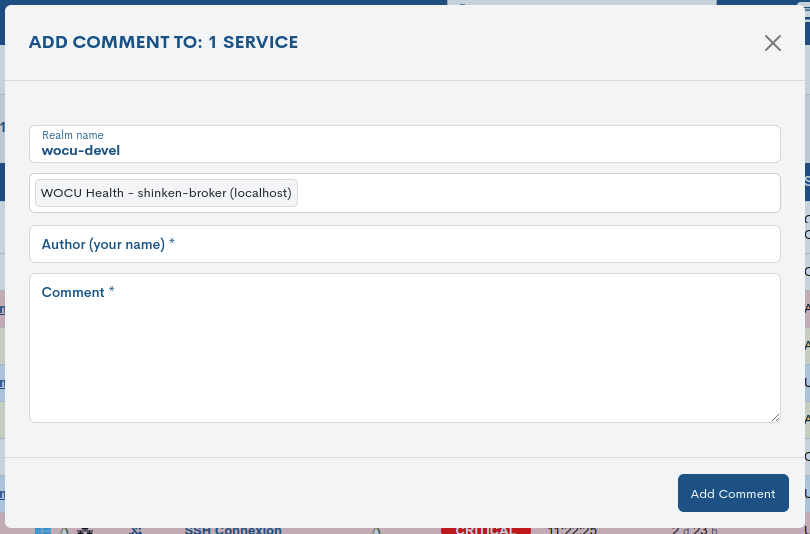
The available configuration fields are:
Realm name: Field automatically filled in by the system with the Realm to which the Service corresponds.
Service name: Field automatically filled in by the system with the name of the Service in the tool.
Author your name: This is the space where the user must enter his or her name or identifier so that the system records who the author of the comment is.
Comment: This is the space in which the user must enter the text of his or her note or comment. Normally this space will be used to write down any relevant information about the Service that the user considers important to share with the rest of the users of the tool.
Once you have completed (at least) the required fields, those marked with asterisks, by clicking on Add Comment the comment will be registered in the Service in question.
Comment management overview
Having selected several Services for the simultaneous display of their comments (via the selector Massive actions on inventoried services), the system will present the following management view:
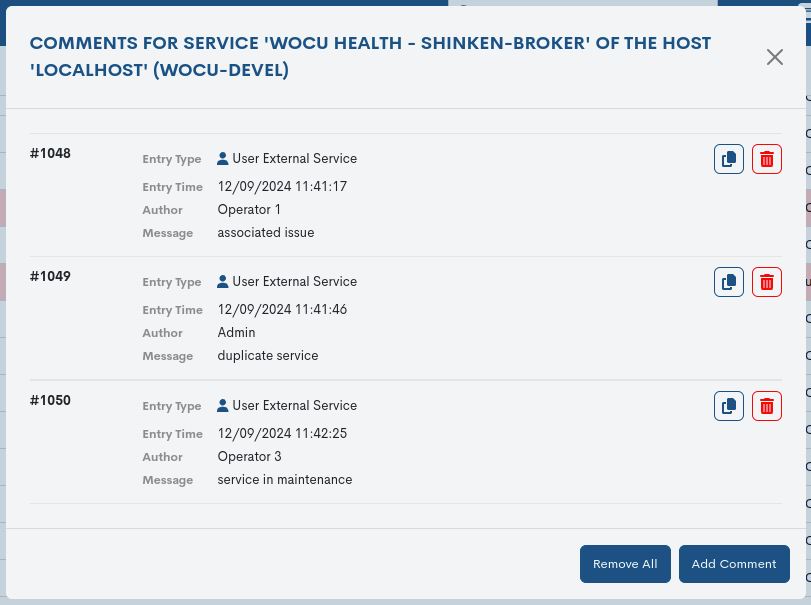
In this space there are different modalities for the definitive deletion of comments:
1. Deletion of an individual comment:
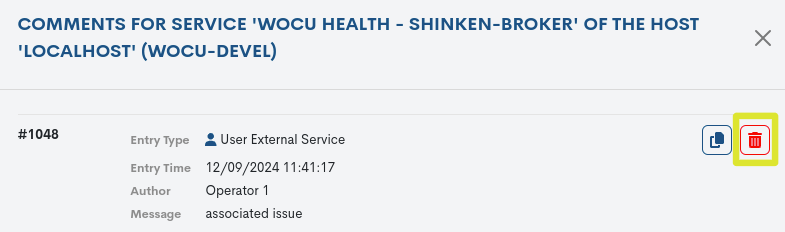
Comment with Id 1048 associated with WOCU-Health Service is removed - Shinken-Broker from Localhost Host.
2. Bulk deletion of comments via the Remove All button:
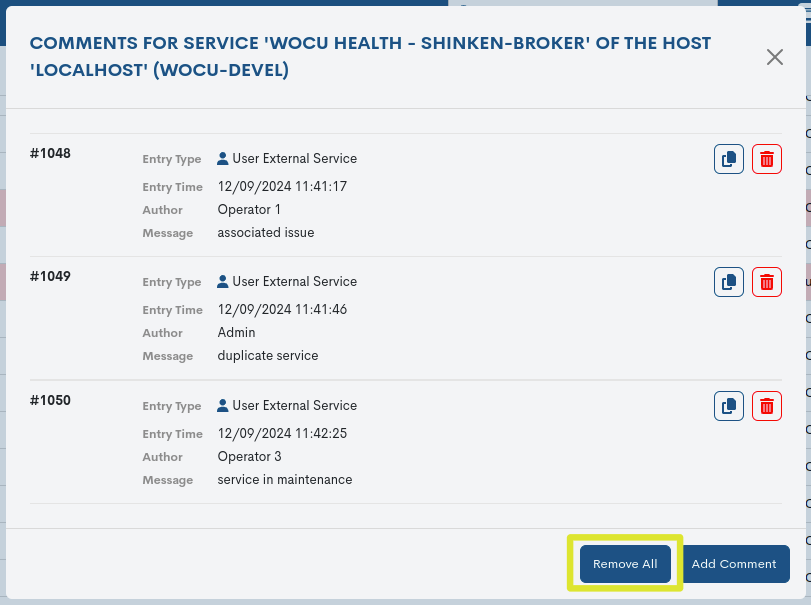
Removed comments with Id 1048, 1049, 1050 associated with the WOCU-Health - Shinken-Broker Service on Localhost Host.
Schedule downtime to service
The Schedule downtime to service option allows to inhibit for a certain period of time the warnings and alarms of a Service that is going to suffer a downtime or other known and/or planned event that will affect the status of the Service.
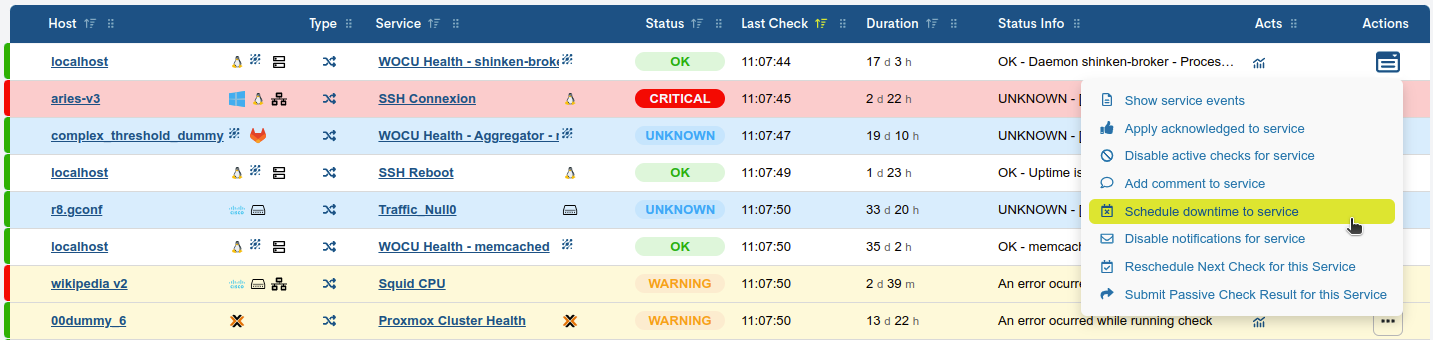
Once this action has been applied, the Service will display a calendar icon in the icons and graphics column discussed above. This will make it easier to know in advance which Services are scheduled to temporarily inhibit Problems in the system.
Note
This tool is very useful in the case of interventions or scheduled maintenance in which a generation of Problems in Services is foreseen. This will avoid the processing and study of these incidents in front of the Alarms console when the intervention or event takes place.
Selecting the option will pop up a small window with a form where the user can set the Problems disable period.
The following is the downtime scheduling window for a Service:
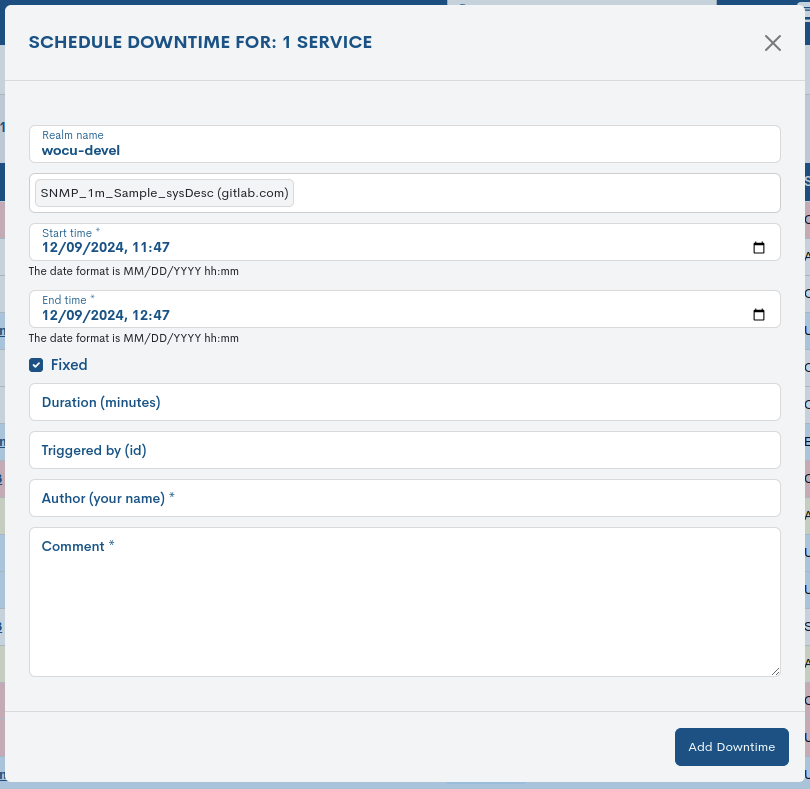
The Schedule Drop Time window has the following fields:
Realm name: Field automatically filled in by the system with the Realm to which the Host corresponds.
Service name: Field automatically filled in by the system with the name of the Service.
Start time: Field in which the programming start date and time must be entered. From this moment on, the Alarms associated with the Service will not be displayed (according to the previously established configuration).
End date (End time): Field in which the end date and time of the programming must be entered. From this moment on, the Alarms associated with the Service will be displayed again (according to the previously established configuration).
Attention
The date format is as follows: yyyyy-mm-dd hh:mm (yyyy-mm-dd-hh:mm) with
yyyyyybeing the four digits of the year,mmthe two digits of the month,ddthe two digits of the day,hhthe two digits of the hour andmmthe two digits of the minutes. Between each of the date elements (year, month and day) enter a hyphen (-) as a separator character, then a space and then the time, separating hours and minutes with a colon (:). If any of the elements has only one digit, fill the other digit with a zero to the left.Example for 3 February 2021 at half past one in the morning:
2021-02-03 01:30.Fixed: This checkbox (checked by default) disables the following Duration Minutes (Duration Minutes) field and preserves the time interval set in the Start time (Start time) and End time (End time) parameters, i.e. the exact duration of the scheduled drop.
Duration Minutes: If the previous option is unchecked, the time in minutes that the planned drop will last for the Services from the Start time (Start time) can be configured. By setting the drop time in this way, it shall not be necessary to indicate the End time (End time). From the set start time, the system shall activate the downtime as soon as the Service changes its monitoring status.
Triggered by id: By entering the
IDof another programmed downtime (Id of another downtime), the present downtime is programmed according to a previously existing downtime. When that one is activated, this one shall also be activated.Author your name: This is the space in which the user must enter his or her name or identifier so that the system records who is the author of the programming.
Comment: This is the space in which the user must enter a comment relating to the established schedule. Normally this space will be used to note the circumstances that could cause the Alarms and for which the programming is established.
Once (at least) the required fields, those marked with asterisks, have been completed, by pressing Add Downtime the programming will be activated in the system, disabling the Alarms in the set period.
Disable notifications for service
The system offers a configurable notification service through different communication channels (email, SMS…). To disable the notifications relevant to a Service, you must select the option Disable notifications for service (Disable notifications for service).
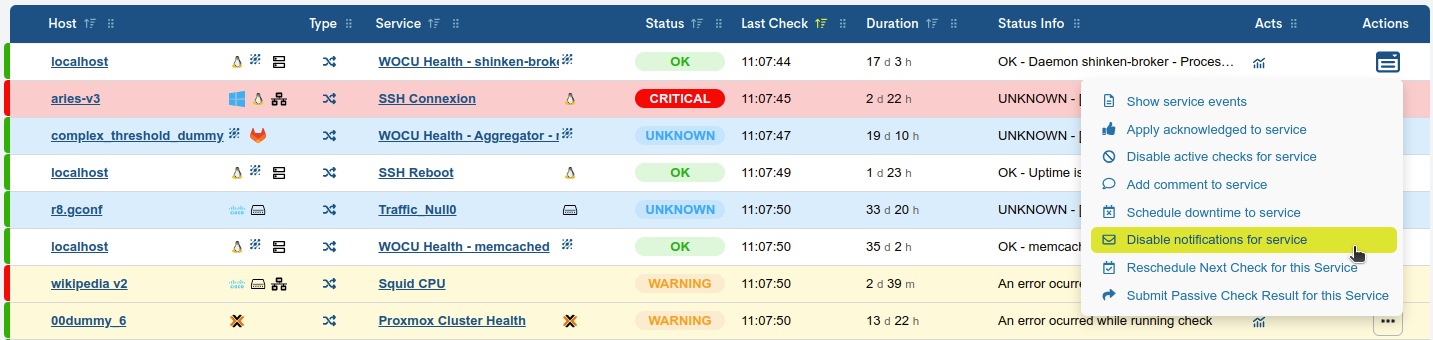
The icon of a prohibition sign with an envelope inside it located in the icons and graphics column will be displayed when the function is enabled. In this way, it will be easier to know in advance which Services have programmed the interruption of sending messages due to Alarms in the system.
Important
The type of notification, the medium and the recipients depend on the notification settings made by your Administrator.
Note
This option is very interesting for a wide variety of situations where it is not desirable to alert the recipients of the notifications, either because of a known problem being resolved, scheduled maintenance or any other event that is best ignored.
By selecting the option, the following confirmation window for disabling Alarms will appear. By clicking on the Disable button, the sending of Service messages will be interrupted.
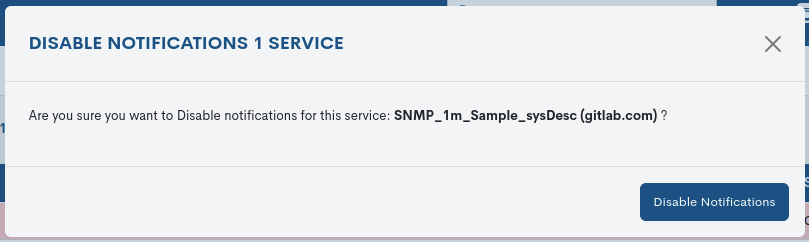
To re-enable the sending of notifications in a disabled Service, select the option Enable notifications for service in the service you wish to re-enable.
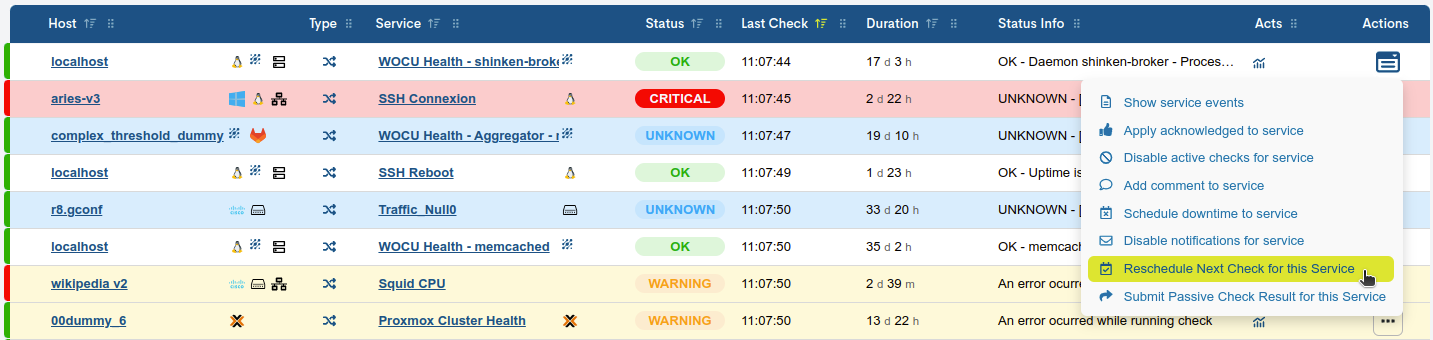
Reschedule next check for this service
By this action the user can force the system to perform an immediate check on a Service.
Attention
This action shall not be available for passively sourced services, i.e. coming from passive monitoring via SNMP Traps. This blocking also extends to Masive actions.
To reschedule the next check, this action must be selected from the menu. Once selected, a window will appear with a form in which the user can configure when the next check will be carried out for the selected Service. The configuration window is shown below:
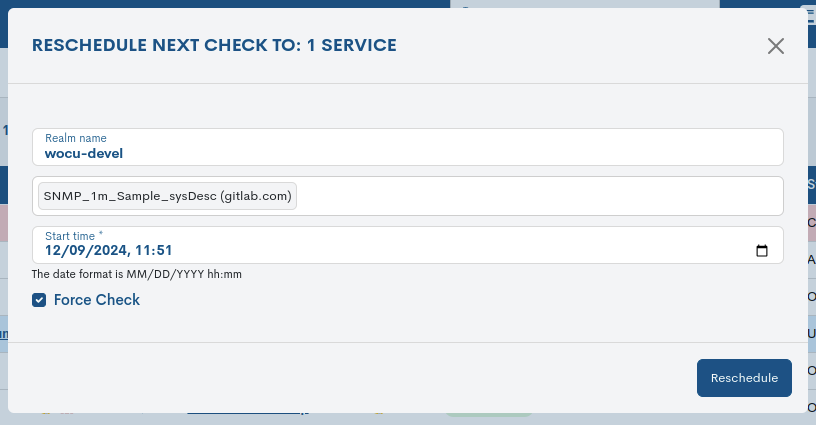
Realm name: Field automatically filled in by the system with the Realm to which the Service corresponds.
Host service name: Field automatically filled in by the system with the name of the Service in WOCU-Monitoring.
Start time: Field in which the date and time of the start of the reprogramming must be entered. The Service monitoring status check will be carried out at this precise time. By default, the date set will be the current date by adding one minute to the system time. Logically, WOCU-Monitorin does not allow entering a date for the next check that is older than the current date.
Important
The date format is as follows: yyyy-mm-dd hh:mm (yyyy-mm-dd- hh:mm) with yyyy being the four digits of the year, mm the two digits of the month, dd the two digits of the day, hh the two digits of the hour and mm the two digits of the minutes. Between each of the date elements (year, month and day) enter a hyphen (-) as a separator character, then a space and then the time, separating hours and minutes with a colon (:). If any of the elements has only one digit (e.g. 3 February), fill in the other digit with a zero to the left. Example for 3 February 2017 at half past one in the morning: “2017-02-03 01:30”.
Force Check: The checkbox allows you to force the system to run the check at the time set in the user’s manual reprogramming even when automatic programming is already nearby.
Clicking on the Reschedule button will proceed to perform the check on the Service at the set date and time.
Submit passive check result for this service
This action allows the user to manually send the result of a Service check to the system.
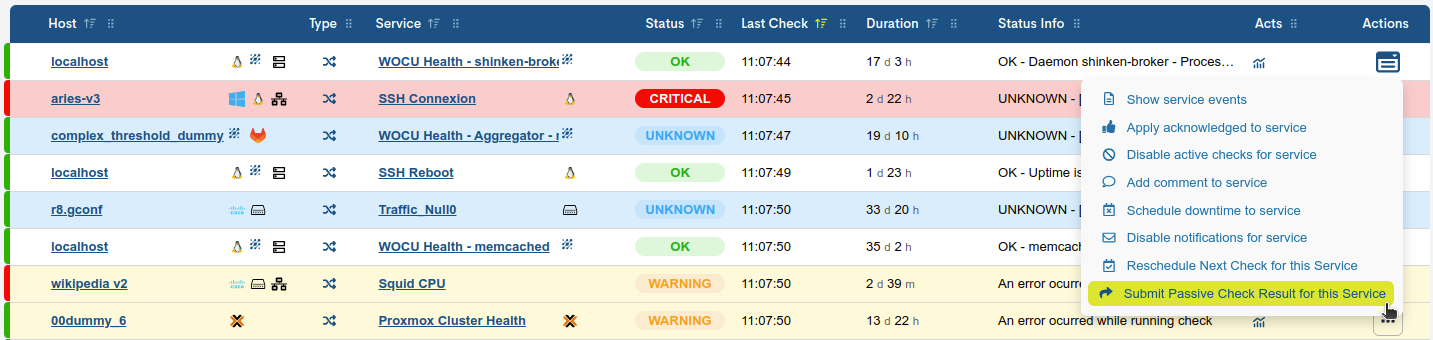
To manually send the result of a test, select this action from the menu. Once selected, a window will appear with a form in which the user can configure the test that will be sent to WOCU-Monitorin.
The passive check results sending window has the following configuration fields:
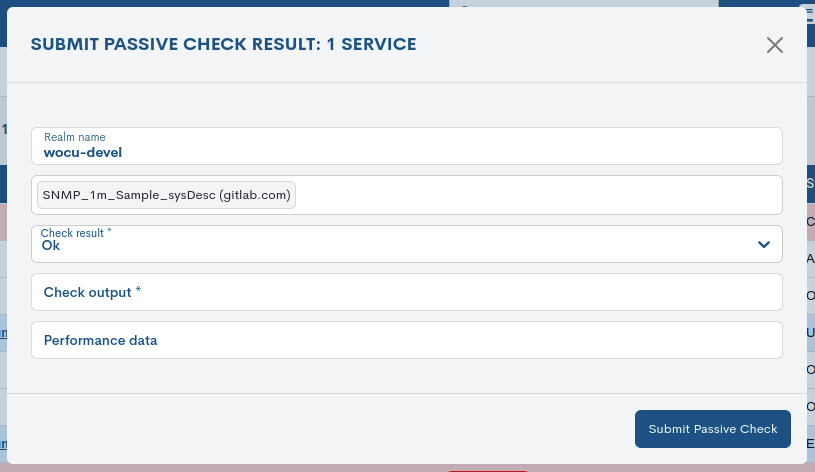
Realm name: Field automatically filled in by the system with the Realm to which the Service corresponds.
Host service name: Field automatically filled in by the system with the name of the Service in WOCU-Monitoring.
Check Result: Field to select one of the options from the list corresponding to one of the Statements of Assets in WOCU.
Check output: Field containing the message associated with the status of the check and describing the nature of the check. In the case of automated checks, the check output would be the message returned by the system after executing a particular check command. Typical examples of such messages would be:
PING OK,PING DOWN;100% packets loss,70% memory free, etc. Since this is a manual sending, the user is free to choose the message text associated with the status, which is also manually determined by the Check Result field.Performance data: Field containing some value entered manually by the user, which the system can process a posteriori (post-process). This type of values, generally obtained automatically, are used and stored in the metrics. For example, after executing a check command, an automatic Check output is obtained like this:
70% memory free. Once this output is obtained, this output and its value will be stored in the system metrics by setting the following format:mem_free=70. This data is retrieved by the same system check command and post-processed. In this way, through the Performance data field, the user is provided with the possibility to enter data into the WOCU-Monitoring metrics manually.
After completing (at least) the required fields, those marked with asterisks, by pressing Submit (Submit) the result entered manually by the user will be sent to the WOCU-Monitoring engine and will be processed in the same way as if the check had been performed automatically by the system itself.
Note
This action is useful when you want to simulate crashes or other events in WOCU-Monitoring. Also if you want to test or simulate certain conditions and display certain data. You can also use this option to manually force the status of an asset on which you have previously applied the Disable Active checks action.
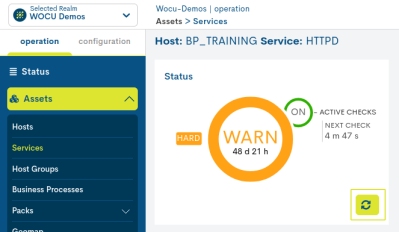
KPI`S
This area displays a series of panels with key performance indicators (KPIs) and the operational status of the assets present in the inventory.
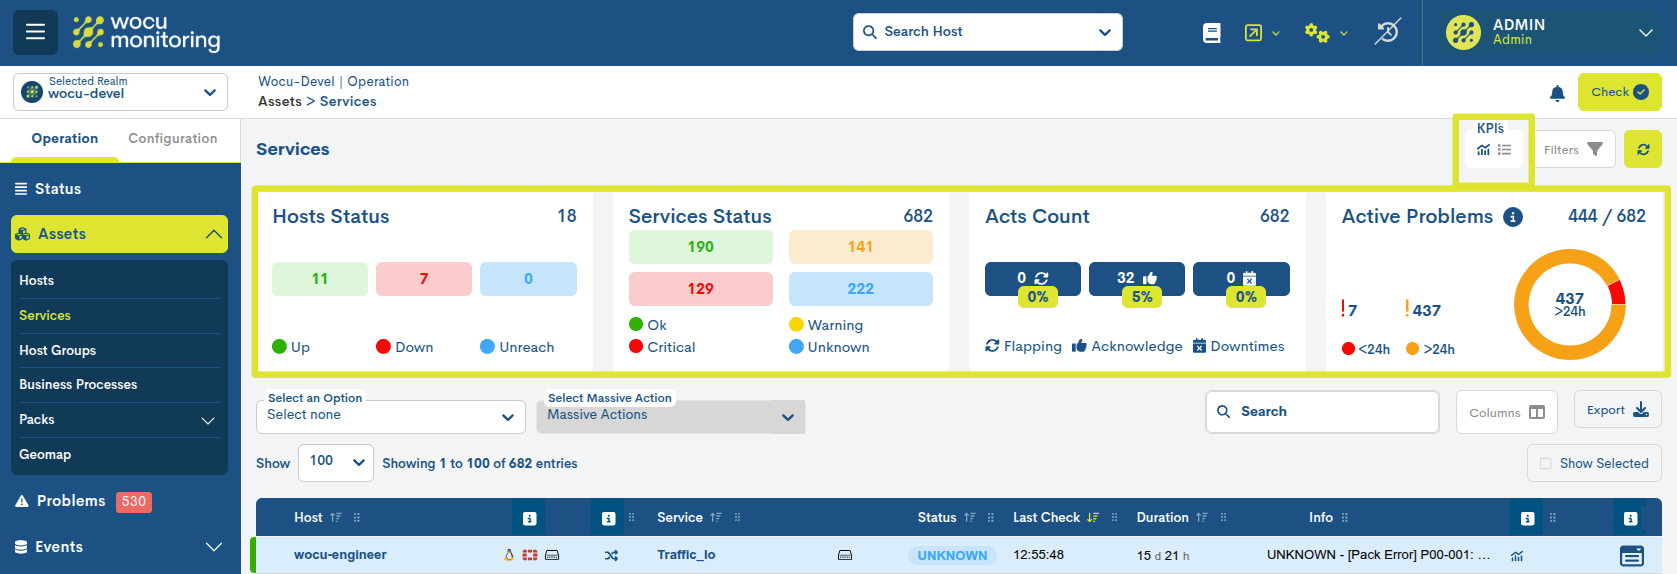
KPIs can be viewed in two possible ways:
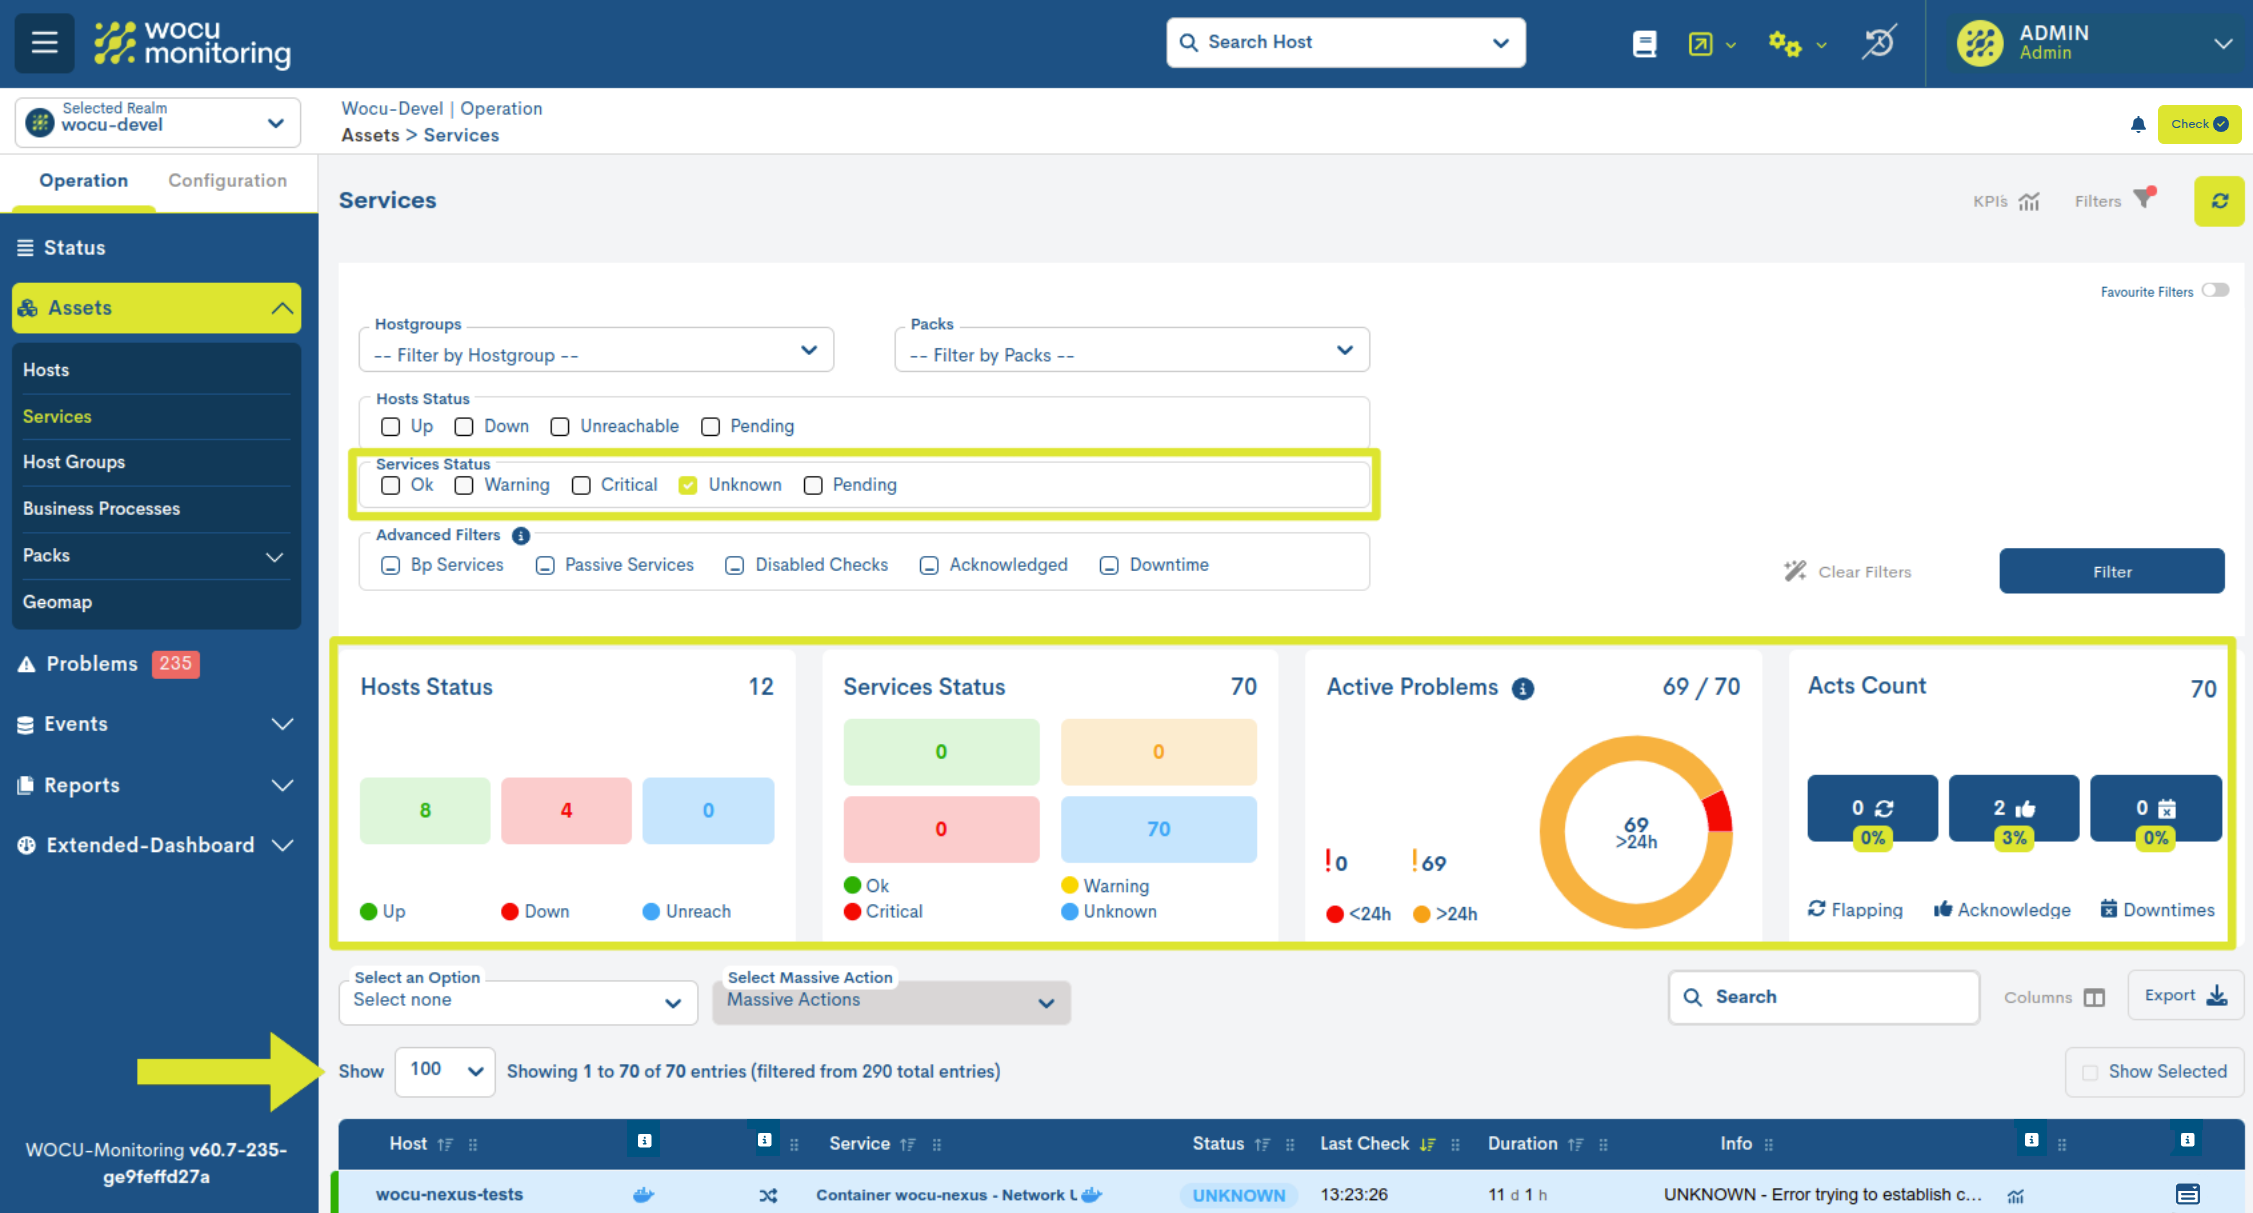
Full view
By activating the icon marked in the following image, the following KPIs are displayed, with detailed data and interactive charts:
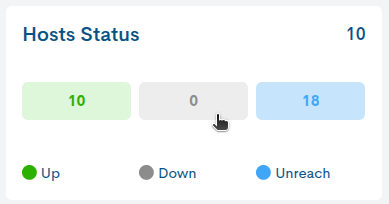
Hosts Status
Host count from the inventory according to the current monitoring status.
This information is key to assessing the overall health of the infrastructure and prioritizing interventions on the most critical devices.
Note
This KPI acts as an interactive filter: by clicking on any of the monitoring status, the table automatically updates to show only the assets corresponding to that state.
When one or more states are deactivated, the corresponding buttons fade to gray, visually indicating that they are inactive. To reactivate a previously disabled state, simply click on it again.
By default, the table displays assets from all possible states until the user interacts with one of the filters.
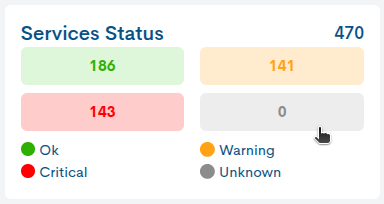
Services Status
Count of services associated with devices in the inventory based on the current monitoring state
Note
This KPI acts as an interactive filter: by clicking on any of the monitoring status, the table automatically updates to show only the assets corresponding to that state.
When one or more states are deactivated, the corresponding buttons fade to gray, visually indicating that they are inactive. To reactivate a previously disabled state, simply click on it again.
By default, the table displays assets from all possible states until the user interacts with one of the filters.
Active Problems
A pie chart represents the total number of services that have registered some type of incident and are therefore not available (in OK status). In addition, a distinction is made according to the time at which the incidents occurred (<24 hours and >24h).
According to the image above, 214 services out of the total (290) are not available (status OK) and have registered some type of incident more than 24 hours ago. On the other hand, there are 2 services with incidents registered in the last 24 hours. For more details, see Problems.
This KPI is vital for identifying prolonged incidents that could impact overall performance or cause serious outages.
Important
By hovering over the information button, a message will appear indicating that assets under the Acknowledge, Downtimes or Disable checks actions are not included in this widget.
Acts Count
This panel collects the following three key parameters for provide a comprehensive view of the status of services:
Flapping Status: Count of inventory assets experiencinga rapid alternation of changing monitoring states, knownlike Flapping.
Acknowledge: Inventory asset count with Apply acknowledged to service action applied, allowing trackingefficient of the incidents recognized and in the process of resolution.
Downtimes: inventory asset count with Schedule downtime to service action applied, optimizing the organization of tasksmaintenance and reducing unplanned downtime.
It should be noted that these KPIs are not fixed, as they are updated and adapted based on the filters applied to the list. This allows the data displayed to always reflect the most relevant information according to the selected criteria.
See the following example:
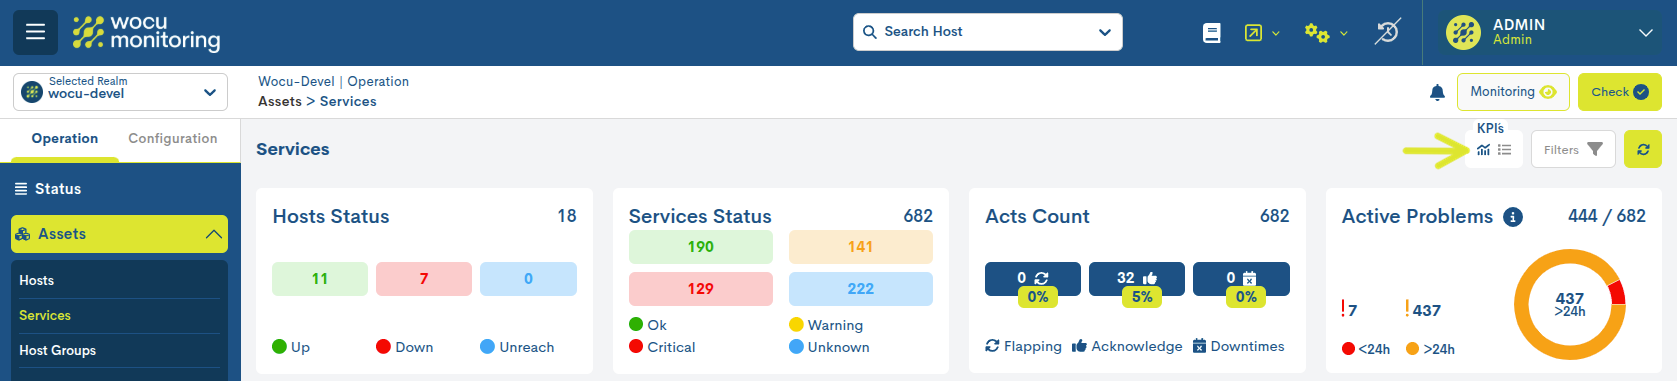
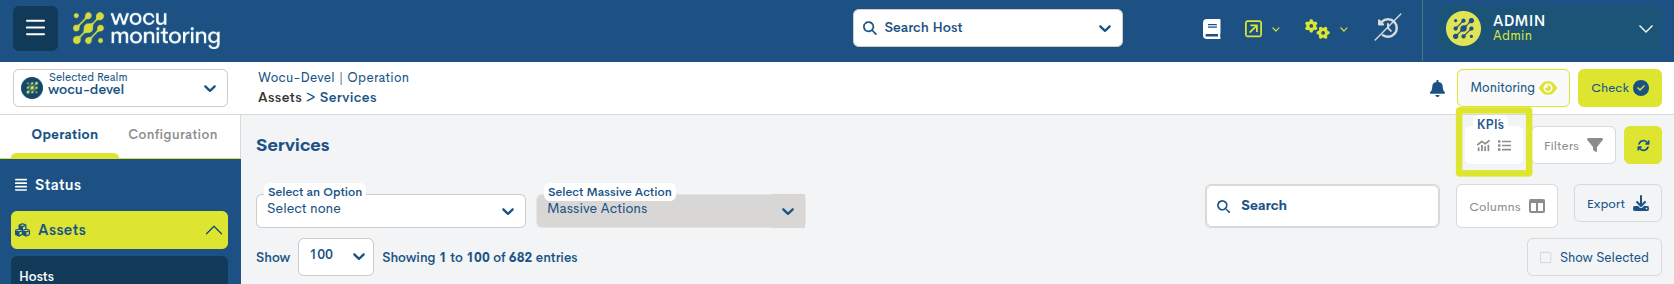
Summary view
By activating the icon marked in the following image, the previous KPIs are displayed, but in a more compact format for quick reading:
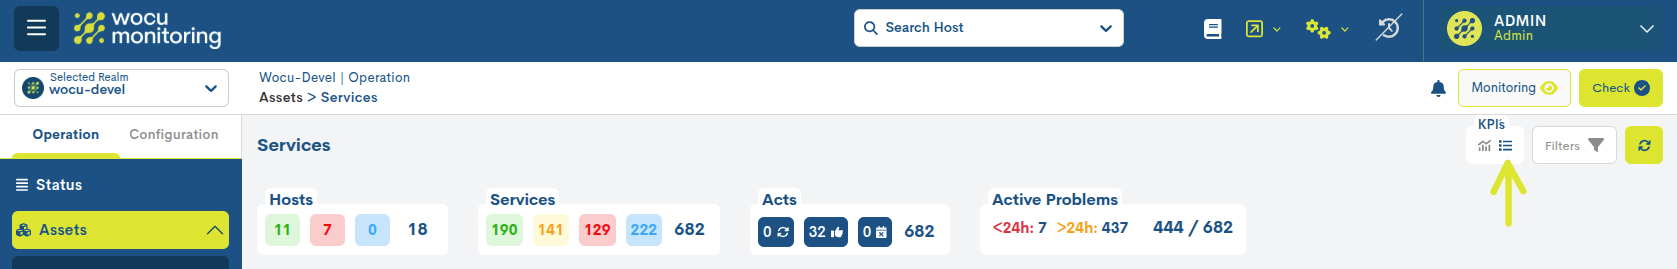
Likewise, it is possible to hide the panel block by toggling both buttons.
Botón para ocultar filtros
Con el objetivo de ofrecer una interfaz más limpia y enfocada, a través de este botón es posible ocultar el bloque de filtros de la vista, dando prioridad a la visualización de la tabla principal.
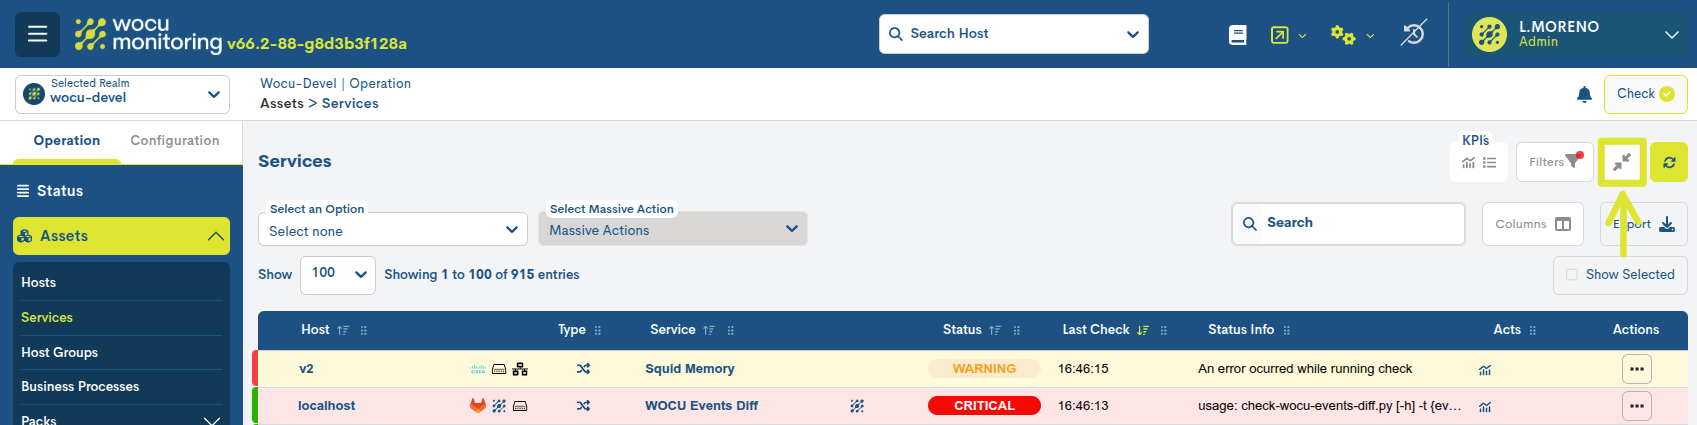
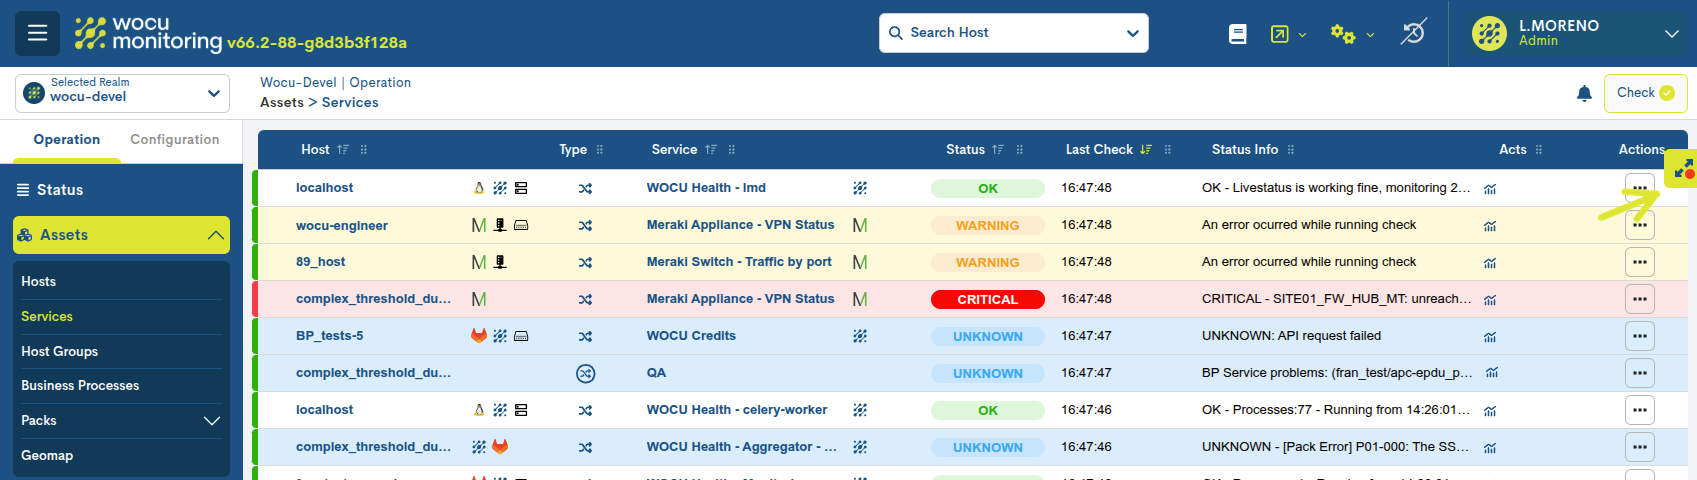
Una vez activado, se mostrará un botón lateral fijo que permite volver a desplegar el panel oculto en cualquier momento, garantizando un acceso rápido y flexible a las opciones de filtrado.
Inventory Operational Options: Filters and Export
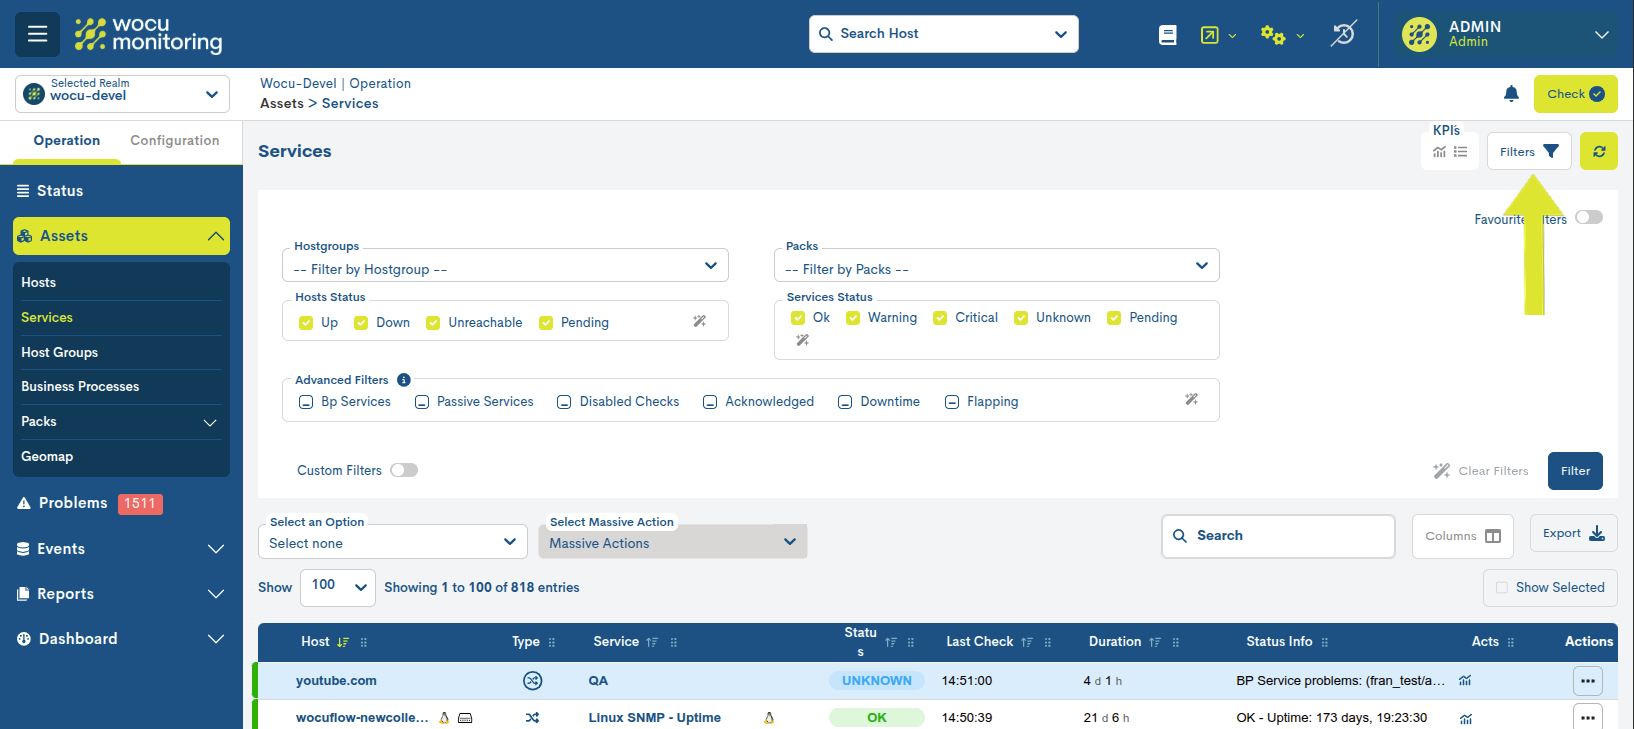
WOCU-Monitoring offers a series of very useful options that facilitate the management of monitored services. The combined use of filters and actions allows for more organized asset management in complex environments.
By default, all filtering options are hidden, leaving a larger, clearer space for viewing and reading data. Simply click on the Filters option followed by the funnel icon (see image) and the available filters will be displayed.
Filtered by Host Group
The Filter by HostGroup selector modifies the display of the global Services inventory, showing only the Hosts and associated Services belonging to the Host Group chosen by the operator.
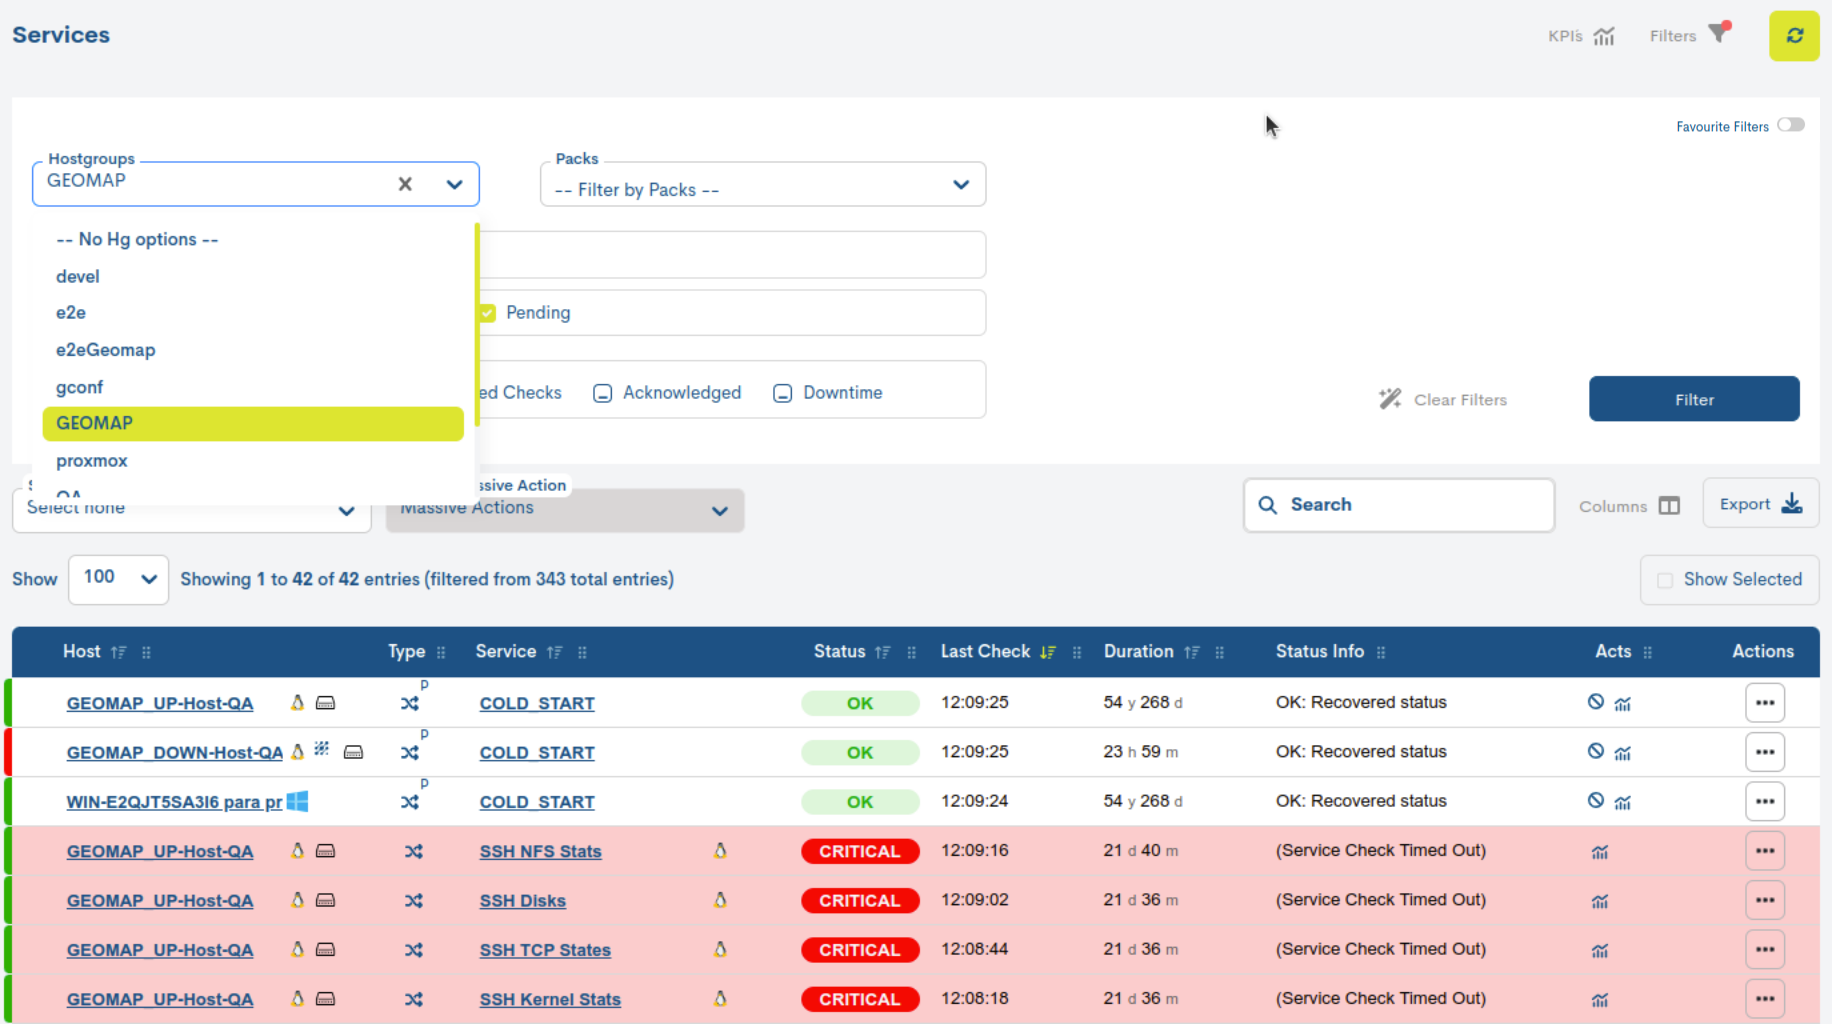
The drop-down lists all Host Groups managed in the current Realm.
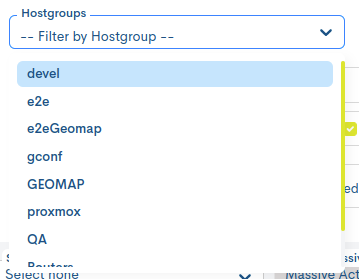
To deselect the filtered action and return to showing all Hosts, simply choose the first option from the drop-down menu (–Filter by HostGroup–).
To consolidate the desired configuration, it will be necessary to trigger the Filter button, to reload the inventory with the newly triggered data request.

Attention
The filter applied will be taken into account during the export (in CSV or JSON) of the displayed inventory.
Filtering by Monitoring Packs
This drop-down lists the Monitoring Packs that are being applied on the Hosts that are part of the Realm.
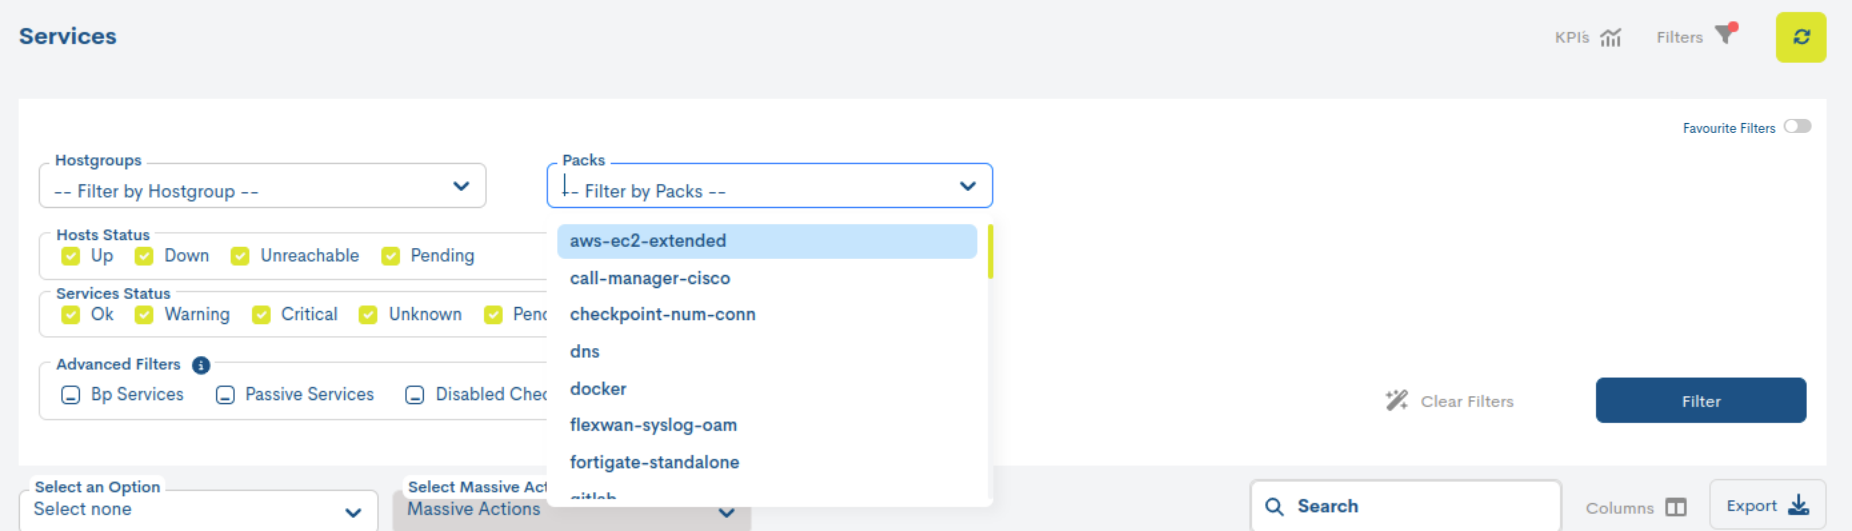
By selecting one of them, the table will be filtered by showing only the Hosts (Hosts) that make use of the chosen pack, as shown in the following image:
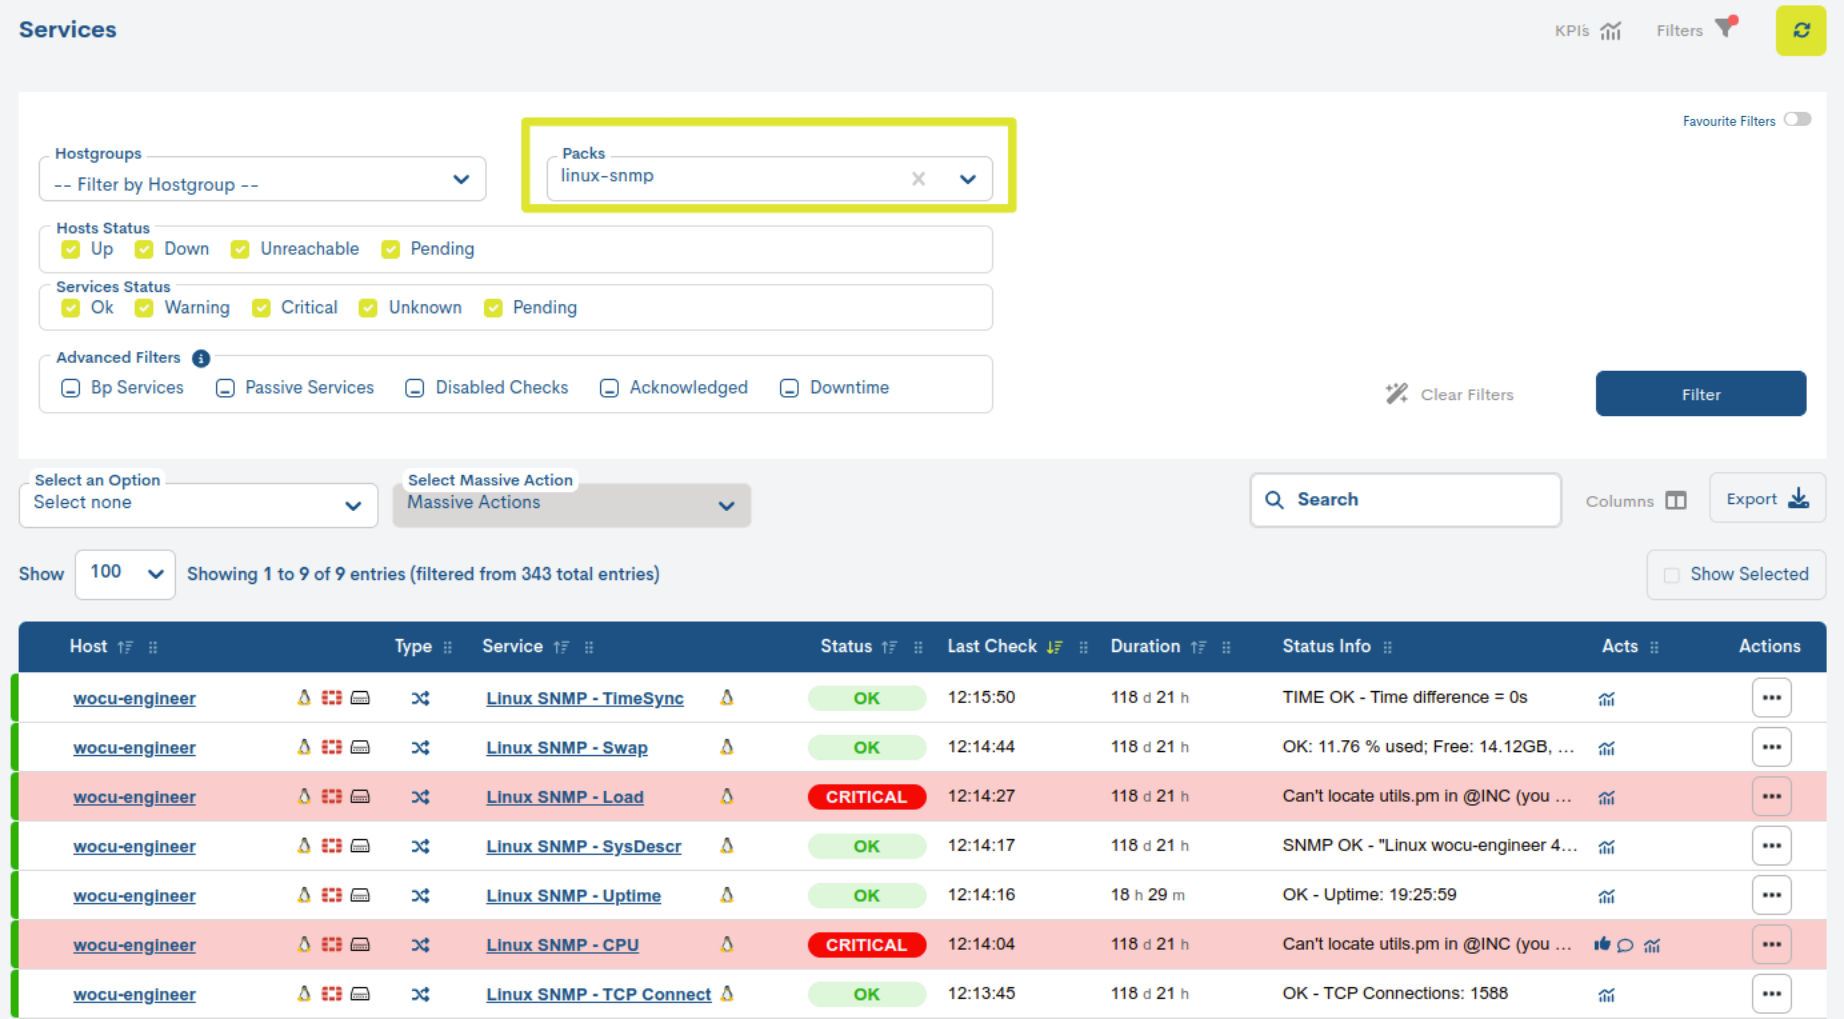
To consolidate the desired configuration, it will be necessary to trigger the Filter button, to reload the inventory with the newly triggered data request.
Attention
The filter applied will be taken into account during the export (in CSV or JSON) of the displayed inventory.
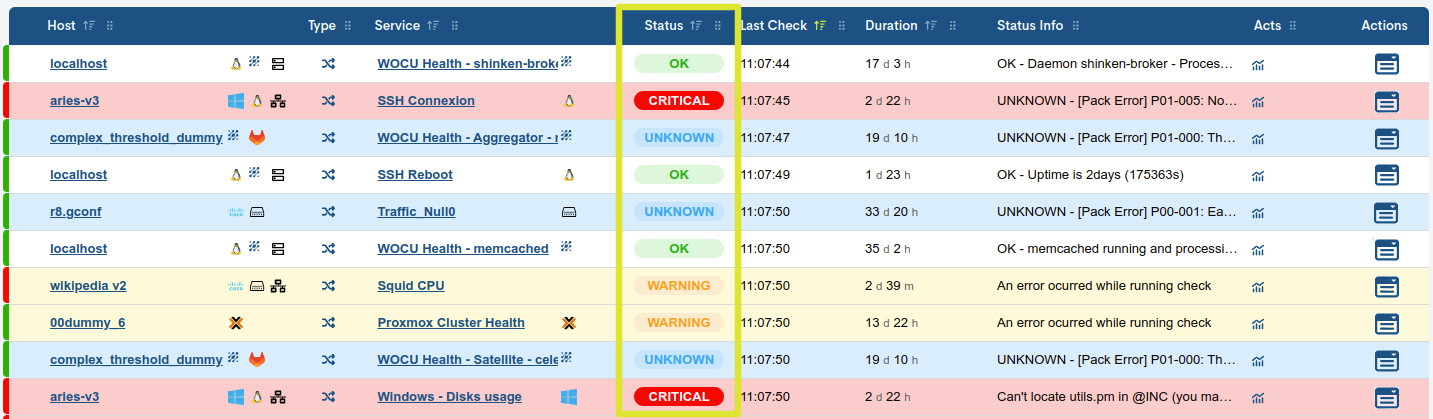
Filtering Assets by Status Type (Hosts Status and Services Status)
The Hosts Status and Services Status components modify the display of the global inventory of Services, depending on the monitoring status recorded on the assets (Hosts and their Services) listed.
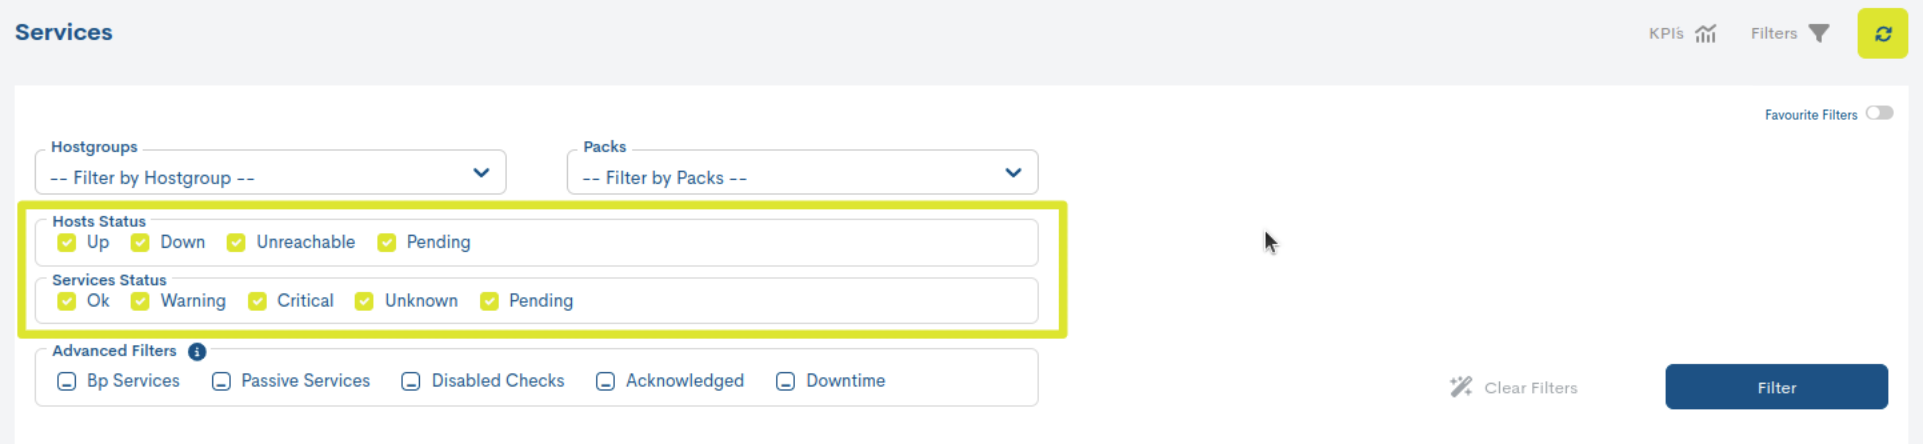
With this filtering function it is easy to choose items that are in a certain status. For ease of understanding, the boxes use colours already linked to the different status types. However, by placing the cursor over the box, a reminder of the status to be selected will be displayed. More information can be found in: Statements of Assets in WOCU.
By default, all boxes/status are checked, which indicates that the inventory is showing all Hosts and Services, without discriminating by any type of status. Its operation is very simple, clicking on a checkbox toggles the filtering option. Note that once the box is checked, it will show a tick (✓).
See the following example where only the box representing services in Warning status is enabled.
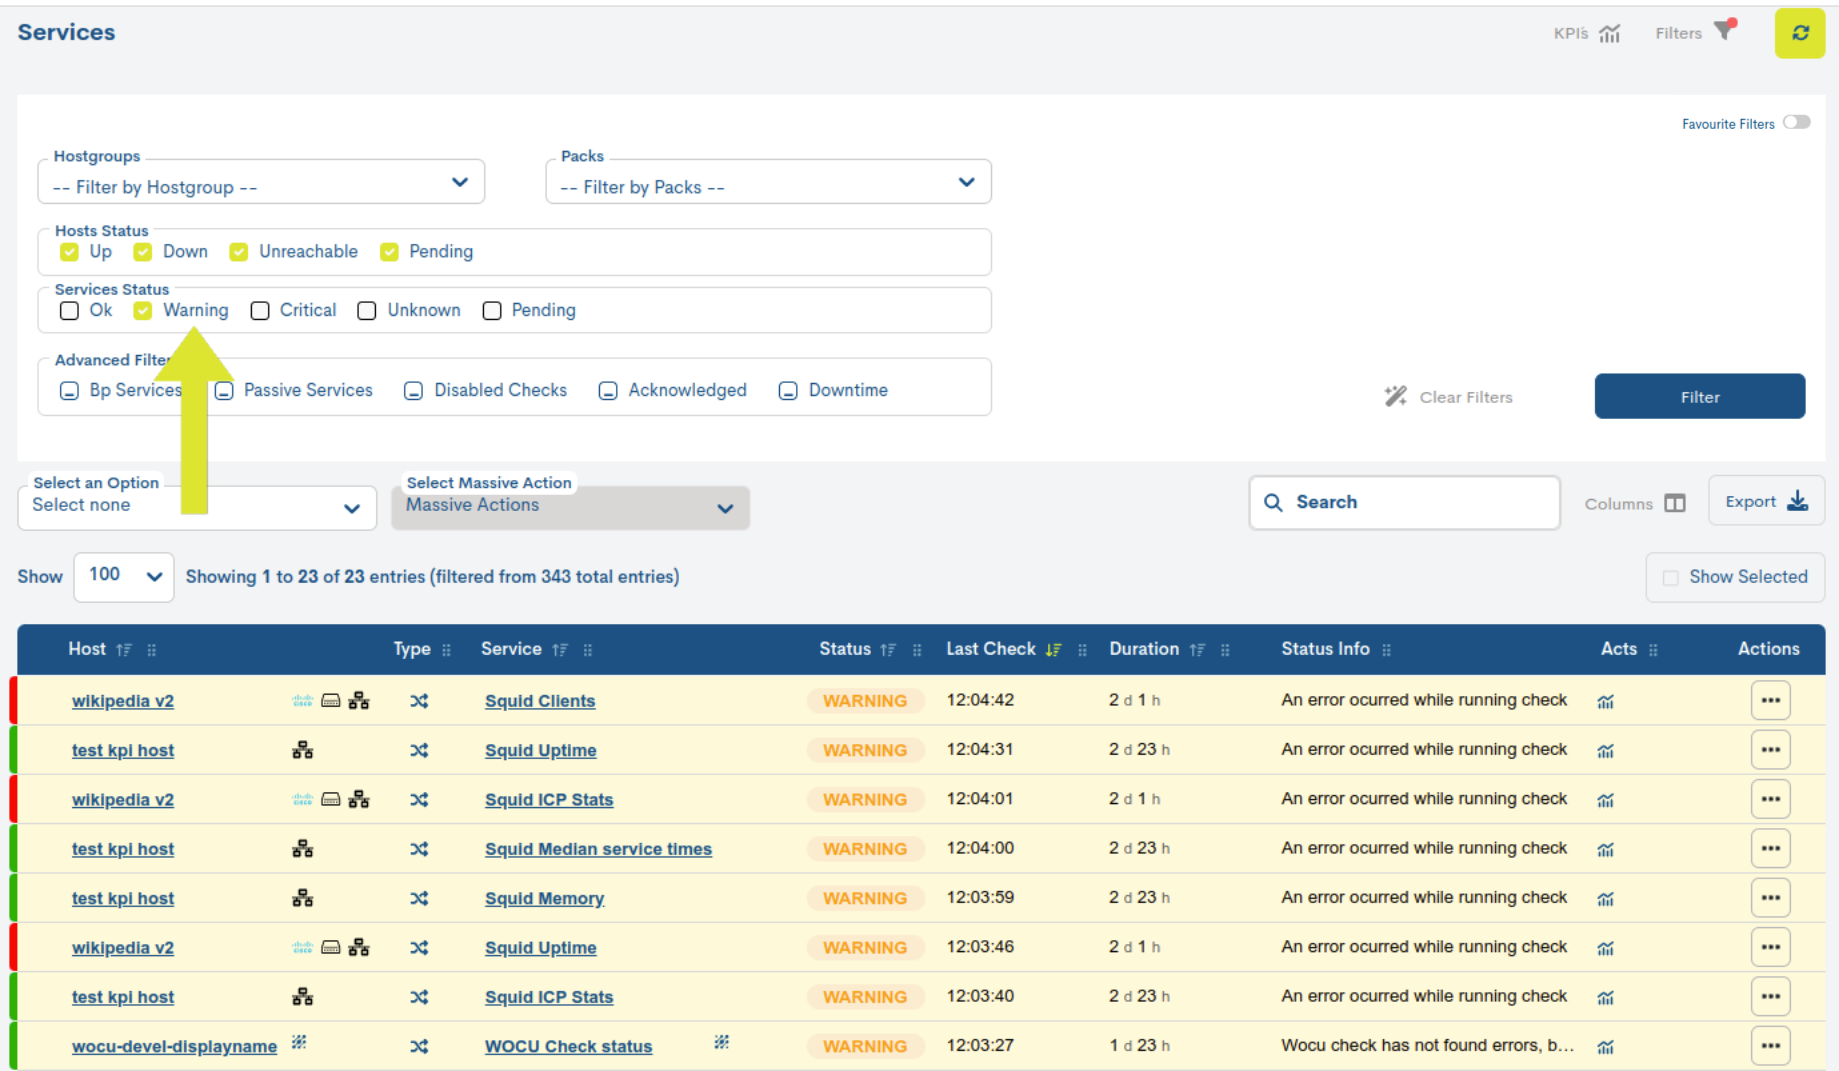
To consolidate the desired filter configuration, it will be necessary to trigger the Filter action first, to reload the inventory with the newly triggered data request.
Note
It is possible to search the inventory by: host name, service name and check result or output message.
Advanced Filters
The application offers another advanced filtering system on inventory monitoring services, making it easier to choose and view items that fall into certain categories or operational situations.
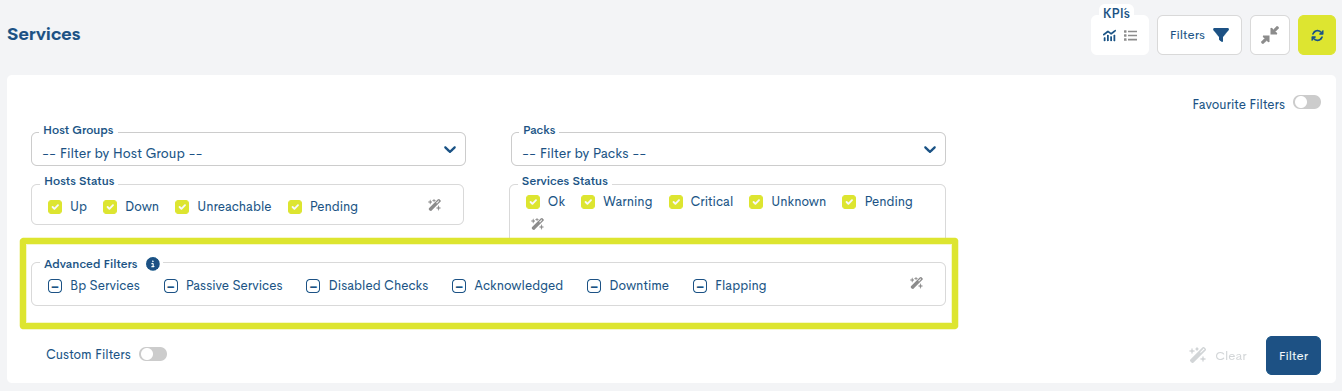
The new options available are:
BP Services: filtering by asset type, specifically Services Business Processes.
Passive Services: filtering of passively sourced services, i.e. from passive monitoring via SNMP Traps.
Disabled Checks: filtering of assets where the user has applied the action Disable active checks for services.
Acknowledged: filtering of assets where the user has applied the action Apply acknowledged to service.
Downtime: filtering of assets where the user has applied the action Schedule downtime to service.
Flapping: filtering of assets that experience rapid alternationof monitoring state changes, known as Flapping.
The operation in this mode allows the concatenation of filters, offering different combinations to the operator for the direct visualisation of data of interest. This is possible because each filter can assume 3 states summarised in the following table.
Icono |
Value |
Description |
|---|---|---|
ー |
Off |
The filter is not enabled. The table shows all items by default. |
✔ |
True |
Filter enabled. The table is updated showing the items that meet the filter condition. |
✖ |
False |
Filter enabled. The table is updated by hiding the items that meet the filter condition. |
Note
Simply tick the filter box several times to go through the different undefined states.

We will illustrate this explanation with an example:

The inventory shall only show BP Services, which have the Acknowledged option activated in their configuration and do not have the Disabled check. In this case, the existence of scheduled outages (Downtime) shall not be taken into account.
The use and combination of filters allows for a more organised management of large and complex systems.
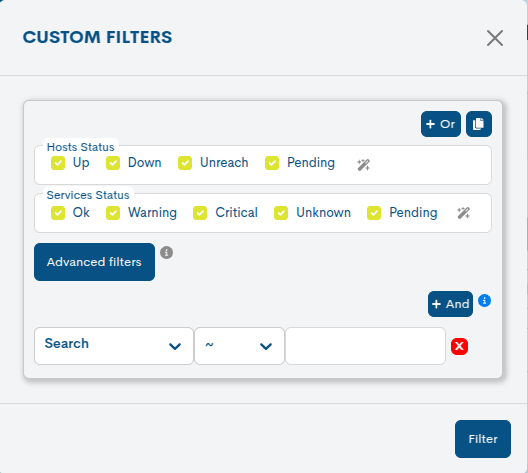
Custom Filters
The application offers other advanced options for customized filtering of the items in the list. These filters allow users to nest and define more specific criteria to segment the information according to their needs, using certain categories or logical operations.
To view the custom filter package, it is necessary to enable the Custom Filters tab.
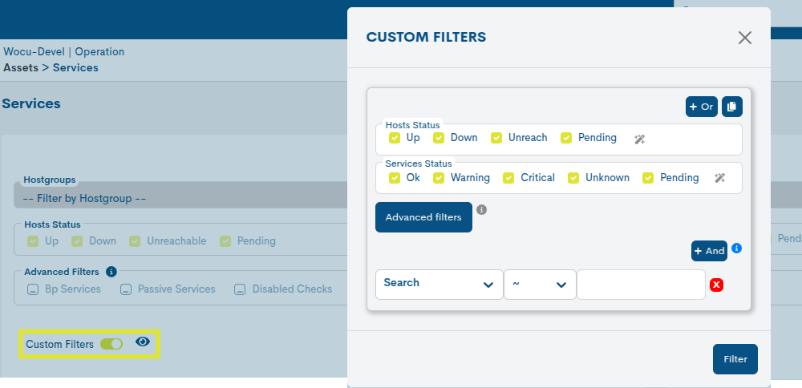
The available options are:
Host Status
Allows you to filter alarms that belong to assets in a particular monitoring status.
Services Status
Allows you to filter alarms that belong to services in a particular monitoring status.
Advanced filters
It corresponds to the Filtros avanzados (Advanced Filters) module present in the alarms list, and its operation is similar.
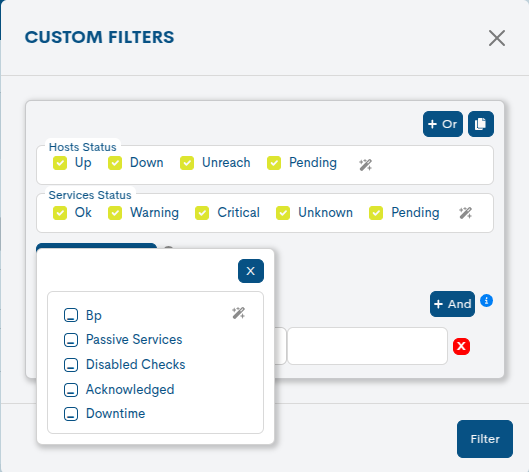
Note
To learn more about the configured settings, hover your cursor over the information button.

Filter selector
This selector presents a set of filtering options corresponding to the device inventory fields, which are configured by applying conditions to the items listed in the table. This allows for more precise searches. The elements displayed under each filtering option are operators that define the logic of comparison between an attribute and a value.
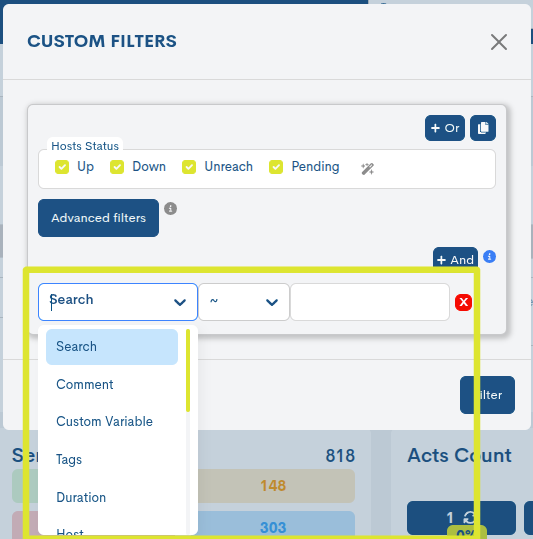
a. Basic filters:
The following table presents the basic filters available along with the operators that can be used in each case:
Filter
The available operators are:
Search
~ (Similar to): searches for elements that contain a partial match or pattern with the specified value.
Comment
~ (Similar to): searches for elements that contain a partial match or pattern with the specified value.
!~ (Not similar to): searches for elements that do not contain a partial match or pattern with the specified value.
!= (not equal to): searches for elements that are different from the specified value.
= (equal to): searches for elements that exactly match the specified value.
Host
Hostgroup
Plugin output
Service
Packs
!= (not equal to): searches for elements that are different from the specified value.
= (equal to): searches for elements that exactly match the specified value.
For example…
If the = operator is used with a value, it will locate problems whose specified attribute exactly matches that value.
If != is used, problems matching that value will be excluded.
b. Temporal filters:
The following table presents the available temporal filters along with the operators that can be used in each case:
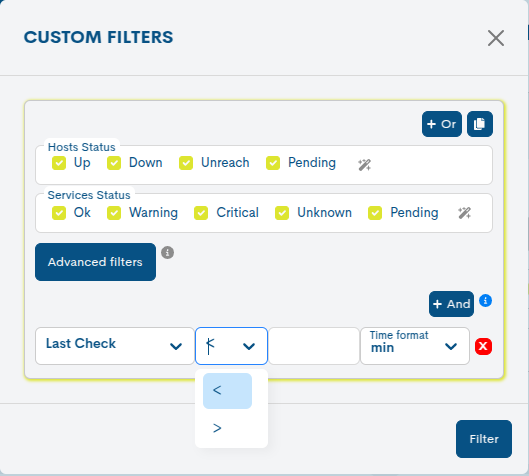
Filter
Operators
Number of services
= (equal to): filters elements that exactly match the specified value.
!= (not equal to): filters elements that are different from the specified value.
<= (less than or equal to): filters elements whose value is less than or equal to the specified value.
>= (greater than or equal to): filters elements whose value is greater than or equal to the specified value.
Duration
< (less than): filters elements whose value is less than the specified value.
> (greater than): filters elements whose value is greater than the specified value.
Last Check
c. Parent Filter
This is a filter for assets that are hierarchically related. This filter allows you to focus on elements that have a dependency or hierarchy with others.
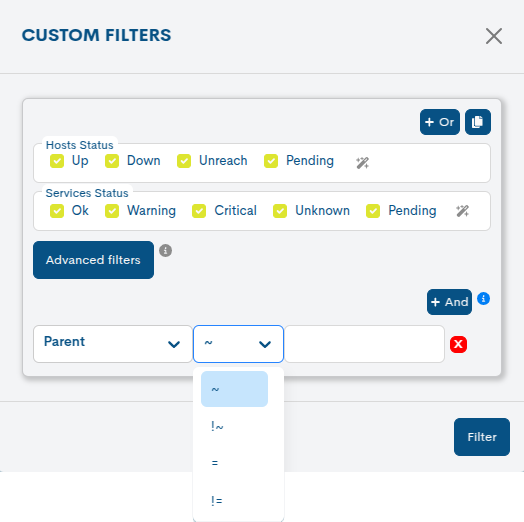
The following are the operators that can be used to execute the query:
Filter
Operators
Parent
= (equal to): filters elements that exactly match the specified value.
!= (not equal to): filters elements that are different from the specified value.
~ (Similar to): searches for elements that contain a partial match or pattern with the specified value.
!~ (Not similar to): searches for elements that do not contain a partial match or pattern with the specified value.
d. Filter by Tags
The user can freely define and assign descriptive tags to assets to facilitate their search, classification, and location within the system.
The Tags filter criterion follows the format ``name = value``(name-value), where the first cell corresponds to the Name, that is, the attribute or category of the asset you want to filter; then, the search operator is selected, and finally, in the Value cell, the specific value assigned to that attribute is entered.
Ej.:
device_type = routerorlocation = datacenter-1.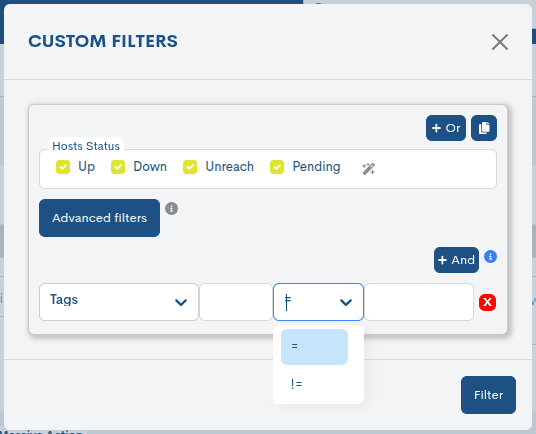
The following are the operators that can be used to execute the query:
Filter
Operators
Tag
= (equal to): filters elements that exactly match the specified value.
!= (not equal to): filters elements that are different from the specified value.
e. Custom Variable Filter
It has a text field that allows the user to enter a custom filter based on a specific variable, offering flexibility to adjust search conditions to suit their needs.
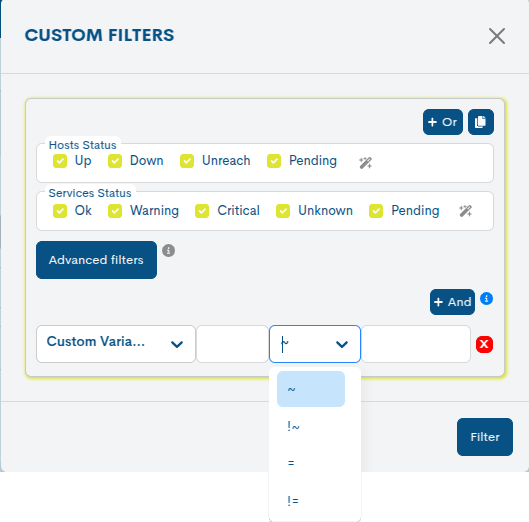
The following are the operators that can be used to execute the query:
Filter
Operators
Custom variable
= (equal to): filters elements that exactly match the specified value.
!= (not equal to): filters elements that are different from the specified value.
~ (Similar to): searches for elements that contain a partial match or pattern with the specified value.
!~ (Not similar to): searches for elements that do not contain a partial match or pattern with the specified value.
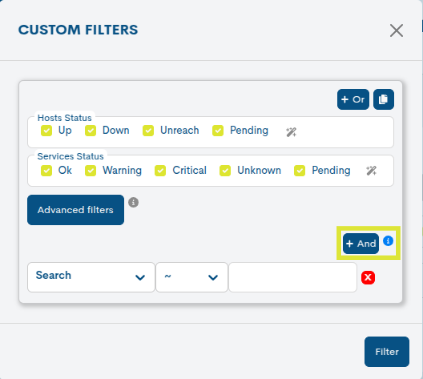
Finally, there is the AND Button, which allows you to add rows to include additional search conditions and further refine the query.
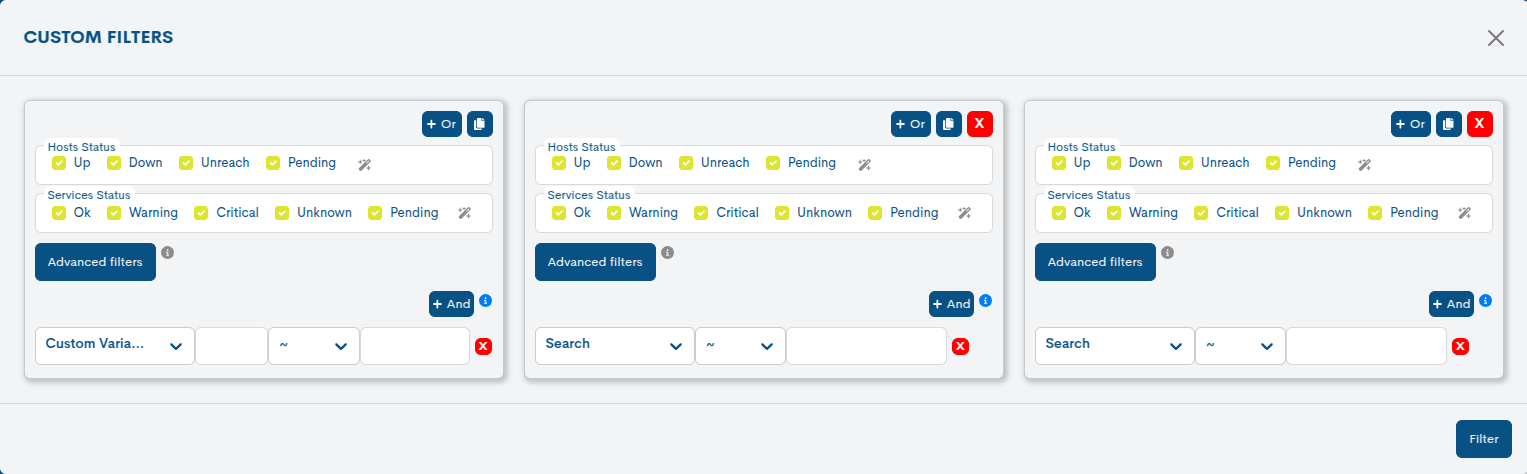
Nesting filters: OR and Duplicate
The system allows combining multiple conditions or complete search configurations to obtain more specific or broader results.
Nesting filters using the OR operator: This operator allows multiple conditions to be included, where any one of them can be true for the filter to apply. Therefore, nesting filters with OR broadens the results by including any of the conditions.
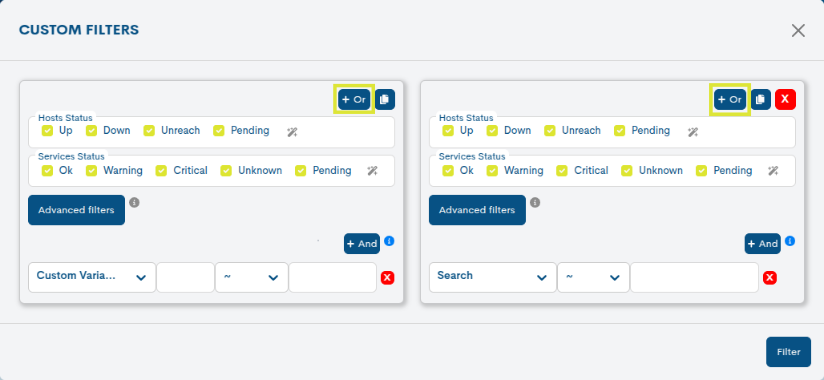
Duplicate queries: this action creates a new instance based on an already defined query. By duplicating a query, you can modify the search conditions in each copy without affecting the original query.
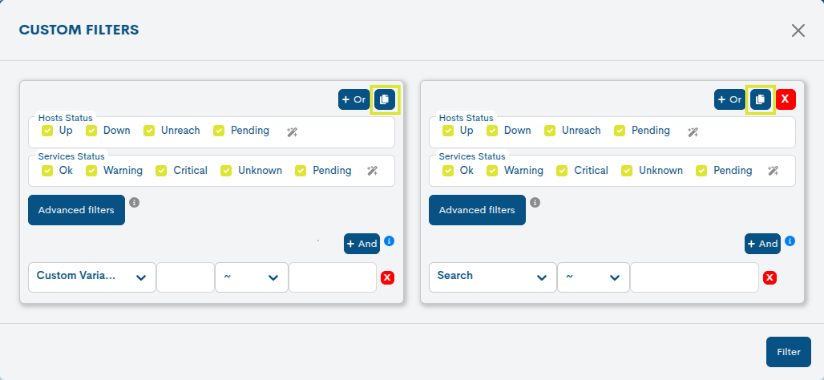
When combining the OR operator with the option to duplicate queries, you gain greater flexibility and control over the results, enabling highly customized searches. This allows you to create more complex filters that include multiple conditions or different criteria, both in parallel searches and as alternative conditions within the same query.
In order to consolidate the desired filter configuration, it will be necessary to previously trigger the Filter action, to reload the inventory with the newly launched data request.
Filter button
In order to consolidate the desired filter configuration, it will be necessary to previously trigger the Filter action, to reload the inventory with the newly launched data request.
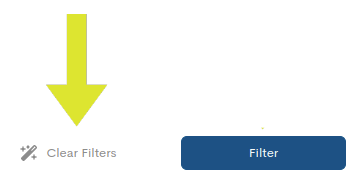
Clear Filter button
When the intention is to clear the applied filters, you can click the Clear filter button and the settings will be immediately restored, except for the search in the Search bar.
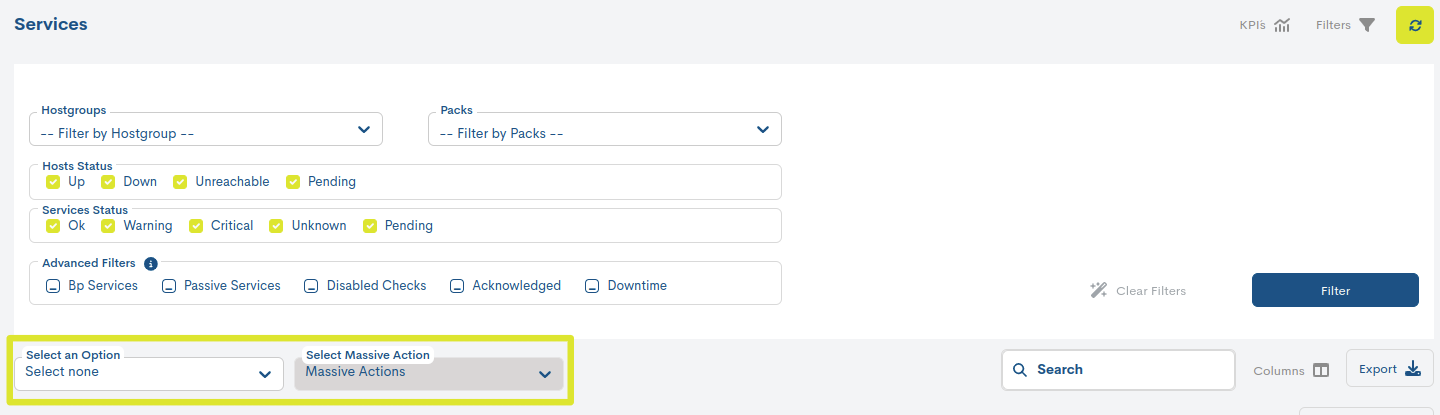
Massive actions on inventoried services
This functionality allows applying actions on a multitude of services in a single iteration. By selecting at least two services from the inventory, this tab will display a set of actions that can be implemented simultaneously on all selected elements.
Mass actions allow for a more organised management of large amounts of data in vast and complex environments.
The management of elements is executed from the following drop-downs:
To consolidate the desired configuration, it will be necessary to trigger the Filter button, to reload the inventory with the newly triggered data request.
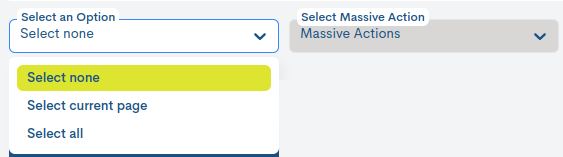
Selection of items from the list
Clicking on this drop-down menu displays all the options for selecting items in the list. These are:
Do not select any item (Select none): to toggle the previously chosen selection.
Select the complete list (Select All).
Select only the current page of the list (Select Current Page). This option can be used in concatenated form, i.e. select several current pages and add up the items they contain.
It is also possible to select items from the list manually by clicking on each item. To select multiple items, hold down the CTRL key while clicking on another item you wish to select. To toggle the action, click again on the item to be deselected.
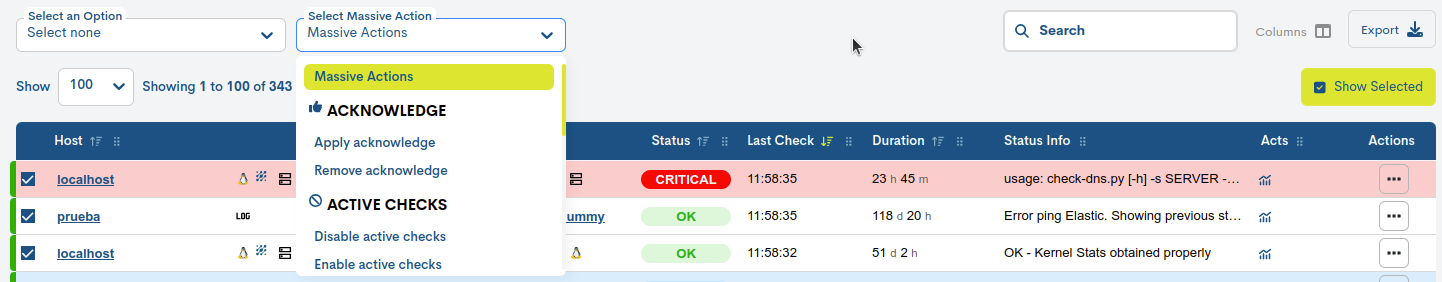
Selection of the mass action
Clicking on this drop-down lists the possible actions to apply on the selected set of elements. These match those described in Actions on inventoried services (ℹ).
Dynamics of use in the configuration of mass actions.
The configuration of the different mass actions has a similar operational similar in operation:
Each service is presented in label format. Inside the label, the name of the service is indicated followed by the name of the host (in brackets) to which it is linked. It also incorporates an
xto facilitate the removal of the label.
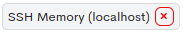
When a service is removed, the configuration shall be updated immediately, and it shall be excluded from the execution of the mass action. However, in no case can all of the selected services be removed, so the system will prevent the last remaining item from being removed. Remember that the purpose of the task is to apply a specific action on a multitude of services simultaneously.
The configuration modal will only show the first 50 services, the rest can be viewed by clicking on the View all tags button, located in the last row of tags.
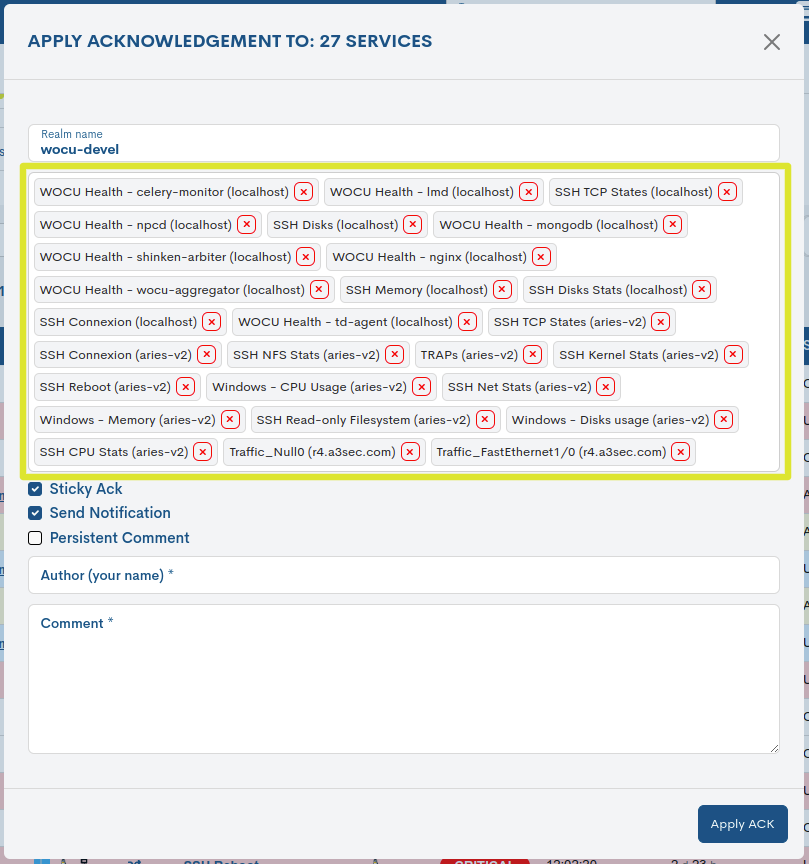
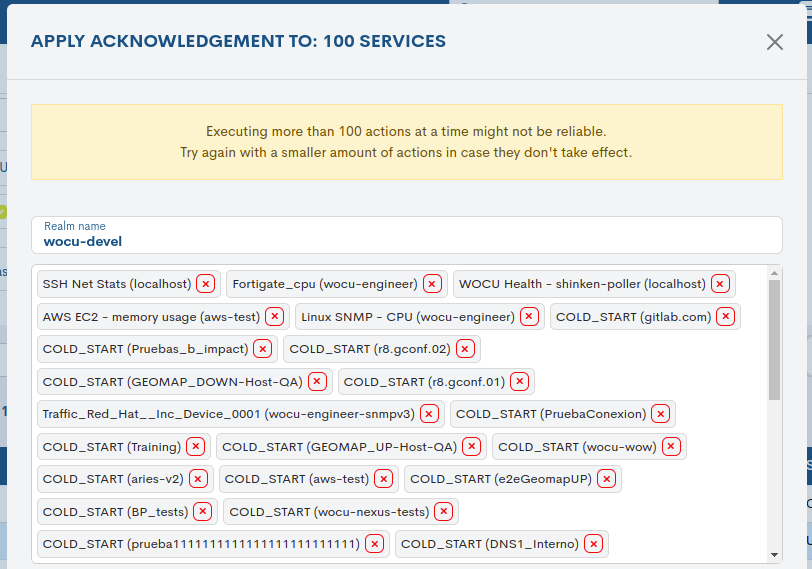
Finally, when the action exceeds 100 selected services, the operator shall be informed of the possibility that the mass action may not be successful due to computational capacity issues.
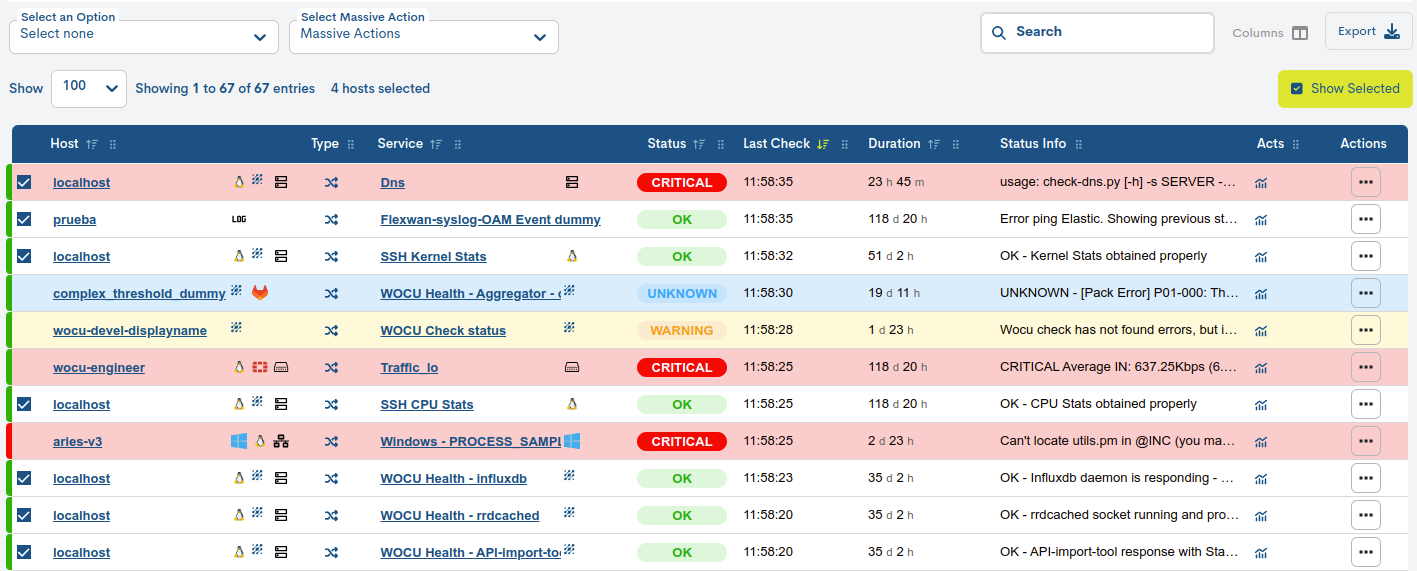
Show Selected Services
The Show Selected Services button acts as a manager of selected assets within the list of services, showing the items that have been recently selected by the user.

This button will be disabled when no asset is selected and will be displayed in a dimmed blue colour.
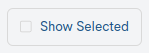
Clicking on the functionality will open a new window from where it is possible to edit the chosen set of assets.
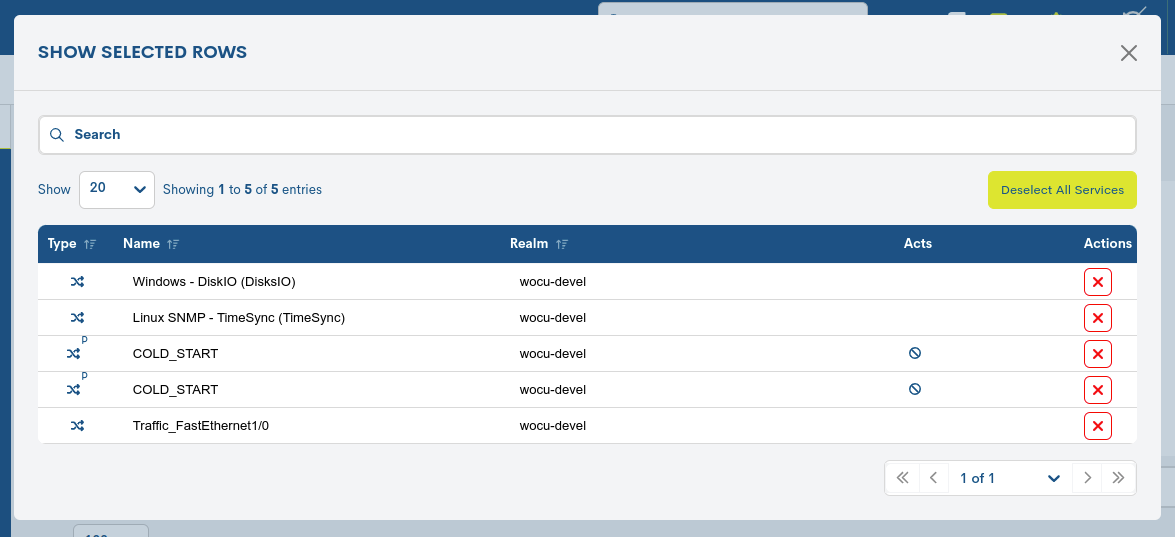
This management view consists of the following elements:
Selection of entries to be displayed and search bar.
Selection table: the following columns are distinguished:
Type: this field contains an icon identifying the type of Service according to its nature. The possible options are:
Separate services identified by the crossed arrows icon.
The capital letter P shall be added to the main icon to identify passively sourced services, coming from passive monitoring via SNMP Traps.
Business Process Services (BP Services): identified by the icon of crossed arrows framed in a circle.
Service: indica el nombre por el que es conocido el Servicio en WOCU-Monitoring.
Host: Host to which the Service is associated (from the same entry).
Realm: Realm to which it belongs.
Deselect action: by clicking on the cross icon (X), the corresponding Service will be removed from the table and automatically deselected from the inventory.
Quick action for the deselection of all elements in the table.
Export of Services
Although WOCU-Monitoring offers a multitude of functions for the administration of data, metrics, graphs, etc., at some point it may be necessary to use other external tools to process this information. For this purpose, the export function is integrated, which facilitates the download of the inventory data in a file to the hard disk for further processing or use.
The two buttons next to the Search bar, CSV and JSON, facilitate the export of data in both formats:
CSV
Clicking on the corresponding button will open a new modal for the selection and marking of parameters to be exported at the user’s discretion. The available options are:
Host (Mandatory)
Host Address (Mandatory)
Realm Name (Mandatory)
Type
Service (Mandatory)
State
Last Check
Duration
Status Information
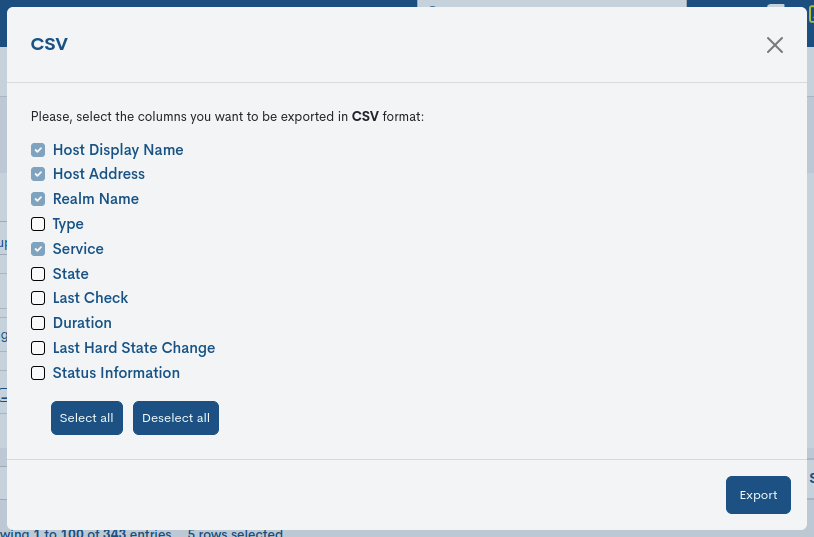
Once the selection is confirmed, a file is downloaded in CSV (Comma Separated Value) format, a very simple format that organises the columns by a separator (semicolon “;”) and the rows by a line break.
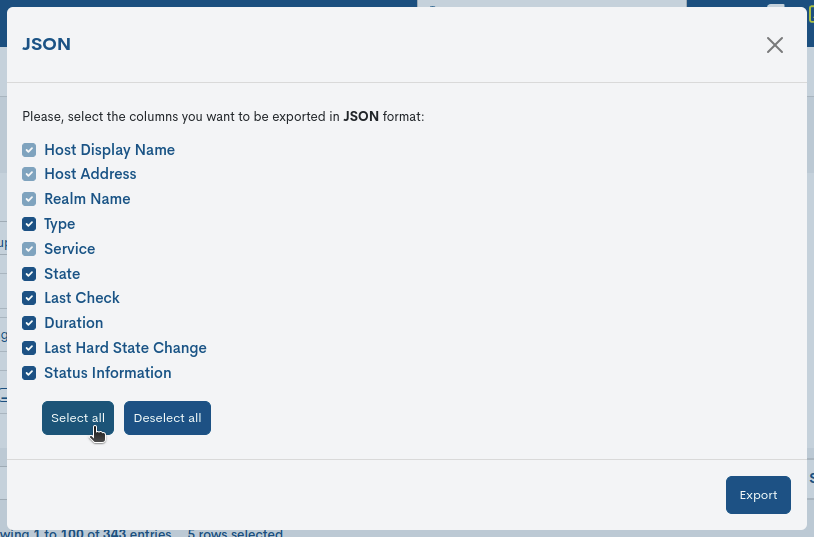
JSON
This other option follows the same operation as the previous case, but initiates the download of a file in JSON (JavaScript Object Notation) format, a lightweight data interchange format capable of being read by any programming language and, therefore, used to exchange information between different technologies.
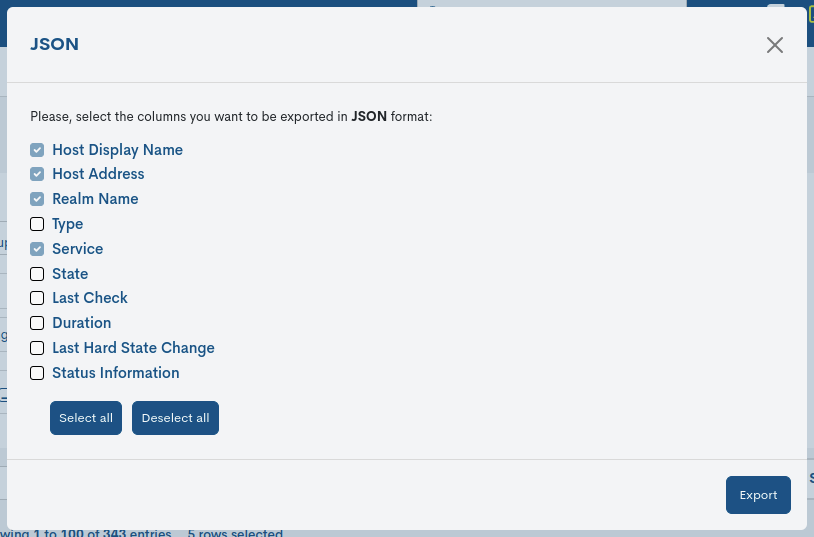
In both options, the system will offer the option to select the directory where to download and store the generated inventory file and to assign an alternative name to it. By default, the system assigns the following name:
assets_services_[nombre del reino]_00h-00min_dd-mm-aaaa y la extensión ``.csv`` o ``.json`` según la opción escogida.
Note
Use the Select all button to select all available fields/boxes and perform a complete export. You can undo the action by using the Deselect all button.