Agents
On this page
What is it?
A WOCU agent is a program installed on a Linux or Windows computer that collects host metrics, an inventory and, on Linux, local log files, and sends them to WOCU-Monitoring over an outbound OTLP/HTTP connection (the OpenTelemetry Protocol over HTTP). WOCU-Monitoring monitors each reporting computer as a Host with seven passive Services: CPU, Memory, Filesystems, Disk I/O, Network, TCP Connections and System. Agents are created, downloaded and managed under Configuration > Agents.
What is it for?
Monitor computers that WOCU-Monitoring cannot poll. The agent only opens outbound connections, so the monitored computer does not have to accept inbound connections.
Get a standard set of host metrics without building checks. Every agent reports the same measurements, grouped into seven Services with ready-made graphs.
Define alert limits once and reuse them. A threshold profile is shared by any number of agents instead of being configured computer by computer.
Deploy one package to many computers. A single download can be installed on every computer that shares its platform and settings. Each computer reports its own host name and appears as its own Host.
Avoid creating Hosts and Services manually. Reporting computers are registered automatically in Pending assets for an administrator to approve.
How does it work?
An agent combines four objects, each managed in its own entry of the Configuration > Agents menu:
An ETL connection (ETL Connections) defines the URL of the WOCU OpenTelemetry receiver to which agents send their data.
A threshold profile (Threshold Profiles) defines the Warning and Critical limits of each measurement.
A token (Tokens) is the credential with which the agent authenticates.
The agent (Manage Agents) combines a platform with an ETL connection, a threshold profile and a token.
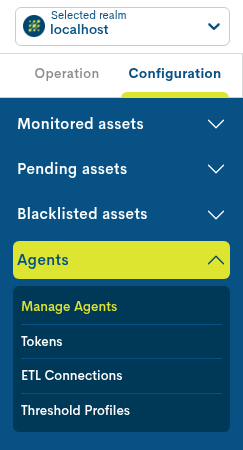
The Agents section of the Realm’s Configuration tab contains the four entries.
Downloading an agent produces a ZIP archive with the agent installer, setup and uninstall scripts and a configuration generated from those objects. Once installed, the agent works as follows:
Collection. The agent collects host metrics every 60 seconds and an inventory of the computer every 300 seconds. On Linux, it also reads new lines written to
/var/log/*.log,/var/log/syslogand/var/log/messages. These intervals are fixed.Delivery. The agent sends the data to the ETL connection URL. Each request carries the agent token. The receiver accepts the data only when the token is active and belongs to the Realm of the agent.
Discovery. The first time a computer reports, WOCU-Monitoring registers it in Pending assets as a Host named after the computer’s host name. After the Host is monitored, the next report registers its seven Services as pending passive Services.
Evaluation. The threshold limits travel with the metrics. WOCU-Monitoring evaluates each report independently, without averaging it with previous reports, and each Service takes the worst state among its measurements.
Freshness. Each report also marks the Host UP, whatever the state of its Services. If a Service receives no result for 180 seconds, it becomes UNKNOWN, and if the Host receives none for 180 seconds, it becomes DOWN. The next result restores the measured state.
Installed agents never fetch their configuration from WOCU-Monitoring. Changes to the settings stored in the downloaded archive (the agent’s fields other than Is active, its ETL connection and its threshold profile) take effect only after the agent is downloaded and set up again on each computer. Disabling an agent or a token, or regenerating a token, takes effect at the receiver without a new download: with its default settings, the receiver rejects the previous credential within about 30 seconds. Agents that use a regenerated token need a new download to send data again. Approvals made in Pending assets are detected within about one minute.
How do you use it?
The complete deployment consists of six steps. ETL connections and threshold profiles are reusable: once they exist, adding another agent only requires steps 3 to 6.
Before you begin
Permissions. Your user needs the Agents permissions described in Considerations and limitations.
Realm. Work in a standard Realm, not a multirealm. The agent belongs to the Realm in which it is created.
Platform. Each computer must run a supported platform: 64-bit Debian- or Red Hat-based Linux with systemd, or 64-bit Windows. See Supported platforms.
Receiver URL. Ask your WOCU-Monitoring administrator for the URL of the WOCU OpenTelemetry receiver, for example
https://otel.example.com:4318.Connectivity. Each computer must reach that URL, usually on port
4318over HTTPS. To check it from a computer, request the receiver’s liveness endpoint:# Linux: any response confirms that the receiver can be reached curl -sS https://otel.example.com:4318/health/live
# Windows PowerShell: look for "TcpTestSucceeded : True"
Test-NetConnection otel.example.com -Port 4318
CA certificate. If the receiver uses a certificate issued by a private certificate authority, obtain the CA certificate in PEM format. It must be copied to every computer; it is not included in the download.
Administrator access. Installing the agent requires
root(orsudo) on Linux and an Administrator account on Windows.
Step 1: Create an ETL connection
Go to Configuration > Agents > ETL Connections.
Click Add. The Create ETL Connections dialog opens.
Enter a Name and the receiver URL, for example
https://otel.example.com:4318. The URL field is prefilled with the default value of the WOCU-Monitoring installation; replace it unless your administrator confirms it is correct.Click Create. The connection appears in the ETL Connections table.
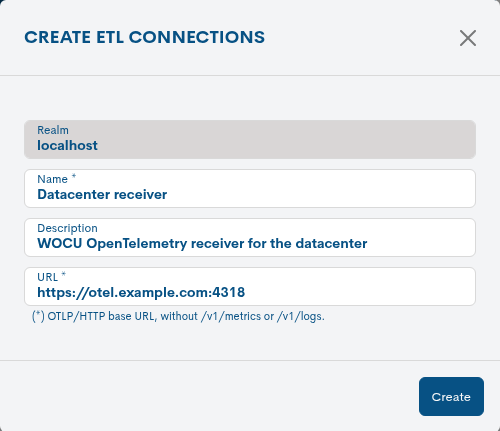
The URL contains only the receiver’s base address and port; the help text
below it recalls that /v1/metrics and /v1/logs must not be added. See
ETL Connections for the field rules.
Step 2: Create a threshold profile
Go to Configuration > Agents > Threshold Profiles.
Click Add. The Create Threshold Profiles dialog opens.
Enter a Name.
Review the limits in Monitoring thresholds. A new profile starts with the default limits: Busy CPU
@80:/@90:, RAM used@85:/@95:and filesystem Used capacity@80:/@90:(Warning / Critical, in %).Click Create. The profile appears in the Threshold Profiles table.
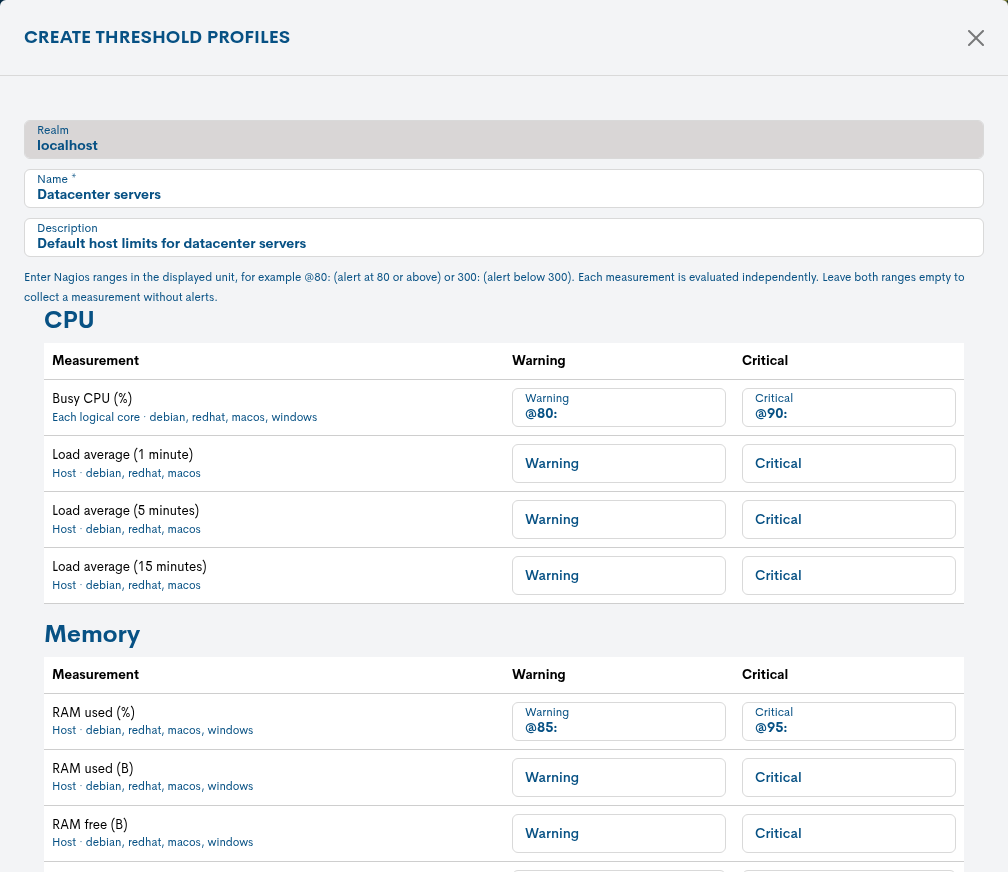
Each Service has its own table. Below each measurement, the editor shows its scope and the platforms that report it; the default limits are already filled in. See Threshold Profiles for the range syntax and the available measurements.
Step 3: Create the agent
Go to Configuration > Agents > Manage Agents.
Click Add. The Create agent dialog opens.
Enter a Name and select the Platform, ETL connection and Threshold profile.
Keep Token set to Generate new token to create a dedicated credential, or select an existing token.
If the receiver uses a private CA, enter its CA path on the computers.
Click Create. The agent appears in the Agents table.
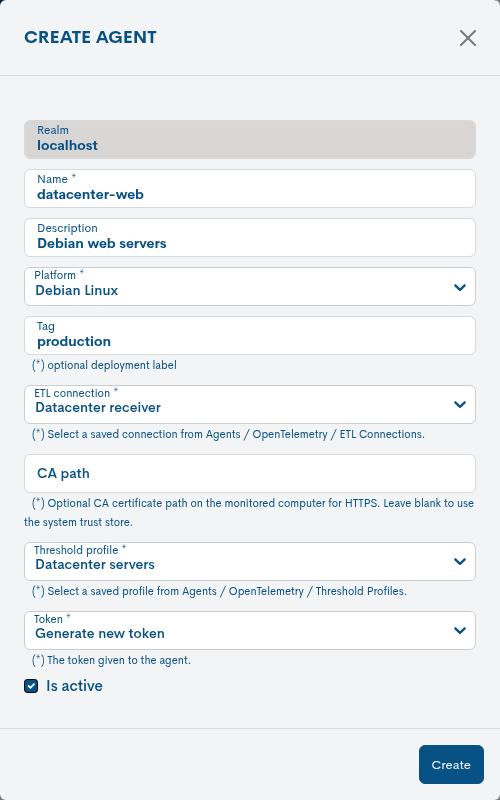
One agent can be installed on any number of computers that share its platform and settings. Create separate agents for computers that need a different platform (including Debian-based versus Red Hat-based Linux), receiver URL, CA path, threshold profile or tag, or a token that can be revoked independently. See Manage Agents for every field.
Step 4: Download the agent
In the Agents table, click the Download icon in the agent’s row. The
browser saves a ZIP archive named
wocu-otel-agent-<agent name>-<platform>-amd64-<code>.zip. Its content is
described in In the downloaded archive.
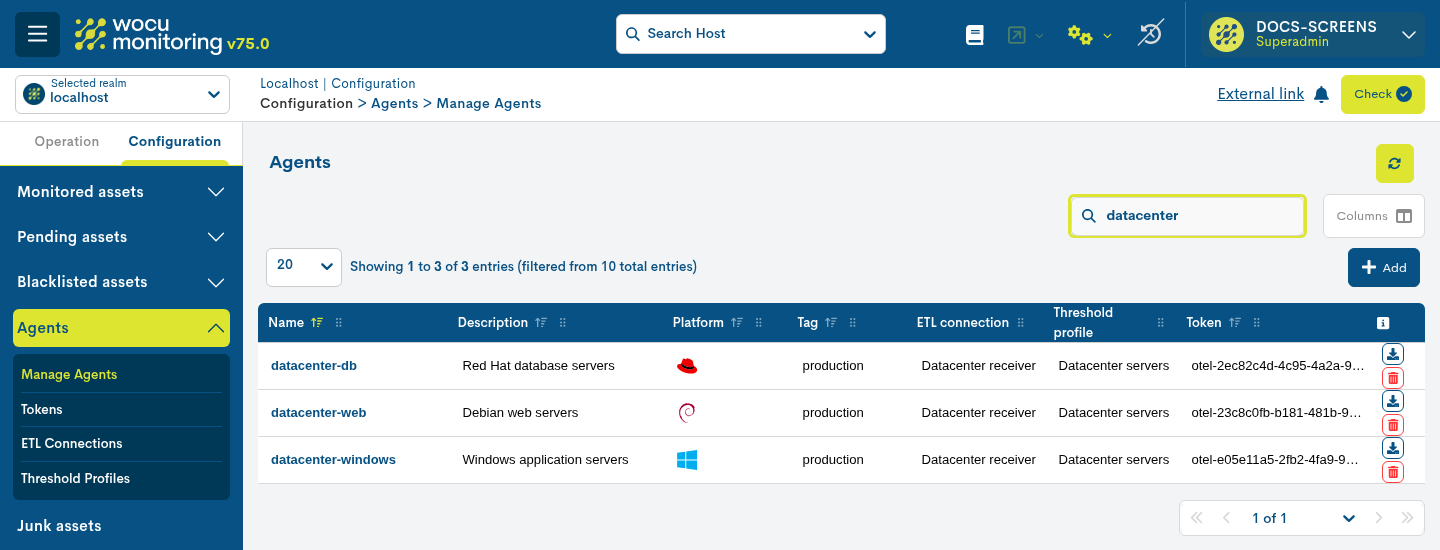
The Platform column shows the operating system logo of each agent. The Download icon is the upper icon of each row; the lower one is Delete.
Warning
The archive contains the agent credential. Store and transfer it as a secret: restrict access to it and delete copies that are no longer needed.
Step 5: Install the agent on each computer
The setup scripts install the agent, copy the configuration, validate it and
start the wocu-otel-agent service. They can be run again safely, for
example to apply a new configuration. If the agent has a CA path, copy the
CA certificate to that path on the computer first (see
Use a private CA certificate).
On Linux:
Create a private directory on the computer with
mktemp -d, copy the archive into it, extract it there and enter the extractedwocu-otel-agentfolder. Installunzipfirst if it is not available (sudo apt install unziporsudo dnf install unzip).ssh admin@web01 mktemp -d # Prints the new private directory, for example /tmp/tmp.Xk3Lw9QsaZ scp wocu-otel-agent-web-servers-debian-amd64-1a2b3c4d.zip admin@web01:/tmp/tmp.Xk3Lw9QsaZ/ ssh admin@web01 cd /tmp/tmp.Xk3Lw9QsaZ unzip wocu-otel-agent-web-servers-debian-amd64-1a2b3c4d.zip cd wocu-otel-agent
Run the setup script as
root. If you start it as another user, it invokessudo.sudo bash setup.sh
If a configuration is already installed, the script asks
OTEL configuration exists. Overwrite both files (with backups)? [y/N]. Answeryto install the downloaded configuration; the previous files are kept with a.backupsuffix. AnswerNto keep the installed configuration.Wait for
WOCU OpenTelemetry Agent installed and restarted.and check the service. The output must showactive (running):systemctl status wocu-otel-agent
Delete the extracted folder and the archive from the computer.
On Windows:
Copy the archive to the computer, right-click it, select Extract All… and extract it to a local folder. Do not run the scripts from inside the compressed folder.
Open Command Prompt with Run as administrator and run the setup script from the extracted folder. Running it from a console, rather than by double-clicking it, keeps the output and any question visible.
cd /d C:\Users\admin\Downloads\wocu-otel-agent
setup.bat
If a configuration is already installed, answer
yto install the downloaded configuration (the previous files are kept with a.backupsuffix) orNto keep the installed configuration.Wait for
WOCU OpenTelemetry Agent installed and started.and check the service. TheSTATEline must showRUNNING; the service also appears in the Services console as WOCU OpenTelemetry Agent.sc query wocu-otel-agent
Delete the extracted folder and the archive from the computer.
Use a private CA certificate
If the agent has a CA path, the certificate must exist at that path before the setup script runs; otherwise, the configuration validation fails and the service remains stopped. Use the same path on every computer that receives the download. For example, on Linux:
sudo install -D -m 644 ca.pem /etc/pki/wocu/ca.pem
Step 6: Start monitoring the computer
Go to Configuration > Pending assets > Hosts, search for the computer’s host name and click Monitorize (see Monitorize).
Wait for the agent’s next report, about one to two minutes. Then go to Configuration > Pending assets > Passive Services, search for the host name and click Monitorize for each of its seven Services:
otel.cpu,otel.memory,otel.filesystems,otel.disk_io,otel.network,otel.tcpandotel.system(see Passive Services in Pending).Apply the configuration with the Check button (see Apply changes: Check).
Open the Host details and check its Services and the Performance tab. See In WOCU-Monitoring to interpret them.
Change the configuration of deployed agents
Edit the agent, its ETL connection or its threshold profile: click its name in the table, click Edit, make the changes and click Save.
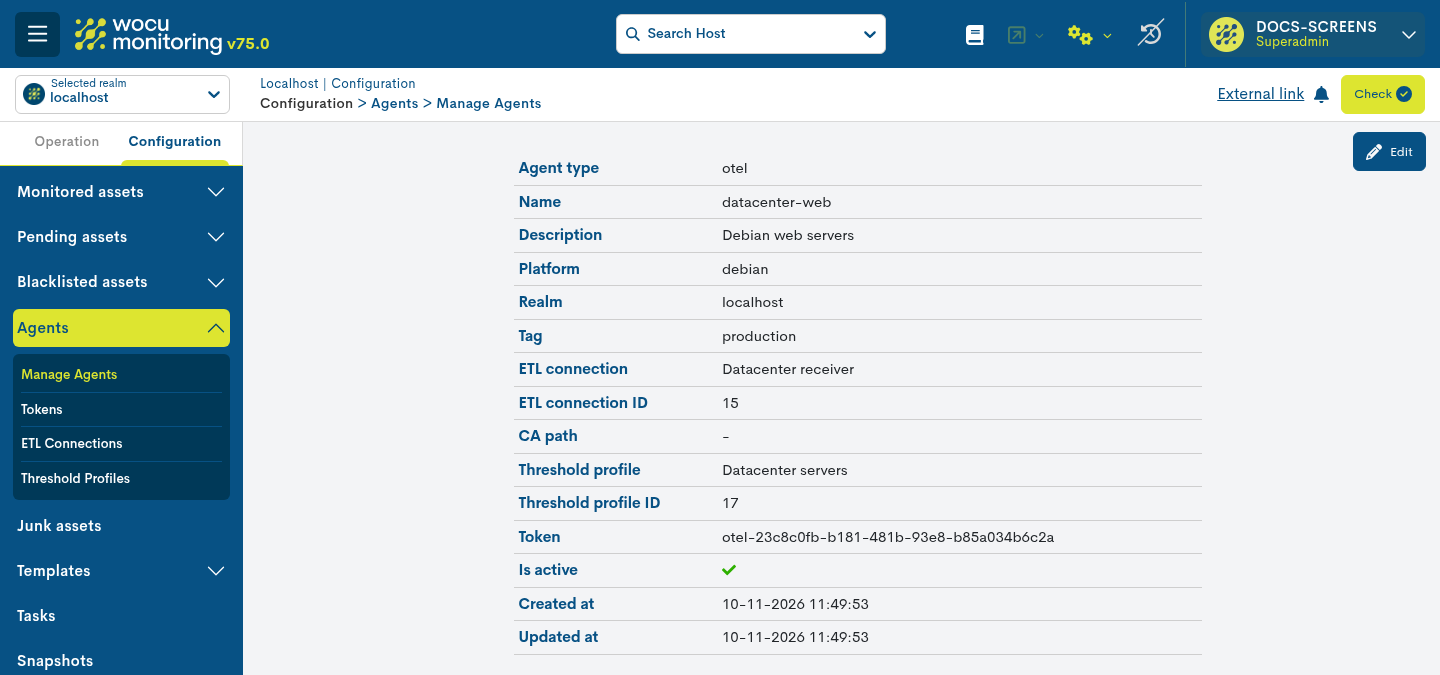
The details page shows the current values; Edit is at the top right.
Download the agent again.
Run the setup script again on each computer and answer
ywhen it asks whether to overwrite both configuration files.
New agent versions are delivered with WOCU-Monitoring releases. To upgrade the
agent after WOCU-Monitoring is updated, follow the same procedure. Answer N
instead to upgrade only the installed program and keep the current
configuration.
Disable or revoke an agent
Use one of the following options:
Disable the agent. Edit the agent and clear Is active. The receiver rejects its data, unless another active agent of the same Realm uses the same token.
Disable the token. In Configuration > Agents > Tokens, edit the token and clear Is active. Every agent that uses the token is rejected.
Regenerate the token. Edit the token, select Regenerate token and click Save. The previous credential stops working for every agent that uses the token; download those agents again and set them up on every computer.
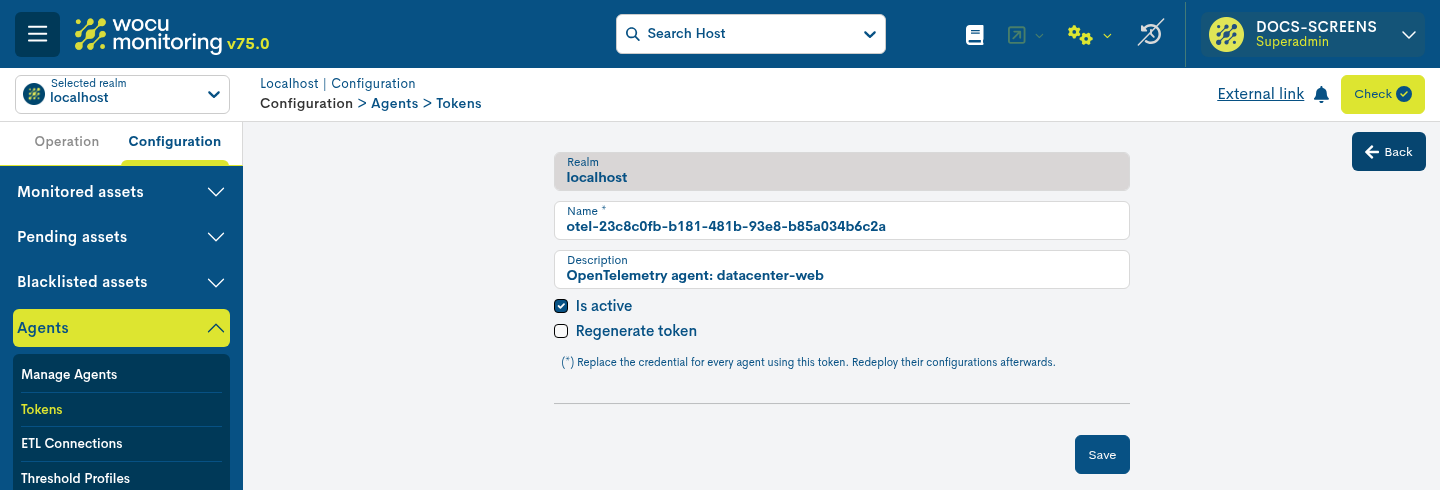
To edit a token, open Configuration > Agents > Tokens, click the token and click Edit. Is active and Regenerate token are below the token’s name and description.
Disabling an agent does not stop the service on the computers; uninstall it to stop collection.
Uninstall the agent
Run the uninstall script from the extracted wocu-otel-agent folder of any
download of the same platform:
Linux: run
sudo bash uninstall.sh. The script asks for confirmation and then asks separately whether to remove the configuration, logs, backups and queued data. If you keep them, they remain in/usr/local/wocu-otel-agent/.Windows: run
uninstall.batfrom a Command Prompt opened with Run as administrator. After confirmation, it removes the service and the complete installation, including the configuration, logs and queued data.
Uninstalling does not remove the Host and its Services from WOCU-Monitoring; they become UNKNOWN after 180 seconds without data. Delete them from Monitored Assets if the computer is no longer monitored.
Available options
Every Create dialog and Edit form starts with a read-only Realm field that shows the current Realm.
Manage Agents
Fields of the Create agent dialog and of the agent Edit form:
Option |
Description |
|---|---|
Name |
Identifies the agent. Required. It must be unique among all the agents of the Import Tool and is part of the downloaded file name. |
Description |
Optional free text. |
Platform |
Selects the installer and configuration included in the download: Debian Linux, Red Hat Linux, Windows or macOS. Required. macOS cannot be downloaded yet; see Supported platforms. |
Tag |
Optional single-line deployment label, such as |
ETL connection |
Selects the receiver to which the agent sends data. Required. |
CA path |
Optional path, on the monitored computer, to the CA certificate used to
validate an HTTPS receiver, for example |
Threshold profile |
Selects the alert limits included in the configuration. Required. |
Token |
Selects the credential used by the agent. Required. The default,
Generate new token, creates a dedicated token named
|
Is active |
Enabled by default. When cleared, the receiver rejects data authenticated through this agent, unless another active agent of the same Realm uses the same token. |
The Realm is assigned automatically from the Realm in which the agent is created and cannot be changed later.
The Agents table shows Name, Description, Platform, Tag, ETL connection, Threshold profile and Token (the token name, never its value). The search starts when at least three characters are entered.
Action |
Description |
|---|---|
Add |
Opens the Create agent dialog. |
Name link |
Opens the agent details, which include Edit. |
Download |
Downloads the ZIP archive for the agent’s platform. Each download is generated from the current values of the agent, its ETL connection, its threshold profile and its token. |
Delete |
Deletes the agent after confirmation. The receiver stops accepting the agent’s data, unless another active agent of the same Realm uses the same token. Deleting an agent does not uninstall it from the computers and does not delete its Hosts, Services or token. |
ETL Connections
Option |
Description |
|---|---|
Name |
Identifies the connection. Required and unique. |
Description |
Optional free text. |
URL |
OTLP/HTTP base URL of the WOCU OpenTelemetry receiver, for example
|
The ETL Connections table also shows the number of Agents using each connection and when it was Last updated.
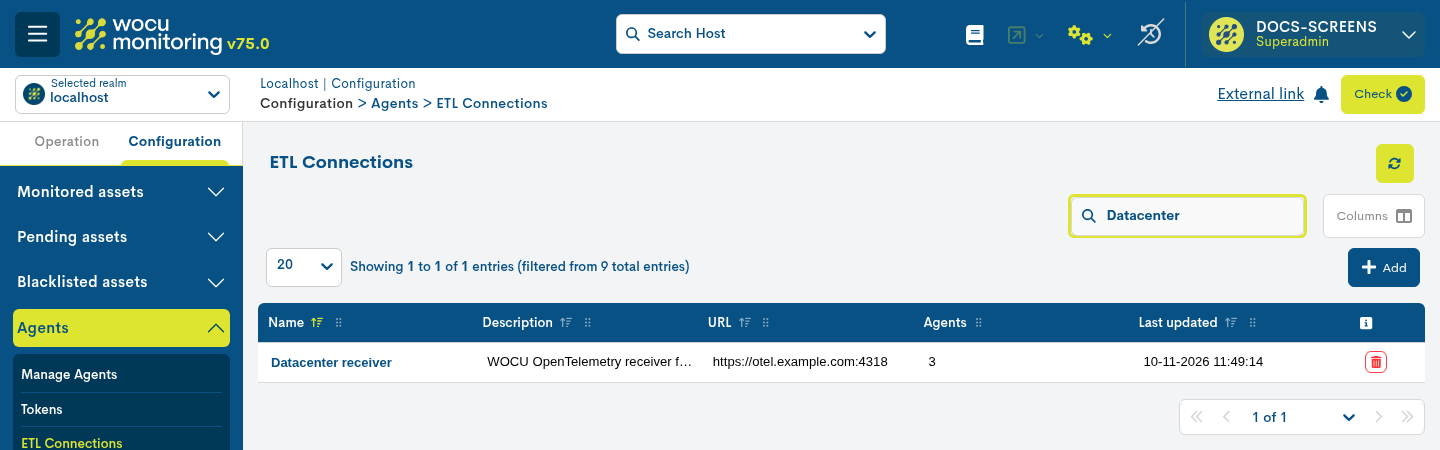
The Agents column shows how many agents use each connection. Click a name to open its details and Edit it. A connection used by an agent cannot be deleted; the dialog shows This configuration is assigned to an agent.
Threshold Profiles
Option |
Description |
|---|---|
Name |
Identifies the profile. Required and unique. |
Description |
Optional free text. |
Monitoring thresholds |
Editor with one table per Service, listing each Measurement with its Warning and Critical ranges. |
Enter limits as Nagios ranges in the unit displayed next to each measurement:
Range |
Alerts when the value is… |
|---|---|
|
80 or above. |
|
below 300. |
|
outside the range from 10 to 20. |
|
inside the range from 10 to 20. |
A range without a start begins at 0, ~ represents negative infinity and a
range without an end extends to infinity. Critical is evaluated before
Warning. Leave both ranges of a measurement empty to collect it without
alerts. A profile without limits is valid: it collects every measurement
without generating threshold alerts. Invalid values are rejected with messages
such as Enter a valid Nagios range of at most 255 characters with ordered
bounds.
The editor lists the measurements that accept limits:
Service |
Measurement |
Unit |
Scope |
Platforms |
Default Warning / Critical |
|---|---|---|---|---|---|
CPU |
Busy CPU |
% |
Each logical core |
All |
|
CPU |
Load average (1, 5 and 15 minutes) |
None |
Host |
Linux, macOS |
None |
Memory |
RAM used |
% |
Host |
All |
|
Memory |
RAM used, RAM free |
B |
Host |
All |
None |
Memory |
Swap used, Swap free |
B |
Each swap device |
All |
None |
Filesystems |
Used capacity |
% |
Each selected mount |
All |
|
Filesystems |
Used inodes |
Count |
Each selected mount |
Linux, macOS |
None |
Disk I/O |
Pending operations |
Count |
Each disk |
All |
None |
TCP Connections |
Connections |
Count |
Each reported TCP state |
All |
None |
System |
Minimum uptime |
s |
Host |
All |
None |
System |
Process count |
Count |
Each reported process status |
Linux, macOS |
None |
Limits for measurements that a platform does not report are ignored for agents of that platform, so one profile can serve Linux and Windows agents. Per-second measurements (disk IOPS and throughput, network bandwidth, packets, errors and drops, and paging activity) and the host values CPU usage, Normalized load, Memory free and Disk space available do not accept limits, so the Network Service is not listed. Connections and Process count limits apply to every reported state or status.
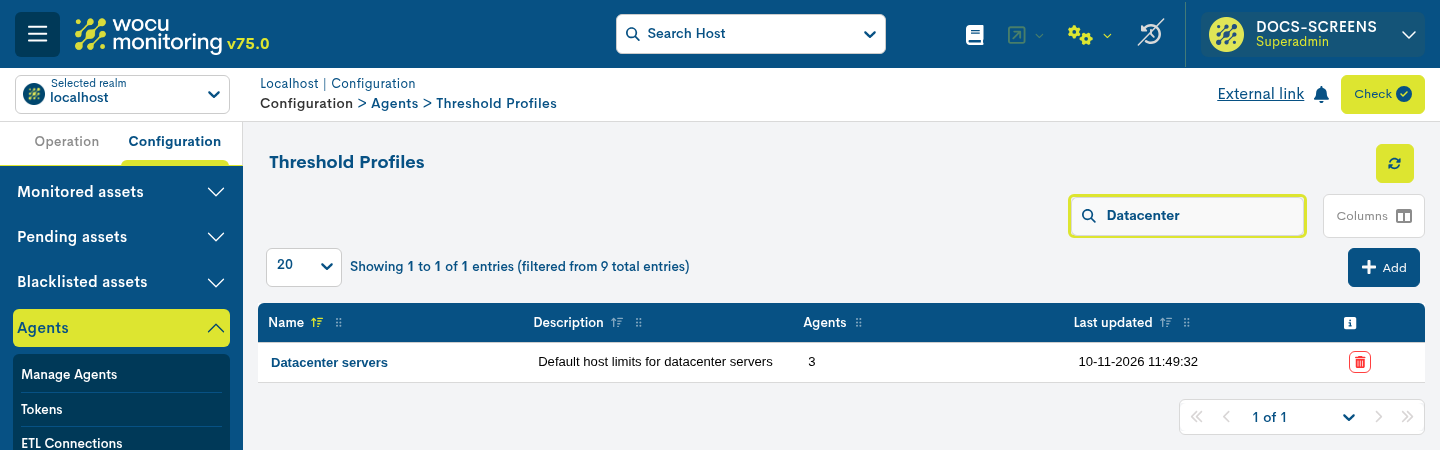
The Threshold Profiles table also shows the number of Agents using each profile and when it was Last updated. A profile used by an agent cannot be deleted.
Tokens
Tokens are usually created automatically with Generate new token when an agent is created. They can also be created in advance in Configuration > Agents > Tokens and shared by several agents of the same Realm.
Option |
Description |
|---|---|
Name |
Identifies the token. Required and unique. |
Description |
Optional free text. |
Is active |
When cleared, the receiver rejects the data of every agent that uses the token. |
Regenerate token |
Available when editing a token. Replaces the credential for every agent that uses the token. Download those agents again and set them up on every computer; until then, their data is rejected. |
The Tokens table shows the Token value, Name, Description, Created at, Total agents and Active. Treat the token value as a password. Click Add to open the Create token dialog; the token value is generated automatically. Click a token to open its details, including the agents that use it, and Edit it.
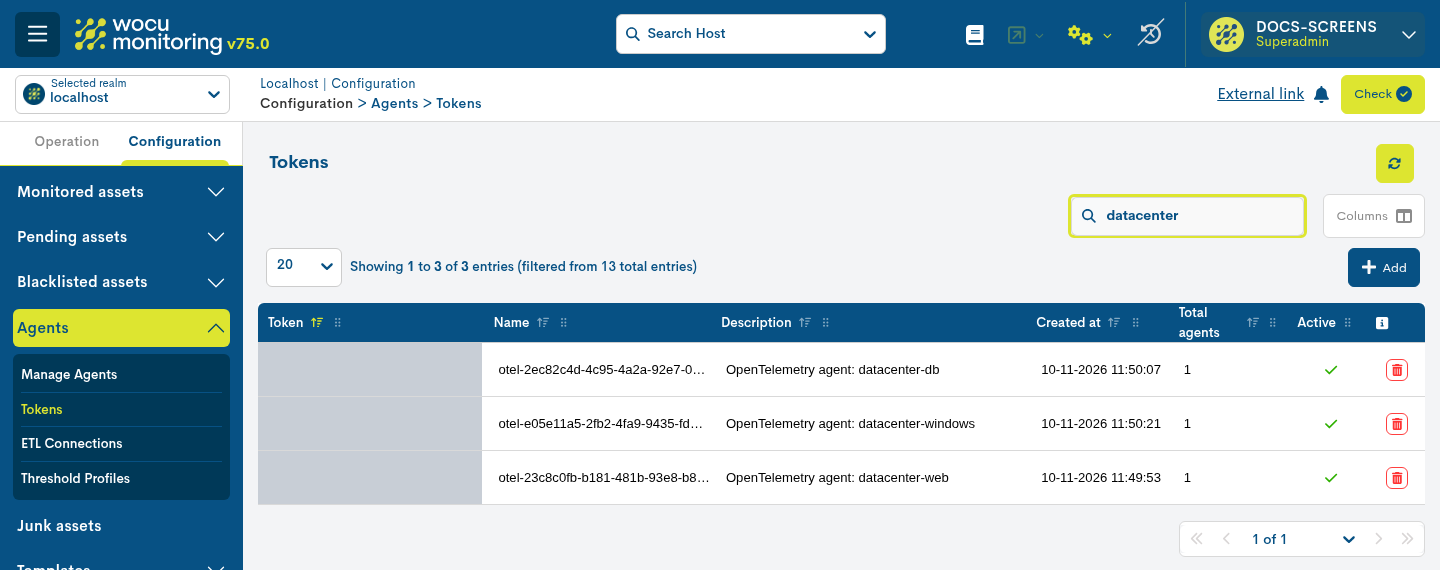
Tokens created with Generate new token are named otel-<identifier> and
described as OpenTelemetry agent: followed by the agent name, so searching
for the agent name finds its token. The token values are hidden in this
image.
Warning
Deleting a token also deletes every agent that uses it. The deletion dialog lists those agents and warns: Are you sure you want to delete this token? All associated agents will be deleted.
Result
In the downloaded archive
The ZIP archive is named
wocu-otel-agent-<agent name>-<platform>-amd64-<code>.zip. The final code
changes whenever the generated configuration changes, so downloads made before
and after an edit can be told apart. The archive contains a single
wocu-otel-agent folder:
File |
Content |
|---|---|
|
Agent installer for the selected platform. |
|
Scripts that install, configure and remove the agent. |
|
Configuration generated for this agent, including the receiver URL and the token. |
|
Installation and troubleshooting summary. |
On the monitored computer
Item |
Linux |
Windows |
|---|---|---|
Installation folder |
|
|
Service |
|
|
Configuration |
|
|
Logs |
|
Same files under |
Queued data and log file offsets |
|
|
If the setup script finds an invalid configuration, it leaves the service
stopped and reports the error in its output and in otelcol.log.
In WOCU-Monitoring
Each computer appears as a Host whose name, display name and address are the
computer’s host name, created from the generic-host template. Once
monitored, the Host has these Services:
Service |
Content |
Graphs |
|---|---|---|
CPU ( |
Host CPU usage, busy percentage per logical core, load averages and the 1-minute load normalized by the number of logical cores. |
CPU usage, CPU usage by core, Normalized load, Load average. |
Memory ( |
RAM usage, free memory, swap usage, and paging faults and operations per second. |
Memory usage, Memory free, RAM usage, Swap usage, Paging faults, Paging operations. |
Filesystems ( |
Free space, used capacity and inodes per mount. |
Disk space available, Filesystem utilization, Used inodes. |
Disk I/O ( |
Read and write operations and bytes per second, and pending operations per disk. |
Disk read IOPS, Disk write IOPS, Disk read throughput, Disk write throughput, Pending disk operations. |
Network ( |
Inbound and outbound bits, packets, errors and drops per second per interface. |
Network inbound (RX), Network outbound (TX), Network packets, Network errors, Network drops. |
TCP Connections ( |
Connections per TCP state. |
TCP connections by state. |
System ( |
Uptime and process counts per status. |
System uptime, Process counts by status. |
The Services are updated about once a minute. In the Performance tab,
measurements use names such as cpu_0_busy_pct, ram_used_pct or
filesystem_<mount>_used_pct, and the Warning and Critical columns
show the profile ranges with their unit, for example @90: %. Graphs show
one series per core, mount, disk or interface.
Disk, network and paging values are rates per second, such as
eth0_rx_bits_per_sec or sda_write_ops_per_sec; the agent calculates
them from the system counters, which are also stored unchanged. The host values
follow the same formulas as the Kibana Hosts view:
CPU usage is 100% minus the average idle percentage of all cores.
Normalized load is the 1-minute load average divided by the number of logical cores. It can exceed 100%, and Windows does not report it.
Memory free is free memory plus cache, minus kernel slab memory. On platforms that report neither cache nor slab, it is the free memory.
Kibana combines all filesystems and shows the busiest disk or interface, while WOCU-Monitoring shows each mount, disk and interface separately.
State |
Output example |
Meaning |
|---|---|---|
OK |
|
The report is complete and no limit is exceeded. The CPU Service also reports the host CPU usage and its busiest core. |
WARNING or CRITICAL |
|
Up to three exceeded limits are listed, the most severe first. |
UNKNOWN |
|
The report is incomplete or invalid. UNKNOWN takes precedence over WARNING and CRITICAL. The first CPU report after the agent starts can be UNKNOWN. |
UNKNOWN |
|
The Disk I/O or Network report has no rates. This is expected once, in the first report after the agent starts. If it persists, the agent was downloaded before rates were available: download it again and set it up on each computer. |
UNKNOWN |
|
No result was received for 180 seconds. |
The Host is UP, with the output UP - OpenTelemetry agent reporting, while
its agent reports. Its state does not depend on its Services. When no report
is received for 180 seconds, it becomes DOWN with the output
CRITICAL: Recovered status.
A Host that remains in Pending assets, or Services that do not appear, indicate that discovery is waiting for approval. A Host or Services that remain without results indicate that the configuration has not been applied with Check.
Considerations and limitations
Permissions. By default, only users whose Realm rule is the administrator rule, and superusers, can use the Agents pages. Each action (add, view, edit, download and delete) has its own permission; without it, the corresponding button is hidden or disabled. See Permission control and authorisation of user actions (UI-ACL).
Realms. The Agents pages and the automatic registration of Hosts and Services are available only in standard Realms, not in multirealms.
Shared configuration. ETL connections and threshold profiles are shared by all the Realms served by the same Import Tool. The Agents table lists the agents of all those Realms and has no Realm column.
Network. The agent opens outbound connections to the ETL connection URL only and has no proxy settings. It uses the local address
127.0.0.1:4318, which must be free on the computer. The token is encoded, not encrypted, in each request; use anhttpsURL whenever the network is not trusted.Host identity. Host names must be unique within the Import Tool. Renaming a computer creates a new Host; existing Hosts and their history are not renamed.
Configuration changes. Edits do not reach installed agents until they are downloaded and deployed again. Inactive agents can still be downloaded, but the receiver rejects their data.
Outages. While the receiver is unreachable, the agent keeps up to 50 MB of data on disk and keeps retrying. Data older than 120 seconds is stored but does not update the Service states.
Data not monitored. Per-process metrics, CPU time, log lines and the inventory are stored by the receiver but do not produce Service states.
Supported platforms
Platform |
Supported computers |
Installer |
|---|---|---|
Debian Linux |
64-bit (amd64) Debian, Ubuntu and other Debian-based distributions with systemd. |
DEB package |
Red Hat Linux |
64-bit (x86_64) Red Hat Enterprise Linux, Rocky Linux, AlmaLinux,
CentOS Stream and other distributions that provide
|
RPM package |
Windows |
64-bit Windows. |
EXE installer |
macOS can be selected in the agent form, but its download fails because WOCU-Monitoring does not include a macOS installer. ARM (arm64) computers are not supported. Windows agents do not report load averages, inodes or process counts, and do not send log lines. Downloads depend on the installers bundled with the WOCU-Monitoring installation; upgrading the agent requires a WOCU-Monitoring release that includes the newer installer.
Troubleshooting
Symptom |
Cause |
Solution |
|---|---|---|
The download shows There was a problem downloading the file or a message starting with Provision. |
The platform is macOS, or the WOCU-Monitoring installation does not include the agent installers. |
Select Debian Linux, Red Hat Linux or Windows. Otherwise, contact your WOCU-Monitoring administrator. |
|
The distribution is not Debian-based or Red Hat-based. |
The computer cannot run the agent. |
The setup script shows |
The download is for another platform (for example, a Debian Linux agent on a Red Hat computer), or several downloads were extracted into the same folder. |
Download an agent with the right Platform and extract it into an empty folder. |
The setup script shows |
The archive was not completely extracted, or the script was run from inside the compressed folder. |
Extract the complete archive and run the script from the extracted
|
|
The console is not elevated. |
Open Command Prompt with Run as administrator. |
The setup script ends with a validation error and the service remains stopped. |
The configuration is invalid, often because the CA path file does not exist on the computer. |
Read the error in the output and in |
The service runs, but the Host never appears in Pending assets. |
The receiver cannot be reached, its certificate is not trusted, or the
credential is rejected ( |
Check |
The Host is monitored, but its Services do not appear in Pending assets > Passive Services. |
The Services are registered with the first report received after the Host is monitored. |
Wait one or two minutes and refresh the table. |
The Host or its Services remain without results. |
The configuration has not been applied. |
Apply the changes with the Check button. |
A Service shows |
No data was received for 180 seconds: the service is stopped, the network is down or the credential was revoked. |
Check the service status, |
A Service stays UNKNOWN with an incomplete-report message. |
The configuration was modified by hand, or another OpenTelemetry collector reports with the same host name. |
Download the agent again and run the setup script, answering |
|
Another program, such as another OpenTelemetry Collector, uses the port. |
Stop or reconfigure the other program, then restart the agent. |
To restart the agent, run sudo systemctl restart wocu-otel-agent on Linux,
or net stop wocu-otel-agent followed by net start wocu-otel-agent on
Windows.