Detailed view of a Host Group
The Host Group Detail View provides the user with relevant and up-to-date information on each group registered in the Realm, in order to know and deepen the availability situation of the logical grouping at that moment.
Remember
Although a Host Group itself does not have its own availability status, the system proceeds to determine and assign an overall status according to the percentage of Hosts that are members of the group that are active (Up).
The following monitoring state calculation method is implemented:
If more than
66%of the member Hosts are in Up, it is considered a Up state.If between
33 %and66 %of the member Hosts are in Up, it is considered a Unreachable state.If less than
33%of the member Hosts are in Up, it is considered a Down state.If finally there are no member Hosts in Up, a Pending state is considered.

This view is displayed in a pop-up window that is positioned in front of the tab the user is in and is accessible from different parts of the tool.
The different sections of the view are described below:
KPI`s
This space shows, as a summary, a series of panels with key performance indicators and operational status of the assets present in the inventory. The data is displayed through four panels and is collected during the last 24 hours.

The view is organised into six information panels:
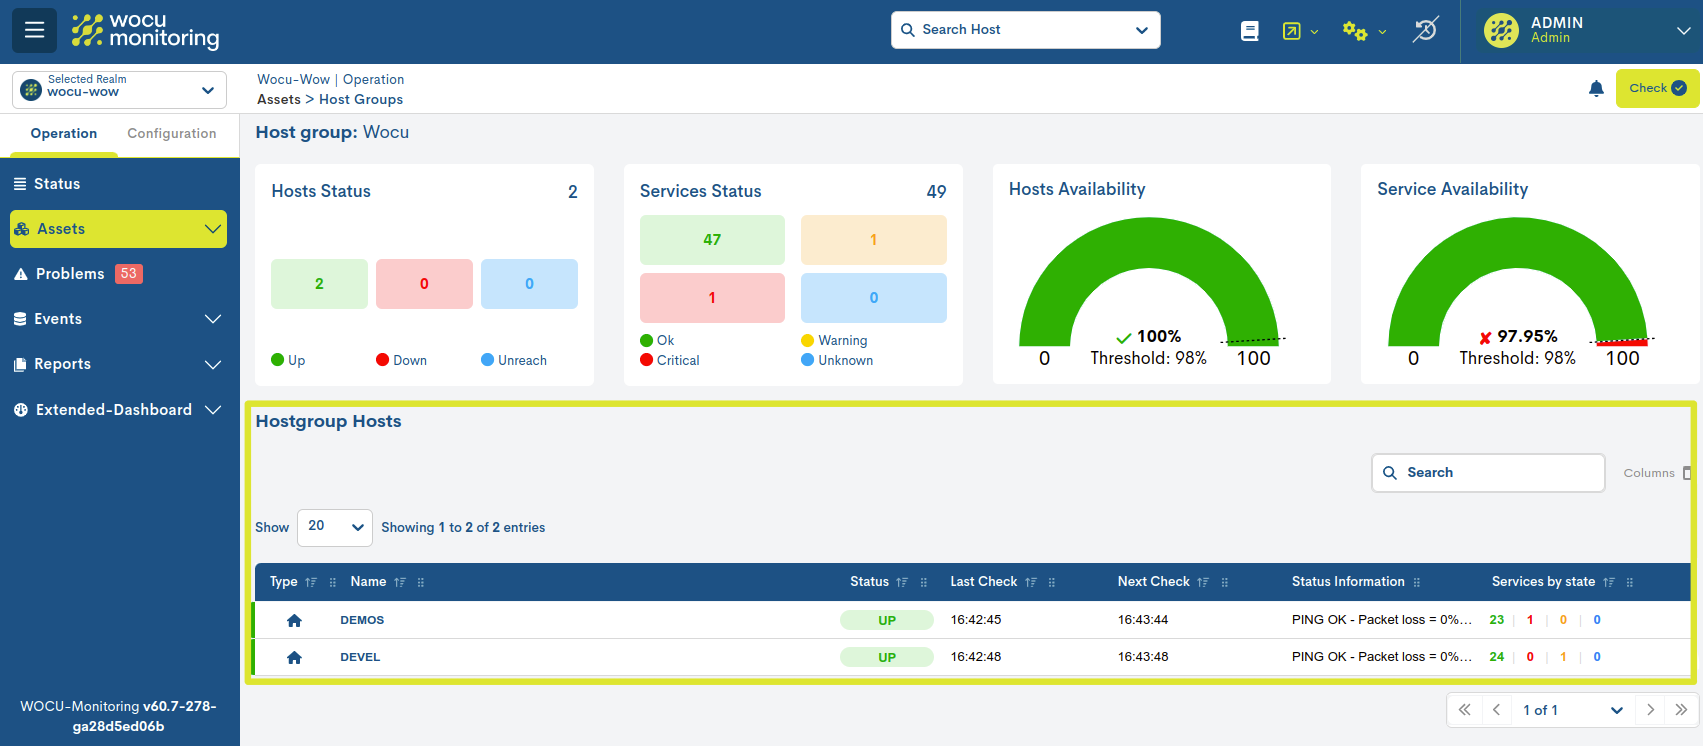
Hosts Status
Count of devices that are part of the group based on their current monitoring states.
Services Status
Count of services associated with devices that are part of the group according to their current monitoring states.
Hosts Availability
This panel shows graphically the percentage of availability obtained (calculated by the system), of the set of Hosts that are part of the group under analysis.
Represents the percentage of device availability reached in the last 24 hours. The percentage value is indicated inside the graph, together with the minimum availability threshold predefined by the user (Threshold) and marked in the graph with a dashed line.
Depending on compliance or non-compliance with the established minimum Threshold (indicated in the graph with a dotted line), the following will be placed in front of the percentage:
✓ in green: when availability exceeds the set value.
X in red: when it is below the set value.
Service Availability
This panel shows graphically the percentage of availability obtained (calculated by the system), of the set of Services associated to the Hosts that are part of the group under analysis.
Represents the percentage of device availability reached in the last 24 hours. The percentage value is indicated inside the graph, together with the minimum availability threshold predefined by the user (Threshold) and marked in the graph with a dashed line.
Depending on compliance or non-compliance with the established minimum Threshold (indicated in the graph with a dotted line), the following will be placed in front of the percentage:
✓ in green: when availability exceeds the set value.
X in red: when it is below the set value.
Hostgroup Hosts
Complete list of Hosts that make up the Group of Hosts in question.
Further complementary data is provided for each Member Facility:
- ✓ Type
This field contains an icon identifying the type of Host according to its nature. The possible options are:
Hosts: are identified with the house icon.

Business Process Hosts: are identified with the icon of the house framed in a circle.

- ✓ Name
Records the identifier term of the Device that is part of the group. Clicking on the name of the Device or Business Process will take you to its corresponding Detailed view of Hosts and Business Processes.
- ✓ Status
Records the current operational status of the Host. More information on the possible availability statuses can be found in the following link.
- ✓ Last Check
Records the date of the last operational status check performed on the Host.
- ✓ Next Check
Indicates when the next operational status check of the Host will be performed.
- ✓ Status Information
Contains the response obtained after the check operation carried out by the system.
- ✓ Services by state
This field is a summary of the Services classified by their different operational states.
Important
In large lists, it is recommended to use the search action integrated in the view, in order to quickly locate the element consulted. This action performs a simple search without making any changes to the table.