Clouds
The Clouds section allows you to integrate and manage cloud network services within the WOCU-Monitoring monitoring environment. That is, it links WOCU-Monitoring with third-party platforms (such as Cisco Meraki or Aruba, for the time being) so that the system can automatically collect information from devices and networks managed from the cloud.
Its main function is to connect WOCU-Monitoring with cloud services via API Keys, making it possible to obtain data on the status, metrics and configurations of devices through the corresponding APIs.
Thanks to this, the application offers centralised integration and unified management of local and cloud networks.
Meraki
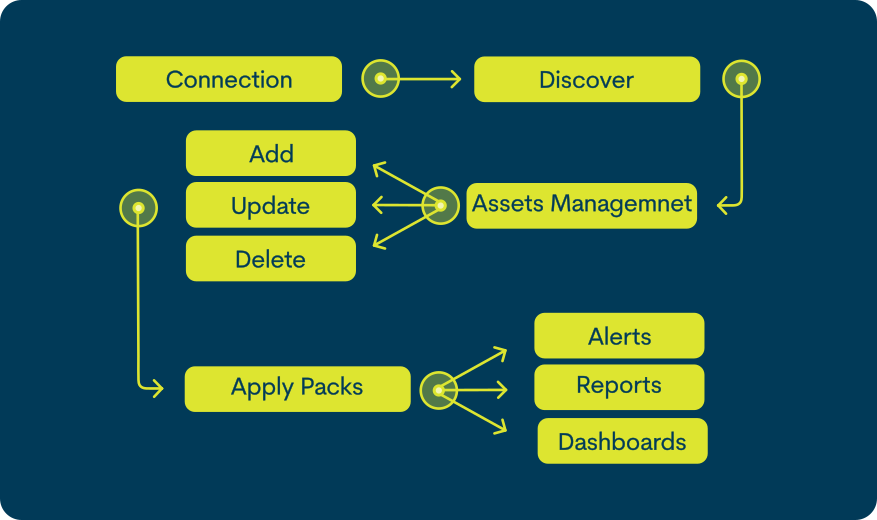
Integration with Cisco Meraki® allows WOCU-Monitoring to connect via API to the dashboard to automatically discover the organisation’s devices and create both the devices and services associated with each type of equipment.
For this purpose, specific monitoring packs have been developed, which are automatically applied according to the type of device, facilitating and standardising monitoring. Discovered devices are initially set to Pending status, allowing the administrator to decide which ones to activate for monitoring. From there, the system automatically manages the additions, updates and removals, applying the corresponding packs and starting the collection of metrics. All information is processed and stored securely, integrating into the global monitoring environment of WOCU-Monitoring for exploitation in alerts, reports and unified dashboards. More information can be found at: Workflows in Asset Importation and Management.
Prerequisites
The API Key used for integration with Cisco Meraki is associated with a specific user within the Dashboard. Therefore, the permissions assigned to that user will determine which organisations and networks will be available in WOCU-Monitoring.
If the user does not have visibility over an organisation or network in Meraki, these elements can also not be discovered and monitored by WOCU-Monitoring.
Important
If the API IP Allow list option is enabled in the Meraki organisation, it is mandatory to add the public IP of the WOCU-Monitoring server to the list of allowed addresses, otherwise it will not be possible to establish the connection.
Configuration in WOCU-Monitoring
In the global Meraki integration view (Configuration> Clouds> Meraki), the inventory with all generated accesses is located:
The following information is displayed for each access generated:
- ✓ Name
Descriptive name of the access. By clicking on this label, you can access its detail view and the editing option. The different attributes are explained in: Registration of a new connection (+ Add).
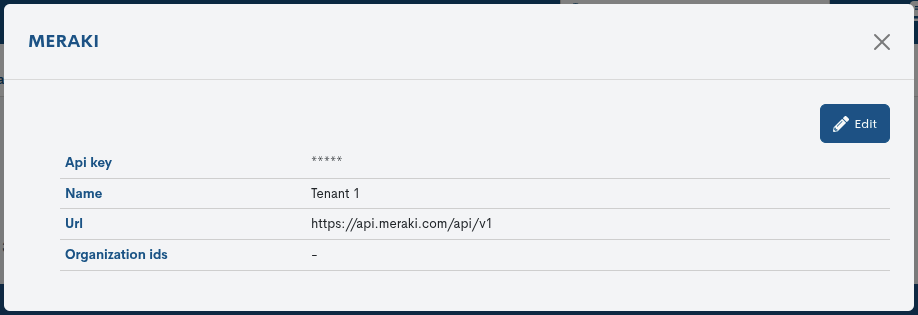
- ✓ API Key
Key with access to the Meraki Dashboard API.
- ✓ Organizations IDs
Optional field. Displays the name of the Organisation ID to be queried for information.
- ✓ Actions
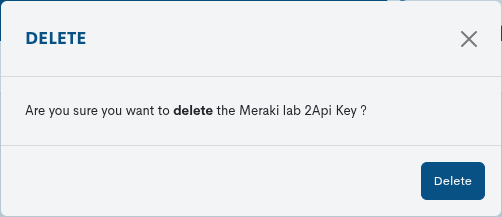
Invidivual action for deleting API access configurations. By clicking on the red bin icon, the system requests confirmation of the action with the following message:
Registration of a new connection (+ Add)
To create a new connection click on the + Add button.

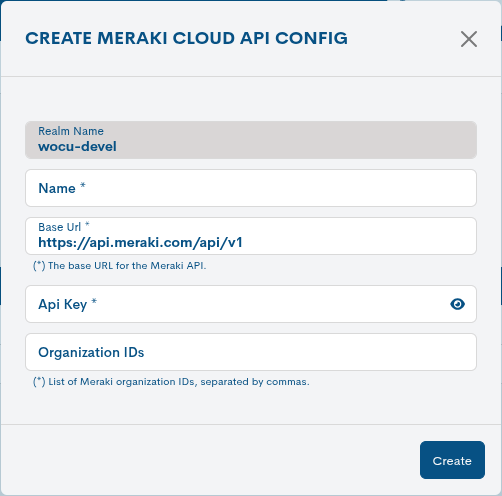
The following configuration form will then open:
- ✓ Realm Name
Auto-completable field showing the name of the realm to which the devices shall belong.
- ✓ Name
Descriptive name of the access.
- ✓ Base URL
Displays the default Cisco Meraki URL. If you have a specific URL, it should be replaced here.
- ✓ API Key
Field to enter the key generated in the Meraki Dashboard.
- ✓ Organization IDs
Allows the search to be limited to the specified organisations. If left empty, all resources to which the user who owns the API Key has access will be queried. This field only supports Organisation IDs, not names.
Finalise the configuration via the Create button. WOCU-Monitoring will then create a task associated with this connection which will be executed on a recurring basis every five minutes.
Supervision in Audit
Information about it can be found in the Audit Module:

Within the Realms section of the Audit Module, such tasks can be located:

The tasks are called Meraki and are listed in a table together with the following information:
- ✓ Date
Date and exact time when the action was recorded in the system.
- ✓ Realms
Kingdom concerned, i.e. where the action is registered.
- ✓ User
The user who triggered the action.
- ✓ Method
Indicates the method used according to the origin or nature of the audited action. It is categorised as follows:
Label
Description

Registration of a new connection or creation of a new monitoring task associated with a created connection.

Deletion of a connection or the devices associated with a connection.

Recurrent execution of the Meraki monitoring task.
- ✓ Description
Contains a general description of the registered operation.
- ✓ Affected Item(s)
Type of asset to which the action performed involves. There are many types of items stored in the database (HOST, SERVICES, REPORTS, etc.).
- ✓ Actions
Through the Info action it is possible to know in detail the characteristics of the action performed on an object.

Behaviour after task execution
On the first execution of the task, all discovered devices will be displayed in the Configuration> Pending> Host view, to be reviewed and assessed for monitoring.
Therefore, when launching Import Tasks (Tasks), the set of assets (either Hosts, Contacts, Host Groups, Host Business Processes or Services Business Processes), will pass, in first instance and provisionally, to the inventory of Pending Assets. In this location, the user can make the first configurations on the assets, such as assigning Monitoring Packs on them or even deleting non-relevant elements from the list.
After the first execution, the services remain in a pending state until they receive information on the next execution as shown in the following image:
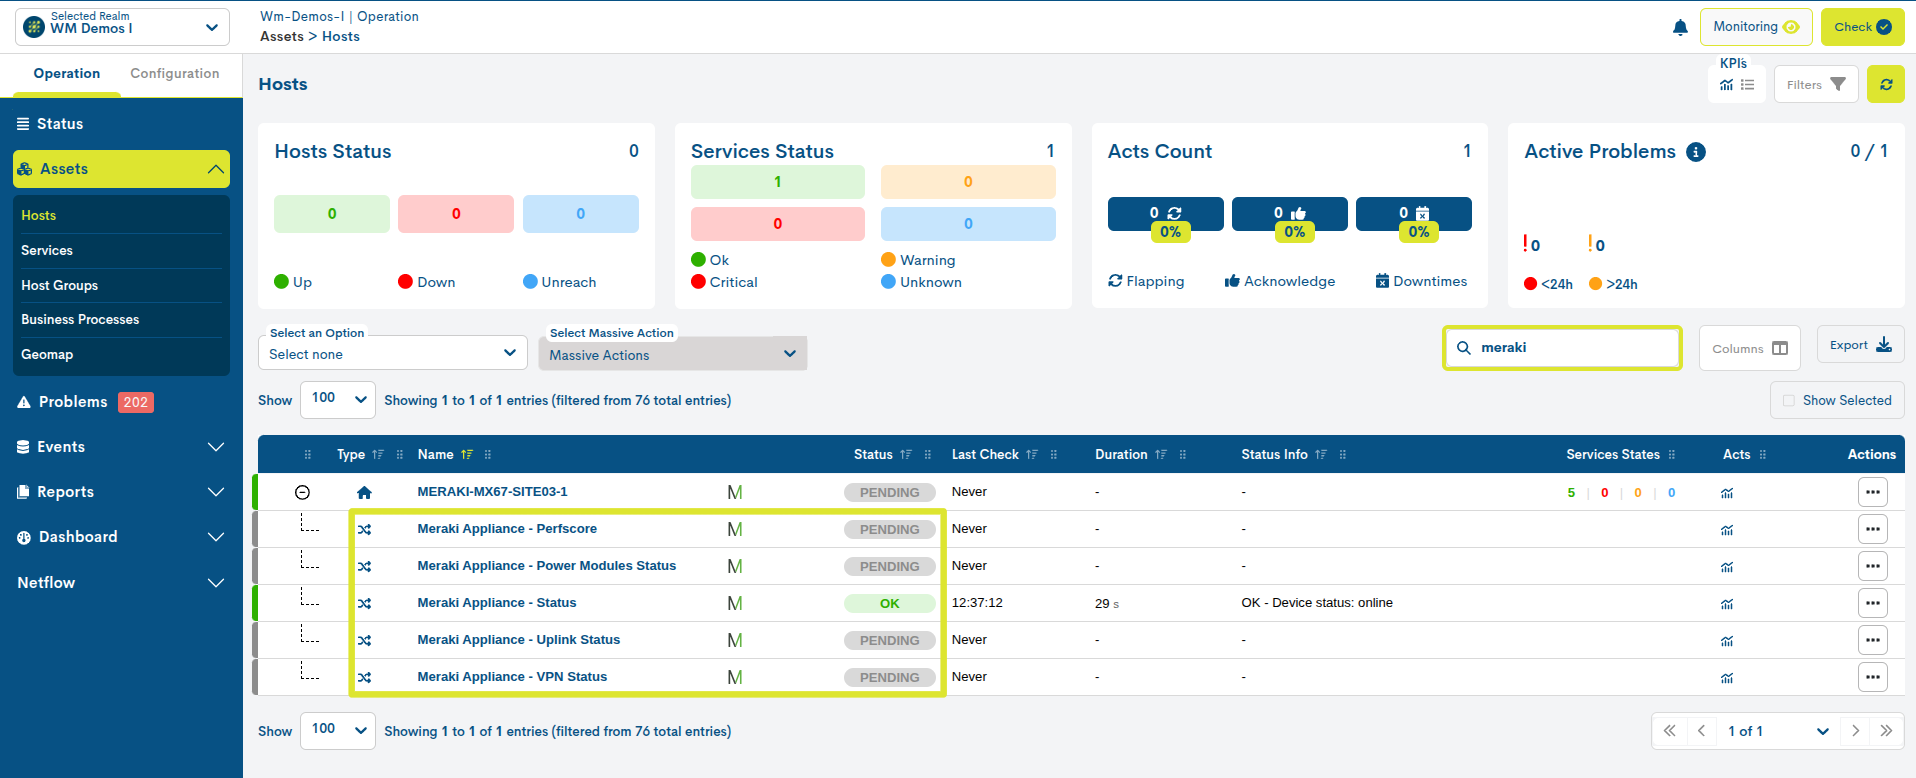
Devices that you do not want to monitor and that should not remain in Pending state can be included in the list Blacklisted Assets. This option is more optimal than deletion, as discovered devices will reappear in the list with each new execution of the task.

Visualisation in Dashboards
WOCU-Monitoring has a specific dashboard to visualise the status of the monitored devices. You can access it through: Operations/Dashboards/Cloud/Meraki.
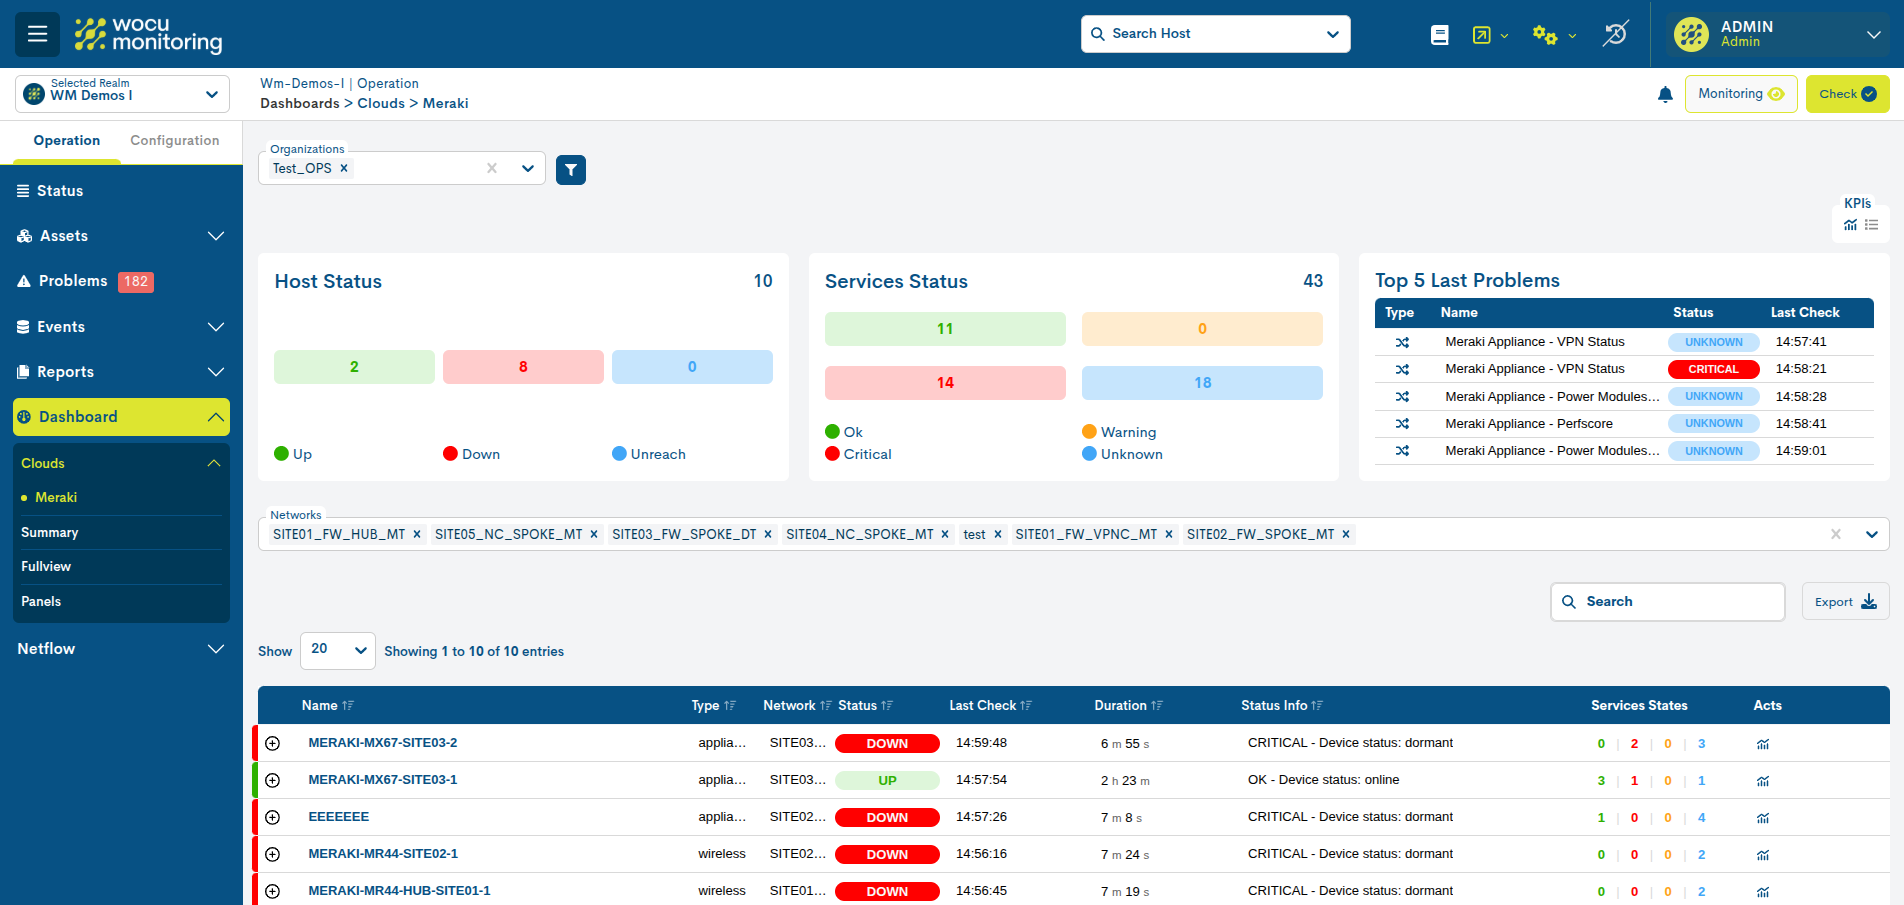
This dashboard allows filtering by Organisations and Networks, through a detailed inventory view. In addition, it is possible to export the results to CSV or JSON format. More information can be found at: Meraki.
Aruba
Integration with Aruba® allows WOCU-Monitoring to connect via API to the dashboard to automatically discover devices and associated services managed from these external platforms.
For this purpose, specific monitoring packs have been developed, which are automatically applied according to the type of device, facilitating and standardising monitoring. Discovered devices are initially set to Pending status, allowing the administrator to decide which ones to activate for monitoring. From there, the system automatically manages the additions, updates and removals, applying the corresponding packs and starting the collection of metrics. All information is processed and stored securely, integrating into the global monitoring environment of WOCU-Monitoring for exploitation in alerts, reports and unified dashboards. More information can be found at: Workflows in Asset Importation and Management.

Prerequisites
The API Key used for the integration with Aruba is associated to a specific user within the Dashboard. Therefore, the permissions assigned to that user will determine which elements will be available in WOCU-Monitoring.
If the user does not have visibility over a network in Aruba, these elements cannot be discovered and monitored by WOCU-Monitoring either.
Configuration in WOCU-Monitoring
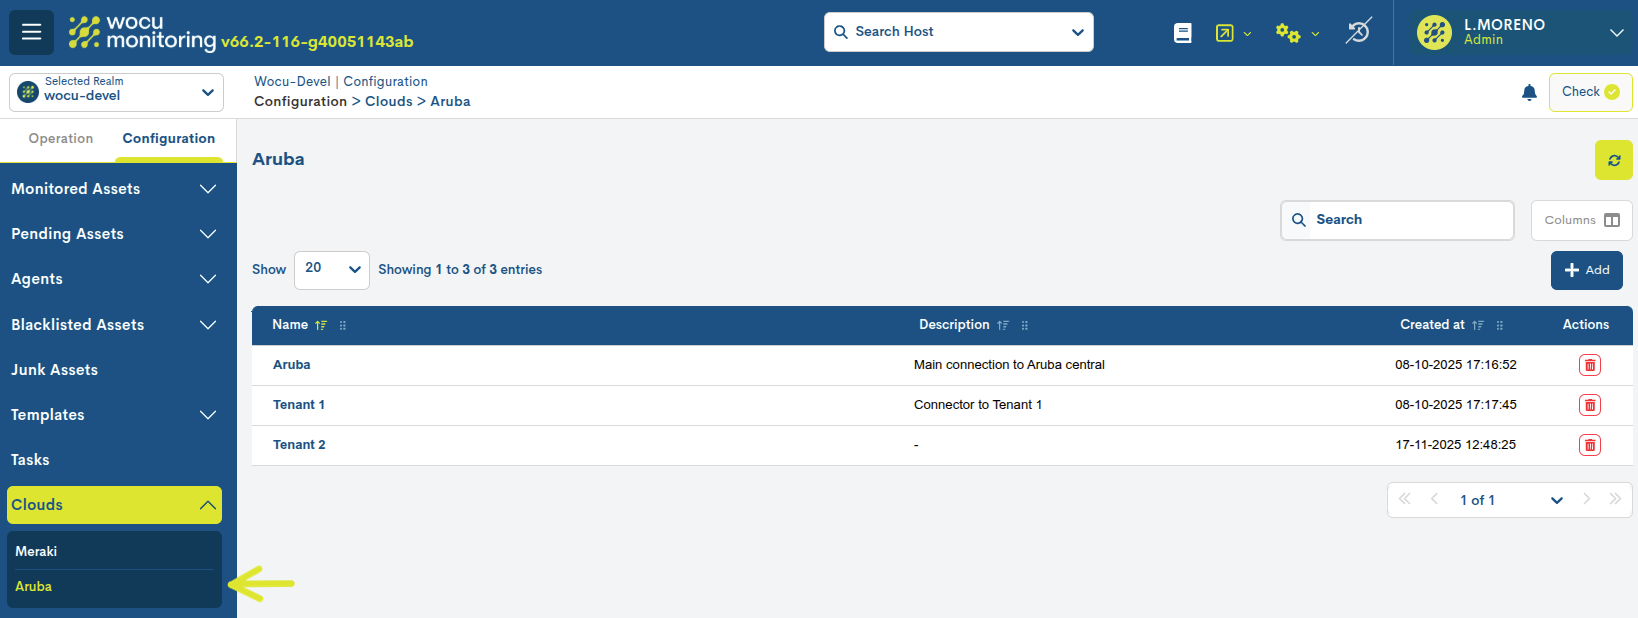
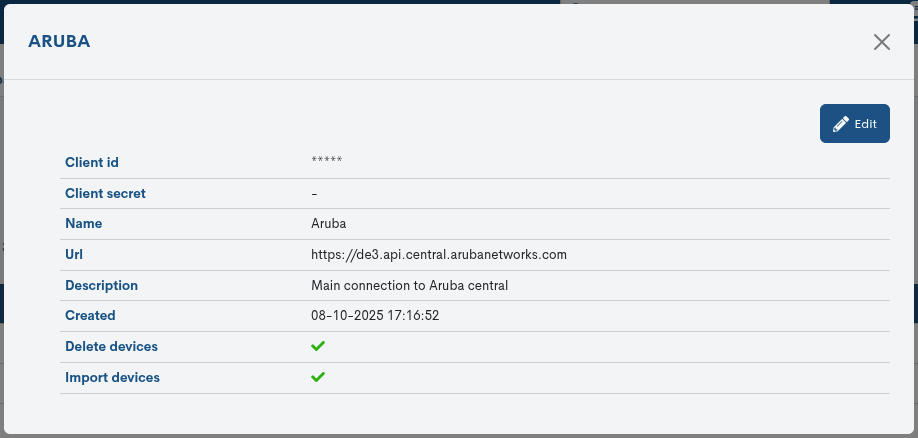
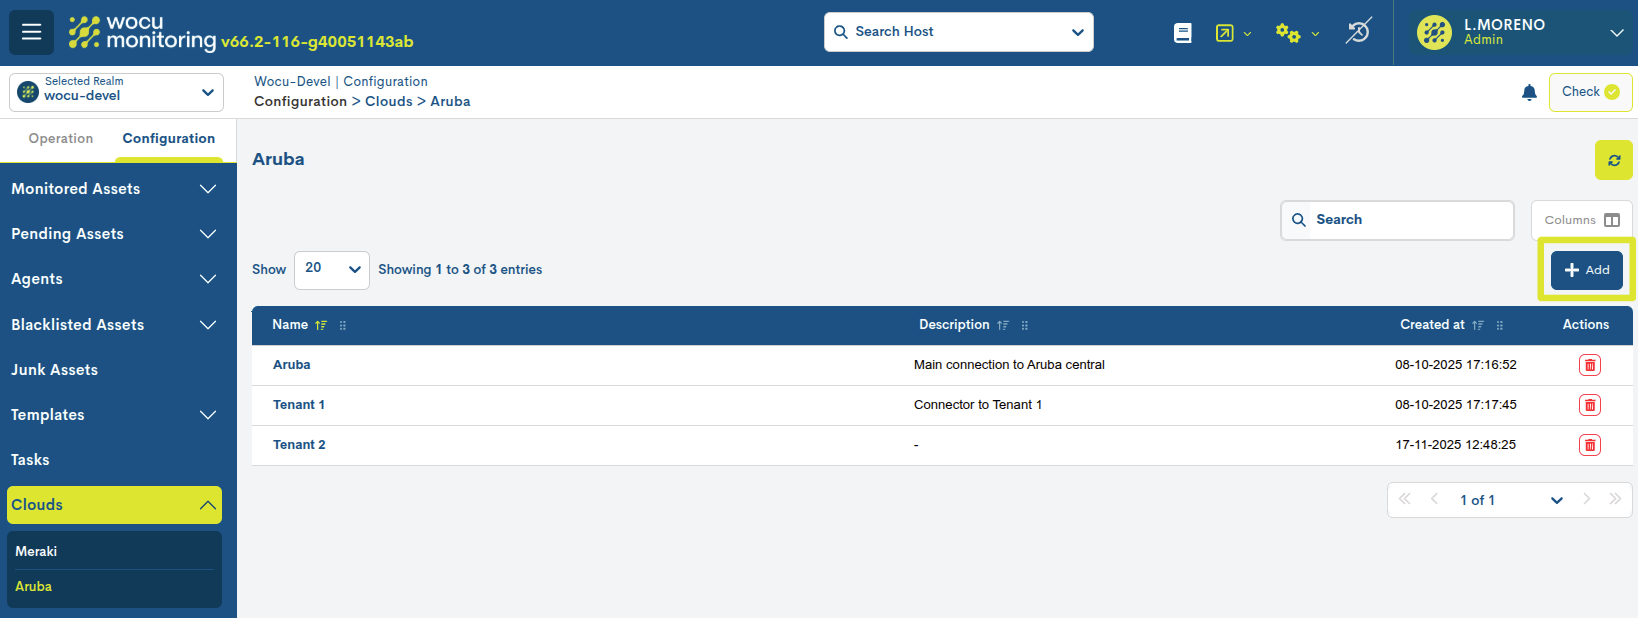
In the global Aruba integration view (Configuration> Clouds> Aruba), the inventory with all created and managed connectors is located. Each connector represents an API link between WOCU-Monitoring and a specific Aruba account or tenant.
The following information is displayed for each connector:
- ✓ Name
Descriptive name of the connector. By clicking on this label, you can access its detail view and the editing option. The different attributes are explained in: Registration of a new connection (+ Add).
- ✓ Description
Descriptive or contextual text of the connector, assigned by the user during its upload and configuration.
- ✓ Create at
Date and time of creation.
- ✓ Actions
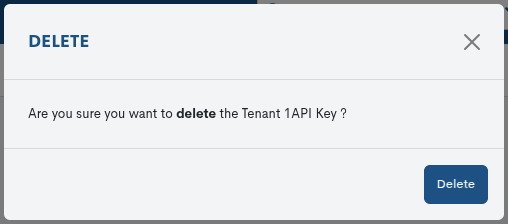
Invalid action for the deletion of connectors. By clicking on the red bin icon, the system requests confirmation of the action with the following message:
Registration of a new connection (+ Add)
To create a new Aruba connection click on the + Add button.
The following configuration form will then open:
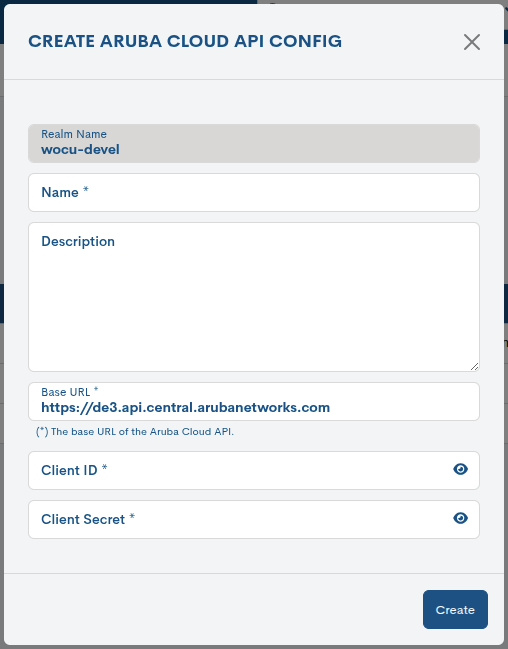
- ✓ Realm Name
Auto-completable field showing the name of the realm to which the devices shall belong.
- ✓ Name
Descriptive name of the connector.
- ✓ Description
Allows to add a more detailed description of the connector or the tenant to be connected to.
- ✓ Base URL
Displays the default Aruba URL (API base endpoint). If you have a specific URL, it must be replaced here.
- ✓ Client ID
OAuth client identifier generated in Aruba. It is part of the credentials required to authenticate using the API. It is hidden for security.
- ✓ Client Secret
Secret key associated with the Client ID. Used to authenticate WOCU-Monitoring communication with Aruba. It is hidden for security reasons.
Finalise the configuration via the Create button. WOCU-Monitoring will then validate the credentials with Aruba and create a task associated to this connection that will be executed recurrently every five minutes. In other words, the automatic synchronisation of devices and networks associated to the tenant is started.
Supervision in Audit
Information about it can be found in the Audit Module:
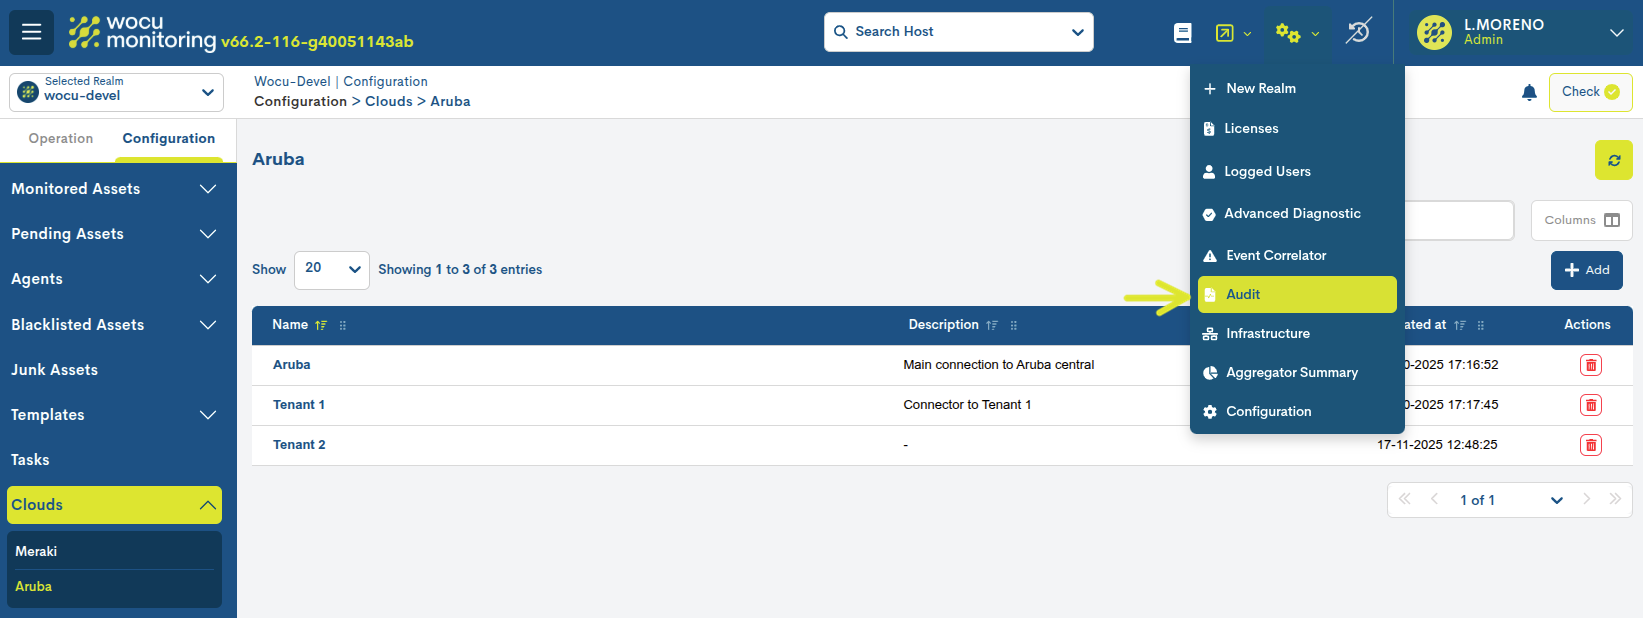
Within the Realms section of the Audit Module, such tasks can be located:
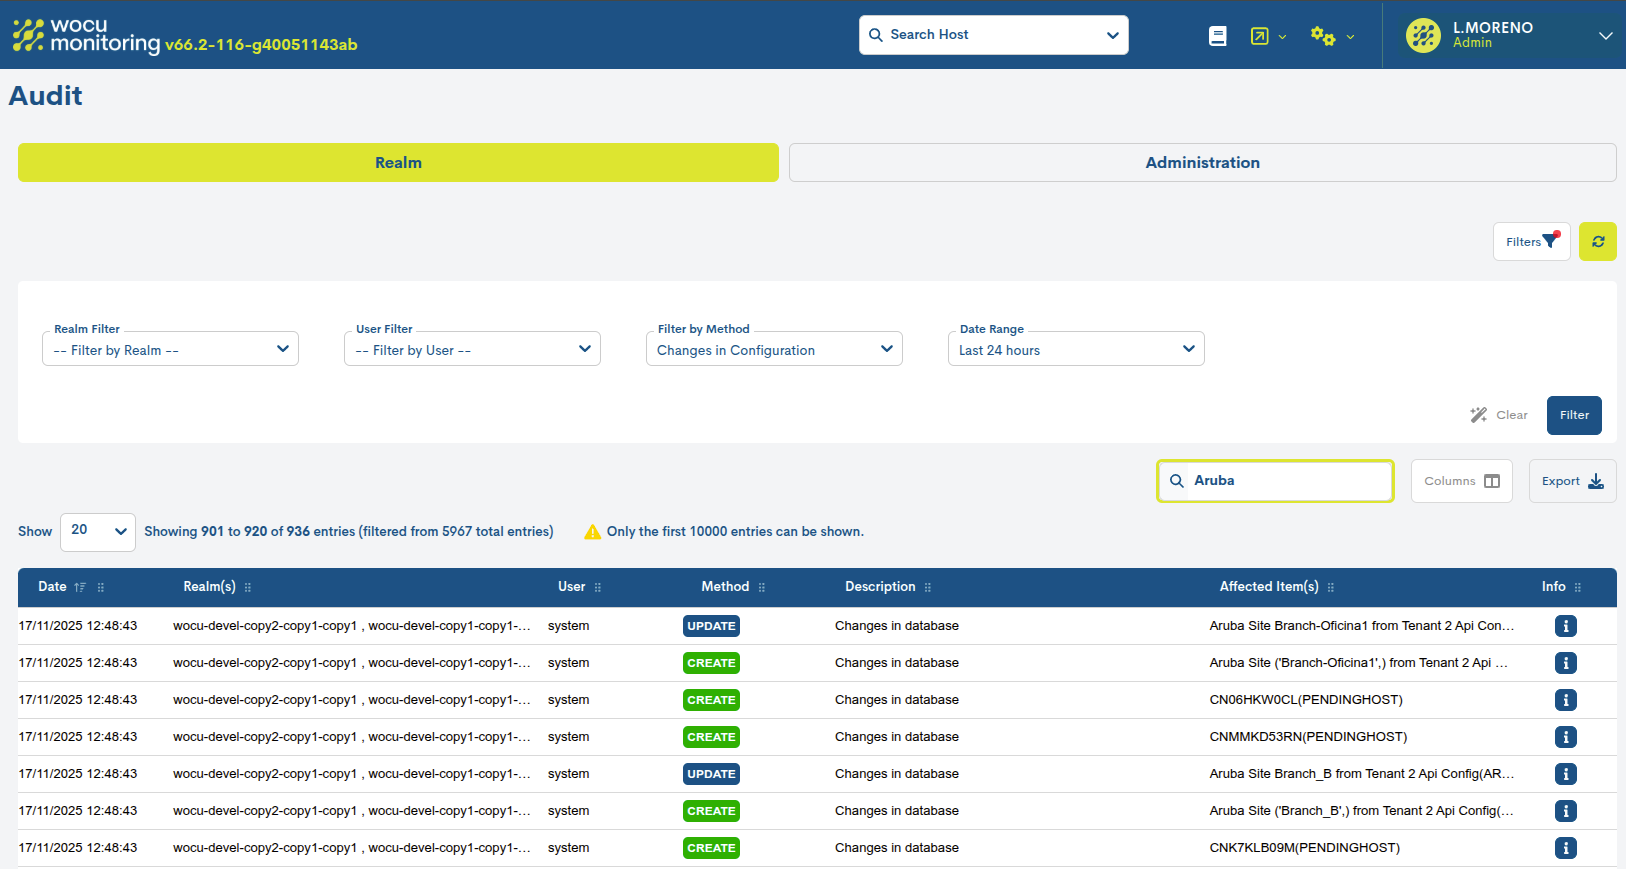
The tasks are called Aruba and are listed in a table together with the following information:
- ✓ Date
Date and exact time when the action was recorded in the system.
- ✓ Realms
Kingdom concerned, i.e. where the action is registered.
- ✓ User
The user who triggered the action.
- ✓ Method
Indicates the method used according to the origin or nature of the audited action. It is categorised as follows:
Label
Description

Registration of a new connection or creation of a new monitoring task associated with a created connection.

Deletion of a connection or the devices associated with a connection.

Recurrent execution of the Aruba monitoring task.
- ✓ Description
Contains a general description of the registered operation.
- ✓ Affected Item(s)
Type of asset to which the action performed involves. There are many types of items stored in the database (HOST, SERVICES, REPORTS, etc.).
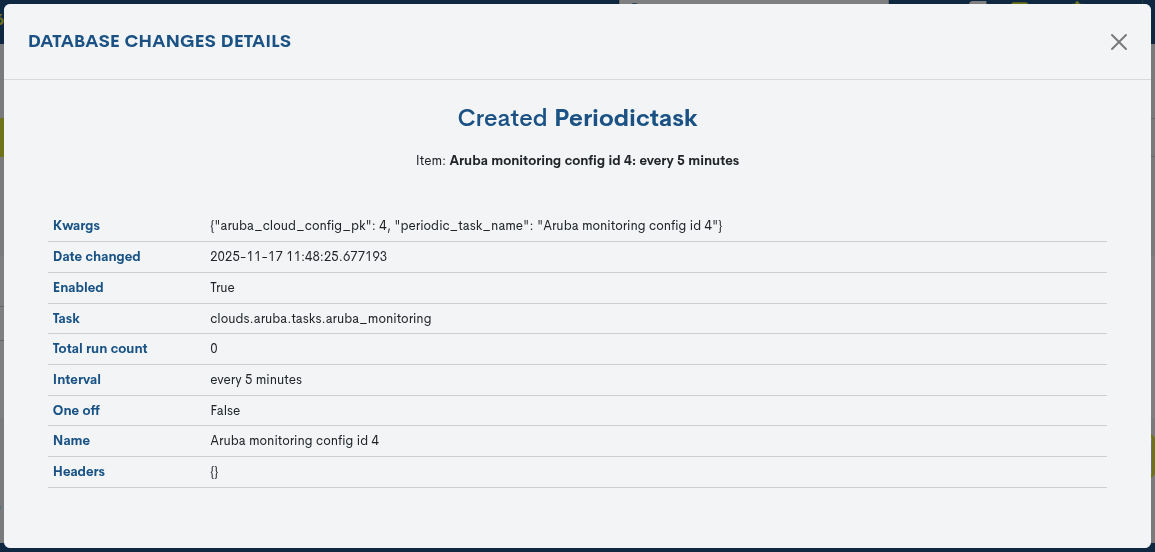
- ✓ Actions
Through the Info action it is possible to know in detail the characteristics of the action performed on an object.
Behaviour after task execution
On the first execution of the task, all discovered devices will be displayed in the Configuration> Pending> Host view, to be reviewed and assessed for monitoring.
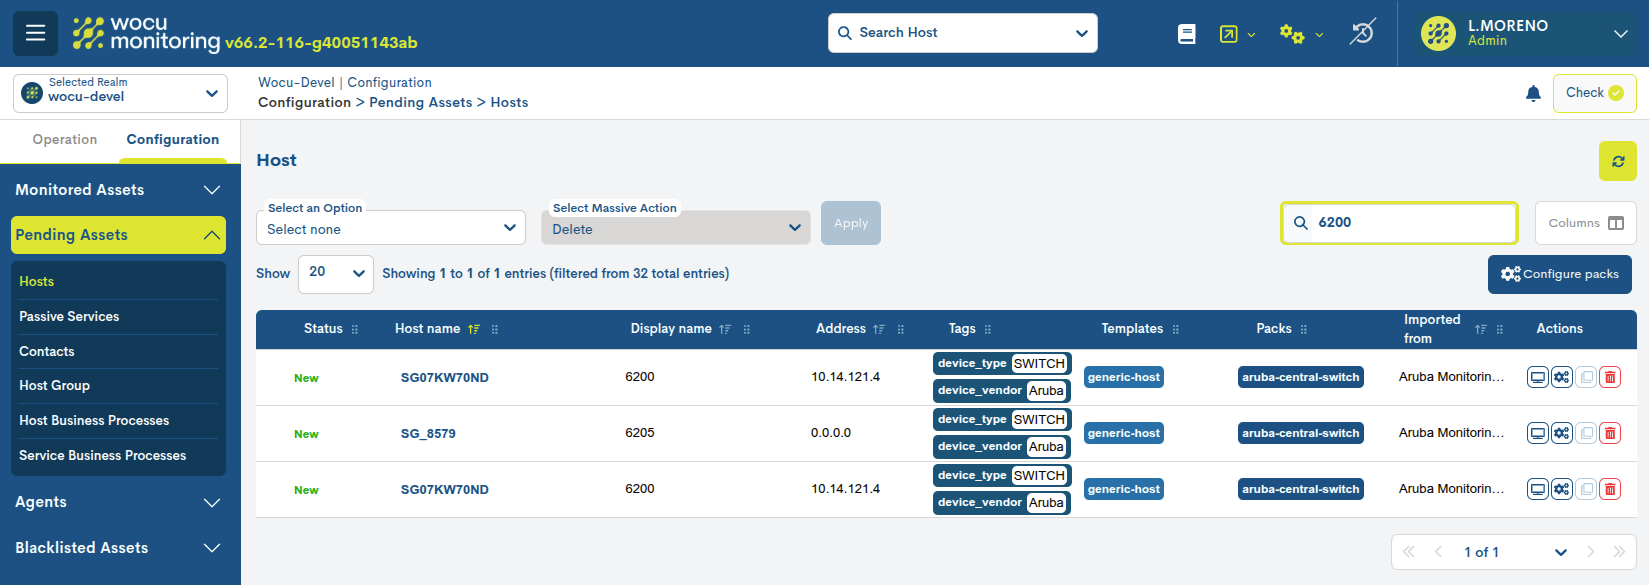
Therefore, when launching Import Tasks (Tasks), the set of assets (either Hosts, Contacts, Host Groups, Host Business Processes or Services Business Processes), will pass, in first instance and provisionally, to the inventory of Pending Assets. In this location, the user can make the first configurations on the assets, such as assigning Monitoring Packs on them or even deleting non-relevant elements from the list.
After the first execution, the services remain in a pending state until they receive information on the next execution as shown in the following image:
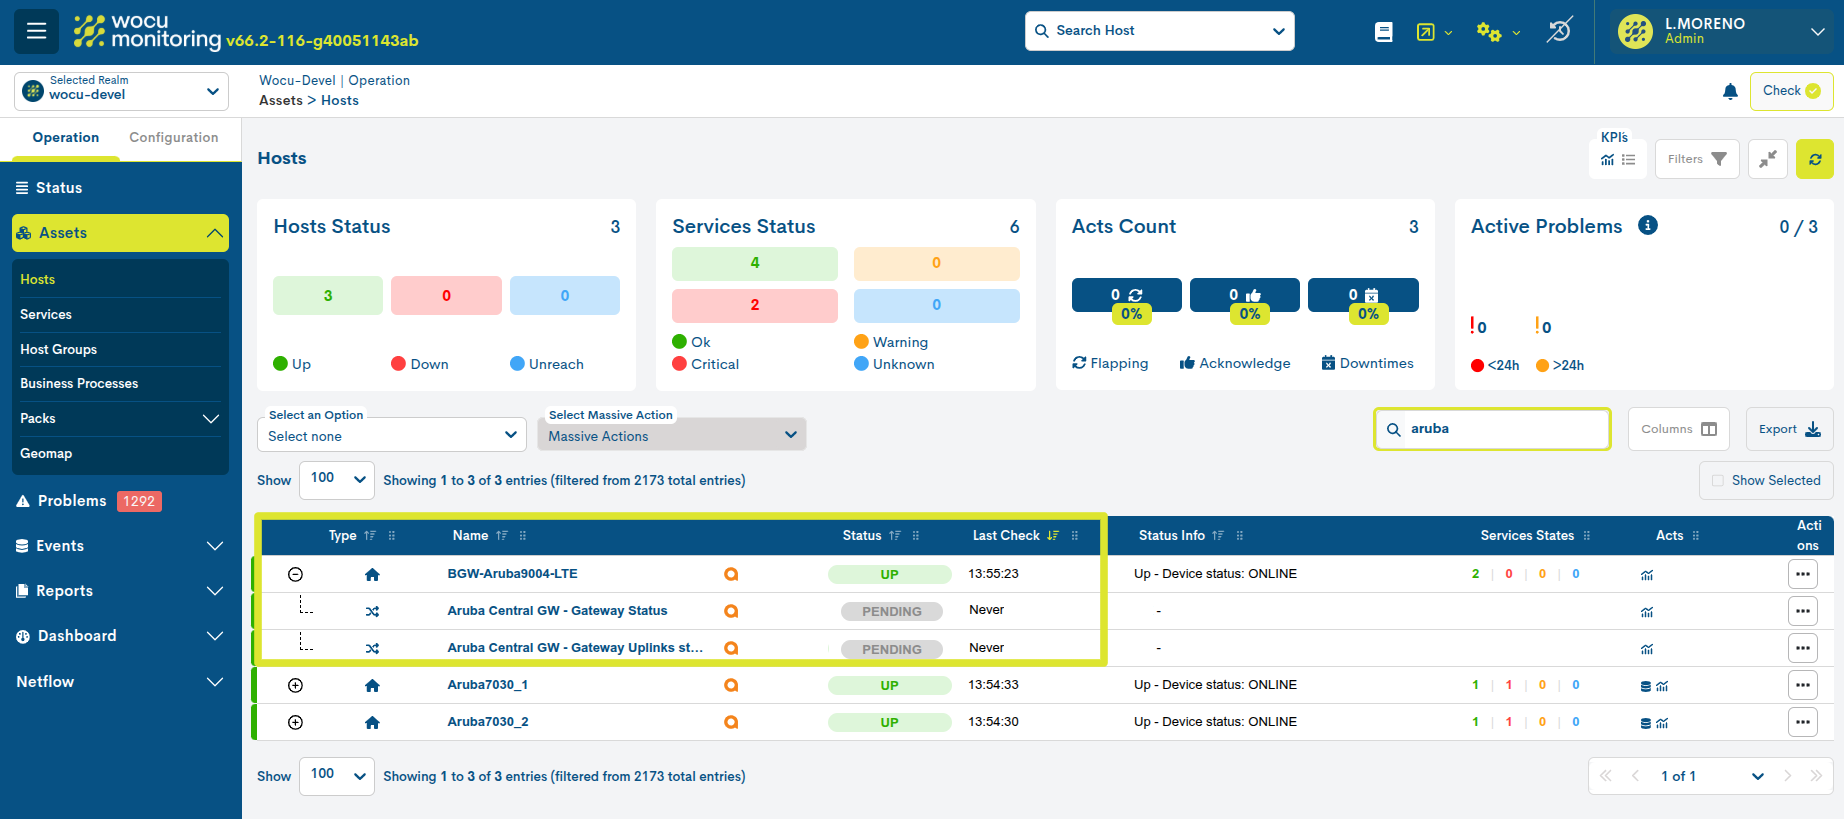
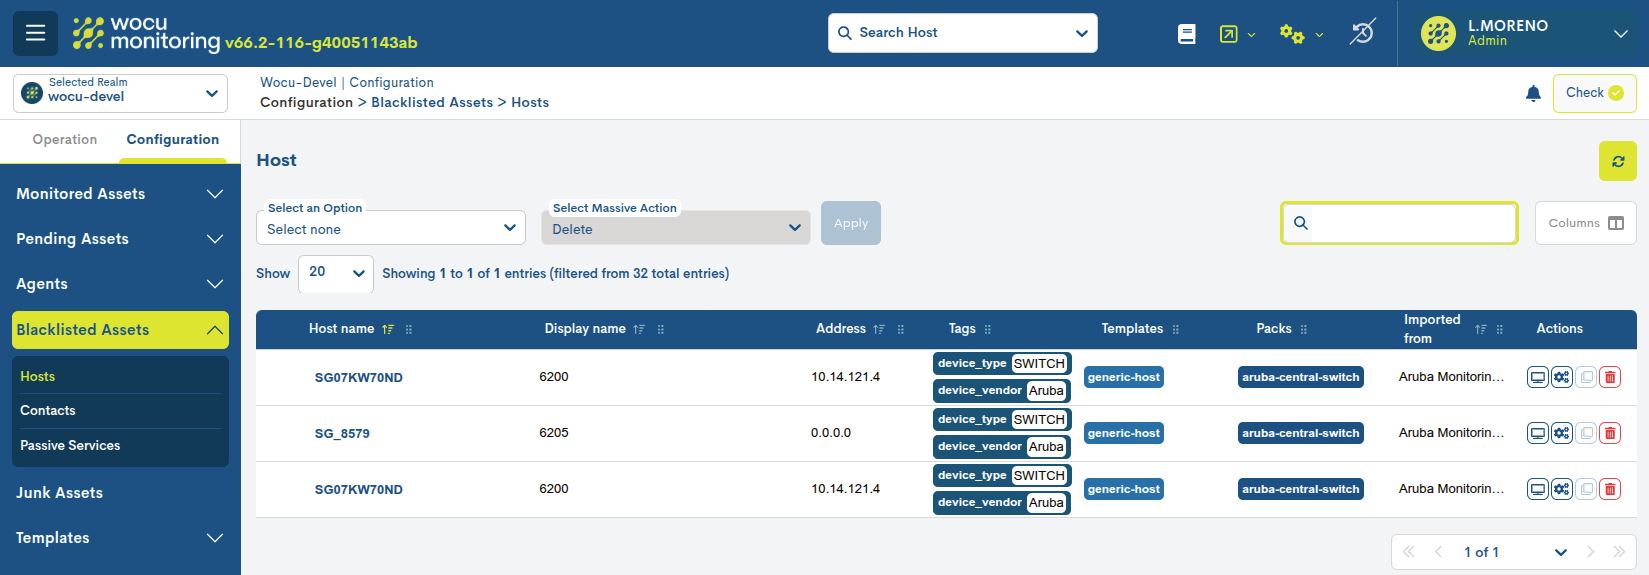
Devices that you do not want to monitor and that should not remain in Pending state can be included in the list Blacklisted Assets. This option is more optimal than deletion, as discovered devices will reappear in the list with each new execution of the task.
Visualisation in Dashboards
WOCU-Monitoring has a specific dashboard to visualise the status of the monitored devices. You can access it through: Operations/ Dashboards/ Cloud/ Aruba.
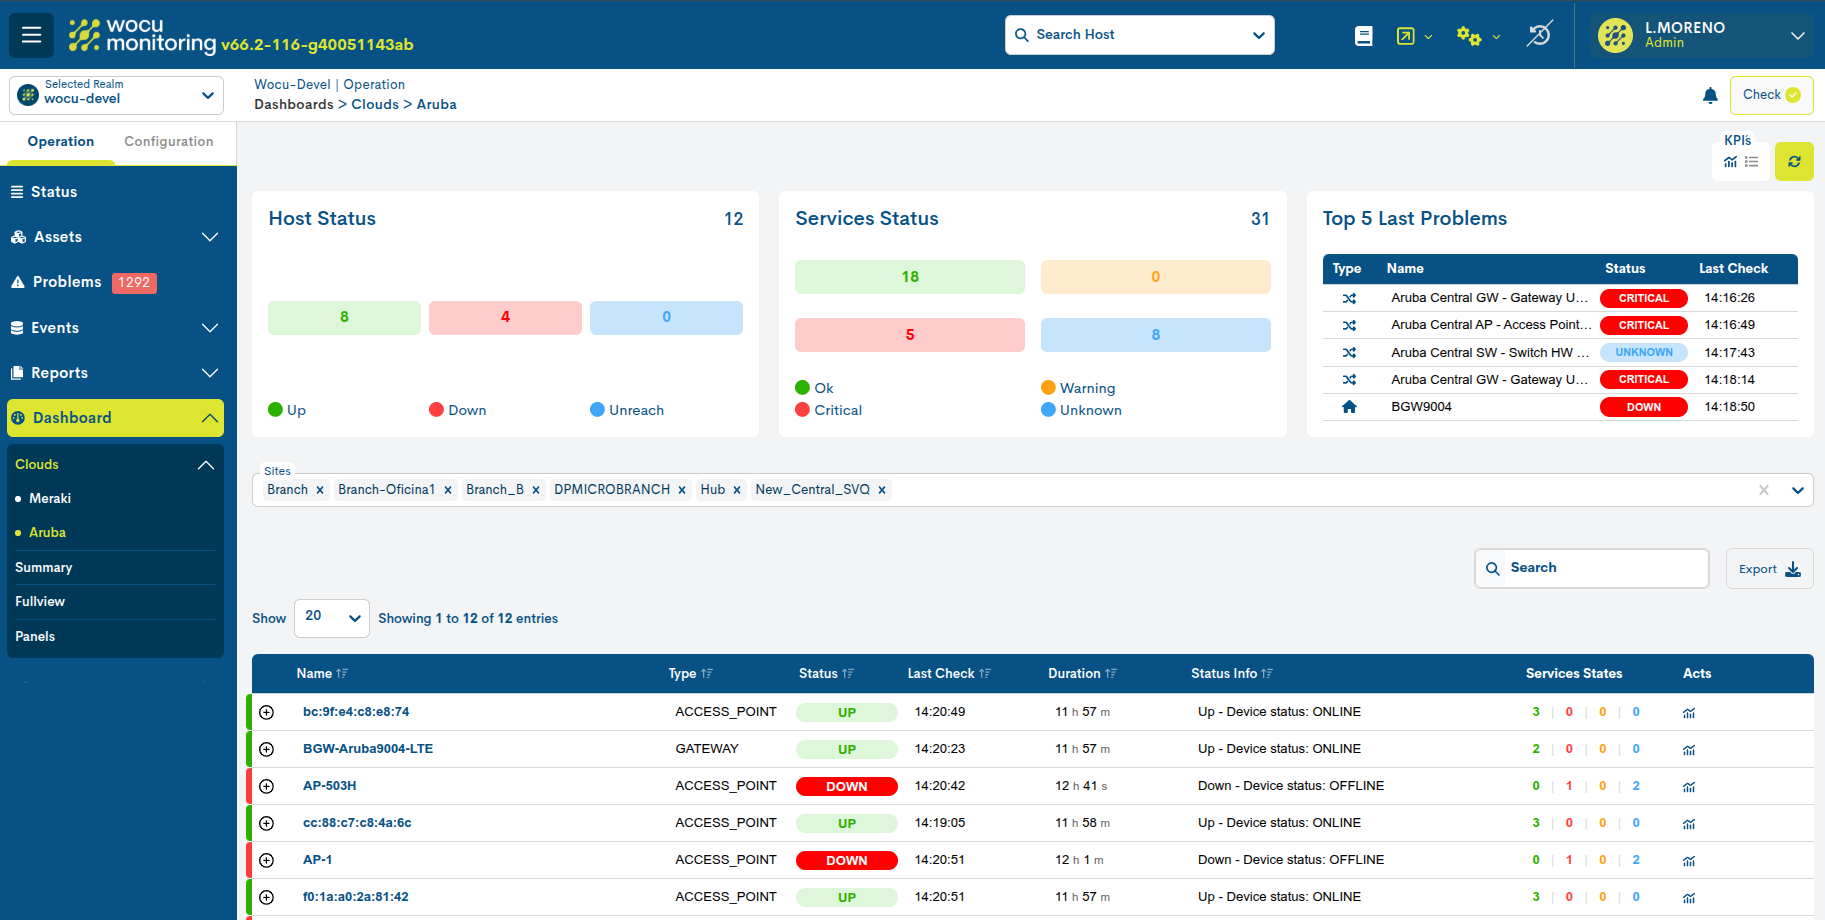
This dashboard allows you to filter by Sites, through a detailed view of the inventory. In addition, it is possible to export the results to CSV or JSON format. More information can be found at: Aruba.

