Configuration and integration of Grafana dashboards in WOCU-Monitoring
WOCU-Monitoring offers as a complement to its functions a number of OpenSource tools and applications, from which a variety of dashboards can be generated and exported, see Grafana.
Attention
The Dashboards section is an additional module that enriches the functionality that WOCU-Monitoring offers by default.
Thanks to the versatility of WOCU-Monitoring to manage and process an infinite number of metrics, with values collected and stored during checks, it is possible to integrate and render dashboards with powerful graphical capabilities, i.e. WOCU-Monitoring supports the integration, visualisation and processing of data from a multitude of sources and renders them in its own interface.
The tab Dashboards of a given Realm centralises the different dashboards enabled in WOCU-Monitoring, freely configurable and selectable by the Administrator.

This use case covers from the creation of a dashboard in Grafana, to its integration and display in the Dashboards tab of a Realm in WOCU.
This entry is divided into four blocks:
Creation of the dashboard in Grafana.
Exporting the dashboard from Grafana
Integration of the dashboard in WOCU.
Display in the Dashboards tab of a Realm.
1. Creating a dashboard in Grafana.
There are two access routes to Grafana:
By means of the valid URL resulting from the HTTP protocol access to the monitoring IP, subsequently adding the suffix grafana:
http://<IP_monitoring>/grafana
From WOCU-Monitoring, through its shortcut located in the top navigation bar, as long as it has been previously registered.

Remember
WOCU-Monitoring reserves the top bar for the Administrator to configure and anchor direct links to tools complementary to WOCU-Monitoring.
More information can be found at Adding shortcuts to the top bar of WOCU-Monitoring.
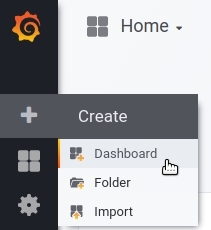
Next, we will leave the application and go to the main Grafana Home page. In the left vertical menu, click on the icon ➕, and choose the option Dashboard, to start with the configuration.
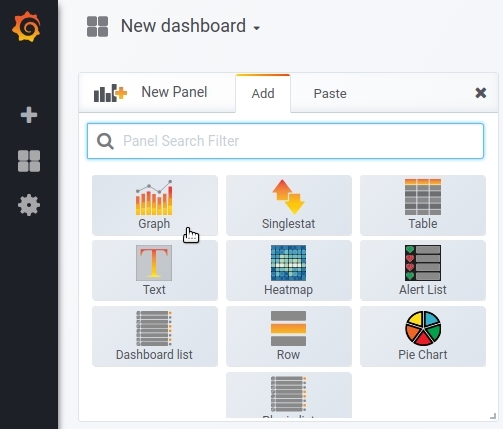
The first step is to add the first panel (basic graphic element for data visualisation). Grafana provides different types of panels, in our case, we will select a graphic panel: Graph.
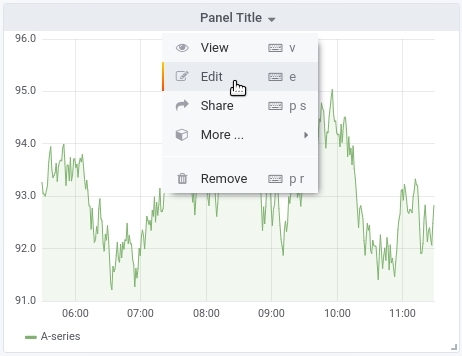
As a starting point we will work on this graph, starting to edit from the top drop-down menu (next to the title of the panel):
Next, we will start configuring the metrics and other visual aspects of the graph. In this panel we will add the traffic_in and traffic_out metrics, to visualise the traffic flow of the different network interfaces of a Host.
To do so, we will make the following configuration:
We go to Metrics and in the Data Source dropdown we will choose the
influx-demosdatabase to which Grafana will connect to extract the metric data. All databases must be previously registered from the Grafana configuration module. More information in: Registration of Data Sources on Grafana.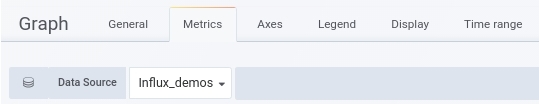
Grafana allows you to add multiple queries to overlap graphs of different data. Next, we will define one query for each metric. The data will automatically be displayed in the top graph:
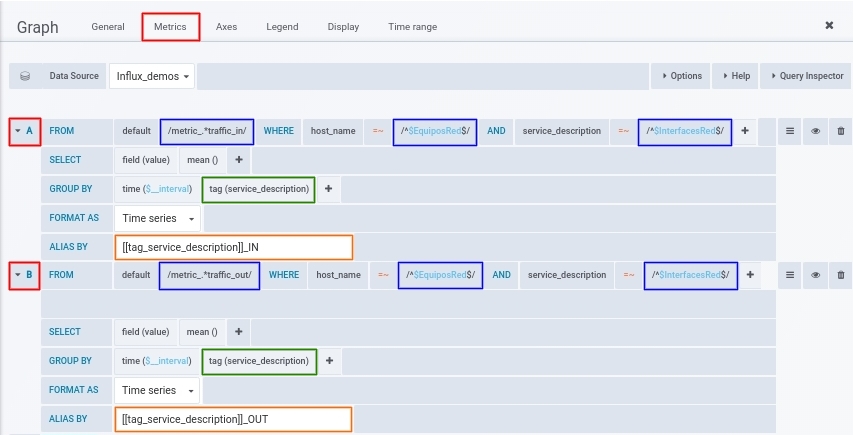
Query A
FROM: in Select measurement we will define the regular expression
/metric_.*traffic_in/, to capture all existing inbound traffic metrics in the DB.Then, in the WHERE operator we will define the following query:
host_name =~
/^$Network_Hosts$/–> this variable queries and returns only hosts with DB connectivity.service_description =~
/^$InterfacesRed$/–> this variable complements the previous condition, returning the interfaces (when they exist) of the network equipment. In conclusion, it will filter out the network hosts that have the generic traffic monitoring packet applied. More information can be found in: Constructing Query Variables in Grafana.The following parameters shall be configured to gather all incoming traffic values per interface into a single value (average) and display them in the legend, using tags and patterns:
GROUP BY: there can be several services associated to a metric and vice versa, so we will add the
tag (service_description)to group all the services associated to the incoming traffic metric.ALIAS BY: add the pattern
[[tag_service_description]]_INas an identifier for network interfaces with incoming traffic in the legend.
Query B
FROM: in Select measurement we will define the regular expression
/metric_.*traffic_out/, to capture all existing inbound traffic metrics in the DB.Then, in the WHERE operator we will define the following query:
host_name =~
/^$Network_Hosts$/–> this variable queries and returns only hosts with DB connectivity.service_description =~
/^$InterfacesRed$/–> this variable complements the previous condition, returning the interfaces (when they exist) of the network equipment. In conclusion, it will filter out the network hosts that have the generic traffic monitoring packet applied. More information can be found in: Constructing Query Variables in Grafana.The following parameters shall be configured to gather into a single value (average) all outgoing traffic values per equipment or interface and display them in the legend, by using tags and patterns:
GROUP BY: there can be several services associated to a metric and vice versa, therefore, we will add the
tag (service_description)to group all the services associated to the outgoing traffic metric.ALIAS BY: add the pattern
[[tag_service_description]]_OUTas the identifier of the network interfaces with outgoing traffic in the legend.
In Axes you configure the axes of the graph by modifying the scale and unit type. For this use case, on both axes we will change the unit to
Bits/secfor the traffic data measurement.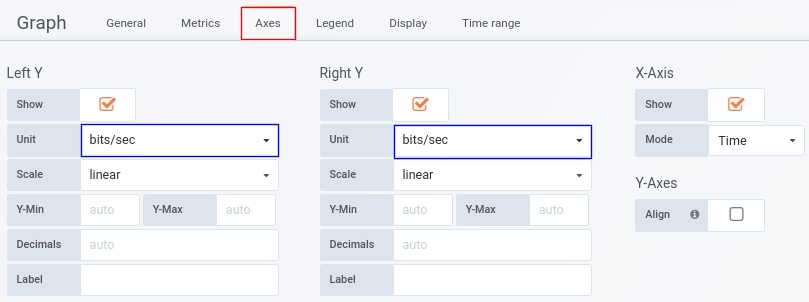
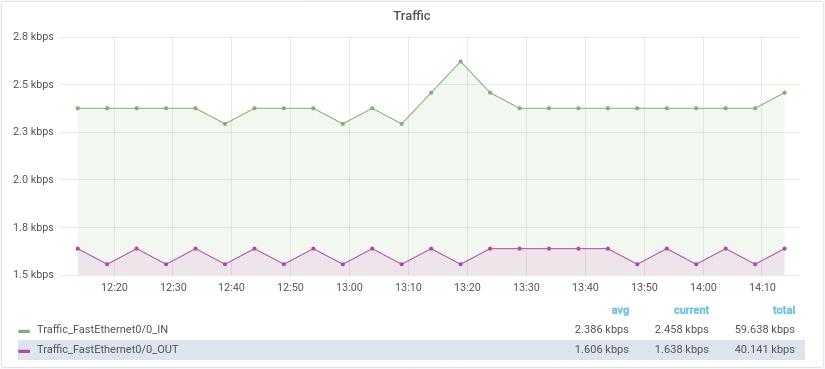
In Legend the legend of the graph is configured. For this use case we will display the legend in tabular format (checkbox
As table) and add the last collected value of the metric (checkboxcurrent), the average value (checkboxavg) and total (checkboxtotal) resulting from the given query.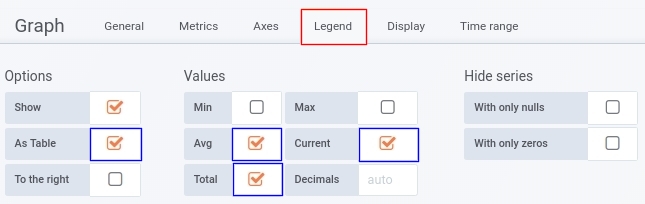
In Display you define the style of the plot. For our use case, we will check the
Pointsbox, to plot the data along the axis with points and adjust its size inPoint radius. Finally, by selecting the connected option inNull valuethe plot will also link the null (unknown or missing) values.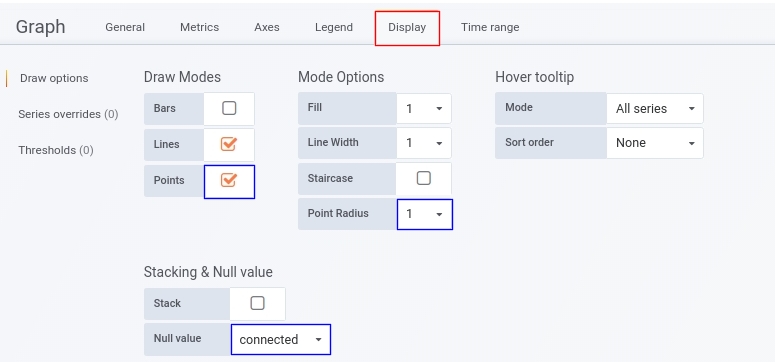
To finalise the configuration, in General we will add the title to the graph in the
Titlefield which will be displayed at the top of the panel.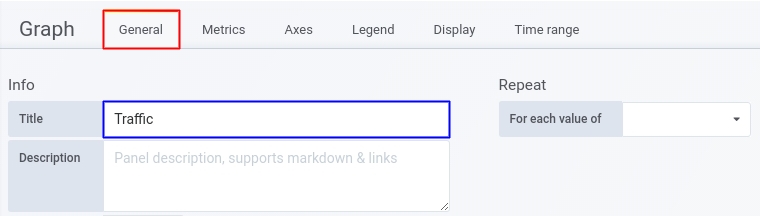
Finally, we now have the first graph of the dashboard.
Depending on the configuration established through the use of variables, in the upper part of the graph we can select two elements that will influence the data displayed: a specific Host in the NetworkEquipment drop-down menu and one of the network interfaces identified in that Host in the NetworkInterfaces filter. As a consequence, the graph will be bounded and updated with the metric values related to the incoming and outgoing traffic of that interface.
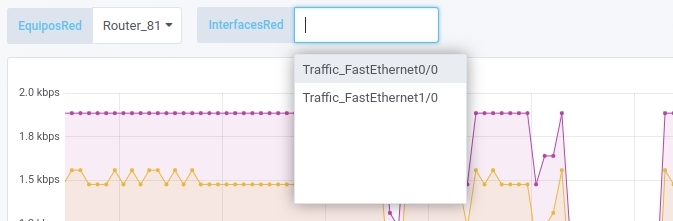
So this graph reflects the traffic throughput of the Hosts with the N interface.
2. Export and integration of the dashboard into WOCU
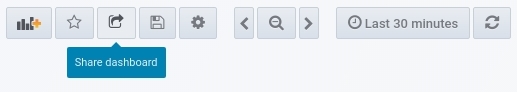
Once the final dashboard has been generated, it will be exported. To do so, in the upper header of the view, among the actions available on the right-hand side, click on the Share dashboard option.
The following dialogue box will open with three possible options for sharing the dashboard (Link, Snapshot and Export). We stay in the Link section view, where it will automatically generate a unique link of the dashboard that we will have to copy.
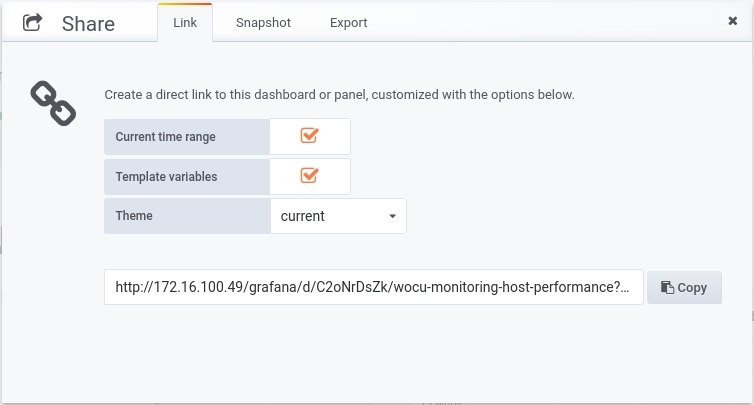
We will keep the default configuration, to export the dashboard with the last saved time range and the values of the selected template variables.
Attention
It is important to save all changes made before generating and copying the link.
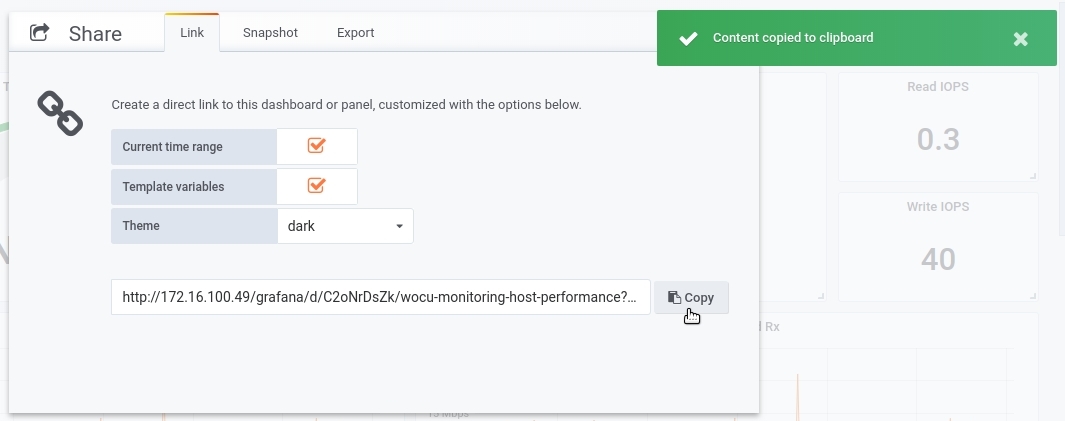
The last step in Grafana is to click on the Copy button, so that the dashboard link is moved to our clipboard.
3. Integration of the dashboard in WOCU-Monitoring
The aggregation of the dashboard will be carried out only by system administrators, but will be visible to all other users.
By logging into WOCU-Monitoring and from the Advanced Configuration Import-tool, we can link our Dashboard built in Grafana.
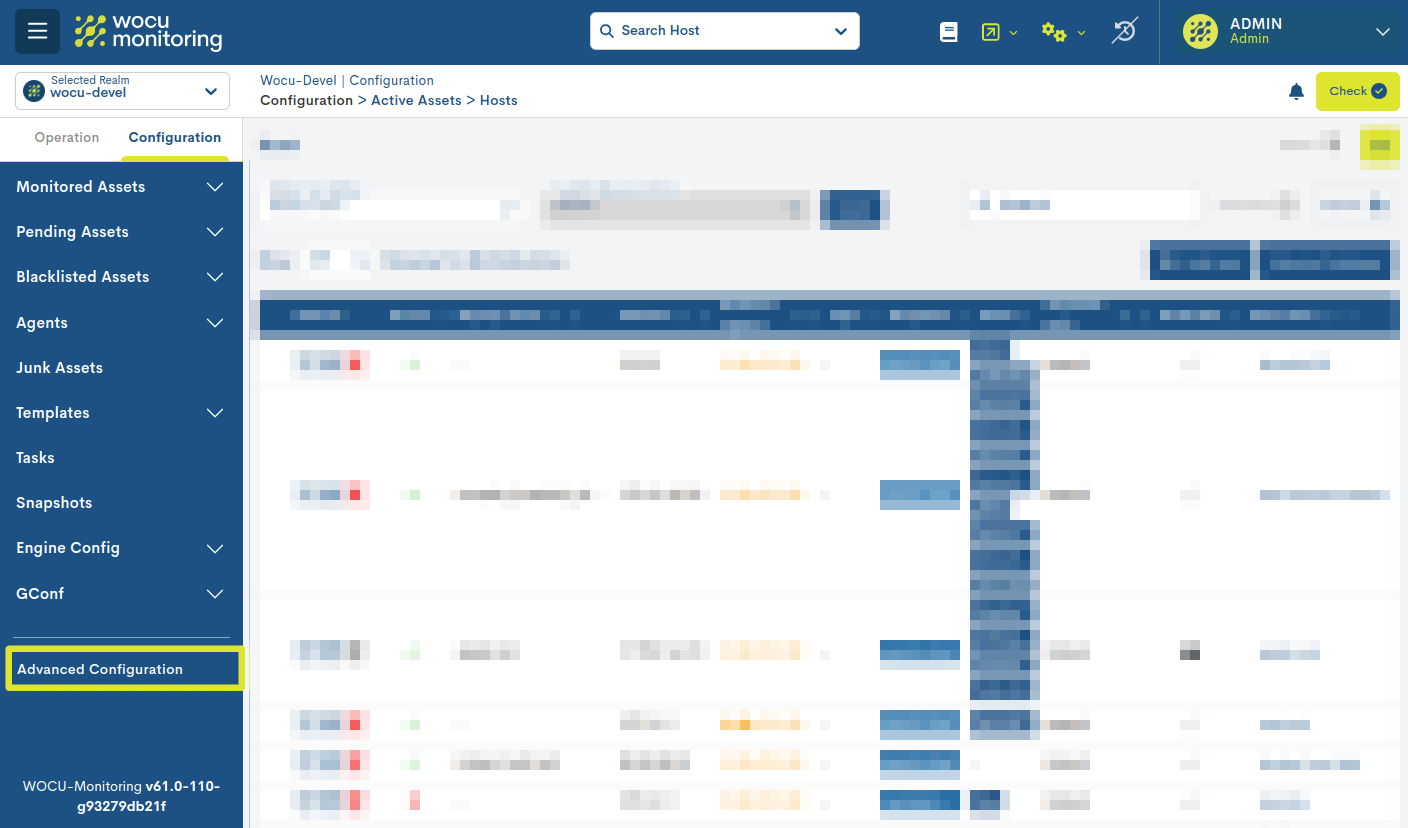
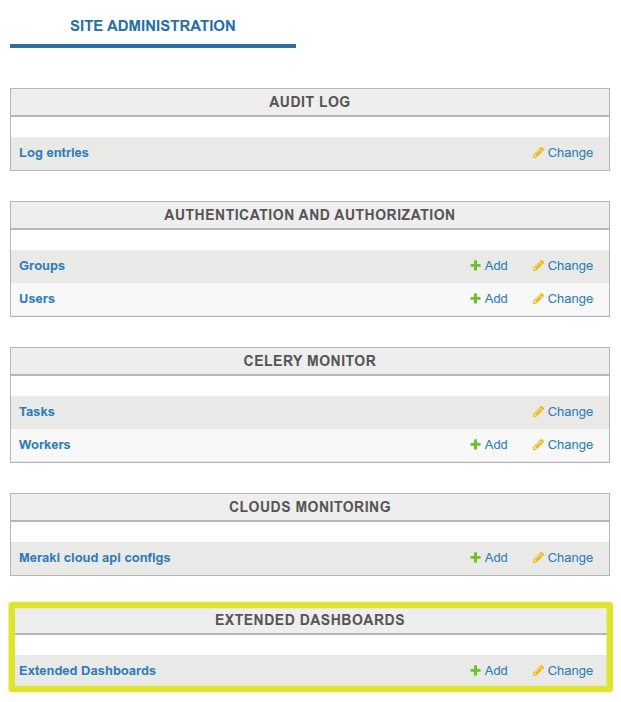
In the administration view, locate the Extended Dashboards option, and click on the + Add button, located in the same row, as shown in the following image:
We will then access a new window to register the dashboard in WOCU, whose fields will have to be edited manually. These are:
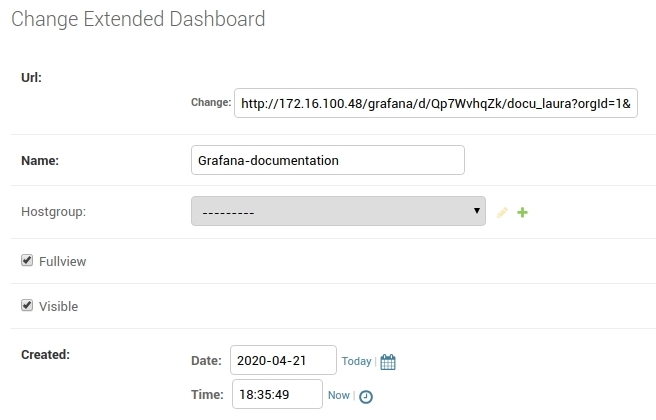
- Name: we will add an identifier by which the dashboard will be known in WOCU-Monitoring, for example:
Grafana-documentantion.- Hostgroup: by selecting a Hostgroups from the dropdown, the dashboard will be visible in addition to the Standard Realm, in the Hostgroup-based Realm in which the chosen Hostgroup is integrated.
- Fullview: in the Dashboards section, there are two views: Fullview and Panels, through which the different panels and dashboards will be distributed. We will check this box, so that our dashboard will only be visible in one view.
- Visible: leave this box ticked to display the new dashboard. Otherwise, it will remain configured but will not be visible in WOCU-Monitoring.
- Created: indicates the exact date and time of creation and uploading of the dashboard to WOCU-Monitoring.
Once configured, save the edition and restart the WOCU-Monitoring session. In the Import-tool in which this Realm is configured, the new dashboard will be available: Grafana-documentantion.
4. Display in the Dashboard tab of a Realm
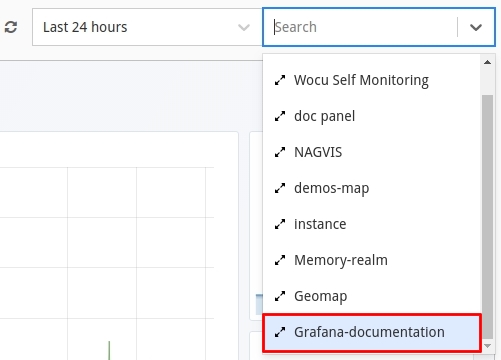
Once inside the Realm in question and the Dashboards tab, we must access the Fullview view (as previously configured) and select the newly added dashboard in the Search Filter, where all available dashboards are listed. It will immediately be displayed in the interface.
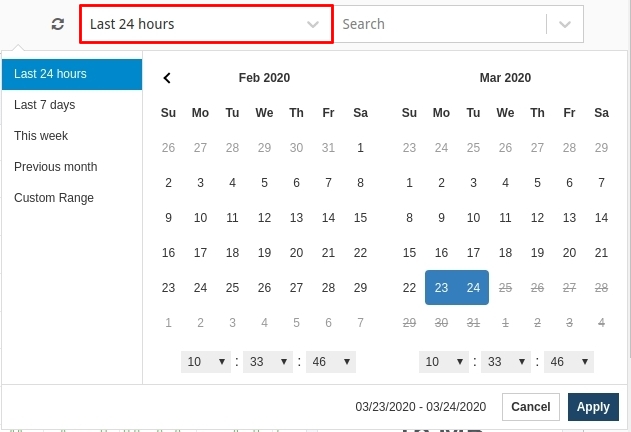
By default, the dashboard will represent the data collected in the last 24 hours, but this can be modified thanks to the Selector by time range, where it is possible to choose a new predefined time criteria, or configure a new period using the Custom Range option. It is also possible to run forced data refreshes by clicking on the circular arrows icon (🔁).
Finally, a dashboard is a dynamic environment composed of interactive elements with extra functionalities, which allow you to get more out of the data displayed in its different graphical representations. Some possible functionalities and interactions are:
Resize or relocate the panel.
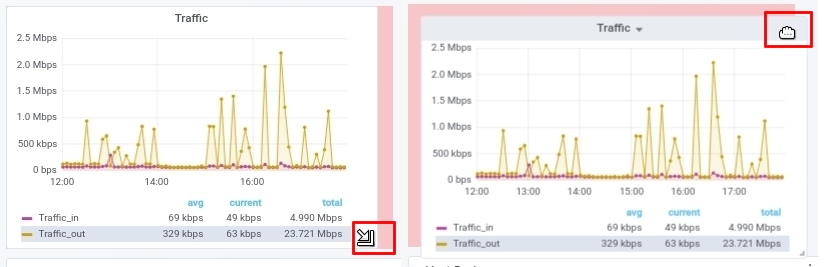
View a single data series on the graph by clicking on it in the legend, and get the exact values recorded at a particular point on the graph.
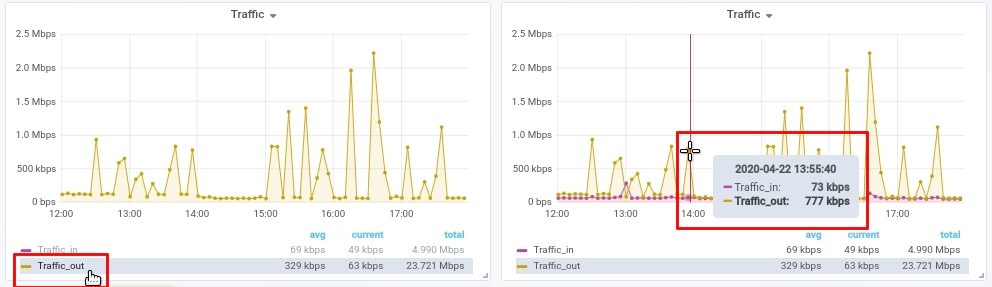
There are a multitude of applicable options that will vary depending on the type of element and the scope of the tool that provides them to WOCU. Find out more functionalities in: Customisation and interactive features.
Note
Remember that a well-constructed dashboard allows you to know in real time or in specific periods of time, the progress and evolution of relevant metrics that impact our business. This makes it easier to measure performance, make decisions and apply action measures accordingly.
Registration of Data Sources on Grafana
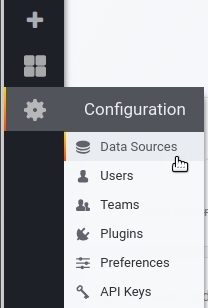
Prior to the creation of a first dashboard it is necessary to register the data source (storage backends), from which the metric values to be represented will be extracted. The addition of a new Data Sources is done from the Configuration module, accessible from the left vertical menu, as shown in the following image:
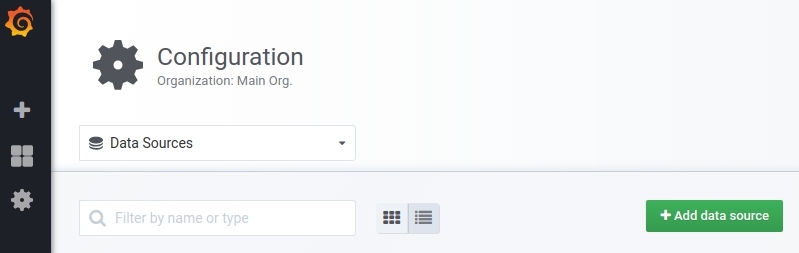
Next, click on the green Add Data Source button to access the registration form:
For this use case we have created the following Data Source:
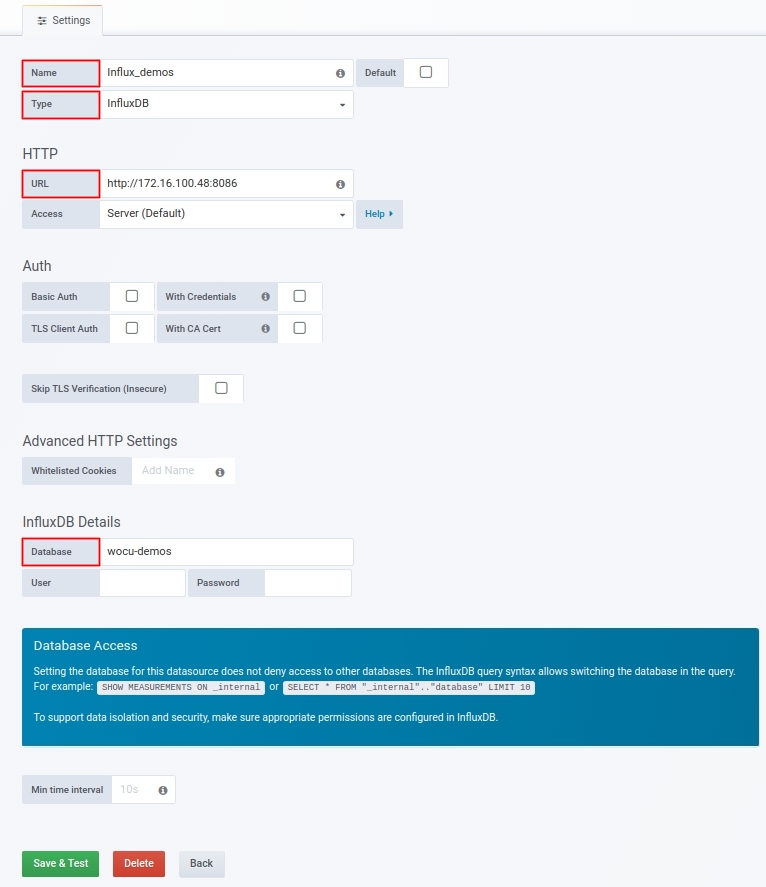
Name: name by which the data source will be identified in Grafana. We will add
Influx_demosfor this use case.Type: Grafana supports different types of data sources where it stores all the metrics recorded. Depending on the chosen typology, there will be configuration parameters appropriate to the characteristics and capabilities of the source. In this use case we will create an InfluxBDD database as metric data source.
URL: of the machine where the InfluxDB is hosted. It is the result of the access by HTTP protocol to the IP address, plus the port of the API InfluxDB (by default
8086):
http://<IP>:8086Database: name of the InfluxDB database, which will be accessed for the metric values request. Remember that each database collects different metrics. It is important to know beforehand the scope and content of each DB. In this use case we will use the
wocu-demosdatabase.
Once the changes are saved, this new Data Source will be created in Grafana to be used as the source of metric values for any dashboard.
Attention
Administration permissions are required to add Data Sources to the system.
Constructing Query Variables in Grafana
It is possible to predefine a specific query to a database by setting variables.
The construction of query variables is carried out in the Setting module, accessible from the actions in the top menu of the panel, as shown in the following image:

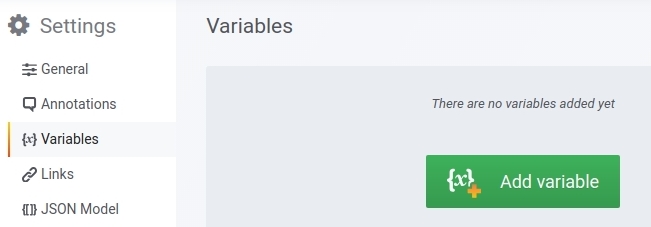
Next, click on the green Add Variable button to access the construction form:
In this use case we have used two variables:
1. EquipmentNetwork.
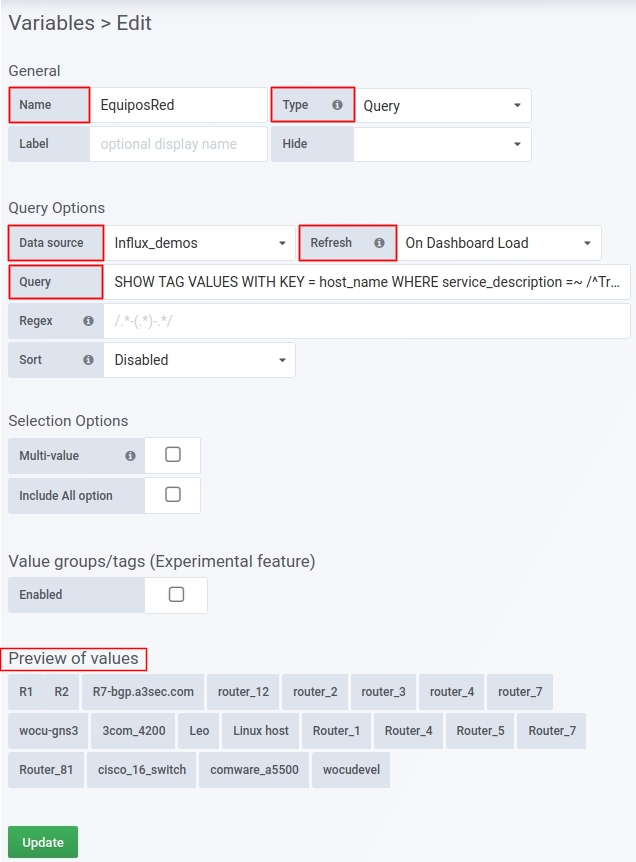
Its configuration is as follows:
Name: name by which the variable shall be known in the dashboard.
Type: query option, since the function of our variable is to query and return elements.
Data Source:
Influx_demosis the data source where Grafana will perform the query and data request.Refresh: on Dashboard Load option for the system to refresh data when changing dashboards.
Query: space to enter the query that will return all the equipment on which connectivity and network traffic is measured, i.e. that have traffic measurement monitoring packs assigned to them.
SHOW TAG VALUES WITH KEY = host_name WHERE service_description =~ /^Traffic.*/A preview of the elements that meet the query will be visible at the bottom of the view.
Once the changes are saved, the variable will be created to be applied in the configuration of any panel of the dashboard.
2. InterfacesRed
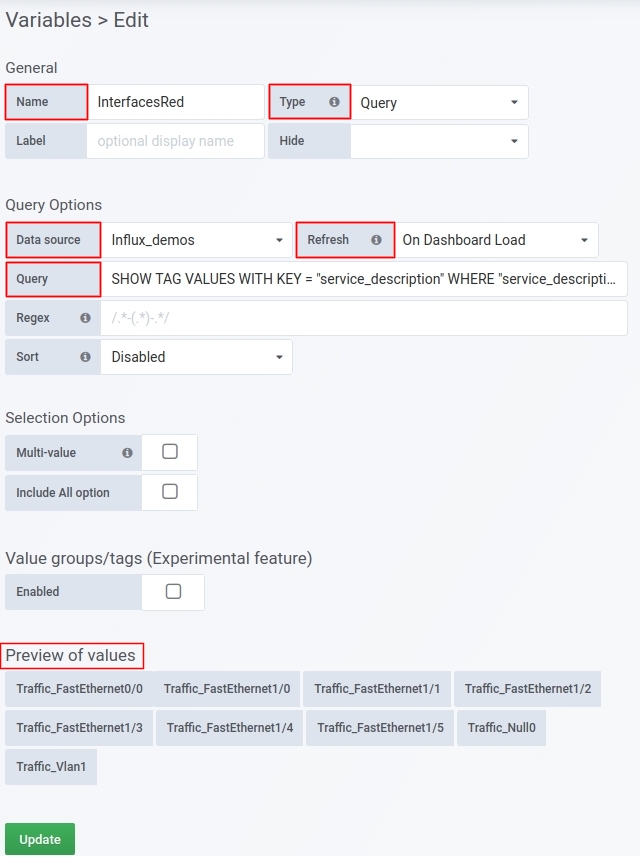
Its configuration is as follows:
Name: name by which the variable shall be known in the dashboard.
Type: query option, since the function of our variable is to query and return elements.
Data Source:
Influx_demosis the data source where Grafana will perform the query and data request.Refresh: on Dashboard Load option for the system to refresh data when changing dashboards.
Query: space to enter the query that will return the network interfaces discovered for each unit. For each interface, the values related to the incoming and outgoing traffic that have been registered in WOCU-Monitoring will be shown in the graph.
SHOW TAG VALUES WITH KEY = "service_description" WHERE "service_description" =~ /^Traffic.*/ AND "host_name" =~ /^$EquiposRed$/A preview of the elements that meet the query will be visible at the bottom of the view.
Once the changes are saved, the variable will be created to be applied in the configuration of any panel of the dashboard.
Remember
Both Grafana and Influx are solutions that, although integrated as part of WOCU-Monitoring, are not developments created or maintained by our technical team, so their technical or operational description is beyond the scope of this User Manual.
For further information, please refer to the official documentation:
Influx documentation <https://docs.influxdata.com/>`_