Passive monitoring using the Log occurrences pack
Within the monitoring of networks and technological infrastructures, two important groups can be distinguished: Passive Monitoring and Active Monitoring.
Broadly speaking, while active monitoring is regular in terms of requests for operational status (regardless of whether or not a change has occurred); passive monitoring is asynchronous, i.e. it receives only events related to those changes. Active monitoring* is therefore more computationally expensive, and even more so in large infrastructures, where the total number of checks can be quite high.
The two monitoring methodologies are completely different, but equally useful. However, WOCU-Monitoring solves this situation with the combined use of both, taking advantage of the benefits and reducing the limitations they present. Ultimately, the result of this union is an increased degree of quality assurance, as problems can be detected before they occur or in near real time, along with a thorough understanding of the root cause.
WOCU-Monitoring has an event indexing backend which it uses to store events from the world of passive monitoring: application logs, system syslog and SNMP traps.
Remember
Events are used by WOCU-Monitoring as an additional element in the calculation of asset status and also offer the opportunity to analyse the causes or circumstances of an incident, since a good technical analysis should always be supported by the log messages of the Hosts involved.
WOCU organises these two monitoring lines from the Events tab, dedicating the Monitoring to the notifications that the system itself generates internally (Active Monitoring), and collecting in the section Logs all the events indexed in the backend resulting from passive monitoring

In this use case, we will show how both methodologies are unified in WOCU-Monitoring to get the most out of the tool.
Log management in WOCU-Monitoring
1. Log reporting
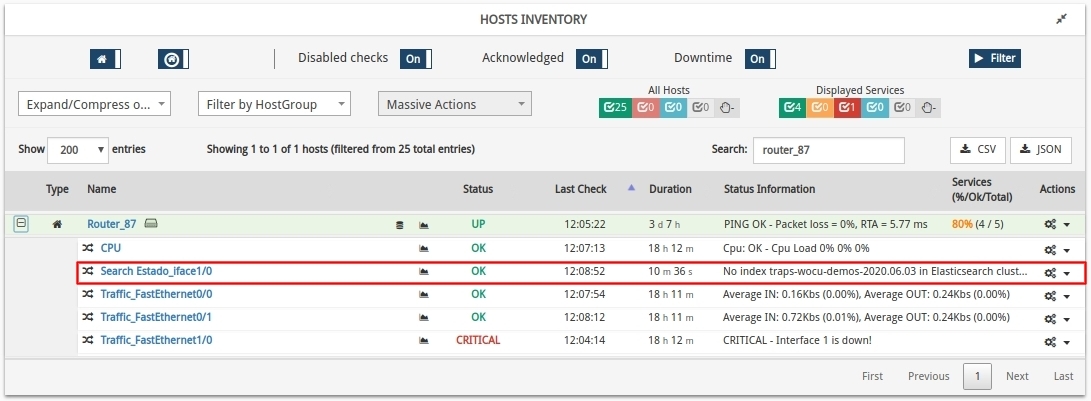
We will take as an example the Host Router-87, to which we have enabled the sending of SNMP traps to WOCU-Monitoring.
From the Hosts Inventory, the existence of events in Hosts is indicated by a database icon:
We can place the cursor over the icon and see the number of events recorded in the last 24 hours, or click on it, which will take us to the list of Other Log Events (Logs).
Attention
It is necessary to enable the sending of traps to WOCU-Monitoring beforehand. Depending on the technical properties of the Host, this will be done in one way or another.
2. History logs
Next, we will access the indexed event history of the Router-87 unit. WOCU-Monitoring collects all events from passive monitoring in the Logs section of the Events list.
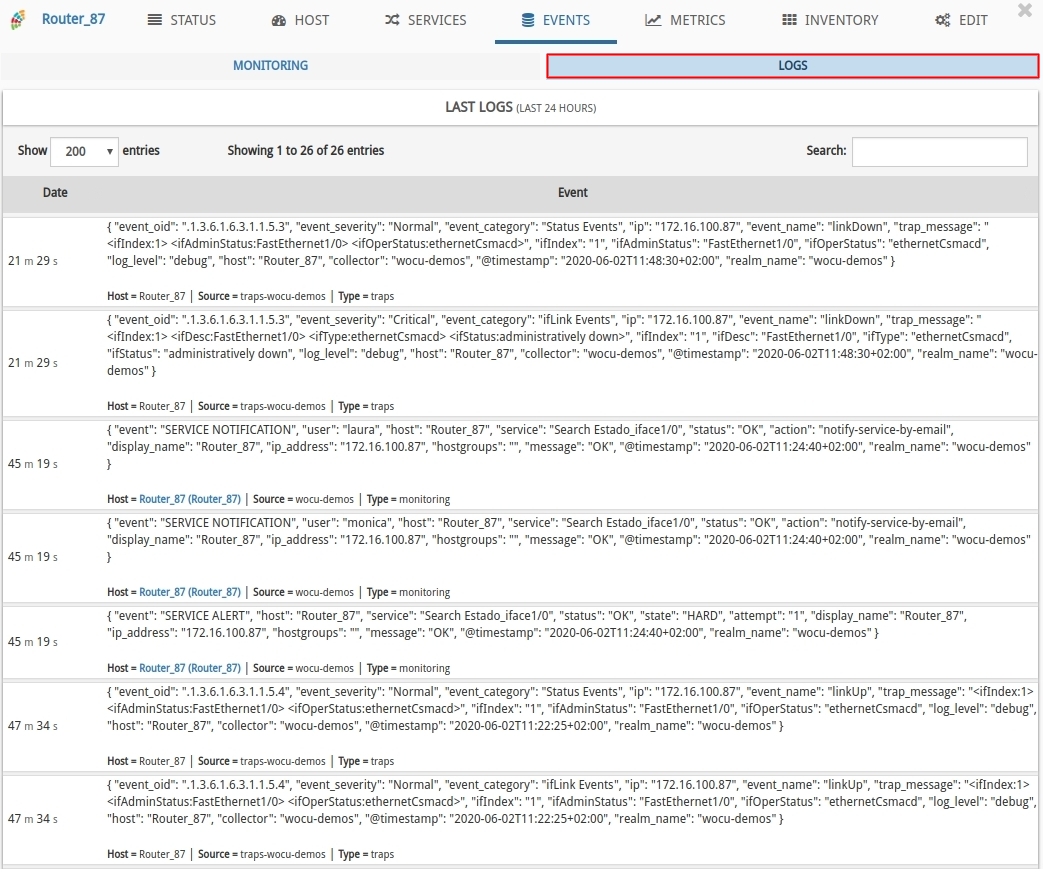
For this use case, the interface of the Router-87 Host has been brought down and up, to observe how the current flow of action is the generation and sending of traps to the WOCU-Monitoring backend concerning the operability of the interface:
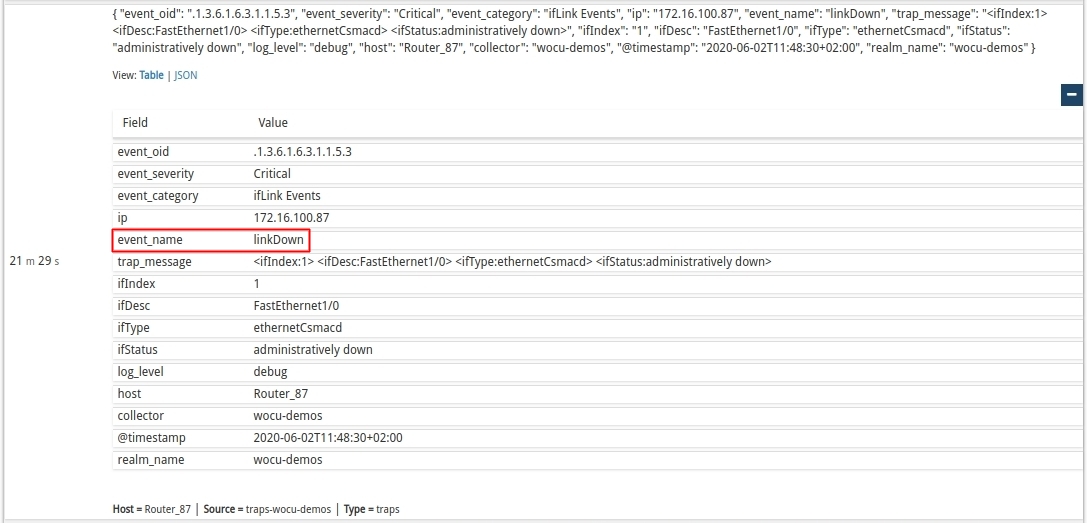
Trap relating to the fall of the interface:
Trap relating to the lifting of the already operational interface:
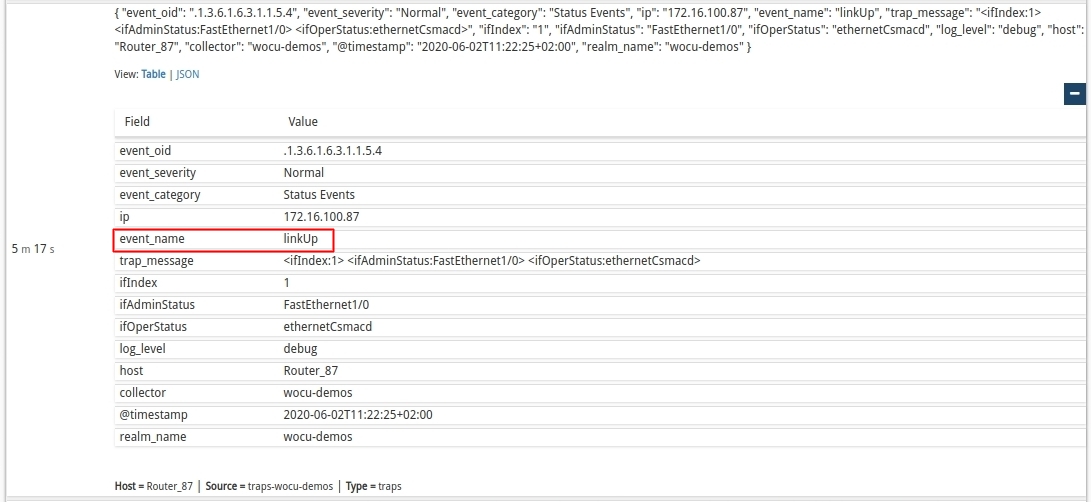
Each entry stores the full text of logs in order to know in detail the reason for the event and to be able to act accordingly.
We have already seen the space for managing and processing the logs resulting from passive monitoring in WOCU. Next, we will show how to configure and adapt new monitoring services from the Log Ocurrences pack.
Configuration of Log Occurrences monitoring packs
Taking advantage of the great potential of passive monitoring, the WOCU team has developed the Log Ocurrences monitoring pack that allows you to create alerts based on indexed events. Accessing its technical file from the monitoring packs catalogue, we will observe all the information related to the variables and configuration parameters.
The following is the configuration procedure for the generation of alerts based on SNMP traps using this pack.
1. Host Location for pack assignment
Within the WOCU import tool, locate the Router-87 test host in the Active Assets list and access the monitoring packs configuration module by clicking on the corresponding Packs button.
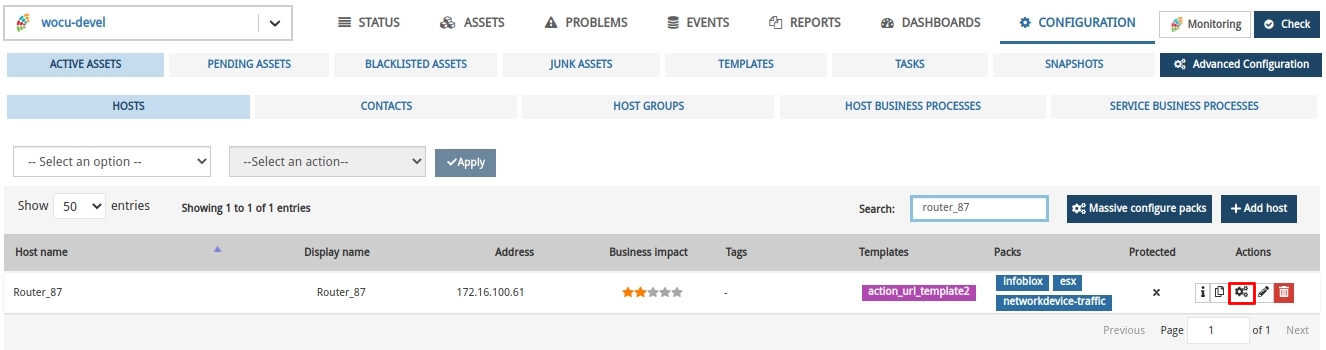
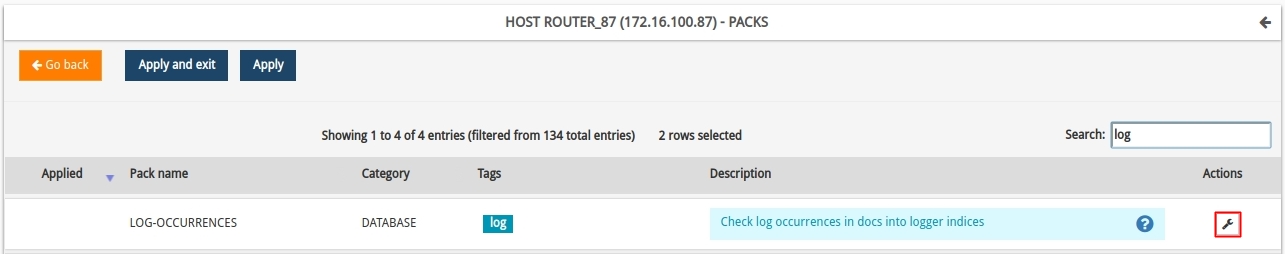
Located in the pack allocation inventory, specifically in the pack Log Ocurrences, we will use the Configure option to access its configuration profile.
Note
Use the search bar above the inventory to speed up the process of locating large listings.
2. Configuration of the Log Occurrences pack
The configuration is done by assigning each macro (configuration variable) a certain value.
Continuing with the example of Router-87, let’s look at the fields needed for the correct identification of traps:
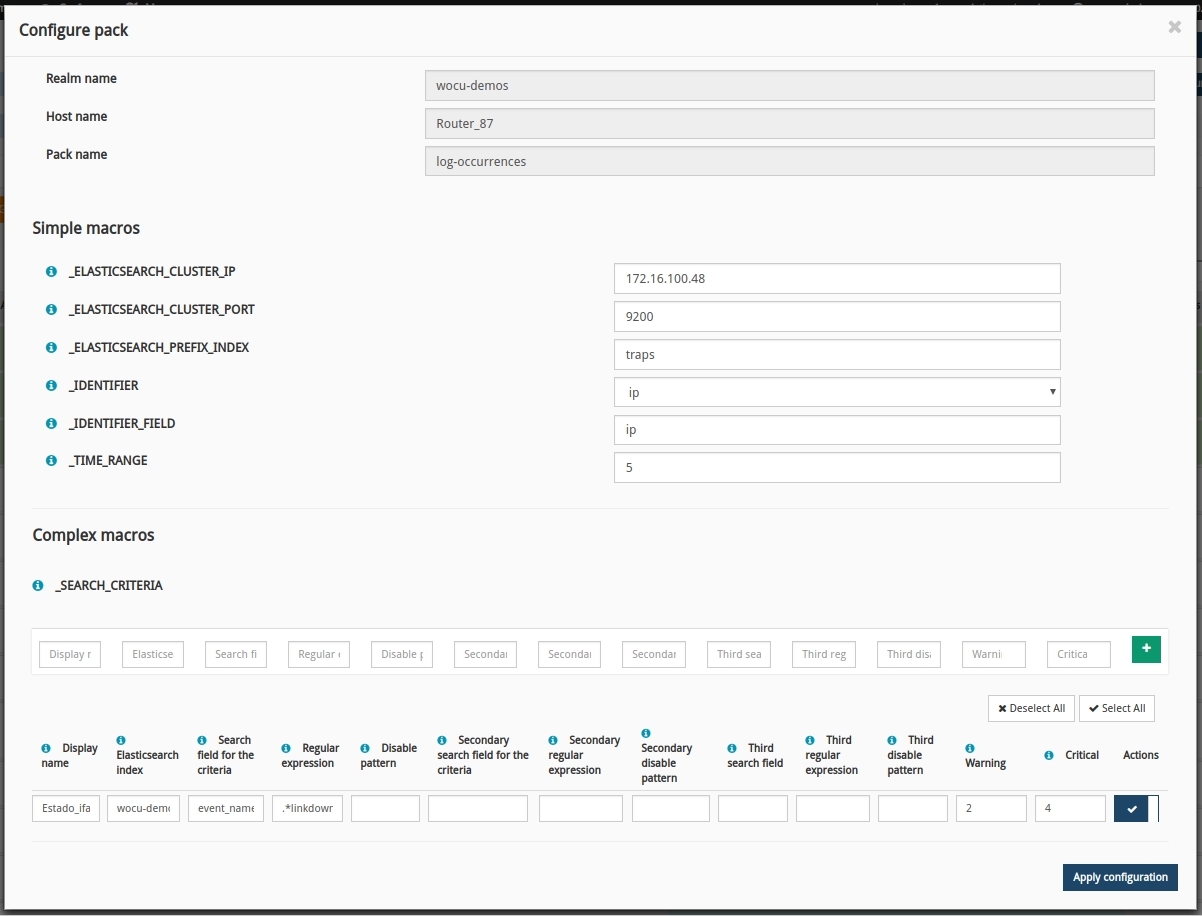
SIMPLE MACROS
Next, we proceed to configure the necessary parameters to connect the event indexing backend to WOCU.
Macro |
Description |
Value |
|---|---|---|
_ELASTICSEARCH_CLUSTER_IP |
IP address of the event indexing backend to be searched. This information shall be provided by the WOCU administrator. |
172.16.100.48 |
_ELASTICSEARCH_CLUSTER_PORT |
Port on which the backend listens. |
172.16.100.48 |
_ELASTICSEARCH_PREFIX_INDEX |
Prefix of the index where the events are stored. |
Traps |
_IDENTIFIER |
How our equipment is identified in the backend: IP or Host-Name. |
IP |
_IDENTIFIER_FIELD |
Field indicating the IP of the equipment in the indexed events. |
IP |
_TIME_RANGE |
Time during which the backend searches will be executed. |
5 |
COMPLEX MACROS
Next, we proceed to configure the information regarding the data that WOCU will receive in each trap.
Macro |
Description |
Value |
|---|---|---|
Display name |
Name by which the service will be identified |
Search Status Iface1/0 |
Elasticsearch index |
Índice of the backend |
wocu-demos |
Search field for the criteria |
Field to be searched in the trap |
|
Regular expression |
Search pattern of the above field. To avoid case sensitive retrieval problems, it is recommended to use the characters |
.*linkdown.* |
WARGING |
Alert threshold |
2 |
CRITICAL |
Alert threshold |
4 |
Attention
The indexed fields may vary depending on how the information is parsed from WOCU-Monitoring to the event indexing backends.
Finally, save the set configuration and confirm the application of the pack with the Apply and exit option.
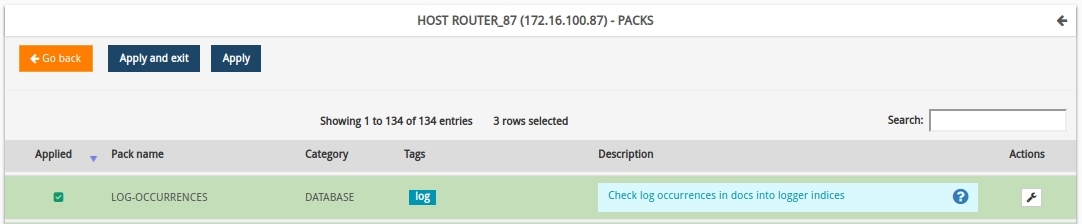
It is important to make sure that the pack is marked (background colour change to green), otherwise the Log Ocurrences pack will not be assigned to the Router-87 Host.
4. Confirmation of changes in the system: WOCU Check.
The changes shall be consolidated in the system through the execution of the Check action.

A dialogue box will immediately appear informing about the status of the database. To make the changes, the blue Restart WOCU button must be pressed to confirm the restart and update of the system.
5. New service associated with Router-87 Host
On reboot, in the Hosts Inventory we see a new service Search Status_iface1/0 (macro Display name) associated with Router-87, to which we have previously assigned the pack Log Ocurrences.
The correct behaviour of this service would be as follows:
If an interface is down, WOCU-Monitoring shall receive a set of traps indicating this abnormal situation on the Host in question.
Consequently, the
Search Status_iface1/0service will reach a Warning or Critical status (depending on the thresholds defined in the pack). More information can be found in its Detail view of Services and Business Processes.
Thanks to these checks carried out by the service itself, the operator will be able to carry out a more in-depth analysis in terms of availability and find out the root cause of the problem.
In this way, WOCU-Monitoring unifies Passive Monitoring and Active Monitoring. Maintaining a backend for indexing events from passive methods and developing monitoring packs that allow the definition of tailor-made services, meeting the technical and functional needs of the monitored infrastructure.
See our Monitoring Packs Catalogue, for more information on the Log Ocurrences pack. In addition, the following video is also available, which covers all of the above, so you won’t be left in any doubt.