Packs Inventory
Within this section you will find two spaces related to the Monitoring Packs that are being managed and used in the application.
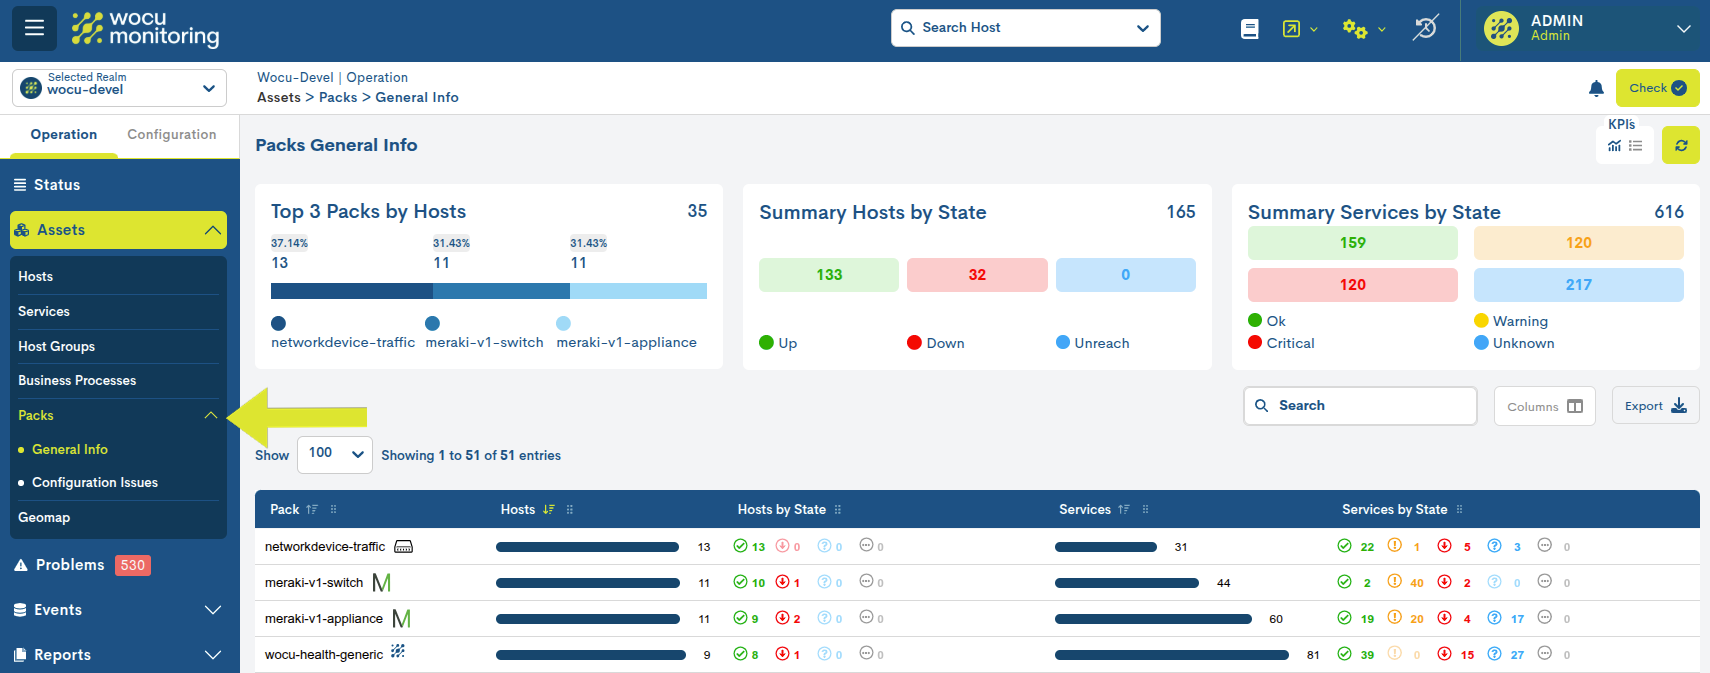
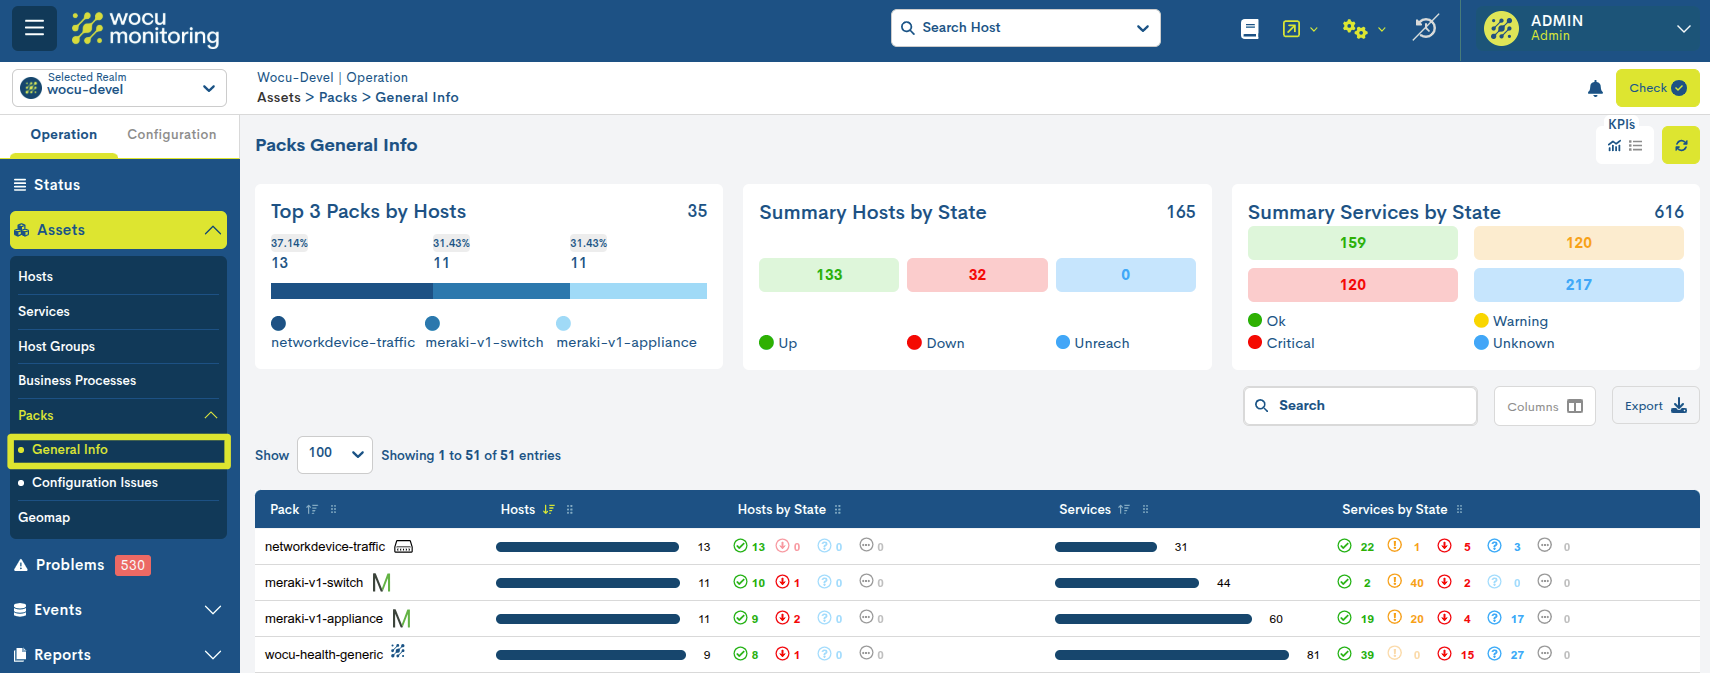
General Info
Contains the complete list of the Monitoring Pack that are being applied in a given Realm. It also presents the grouping of assets by type or class of applied packs and by the different operational states that they can reach.
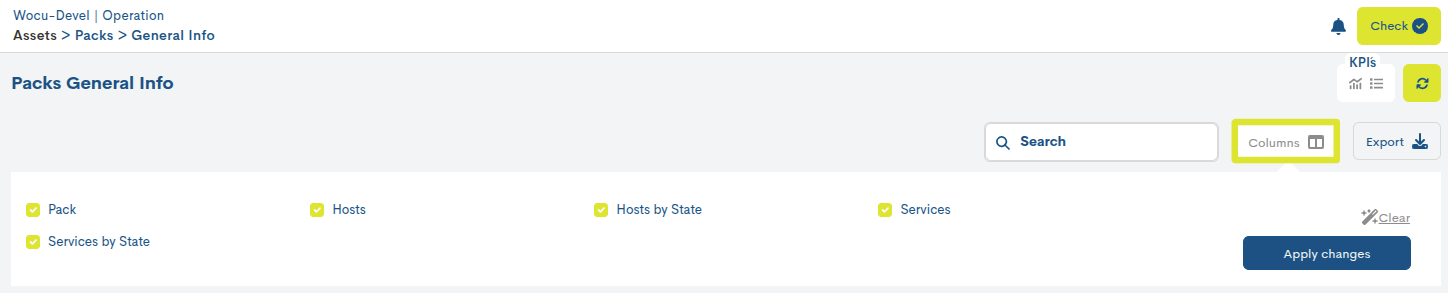
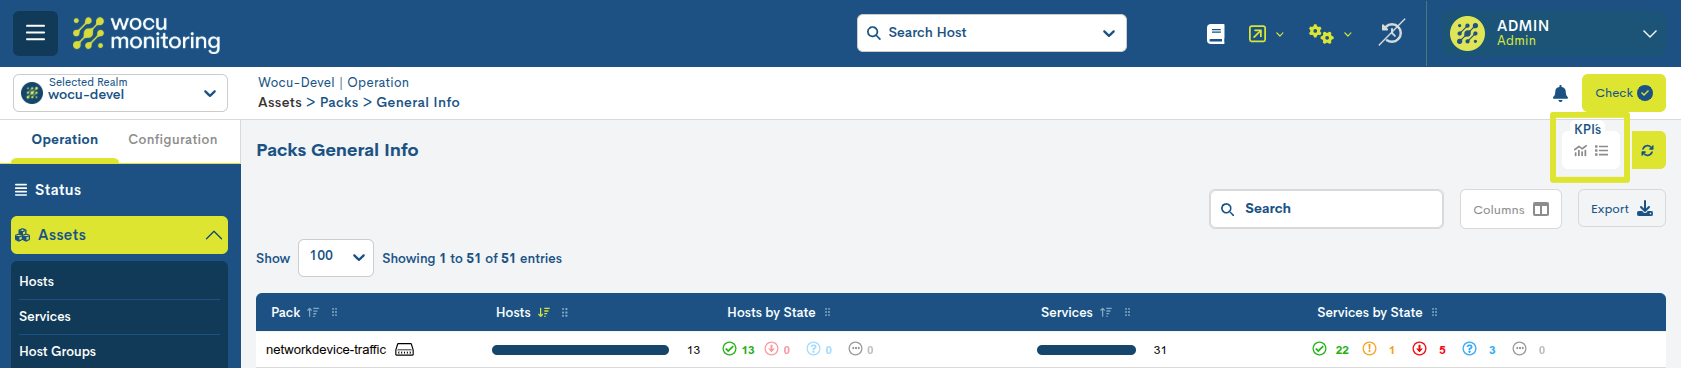
General Info Inventory Columns
The display of inventory fields (columns) is configurable through the Columns option. This functionality allows the user to dynamically select which columns to show in the table view and which should remain hidden. More information at: Customizing table display: Columns.
Además, la aplicación incorpora soporte para el redimensionamiento dinámico de columnas de la tabla, permitiendo al usuario ajustar manualmente el ancho de cada columna según las necesidades de visualización. Más información aquí.
The possible fields are:

✓ Pack: this column lists the Monitoring Packs in use within the Realm. For each entry in the table, the name of the pack followed by the identifying icon is included. Placing the cursor over the icon will pop up a text alluding to the technology represented.
✓ Hosts: this column counts the total number of Hosts that have a specific pack associated to them. The data is accompanied by a percentage bar. By sorting the column, you get a ranking of the most or least used packs in the Realm.

By clicking on the bar, the user is redirected to the updated Hosts Inventory, showing only the elements relevant to the query made, i.e. the table is filtered with the Hosts that share this monitoring pack.
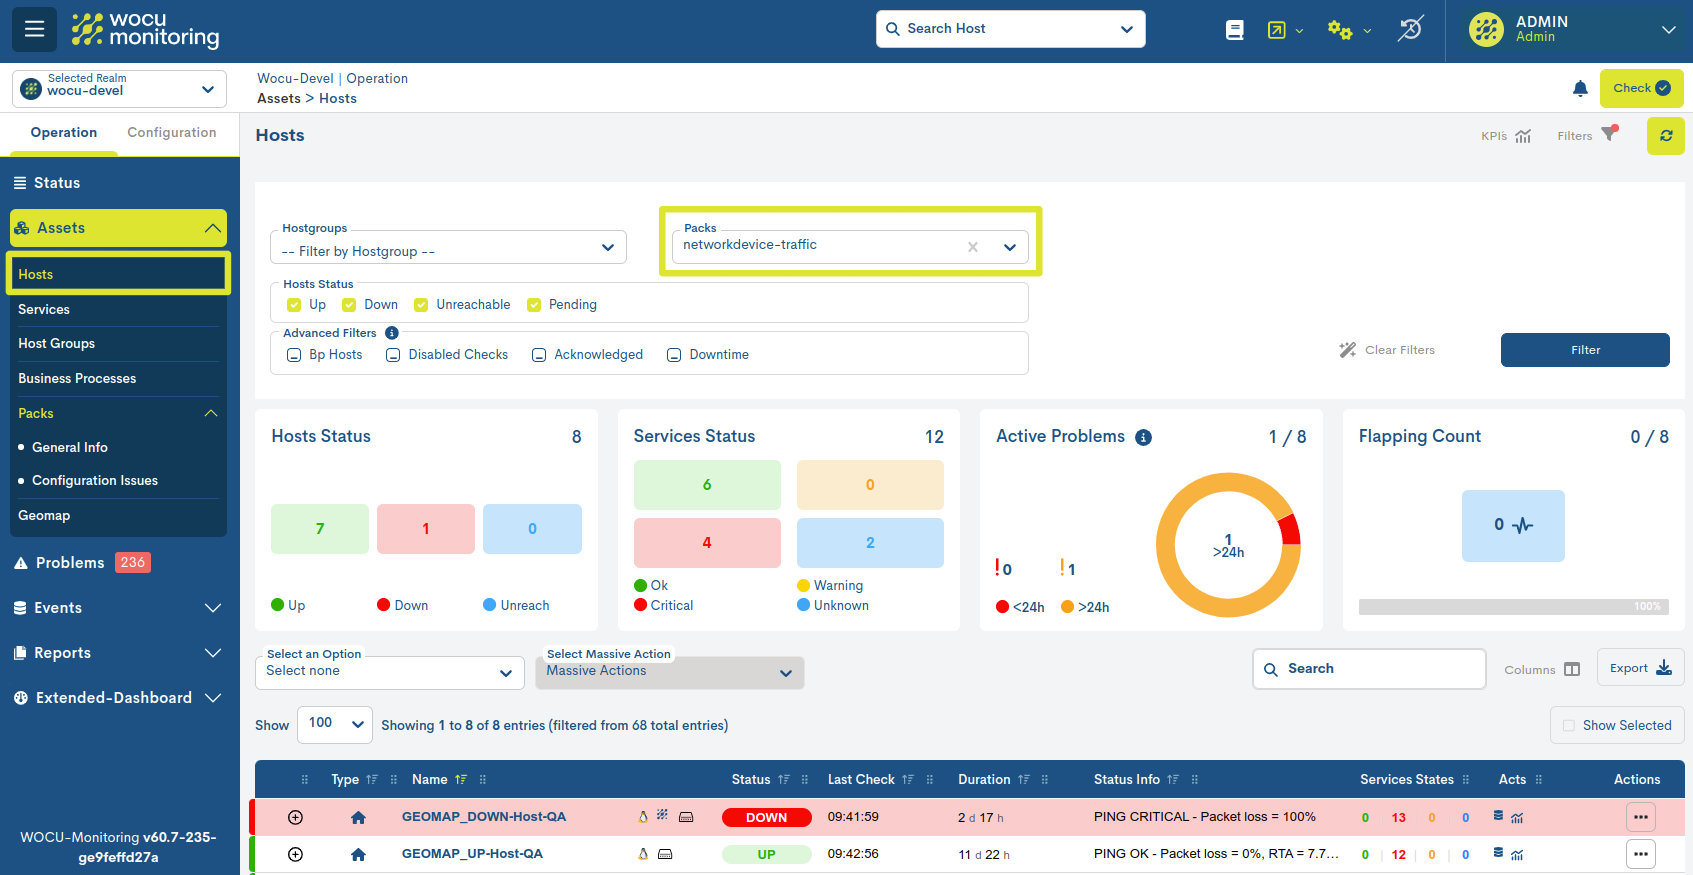
Image 1: Inventory filtered by Devices with the Networkdevice-traffic pack assigned.
✓ Hosts by State: this field is a summary of the Hosts (sharing a pack) sorted by their different operational states.
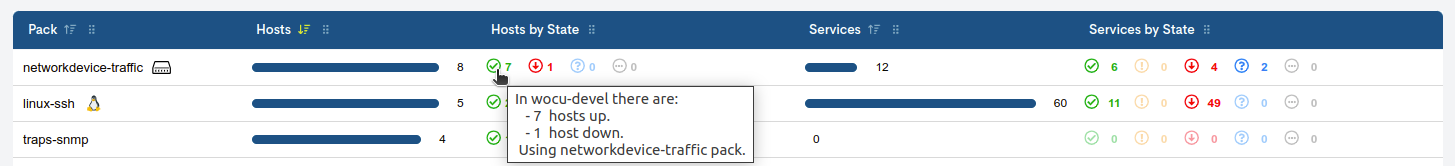
Like the status bar, each status icon redirects the user to the updated Hosts Inventory, showing the filtered table with the Hosts with the monitoring pack in common, plus the selected availability status. The query is further refined by discriminating the other elements, as shown in the following image:
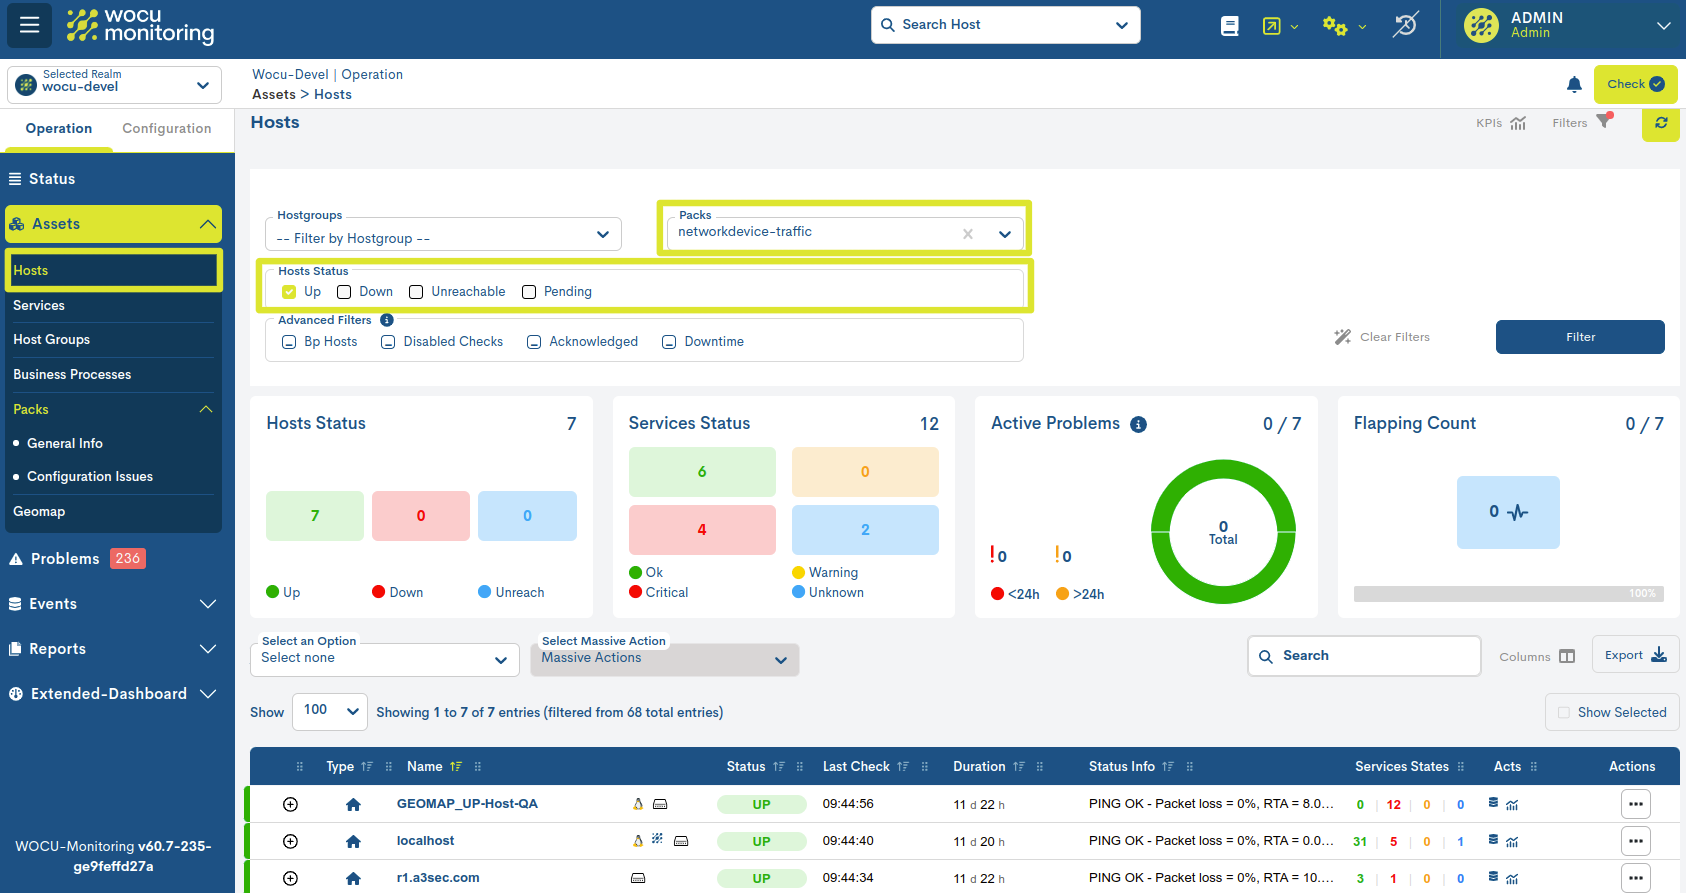
Image 2: Inventory filtered by Devices with the Networkdevice-traffic pack in UP state.
Attention
This action shall be blocked in non-occurring monitoring states, i.e. whose value is 0.
✓ Services: this column counts the total number of Services (of Hosts) associated with a specific pack. The data is accompanied by a percentage bar.

By clicking on the bar, the user is redirected to the updated Services Inventory, showing only the elements relevant to the query made, i.e. the table is filtered with the Hosts and Services that share this monitoring pack.
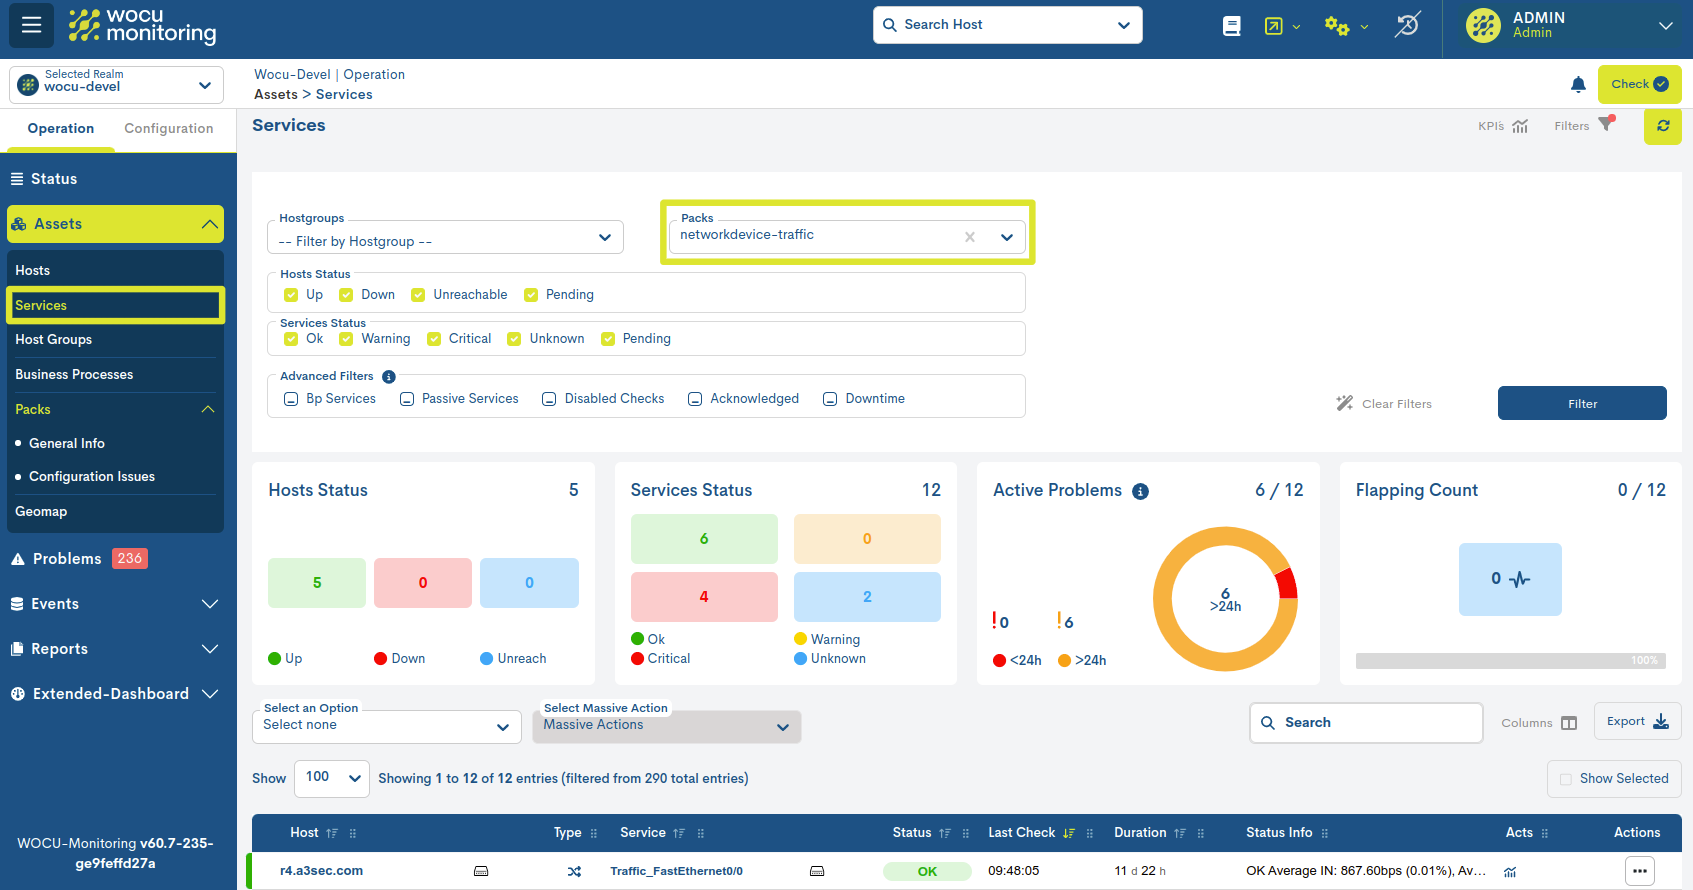
Image 3: Inventory filtered by Services with the Networkdevice-traffic pack assigned.
✓ Services by State: this field is a summary of the Services (sharing a pack) sorted by their different operational states.
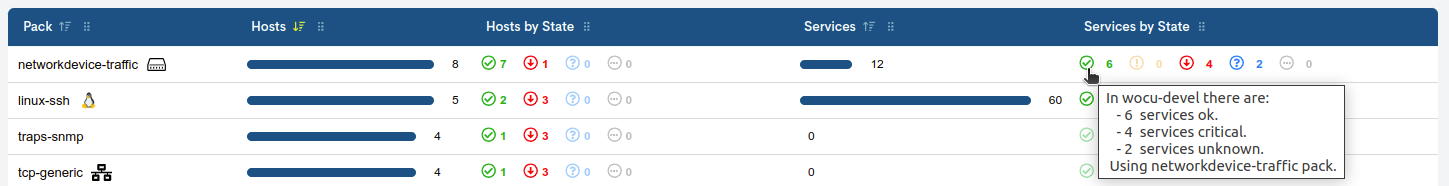
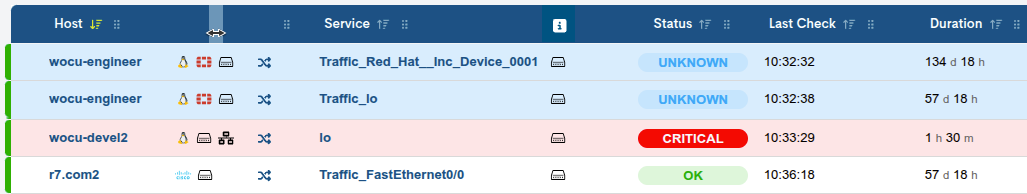
Like the bar, each status icon redirects the user to the updated Services Inventory, showing the filtered table with the Hosts and Services with the monitoring pack in common, plus the selected availability status. The query is further refined by discriminating the other elements, as shown in the following:
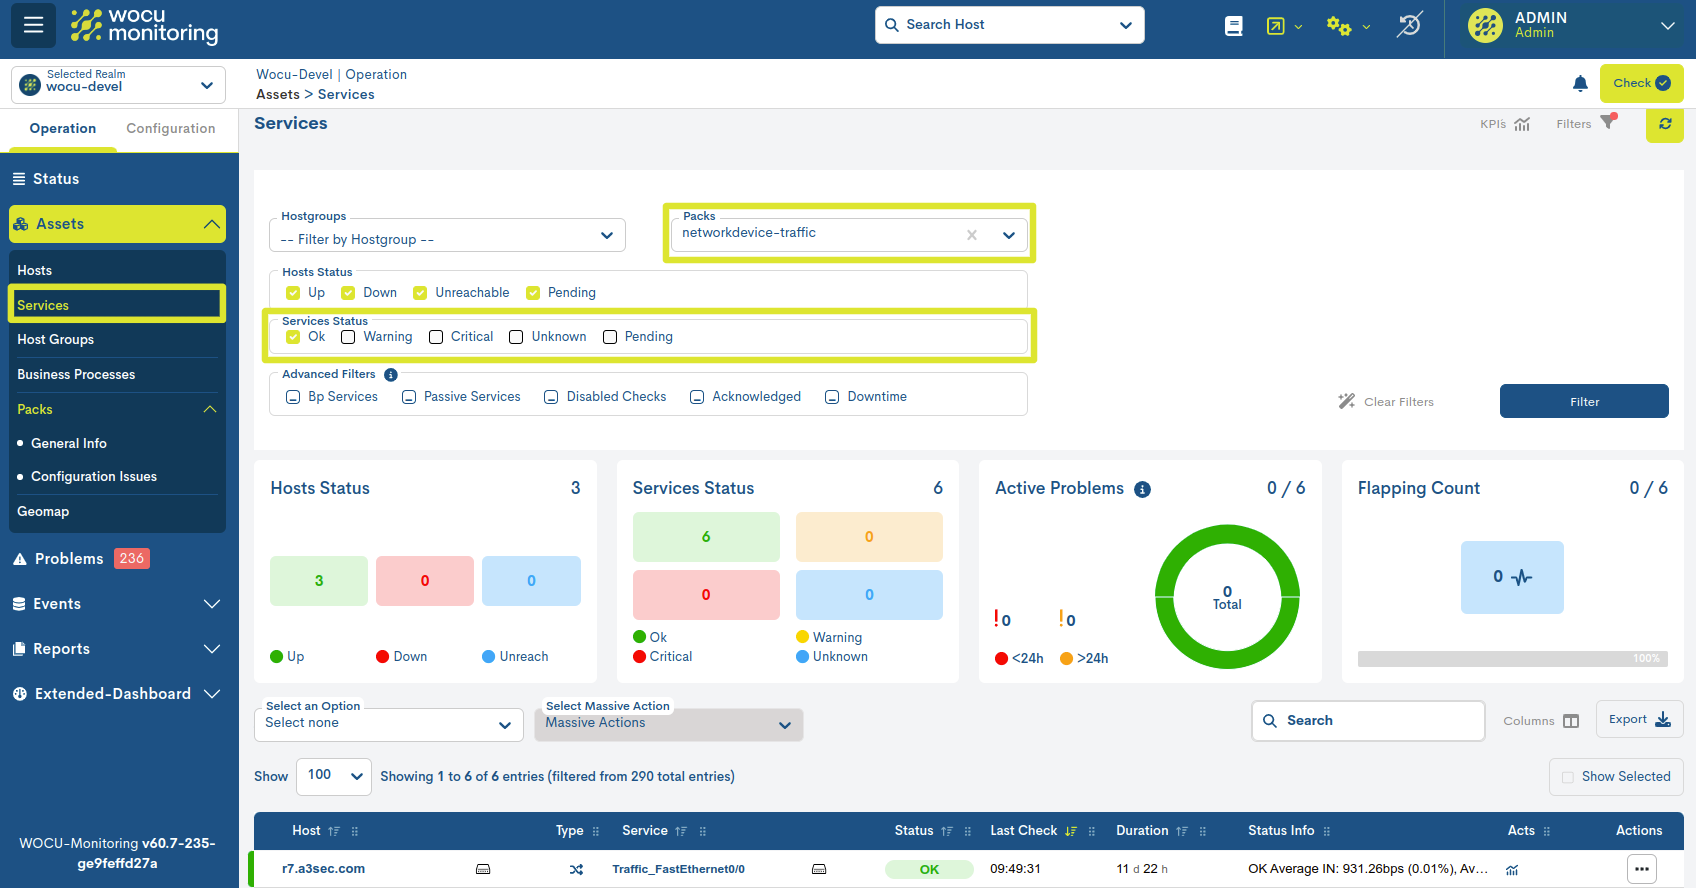
Image 4: Inventory filtered by Services with the Networkdevice-” pactraffic in OK status.
Important
More information on the different navigation, search and sorting options can be found at Common navigation, filtering and sorting options.
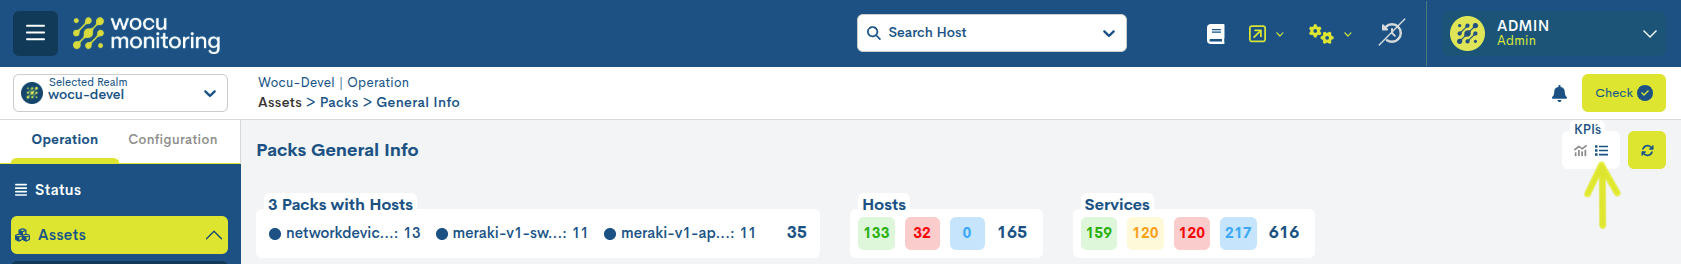
KPI`S
This area displays a series of panels with key performance indicators (KPIs) and the operational status of the assets present in the inventory.
KPIs can be viewed in two possible ways:
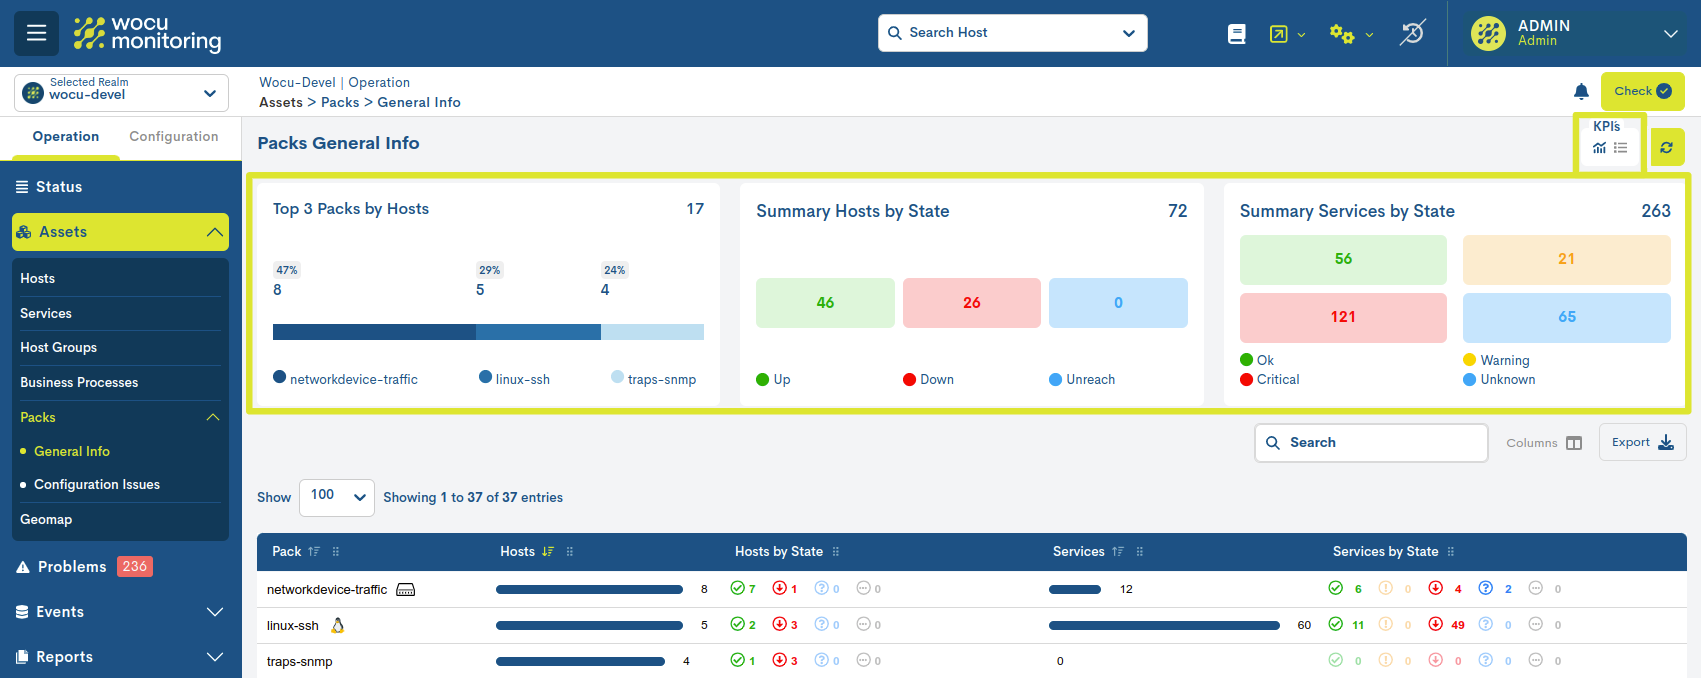
Full view
By activating the icon marked in the following image, the following KPIs are displayed with detailed data and interactive charts:
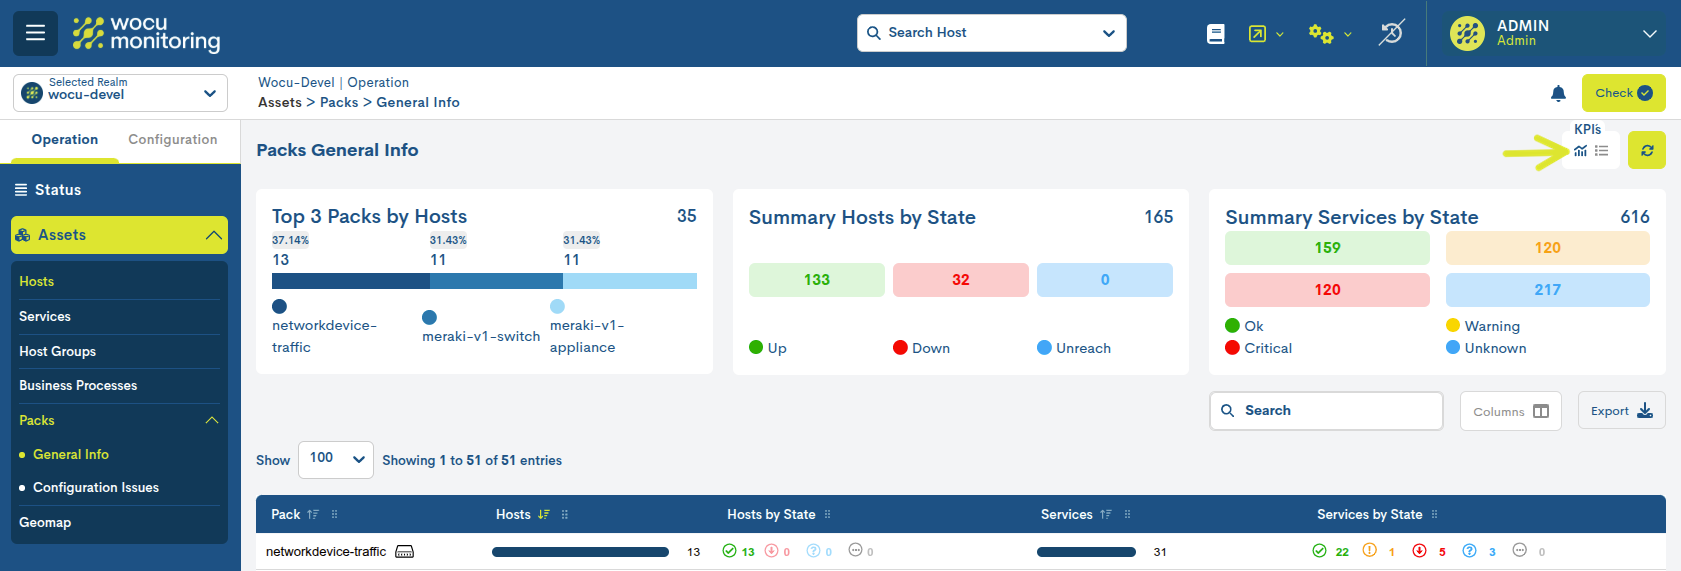
Top 3 Packs by Hosts
Ranking of the three most used Monitoring Packs, in terms of the number of hosts on which they are configured.
According to the image above, 35 is the total number of devices using the three main packs. The Networkdevice-traffic pack is used by the highest number of devices, totaling 13 (37.14%), followed by Meraki-v1-switch with 11 (31.43%) and Meraki-v1-appliance with 11 (31.43%).
The bar chart visualizes the proportion of the most used packs. Therefore, the Networkdevice-traffic pack occupies the largest portion, followed by Meraki-v1-switch and Meraki-v1-appliance.
Summary Hosts by State
Count of hosts in inventory based on the current monitoring state. This information corresponds to the column Hosts by state.
Summary Services by State
Service count in inventory based on current monitoring state. This information corresponds to the column Services by State.
Summary view
By activating the icon marked in the following image, the previous KPIs are displayed in a more compact format for quick reading:
Likewise, it is possible to hide the panel block by toggling both buttons.
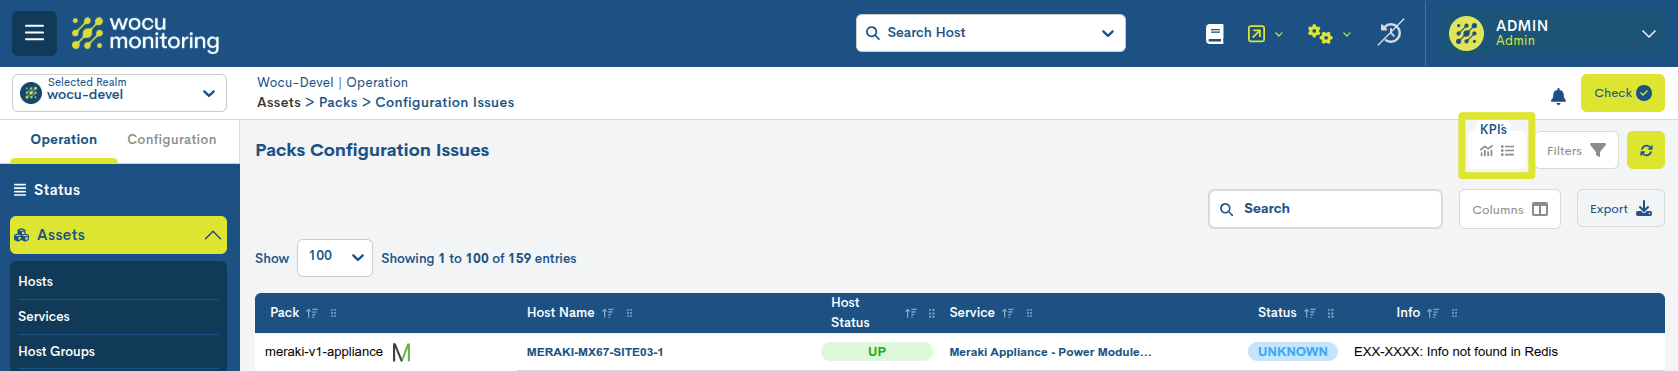
Configuration Issues
Contains the updated listing of the Monitoring Packs that have experienced configuration configuration problems in one or more of their associated associated.
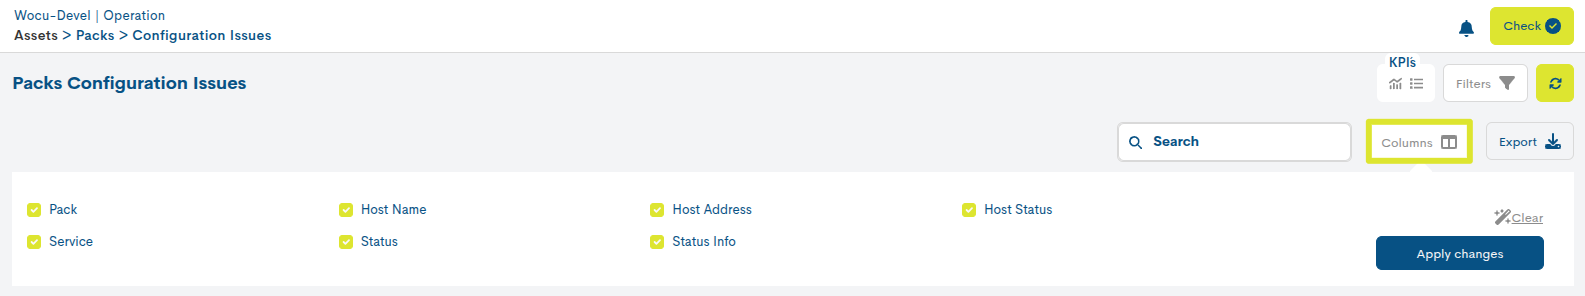
Inventory Columns: Configuration Issues
The display of inventory fields (columns) is configurable through the Columns option. This functionality allows the user to dynamically select which columns to show in the table view and which should remain hidden. More information at: Customizing table display: Columns.
Además, la aplicación incorpora soporte para el redimensionamiento dinámico de columnas de la tabla, permitiendo al usuario ajustar manualmente el ancho de cada columna según las necesidades de visualización. Más información aquí.
The possible fields are:

✓ Pack: this column lists the Monitoring Packs in use within the Realm. For each entry in the table, the name of the pack followed by the identifying icon is included. Placing the cursor over the icon will pop up a text alluding to the technology represented.
✓ Host Name: this column records the Host whose associated associated is experiencing a configuration error. Clicking on the Host name will take you to its corresponding Detailed view of Hosts and Business Processes.
✓ Host Status: Through this field, WOCU-Monitoring reports the current status (in terms of availability) of the device. For better understanding, the background color of each row in the Status column corresponds to one of the possible states that the device can have. More information at: Statements of Assets in WOCU.
✓ Service: records the monitoring service that is returning a configuration error. Clicking on the Service name will take you to its corresponding Detail view of Services and Business Processes.
✓ Status: Through this field, WOCU-Monitoring reports the current status (in terms of availability) of the Service. For better understanding, the background color of each row in the Estado column corresponds to one of the possible states that the Service can reach. For example, a bluish color for those Services in the UNKNOWN state. More information at: Statements of Assets in WOCU
✓ Info: corresponds to the command line that performs the check function of the pack itself. This detail allows the user to thoroughly analyze the problem and take specific corrective actions.
✓ Host Address: This field contains the IP address of the Device. To view this field, use the Columns function.
Attention
You can make use of the forced data refresh button (🔁) located at the top right hand side of the table.
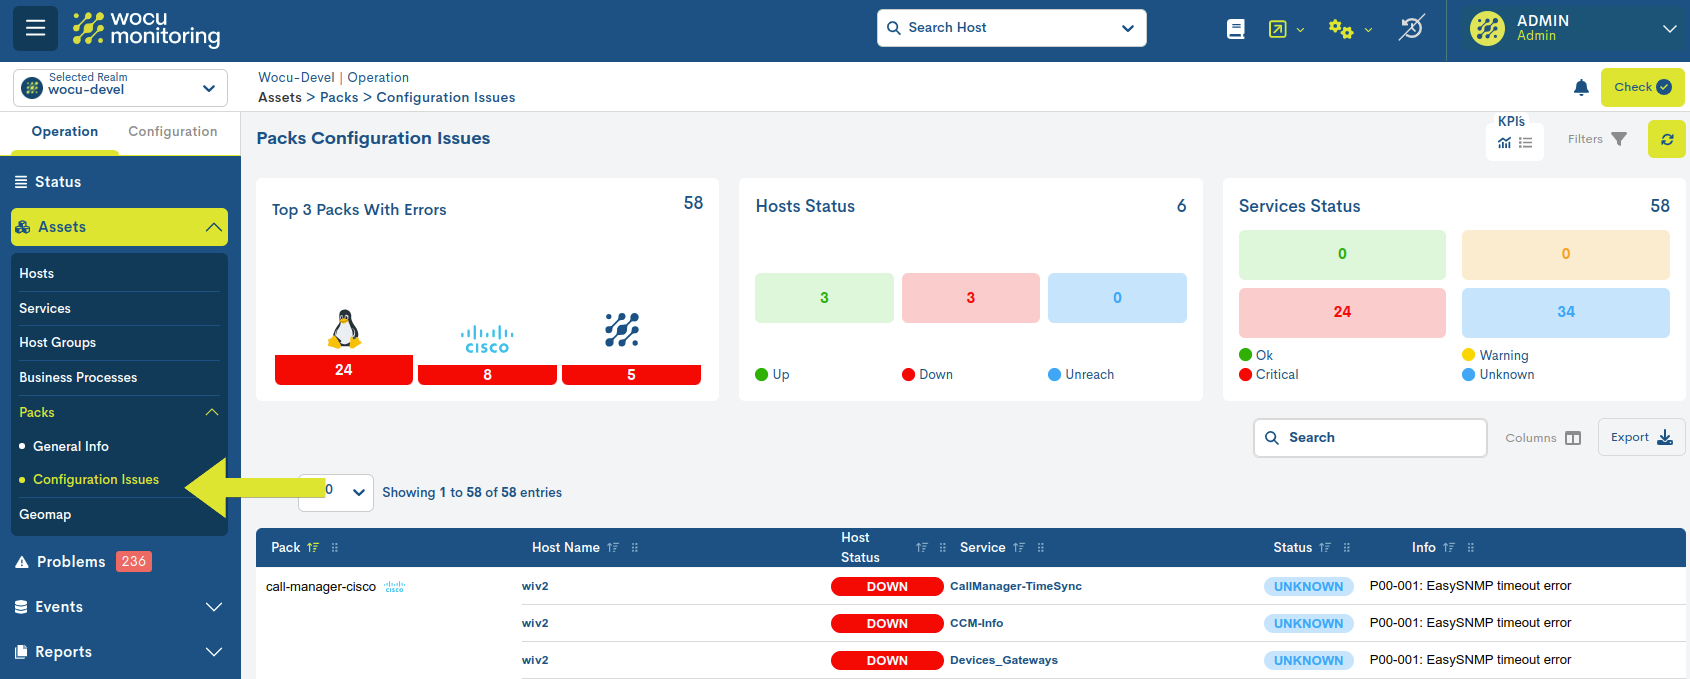
KPI`S
This area displays a series of panels with key performance indicators (KPIs) and the operational status of the assets present in the inventory.
KPIs can be viewed in two possible ways:
Full view
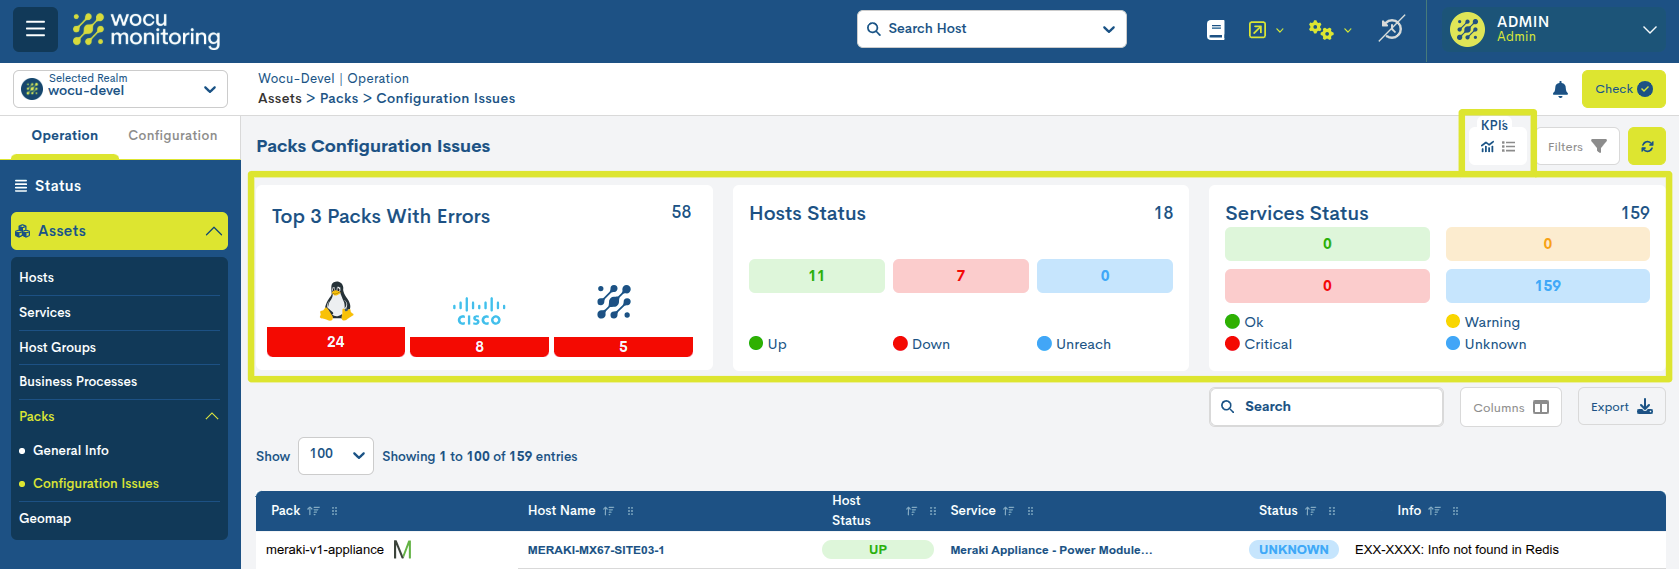
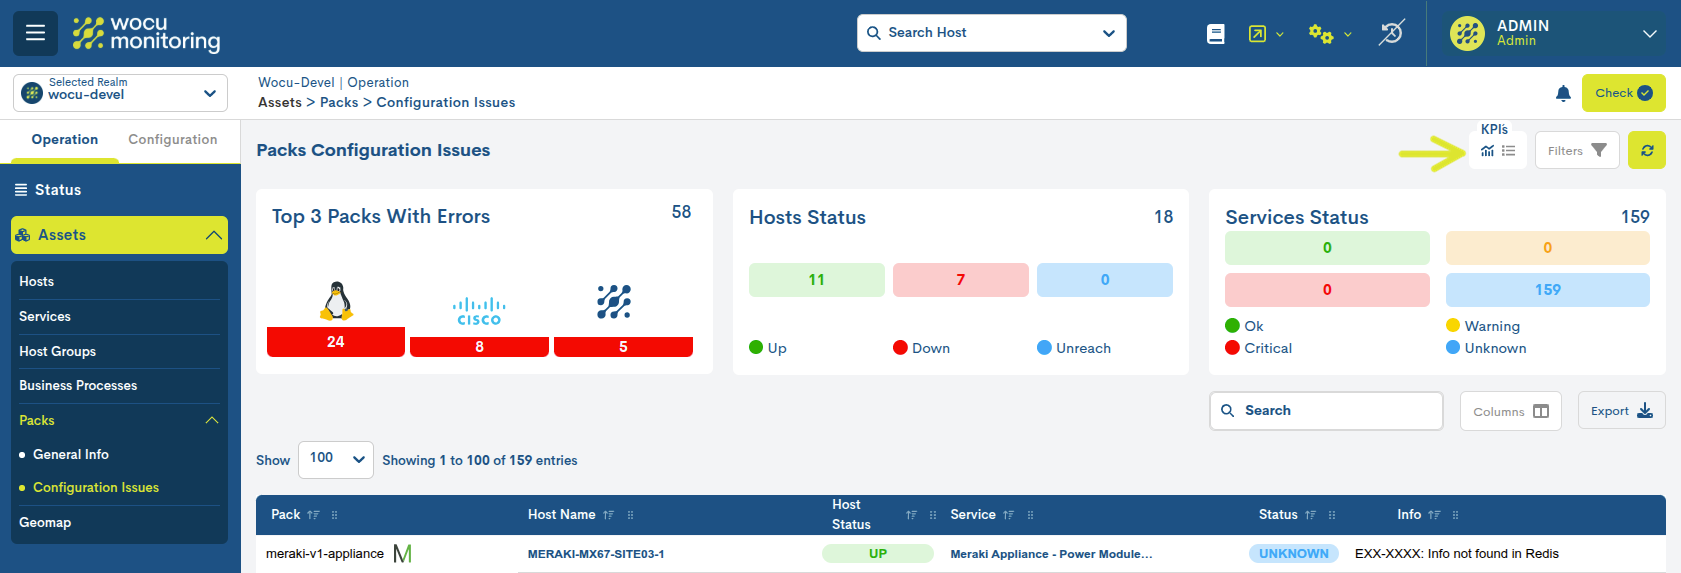
By activating the icon marked in the following image, the following KPIs are displayed with detailed data and interactive charts:
Top 3 Packs With Errors
Ranking of the three Monitoring Packs that record the highest number of errors or incidents.
According to the image above, the total number of errors recorded on hosts that have any of the three main packages configured (Linux Operating System, Cisco Device, or WOCU Server) is 58.
In addition, a bar graph shows how the Linux Operating System package records a total of 24 errors, followed by Cisco Device with 8 and WOCU Server with 5.
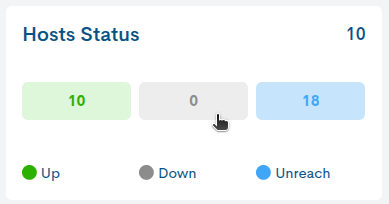
Hosts Status
Count of hosts in inventory based on the current monitoring state. This information corresponds to the Hosts Status column.
Note
This KPI acts as an interactive filter: by clicking on any of the estados de monitorización, the table automatically updates to show only the assets corresponding to that state.
When one or more states are deactivated, the corresponding buttons fade to gray, visually indicating they are inactive. To reactivate a previously disabled state, simply click on it again.
By default, the table displays assets from all possible states until the user interacts with one of the filters.
Services Status
Service count in inventory based on current monitoring state. This information corresponds to the Services Status column.
Summary view
By activating the icon marked in the following image, the previous KPIs are displayed in a more compact format for quick reading:
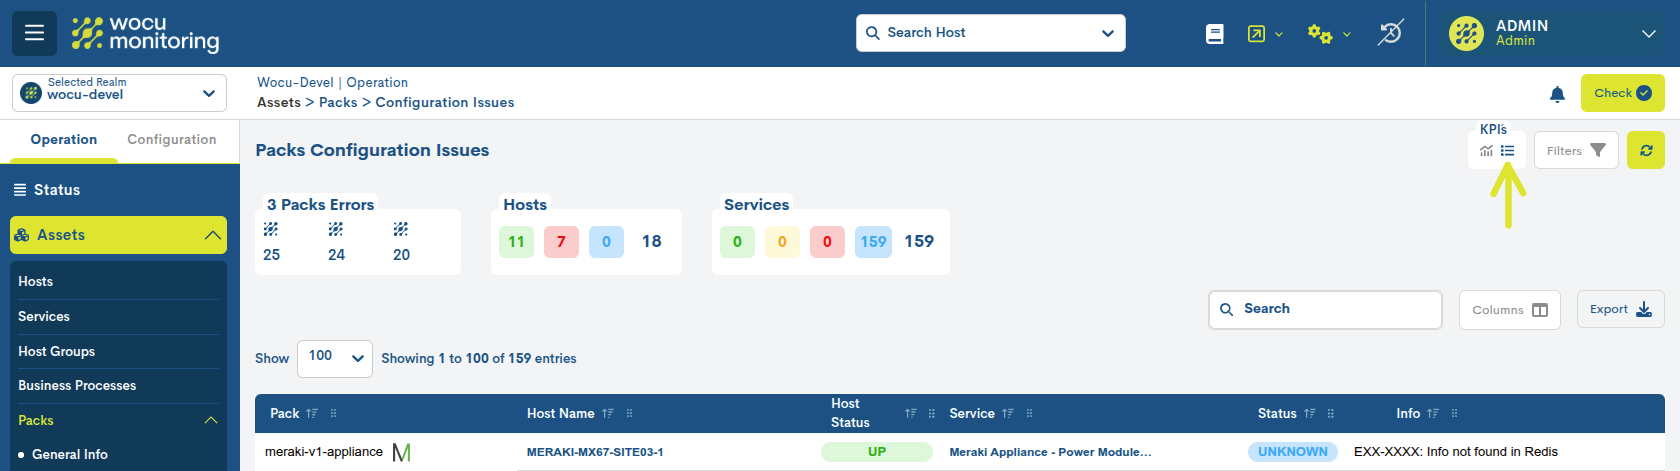
Likewise, it is possible to hide the panel block by toggling both buttons.
Filter Devices by State Type
These filtering options modify the display of Hosts based on their current state. Using this filter, it is easy to select elements that are in a specific monitoring state.
By default, all checkboxes/statuses are checked, indicating that the inventory is showing all Devices without discriminating by any status. Its operation is very simple: by clicking on a checkbox, the filtering option is toggled. Note that once a checkbox is checked, it will display a tick (✓) inside.
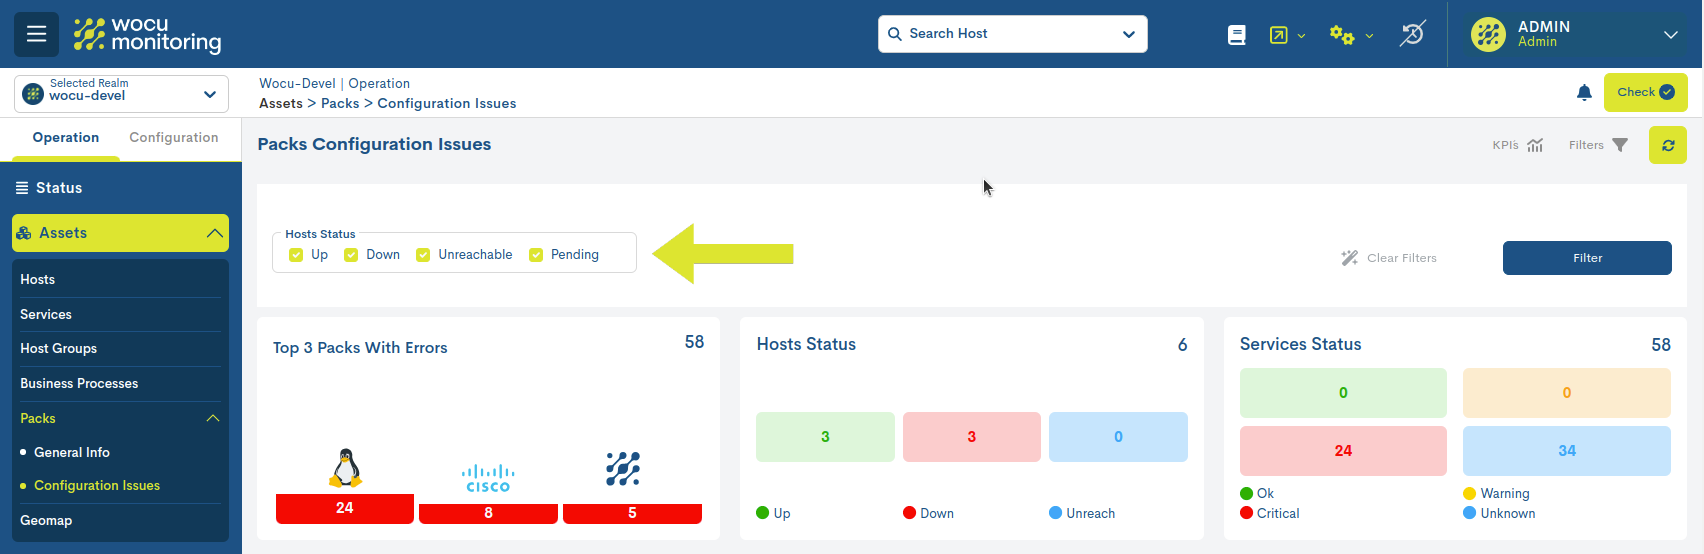
Finally, once the filters are configured, you will need to save the changes by clicking the blue Filter button to reload the inventory with the new data request.
Pack inventory data export
Although WOCU-Monitoring offers a multitude of functions for data management, metrics, graphs, etc., at some point the use of other external tools may be required to process said information. To do this, the export function is integrated into the two tables, which facilitates the download of inventory data into a file on the hard drive for later processing or use.
For the General Info view the formats available through the Export option are:
CSV
By clicking the corresponding button, a new modal will open for selecting and marking the parameters to be exported according to the user’s criteria. The available options are:
Pack (Mandatory)
Hosts
Host State
Services
Services States
Once the selection is confirmed, the download of a file in CSV format (Comma Separated Value) will begin. This is a very simple format that organizes columns using a separator (semicolon “;”) and rows with a line break.
JSON
This option follows the same procedure as the previous case, but initiates the download of a file in JSON format (JavaScript Object Notation), a lightweight data interchange format that can be read by any programming language and, therefore, used to exchange information between different technologies.
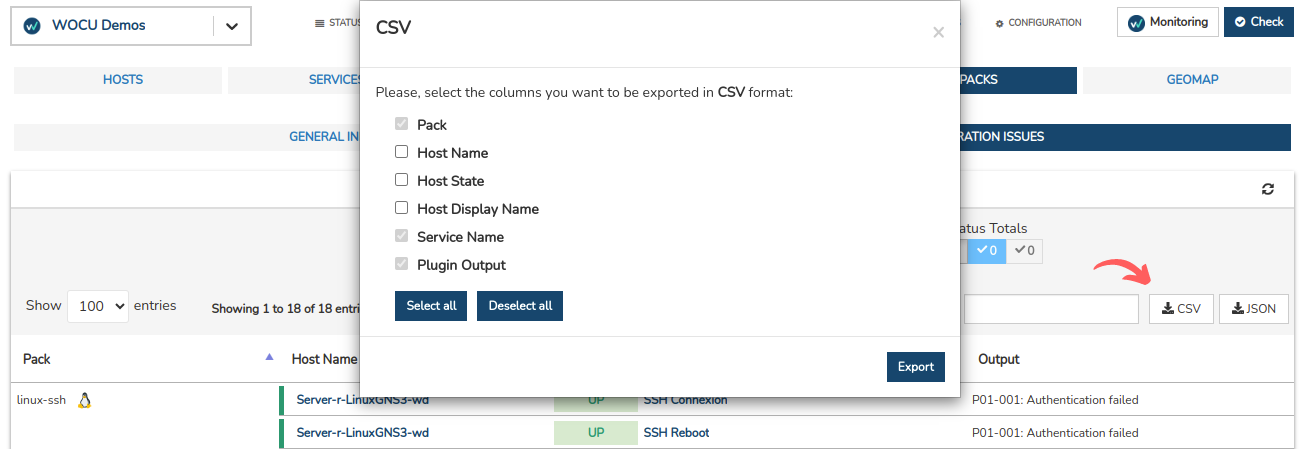
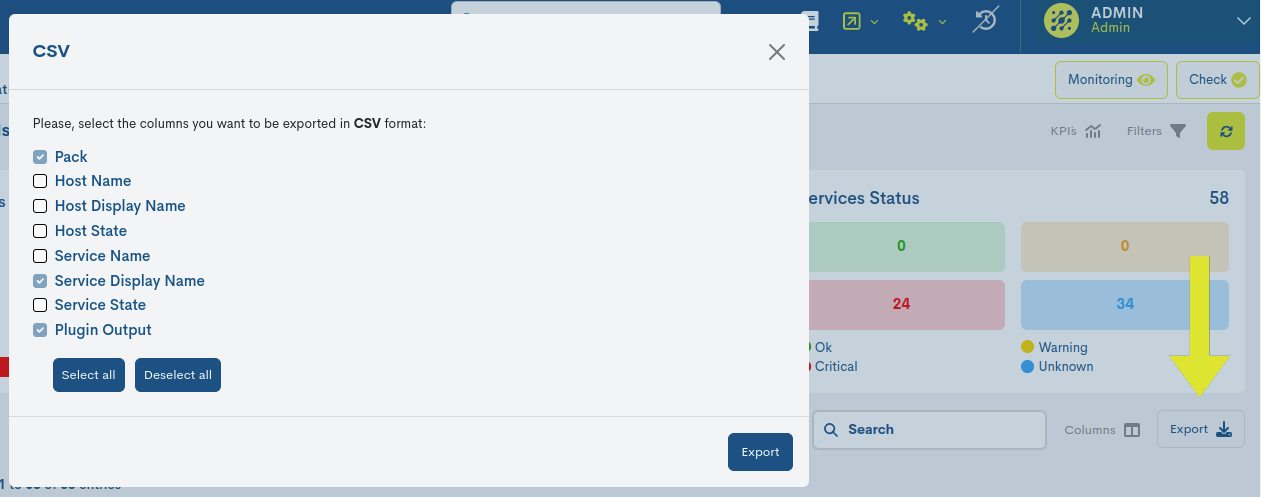
For the Configuration Issues view the formats available through the Export option are:
CSV
By clicking the corresponding button, a new modal will open for selecting and marking the parameters to be exported according to the user’s criteria. The available options are:
Pack (Mandatory)
Host Name
Host Display Name
Host State
Service name
Service display name (Mandatory)
Service State
Plugin Output (Mandatory)
Once the selection is confirmed, the download of a file in CSV format (Comma Separated Value) will begin. This is a very simple format that organizes columns using a separator (semicolon “;”) and rows with a line break.
JSON
This option follows the same procedure as the previous case, but initiates the download of a file in JSON format (JavaScript Object Notation), a lightweight data interchange format that can be read by any programming language and, therefore, used to exchange information between different technologies.
In both options, the system will offer the choice to select the directory where the generated inventory file will be downloaded and stored, and to assign an alternative name to it. By default, the system assigns the following name:
assets-packs-errors_[nombre del reino]_00h-00min_dd-mm-aaaa y la extensión ``.csv`` o ``.json``.