Release Notes 47
Date of Publication: 01/09/2021
The new version 47 is loaded with new features and improvements in response to the requests and suggestions of our users and the current market needs.

WOCU-Monitoring is capable of monitoring thousands of Services generating millions of alarms and metrics per day. For this reason, a new view has been designed that gathers all the monitoring Services, together with their associated Hosts. Locating a specific Service and sorting them by any attribute or operational status is now possible.
The presentation of technology identifying icons has been extended to new pages of the application, providing valuable information on what types of hosts are being monitored. In addition, the database has continued to be enriched with the addition of new icons
Because of its importance, the Templates module has been re-optimised with the new template propagation feature. In a single step, a template becomes available in all managed Import-Tools.
With regard to Import Tasks (Tasks), the operator can now decide on which configuration attributes can be excluded or discriminated during the asset configuration profile discovery process. This concession is intended to facilitate the management and maintenance of a valid and up-to-date network.
In the same direction, a new control and penalty system has been designed for excess assets to be monitored, to guarantee control and stable connection between all network equipment, thus preventing a possible overload of the system.
In conclusion, this release includes optimisations, improvements and bug fixes, which together make this latest version more stable and consistent.
The following is a more detailed list of the latest news from WOCU-Monitoring.
1. Display technology identification icons on Assets, Problems and Events pages.
If the previous version 46 of WOCU-Monitoring included identifying icons in the Host Modal header, this time, this add-on is added at new points in the application where Host identification is paramount. These are
✓ List of alarms on monitored assets
✓ Monitoring Events (Monitoring)
Its operation is based on the query of specific text strings against a predefined dictionary, where text strings are associated with icons. The coincidence of these patterns within the list of applied packs allows the assignment of representative icons to the Host.
The system will display a maximum of three icons ordered by a scale of weights defined in the above mentioned dictionary. The purpose of this operation is to give priority to the most representative and relevant (and less generic) icons of the monitoring profile of the Host.
Finally, by placing the cursor over a specific icon, a text alluding to the technology represented will appear. This text can be configured as a title in each corresponding entry of the icon dictionary.
With this functionality extension, the localisation of Hosts is improved, based on the monitoring services and technologies currently configured. With the creation of new monitoring packs, the catalogue of icons will be expanded.
2. New Monitoring Services view in Assets.
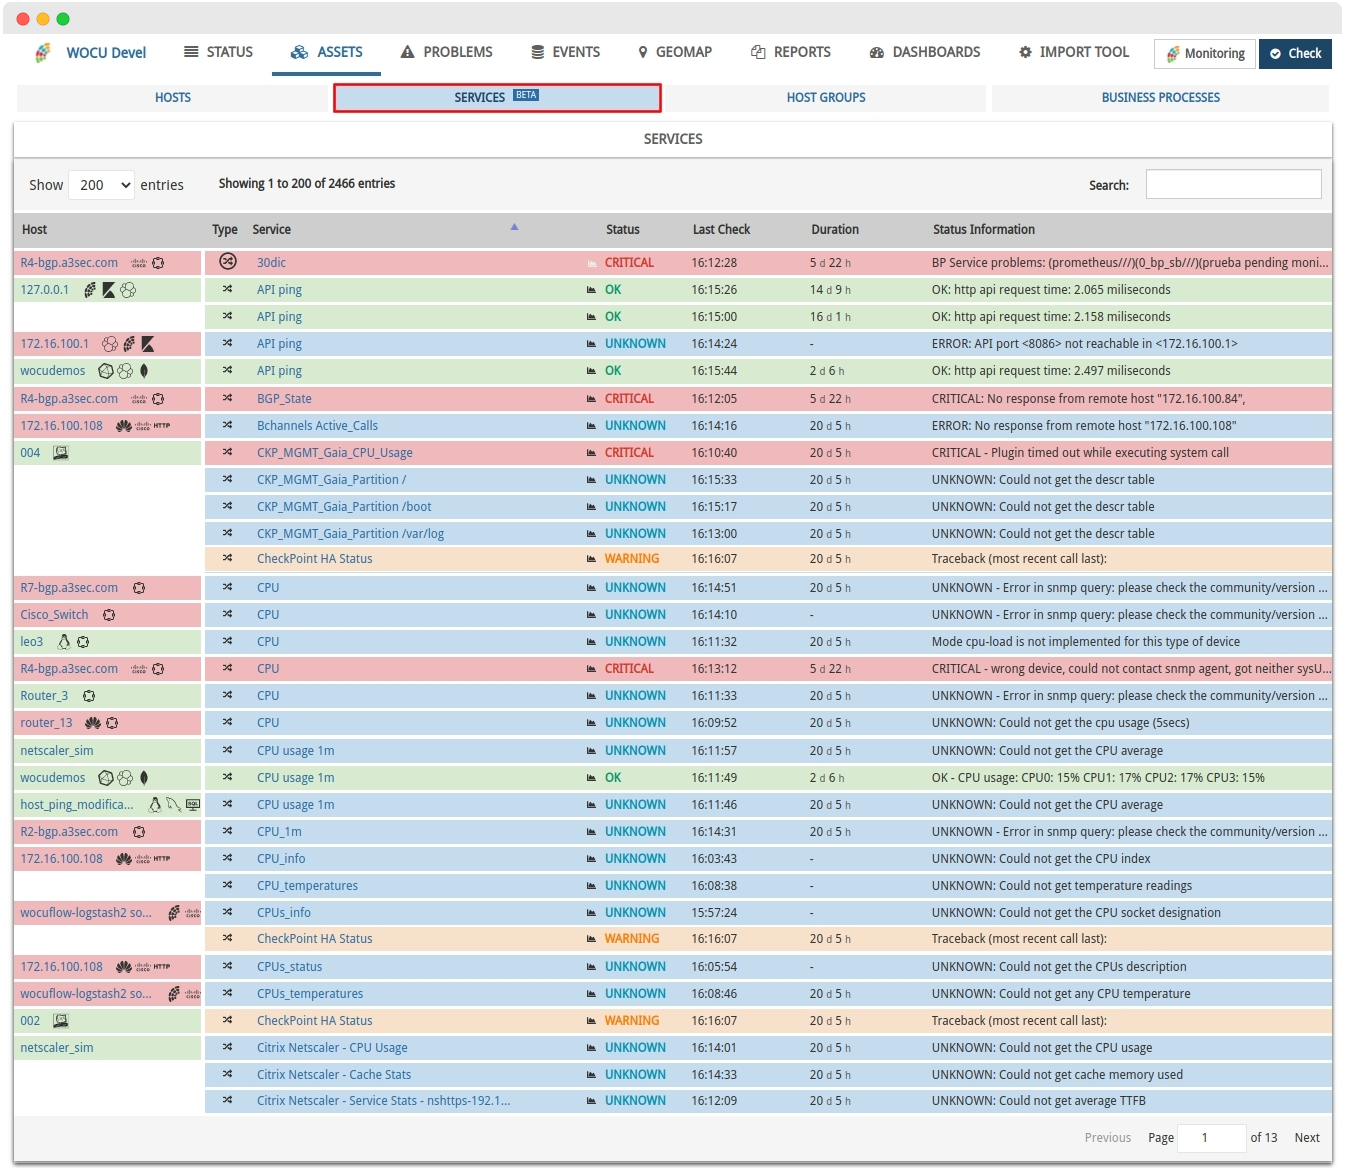
The tab Assets of a Realm, collects and categorises in sections, each of the types of assets that are being monitored in WOCU-Monitoring. This version brings with it the addition of a new section for the inventory of the set of Monitoring Services associated to Hosts.
This new space provides a global view of the Services that are being deployed, facilitating a deeper analysis in terms of availability and operability of the infrastructure. In addition to linking Services and Hosts, the inventory includes specific information on the current status of the Service, the last checks executed, as well as other metric graphs provided during the testing tasks.
Unlike the Hosts Inventory where Services depend on their respective Hosts, this list allows you to search for all available monitoring Services. This way, it is much more agile and convenient to locate specific Services, for example, to get only the CPU services. Another advantage is the sorting by any attribute of the Service, either by the last executed check or grouping elements by status type, among others.
Note
More information can be found at: Services Inventory.
Note
Currently this tab is in BETA status as there are still some functionalities to be implemented, such as the ability to execute actions on each of the Services. But we believe that in its current state it can already be of great help to WOCU-Monitoring operators and that is why we include it in this version.
3. Migration of backend code and dependencies to Python 3.8
In this release, all code written in Python has been migrated to work with the version 3.8 interpreter. This includes both the Aggregator, the Import-Tool, and the Monitoring Packs written in Python.
In the following link we can see the new features introduced:
It has also been necessary to update a multitude of dependencies, which added to the change of interpreter has meant an overall improvement in performance.
This migration has allowed us, for example, to efficiently cache some properties of the main Import-tool models used intensively by the API configuration
Note
As of future version 48, any script written in Python2 that uses the WOCU libraries will need to be ported to Python3. Contact our Support Team (support@a3sec.com) if you find yourself in this situation and need help.
4. Propagation of Host Configuration Templates
As you already know, thanks to the design and assignment of different Templates in the Host configuration, every element registered in the system is adjusted and efficiently fulfils the expected monitoring function.
In this version we extend the usability of these predefined configuration profiles, allowing (in a single step) the propagation of templates to all Import-Tools enabled in WOCU-Monitoring.
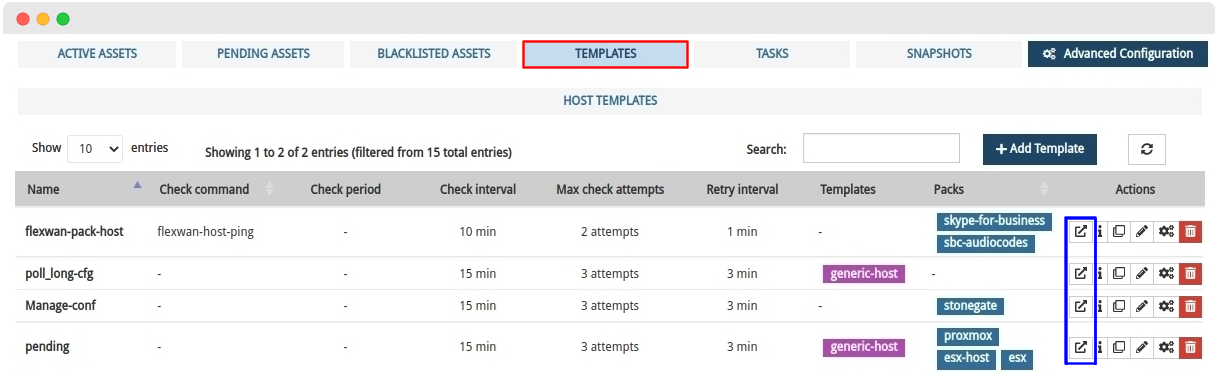
From now on, in the List of Host Templates we can find: the Duplicate action to generate a copy of the template in that same Realm; and the new Spread function, to spread and export the selected template to the rest of the managed Import-Tools.
Once the action has been successfully executed, the system will display the following dialogue box with the results obtained by each of the receiving Import-Tools:
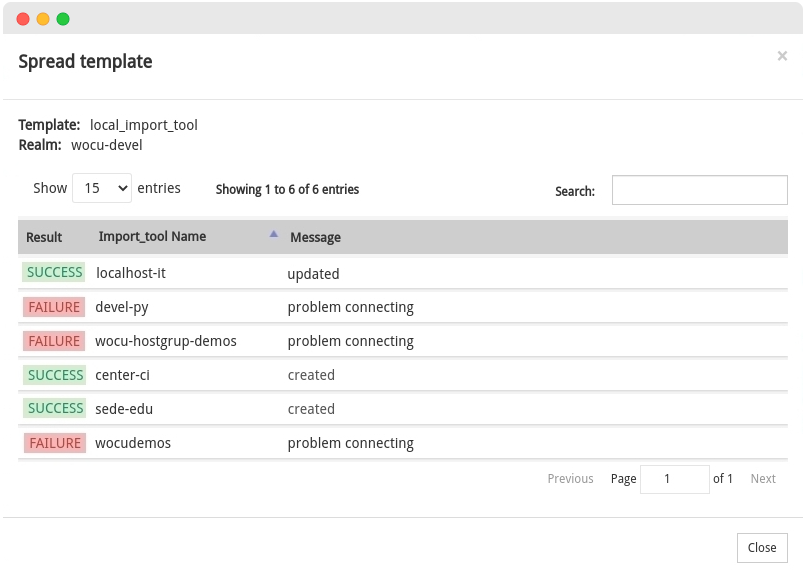
With this integration, the Templates module becomes fully cross-cutting between the various asset import tools of WOCU-Monitoring.
Note
More information can be found at Actions.
5. New control and penalty system for excess assets to be monitored.
WOCU-Monitoring enables the monitoring and administration of networks of varying size and complexity. This requires constant maintenance and debugging of the inventoried equipment plant to ensure control and stable connection between all useful network hosts and services.
Ignoring this good practice can lead to excessive system load and consequently affect the performance of the tool.
As a control measure, a Control system and penalties for excess assets to monitor has been developed, which consists of assigning points to the assets being monitored, according to the weight or load that their execution entails in the system (computational cost). The operator will be penalised if the established limit is exceeded.
It is very simple to operate:
✓ Each Realm has an initial number of points, hereafter referred to as credits.
✓ A maximum limit value or threshold of credits to be consumed is defined.
✓ Each asset type (
Hosts,BP HostsandBP Services) has one or more credits associated with it, which may vary depending on a number of factors. More information can be found at: Calculation and control of assets to be monitored.✓ Depending on the expenditure or consumption of credits per Realm, the tool can experience three possible scenarios:
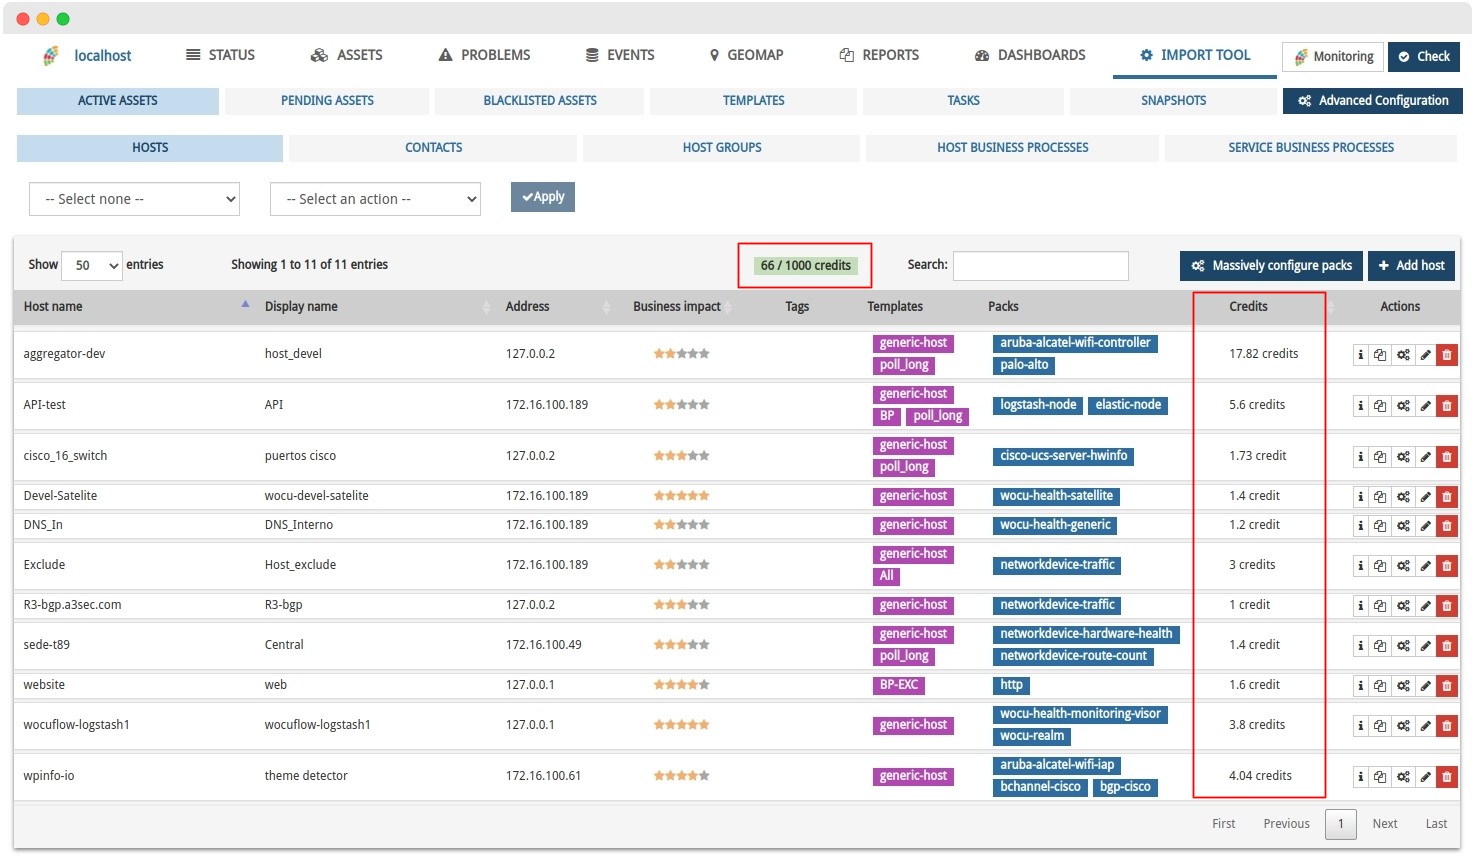
Optimum level (OK): when credit usage is well below the set limit.
Ejemplo: se han consumido 66 de los 1000 disponibles.

Warning level: when the expenditure of appropriations exceeds 70% of the total available appropriations.
Ejemplo: se han consumido 50 de los 60 disponibles, sobrepasando el 70% del total.

Critical level: se excede el límite o umbral máximo de créditos fijado.
Ejemplo: se ha sobrepasado los 40 créditos asignados para el Reino en cuestión.

✓ Exceeding the set limit will automatically block various aggregation and asset configuration actions. In order to return to normal operations, it will be necessary to reduce the number of credits used (de-registration of equipment and deletion of packs). More information can be found at: Penalty measures by asset type.
It will be possible to know at all times the global expenditure of credits, by means of an informative label at the top of the different asset lists. The total credits consumed per asset is also specified in a new column called Credits.
Note
You can find more information at: Control system and penalties for excess assets to monitor.
6. Integration and update of endpoints of the Public API
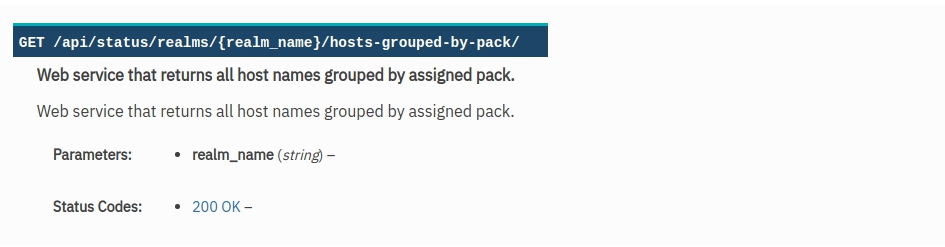
New endpoint for obtaining Hosts grouped by Pack applied
The API Public of WOCU-Monitoring has been updated by adding a new endpoint designed for querying and retrieving Hosts grouped by their applied monitoring packs.
The result of consulting this endpoint for a small Realm could be the following:
{
  "networkdevice-traffic-health": [
    "Cisco_Switch",
    "Router_2",
    "devel-traffic-health",
    "prueba_packs_wocu",
    "router_81_traffic_health"
  ],
  "snmp-oid": [
    "DNS1_interno",
    "leo2"
  ],
  "snmp-generic": [
    "DNS1_interno"
  ],
  "dns": [
    "DNS2_interno"
  ]
}
With this endpoint we will be able to quickly consult the set of packs used in a given Realm, which will give us valuable information on what type of hosts are being monitored.
This recent feature also opens the door to new integrations, such as the development of a filter by pack type in the Assets page and even a specific page for sorting and grouping implemented packs.
Restructuring of various endpoints for the synchronous collection of KPIs
New changes have been addressed in the endpoints for obtaining KPIs for events, in order to mitigate the slowdown in requests and data retrieval in complex Realms or Multi-Realms.
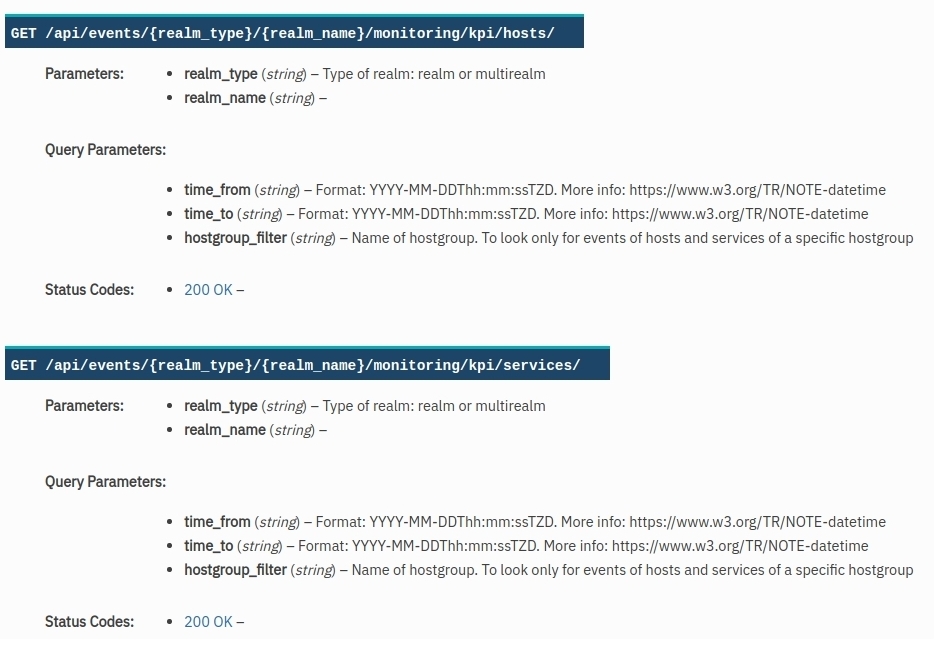
1. Unification of endpoints.
Previously, there were four endpoints for obtaining KPIs on Hosts and Services incidents for each type of Realm (standard or multi-realm):
GET /api/events/realms/{realm_name}/monitoring/kpi/hosts/
GET /api/events/realms/{realm_name}/monitoring/kpi/services/
GET /api/events/multirealms/{realm_name}/monitoring/kpi/hosts/
GET /api/events/multirealms/{realm_name}/monitoring/kpi/services/
These have been unified into two new endpoints, one for each asset type: Hosts and Services. Both support the standard Realm and Multi-Realm types via a new parameter. Overall, this overhaul brings a more sustainable administration of the API.
The result of the query of these endpoints is a link to a new endpoint where to query the result. This link includes a unique identifier for the asynchronous task running the job.
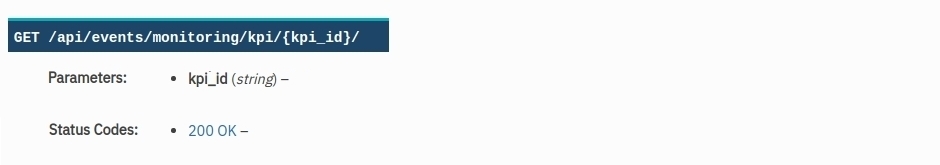
2. New query endpoint of the asynchronously generated result.
The execution of the previous endpoints is done asynchronously, i.e. the work of obtaining the events is processed in the background, but the result is not obtained, but the identifier to be consulted by another new endpoint developed for this purpose.
This new endpoint takes care of obtaining the requested event KPIs, by means of the unique identifier returned in the previous endpoints mentioned above.
When the call has been resolved, the endpoint may return the following data:
The KPI required if the asynchronous task has been successfully completed and the timeout of the result has not been exceeded.
A In process message, if the task is still running. This will force another query to be run again.
A Not found message, if the configured expiry period has been exceeded.
Remember that the data returned will be useful to measure levels of efficiency and optimisation of the internal incident resolution process, in order to ensure the best possible service operation.
Note
Access the full WOCU-Monitoring API documentation at Public API documentation.
7. Different refactorings of the frontend.
✓ Part of the functionality related to Reports and Scheduling (included in the main library), has been migrated to Typescript, a technology that allows for improved future development, stability and quality of the application.
✓ This migration process also includes the unification of different tests for the common use of the same technology and the simplification of the project by eliminating two unnecessary dependencies.
✓ The database of identifying icons of technologies associated with Monitoring Packs, has been updated with the addition of new icons
F5 BIG-IP
MySQL
Check Point Gaia
✓ The non-visible part of several widgets of the tool has been simplified by migrating them to REACT technology. These are:
Scroll Top button which redirects the user to the top of the page.
✓ Implementation of a new global component for assigning required permissions, for loading and displaying the widgets of the Hosts Modal Status page and of the Services Modal Status page
✓ Expendable legacy code has been removed and the code still in use has been refactored. This operation has been carried out in several global functionalities of the tool.
8. Attribute Exclusion Capability in Import Tasks
Each of the Asset Import Tasks of WOCU-Monitoring, includes a set of Host attributes that by default are ignored during the discovery and/or update process of configuration profiles, of only assets that are already being monitored.
That said, the ability to edit the attributes to be discriminated against during the launch of network discovery tasks has been added. This achieves the following:
✓ Protect specific asset configurations, preventing the system from repeatedly tracking and identifying assets that are already being monitored by the tool, but with a different attribute (which is not of interest at the moment).
✓ And consequently, avoid the presence of irrelevant assets in the Pending Assets list, waiting for the operator to decide what to do with them.
Now, the task configuration and registration forms will have the Exclude fields parameter enabled, where the operator can manually modify the attributes that are going to be omitted in the different import pathways. It is possible to modify the list by adding new fields or removing some of the preset ones.
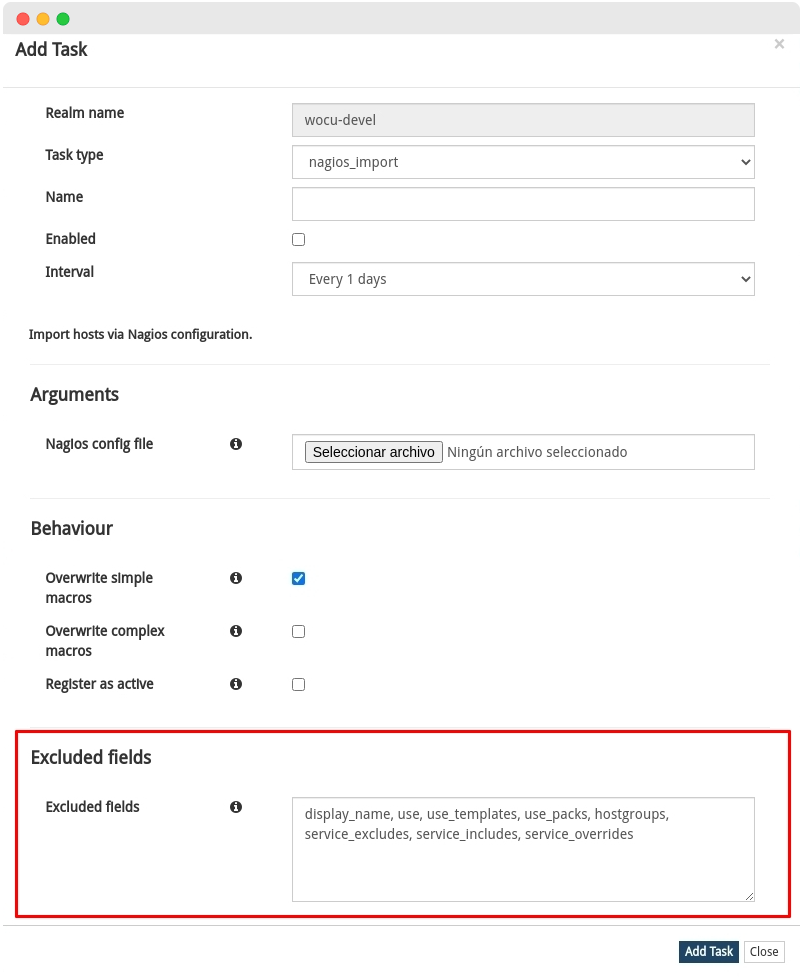
Without further ado, the task of this new function is to collect and maintain an updated network with the appropriate attributes and values for effective, accurate and tailored monitoring.
Other improvements and fixes
Every new version is full of small changes, fixes and optimisations that should be briefly highlighted. We list the most notable ones in this release:
The realms selection and view function, in particular the
Allselector, is now operational again, facilitating the filtering of all realms summary panels, in the tool’s Home.Fixed an internal bug in the widgets Evolution of Host & BP Hosts and Evolution of Services & BP Services of the Status tab, which blocked the output of error or warning messages when both components were in an anomalous situation.
New search options and parameters in the Monitoring Events (Monitoring). It is now possible to query the table by: event type (
HARD/SOFT),Status,Userand byevent title.In the numerical summary of monitored elements panel of the Home, the status colour labels accompanying each element were not displayed when the value recorded was
0. This bug has been fixed by re-displaying the labels with their respective associated colours, regardless of their final result or count.Fixed a display bug with the Contacts and Templates selectors, which were hidden in the create-new-Host and designing Configuration Templates, available in the Import-Tool module.
Blocked the ability to enter alphabetic characters in numeric type macros. This bug occurred in the monitoring packs configuration view Templates.
The searchability of the Host Modal Services table has been improved, allowing searching by
Status,Last check,DurationandNext checkfields. In addition, a bug that caused services to be out of order in this table has been fixedFixed several
warning errorsvisible in the browser console.In Device Inventory Reports, the aggregation of several data sections is done via a OR, which may not meet some of the defined conditions. An error has been corrected in the report display, specifically in the Filter field, where the sections were presented linked by means of the intersection AND, erroneously suggesting that the results obtained should meet all the proposed conditions.
The button for the export function in various formats of Availability Periods Reports has been relocated in order to improve its visibility and enhance this action
Fixed a bug in displaying Hosts from the Hosts in Active Assets (Import-Tool) table, caused when the Business Impact parameter exceeded
scale 5.Renewal of the Host Groups Inventory view, enlarging the space and contrast between rows of the table, as a visual improvement of the displayed data. In addition, the user will be able to consult, through a new pop-up text available in the Host Status and Service Status fields, the breakdown of the grouping and summation of group member elements by type of operational status.
From this version onwards, requests made by the Aggregator to the Import-Tool module will use the Proxy model defined in configuration (variable
PROXIESinsettings/default.py), instead of the system’s own environment variables.The auto-completion functionality of the
Column Nameparameter, generated after metric duplication during the configuration of Multimetrics Reports, has been removed.Fixed a bug that hid the Host name in the displayed text when hovering over the time bar of the Host Availability information view modal of Availability Reports already created
In the previous version, the Realm sorting filters by Name, Assets and Problems in the Home, were blocked when screen autofreshing was enabled. This bug has been fixed, maintaining the expected behaviour of the various options outside of the autorefresh function.
Monitoring events of type
SOFTare included in the Events tabs of the Hosts and ServicesCentralisation of Host and Service status management in a single file, in order to facilitate and simplify its internal application. The following widgets have been refactored to make use of the aforementioned status unification function:
The Hosts Inventory state update time has been reduced by disabling the cache during the execution of the Filter action. This optimisation streamlines the table workflow.
Several tooltips (pop-up tags) with additional information have been added to the elements that make up the aggregation or global view of WOCU-Monitoring. The purpose is to provide helpful information to the user within this highly informative view.
Removed unnecessary parameters included in Events Logs calls from Host Modal.
Validation of macros with unique values in the Monitoring Packs configuration of Templates, to rule out possible erroneous duplicates.
A new Templates can inherit (not overwrite) attributes from the generic templates:
Generic-hostandGeneric-BPhost, in fact, it is recommended to apply them so that the basic monitoring requirements are covered. Considering the relevance of these predefined templates, both can be edited, but actions such as their final deletion or assignment of other Monitoring Packs become blocked, as misuse could trigger errors in the application. The icons for these actions will be greyed out.Fixed a data filtering bug in the Hosts Inventory and Global Status Dashboard. Previously, following a page refresh, the result displayed did not correspond to the filtering options previously applied. Both elements now operate correctly.
No events were displayed in the logs page when the information could not be enriched by consulting Livestatus (to get the
display_nameof the Host involved in each event). From this version onwards, if Livestatus is not available, events will be obtained from the backend of Logs, but not enriched.The code that makes requests to the Import-Tool has been refactored, using a single
ImportToolClientclass. This eliminates duplicate code and helps in debugging errors.
Upgraded software
Numerous pieces of software integrated in WOCU-Monitoring have been incorporated and updated:
Software |
Previous version |
Current version |
Remarks |
|---|---|---|---|
Python |
3.7.9 |
3.8.11 |
https://docs.python.org/3/whatsnew/changelog.html#python-3-8-11-final |
LMD |
2.0.0 |
2.0.2 |
|
Django |
2.2.0 |
2.2.24 |
|
Celery |
4.3.1 |
4.4.7 |
|
Djangorestframework |
3.10.0 |
3.12.1 |
https://www.django-rest-framework.org/community/3.12-announcement/ |
React-Table |
6.11.5 |
7.7.0 |
https://github.com/tannerlinsley/react-table/blob/v7.7.0/CHANGELOG.md |
Monitoring packs
See our catalogue of Monitoring Packs in the following link.
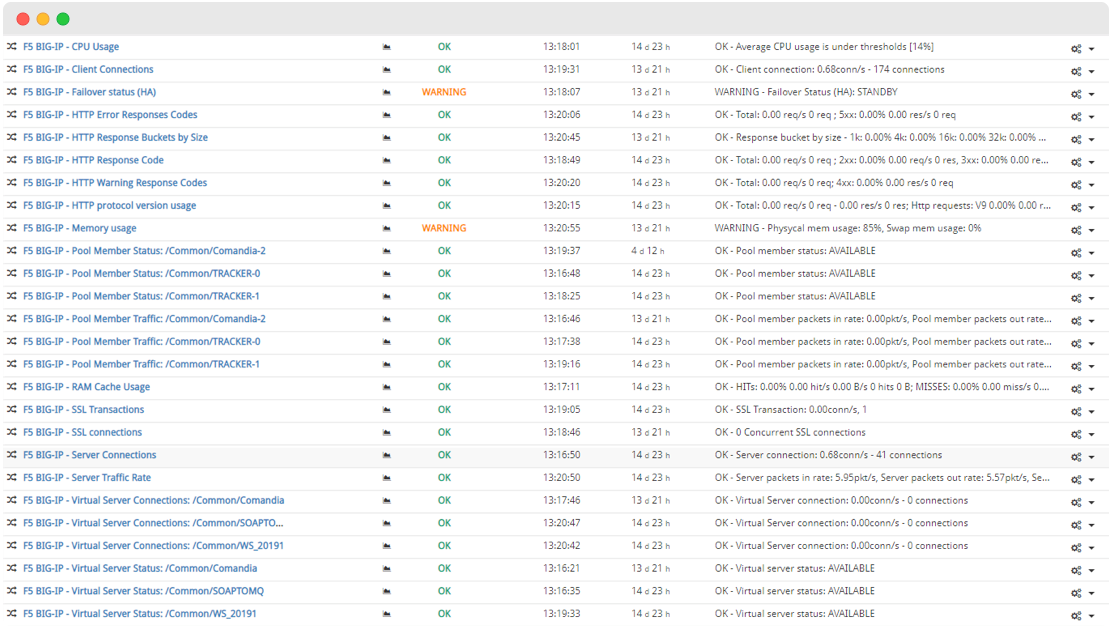
F5-BIG-IP
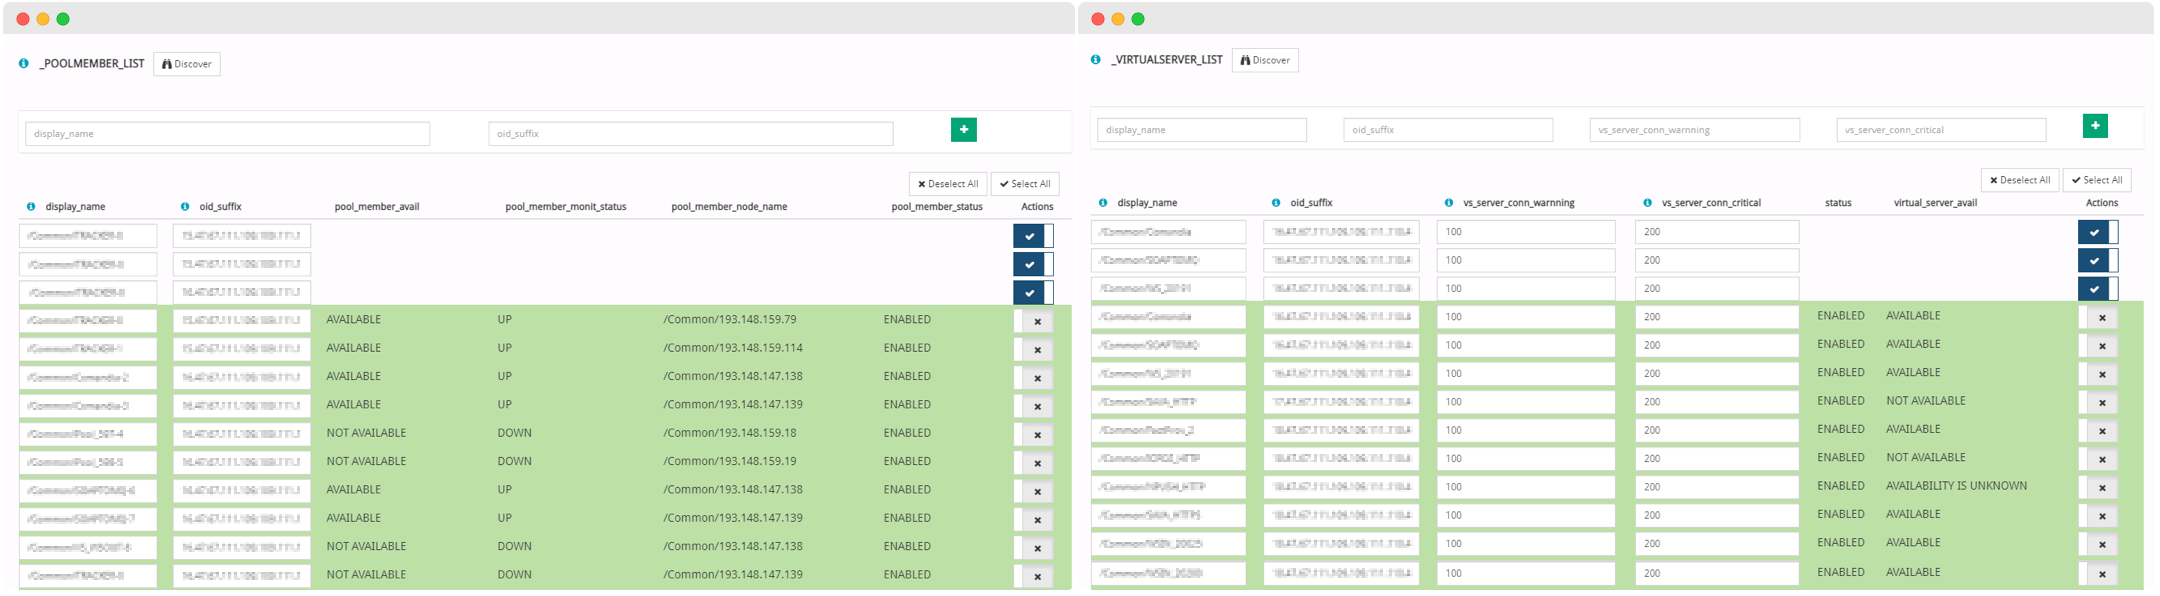
A new pack has been created to monitor the BIG-IP balancers of the F5 brand. It is a very complete pack that includes both global performance checks and specific checks for each virtual server configured on the system. It also has methods to discover all the servers and pools configured, thus facilitating the selection and configuration of these.
The services included in the package are listed below:
CPU Usage: monitors the percentage of CPU usage.
Client Connections: check the number of client connections.
Failover Status: monitors the High Availability (HA) status.
HTTP Response Codes: shows the percentage of HTTP responses per second (sorted by code).
HTTP Error Response Codes: shows the percentage of HTTP errors per second (sorted by code).
HTTP Warning Response Codes: shows the percentage of HTTP warning responses (sorted by code).
HTTP Response Buckets by Size: monitors the percentage of response buckets usage (sorted by bucket size).
HTTP Protocol Version Usage: percentage of requests per second (sorted by HTTP version).
Memory Usage: monitors the percentage of physical and virtual memory usage.
Pool Member Status: monitors the status of each member of a pool.
Pool Member Traffic: monitors the traffic sent by each member of a pool.
RAM Cache Usage: monitors the number of Hits and Misses per second.
SSL Transactions: monitors the number of SSL transactions per second.
SSL Connections: monitor the number of concurrent SSL connections.
Server Connections: check the number of server connections per second.
Server Traffic Rate: monitors the traffic rate to the servers.
Virtual Server Connections: monitors the number of connections to a specific virtual server per second.
Virtual Server Status: monitors the status of a specific virtual server.
Virtual Server Traffic: monitors the rate of traffic sent by a specific server.
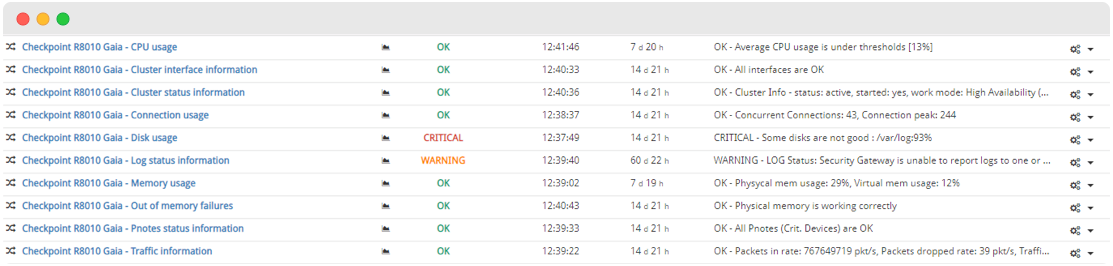
Checkpoint-R8010-gaia
A new pack has been designed to monitor firewalls Checkpoint with Gaia operating system and version 8010.
In addition to the more common CPU and memory usage checks, other services have been created to monitor more specific aspects of these computers. These are:
CPU Usage: monitors the percentage of CPU usage.
Cluster Interface Information: monitors the status of the interfaces that are part of the cluster.
Cluster Status Information: monitors the status of the cluster and the mode the node is in.
Connection Usage: check the number of concurrent connections.
Disk Usage: monitors the percentage of disk space used.
Log Status Information: Displays the status of services related to log submission.
Memory Usage: monitors physical and virtual memory usage percentages.
Out of memory failures: detects errors in physical memory usage.
Pnotes Status Information: monitors the status of critical hosts or Pnotes related to the cluster.
Traffic Information: displays the throughput of the host.
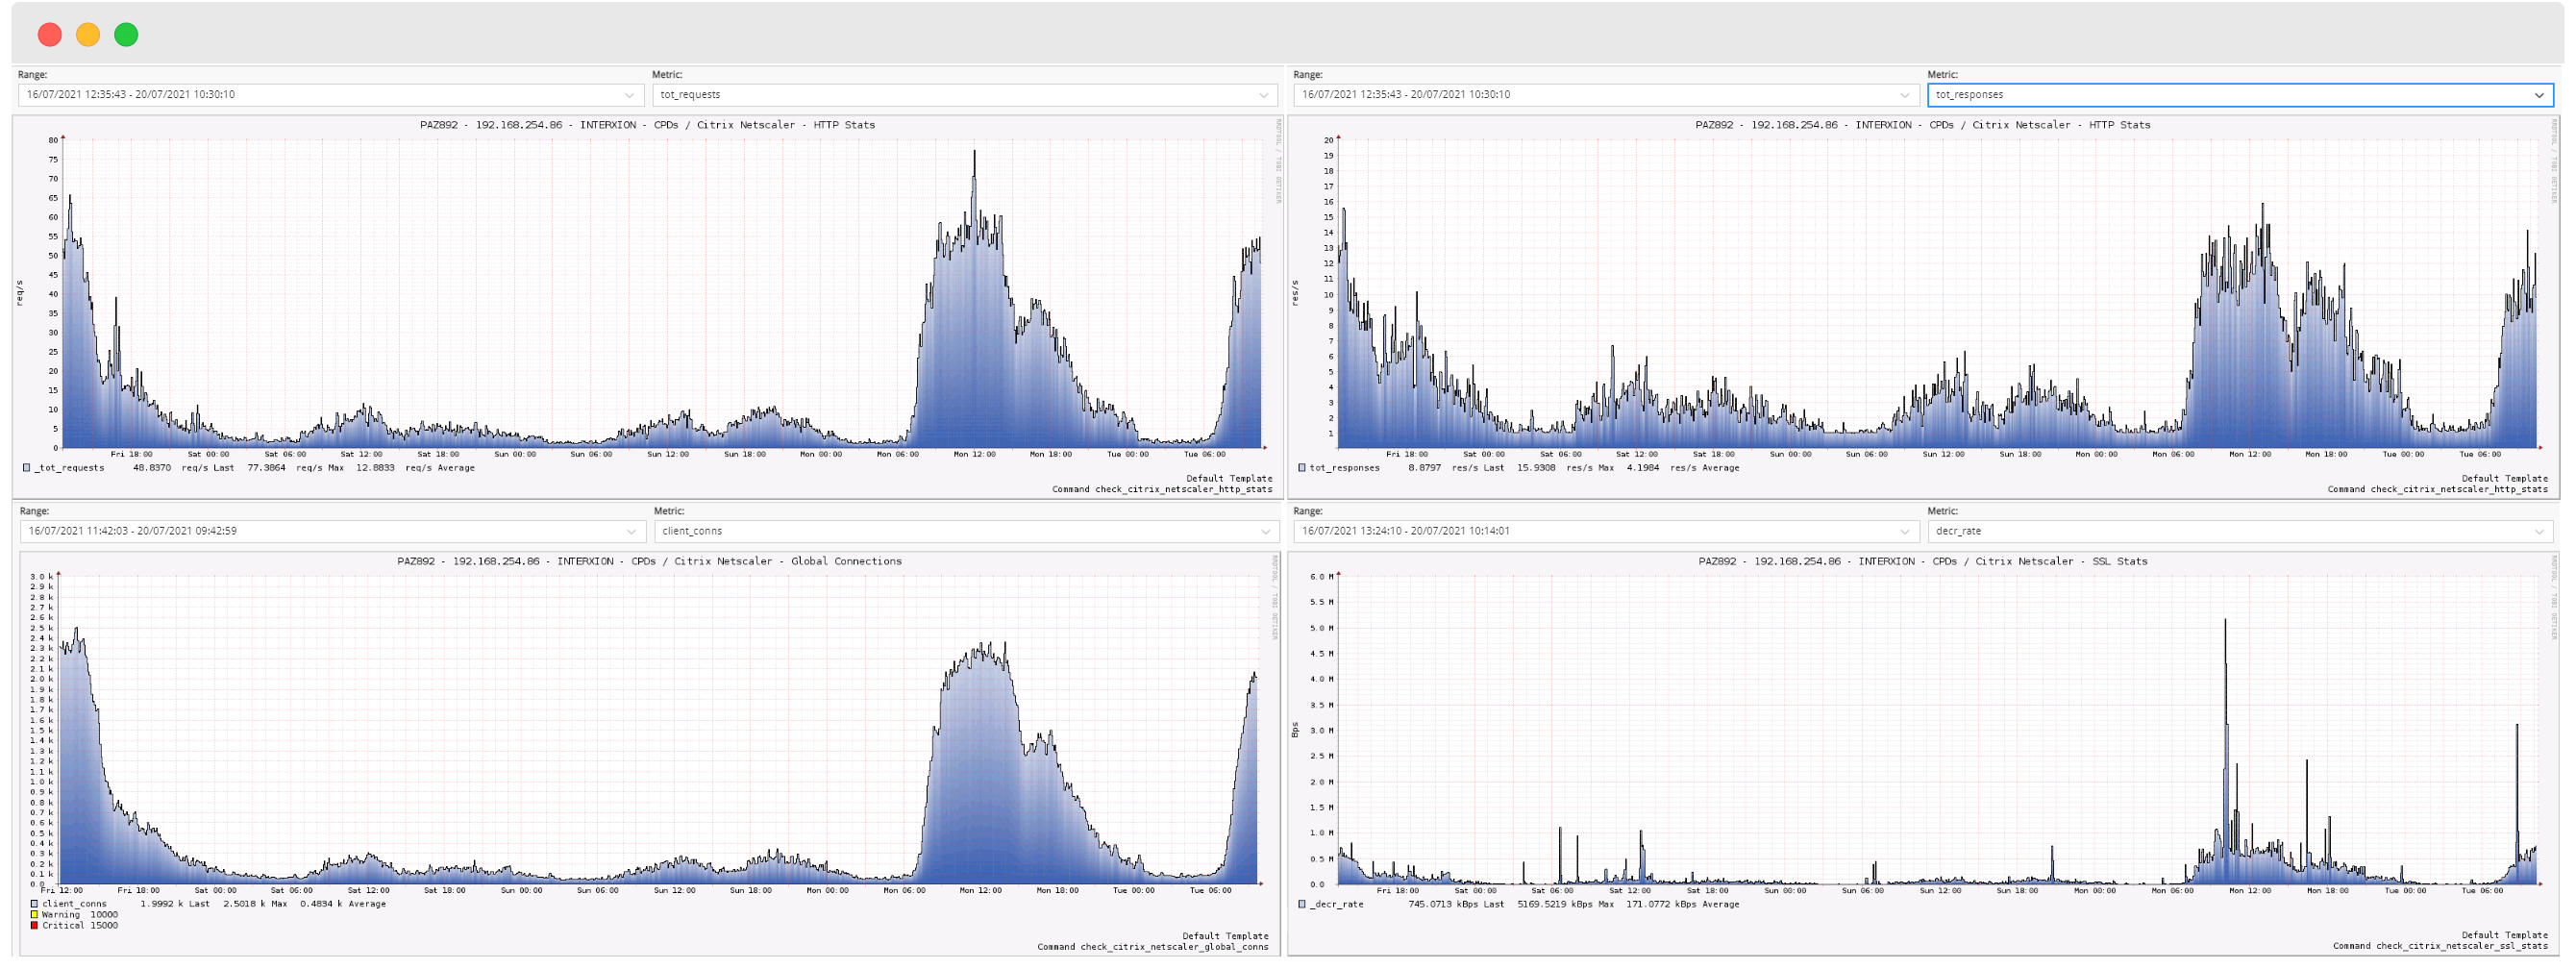
Citrix-netscaler
In this version a new pack has been developed to monitor the Netscaler/ADC hosts from the manufacturer Citrix. These hosts are load balancers and application delivery hosts.
This pack has scripts to discover all the virtual servers and services configured in the host, making it easier to choose them for monitoring from WOCU-Monitoring.
The services included in the package are the following:
Cache Stats: displays cache usage statistics (requests per second, percentage of hits, memory usage, etc.).
Compression Stats: displays statistics on data compression usage (compression ratio, data rate, etc.).
DNS Queries: Displays the number of DNS requests per second.
Disk Usage: checks the percentage of usage of the disks installed in the computer.
Global Connections: displays global connection statistics (client, server, active, established connections, etc.).
HA Info: displays information on the High Availability status of the host and the peer host, if any.
HTTP Stats: displays HTTP protocol statistics, such as requests per second sorted by type (GET, POST, other) and by version (1.0, 1.1).
HTTP Traffic: shows the volume of HTTP traffic received and sent.
Info: provides host information (model, serial number, software version, etc.).
Memory Usage: check the percentage of main memory usage.
RNAT Stats: Displays Network Reverse Address Translation (RNAT) usage statistics for outgoing traffic (sessions, bytes, packets).
SSL Stats: shows the volume of decrypted and encrypted traffic.
Service Info: displays the full name and type of each service.
Service Status: check the status of each service.
Service Stats: displays statistics for each service (TTFB, transaction time, number of connections, traffic volume, etc.).
VServer Info: displays the full name and type of each virtual server.
VServer State: check the state of each virtual server.
VServer Stats: displays statistics for each virtual server (number of client and server connections, traffic volume, VPN users, requests and responses per second, hits, etc.).

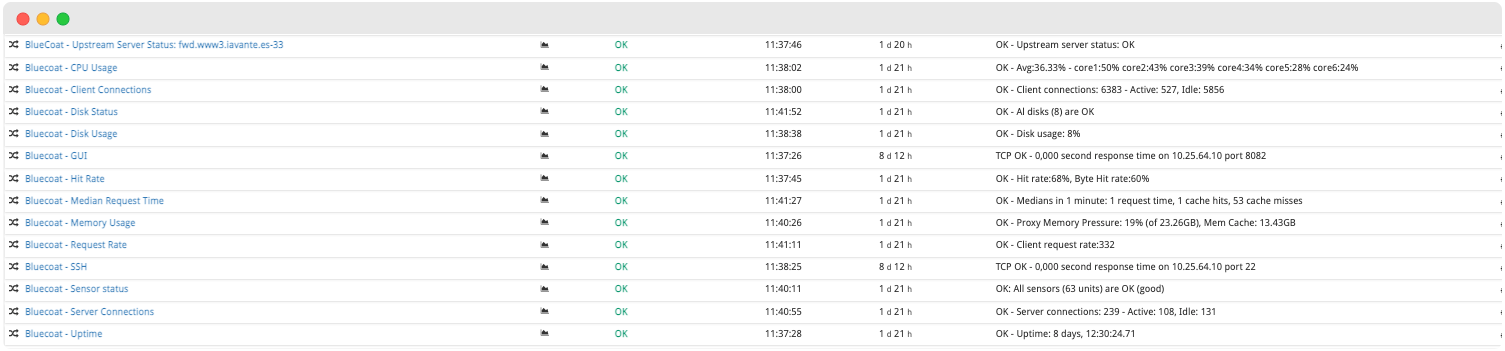
Bluecoat pack update
New services have been added to monitor the classic Bluecoat proxies, which for some time now have been called Symantec Secure Web Gateway. Functionality has also been added to discover the upstream servers and ICAP services configured on the host, making it easier to select and include them in the monitoring.
The services currently available in the pack are as follows:
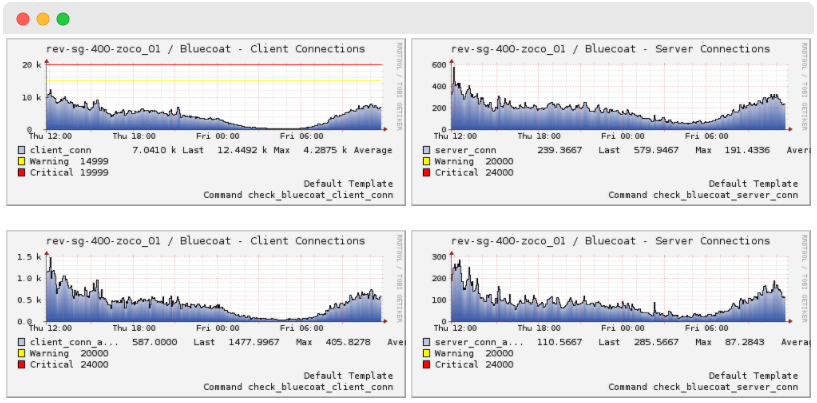
Client Connections: check the current number of connections established with clients.
Server Connections: check the current number of established connections to servers.
CPU Usage: check the CPU usage percentage.
Disk Status: check the status of all installed disks.
Disk Usage: check the usage percentage of all installed disks.
GUI: check if the GUI TCP port is responding. The port number is configurable.
Hit Rate: shows the current hit rate.
Median Request Time: shows the average values of the request metrics.
Memory Usages: check the percentage of main memory usage.
Request Rate: shows the current value of HTTP requests per second.
Sensor Status: checks the status of all hardware sensors in the host. Displays alert if the status of any sensor is not OK.
SSH: check if the SSH access TCP port is accepting connections. The port number is configurable.
Uptime: checks how long the system has been booted.
Upstream Server Status: monitors the status of configured upstream servers.
ICAP Connections: monitors the number of current connections for each ICAP service.
ICAP Deferred requests: check the number of rejected requests per ICAP service.
ICAP Queued requests: check the number of queued requests per ICAP service.
ICAP Request Status: shows metrics of successful and failed requests per ICAP service.
ICAP Request: shows percentages of secure (SSL) and non-secure requests.
ICAP Traffic: shows the volume of traffic carried by each ICAP service.
Bluecoat-cas
A new specific pack for Bluecoat CAS (Content Analysis System) hosts has been added to the catalogue. The services included in the pack are the following:
CPU Usage: check the CPU usage percentage.
Disk Usage: check the disk usage percentage.
Memory Usage: check the percentage of memory usage.
Sensor Status: monitors the status of the host’s hardware sensors.
AWS-EKS and AWS-EC2
Two new packs have been developed for monitoring infrastructures in the Amazon Web Services (AWS) cloud. These are:
- AWS-EKS
Monitors the CPU, memory and node count of an
Amazon EKS (Amazon Elastic Kubernetes Service)cluster.- AWS-EC2
Monitors CPU usage and traffic flow on an
Amazon EC2 (Amazon Elastic Compute Cloud)instance.
Aruba manufacturer support in CPU and Memory packs
Added support for SNMP monitoring of CPU and Memory (generic networkhost-cpu and networkhost-mem) on Aruba hosts.
About WOCU-Monitoring
WOCU-Monitoring is a monitoring tool that integrates the latest Open Source technologies for monitoring, visualisation, metrics graphing and log management, providing a wide visibility on the status and availability of network elements, servers, databases and workstations (among others) using customised Monitoring Packs.
In addition, the Enterprise version of WOCU-Monitoring called Enterprise allows deployments of thousands of IP hosts, in a distributed environment, with customisations tailored to each customer’s infrastructure.