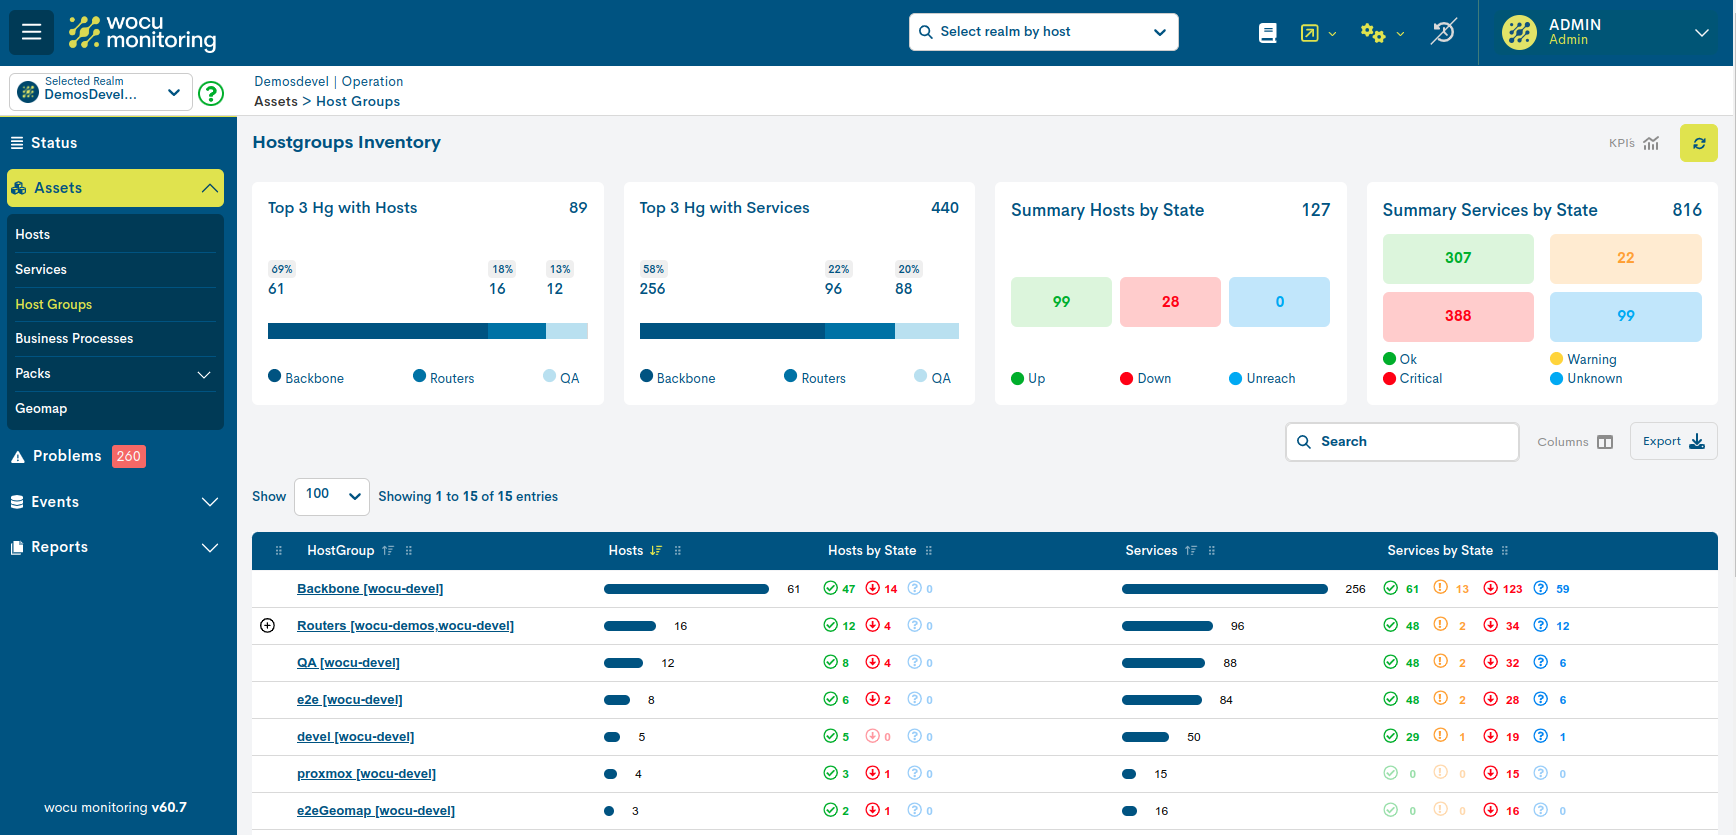
Host Groups Inventory
This section shows the complete list of Host Groups defined and managed in the selected Realm.
Remember
A Host Group is a logical grouping of certain Hosts that is made to extract statistics and availability data from the set more easily.
Host Group Inventory Fields
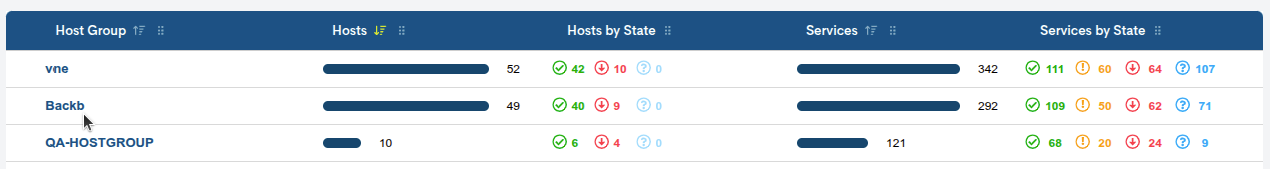
The fields that head the inventory are described below:

✓ Host Group: registers the formal identifier of the Host Group. It is determined by the value of the Display Name attribute, freely configurable if it has the appropriate permissions.
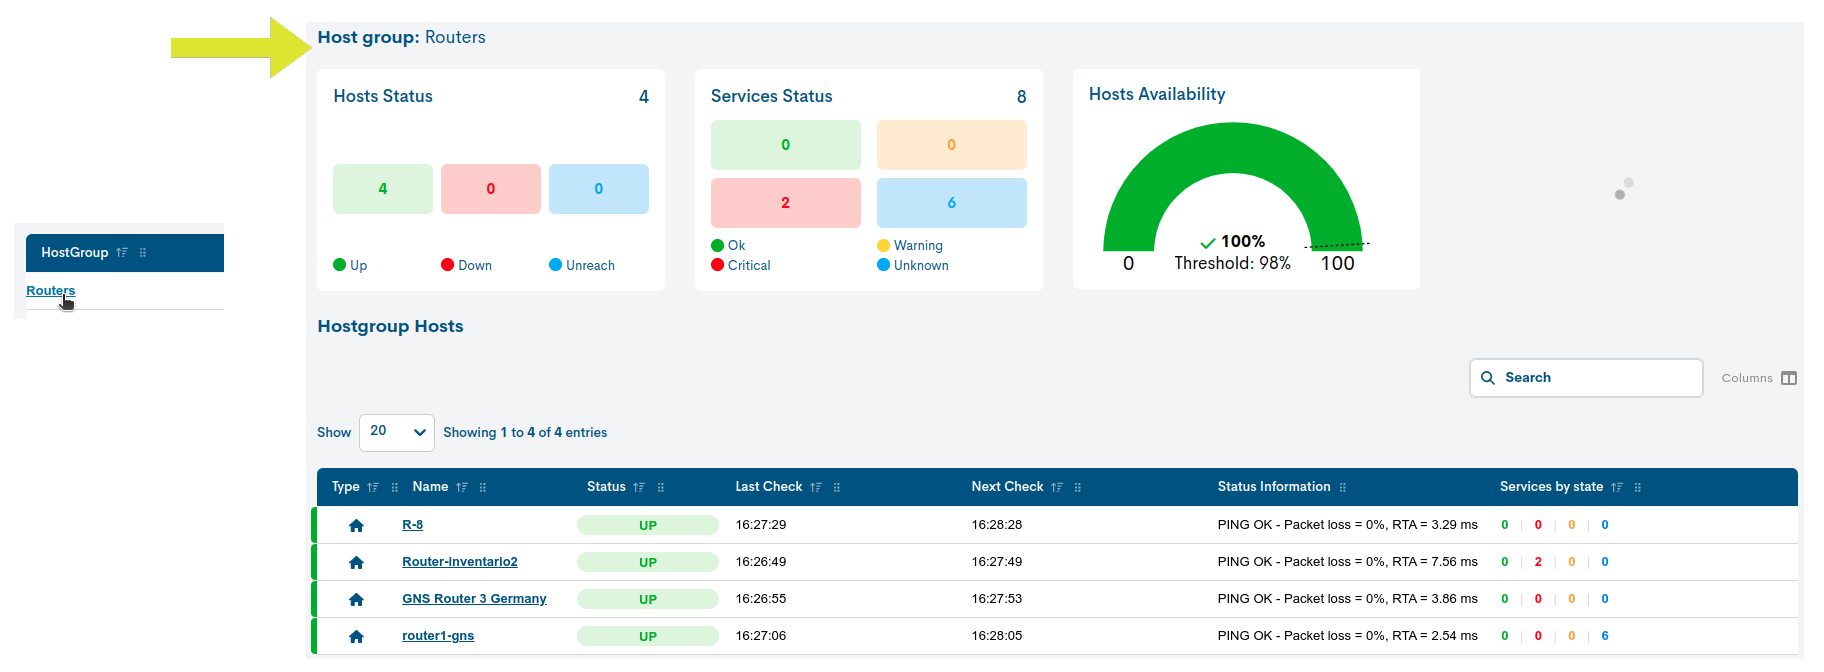
Clicking on the group name will take you to the corresponding Detailed view of a Host Group.
✓ Hosts: this column counts the total number of Hosts that constitute the group. The data is accompanied by a percentage bar. By sorting the column, you get a ranking of the Host Groups with more or less members in the Realm.
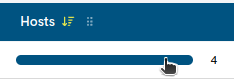
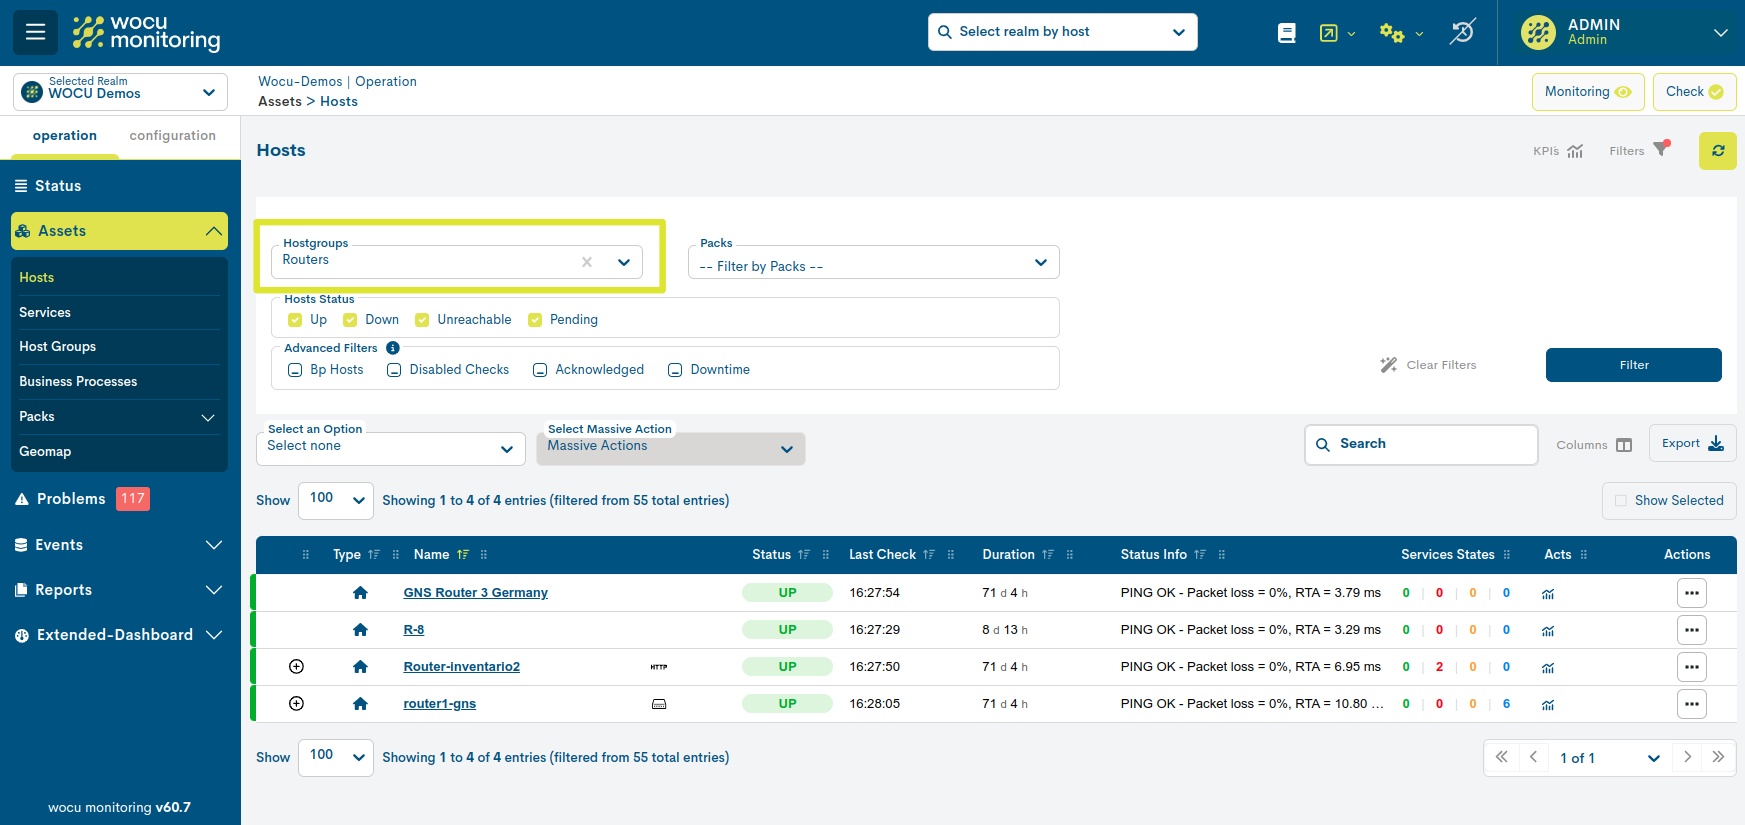
By clicking on the bar, the user is redirected to the updated Hosts Inventory, showing only the Hosts belonging to the selected Host Group, i.e. the table is filtered with the Hosts that are part of the group.
✓ Hosts by State: This field is a summary of the hosts (group members) classified by their different operational states.
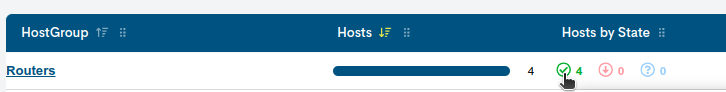
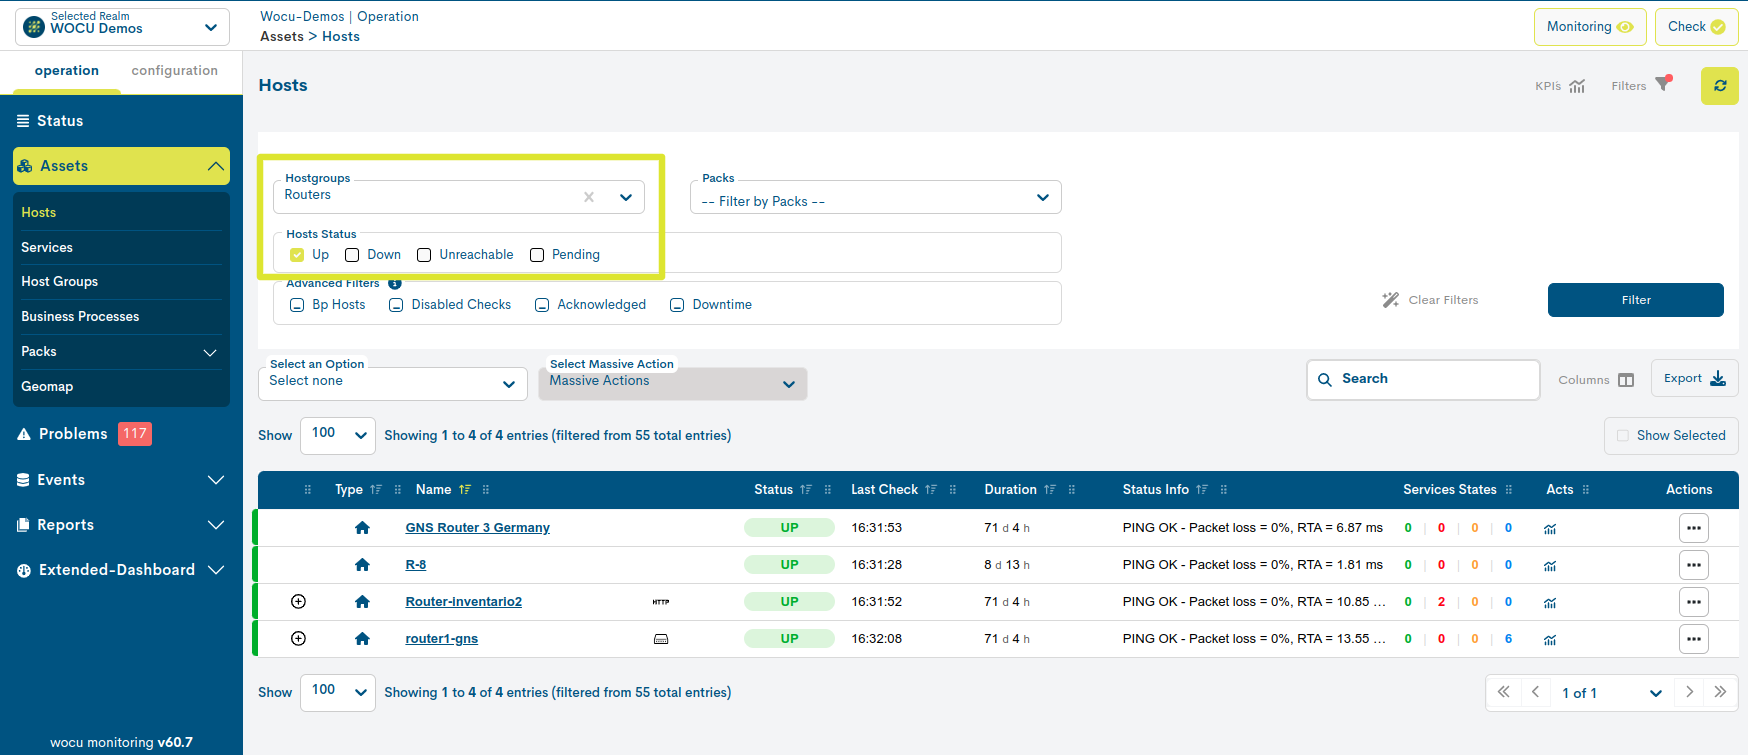
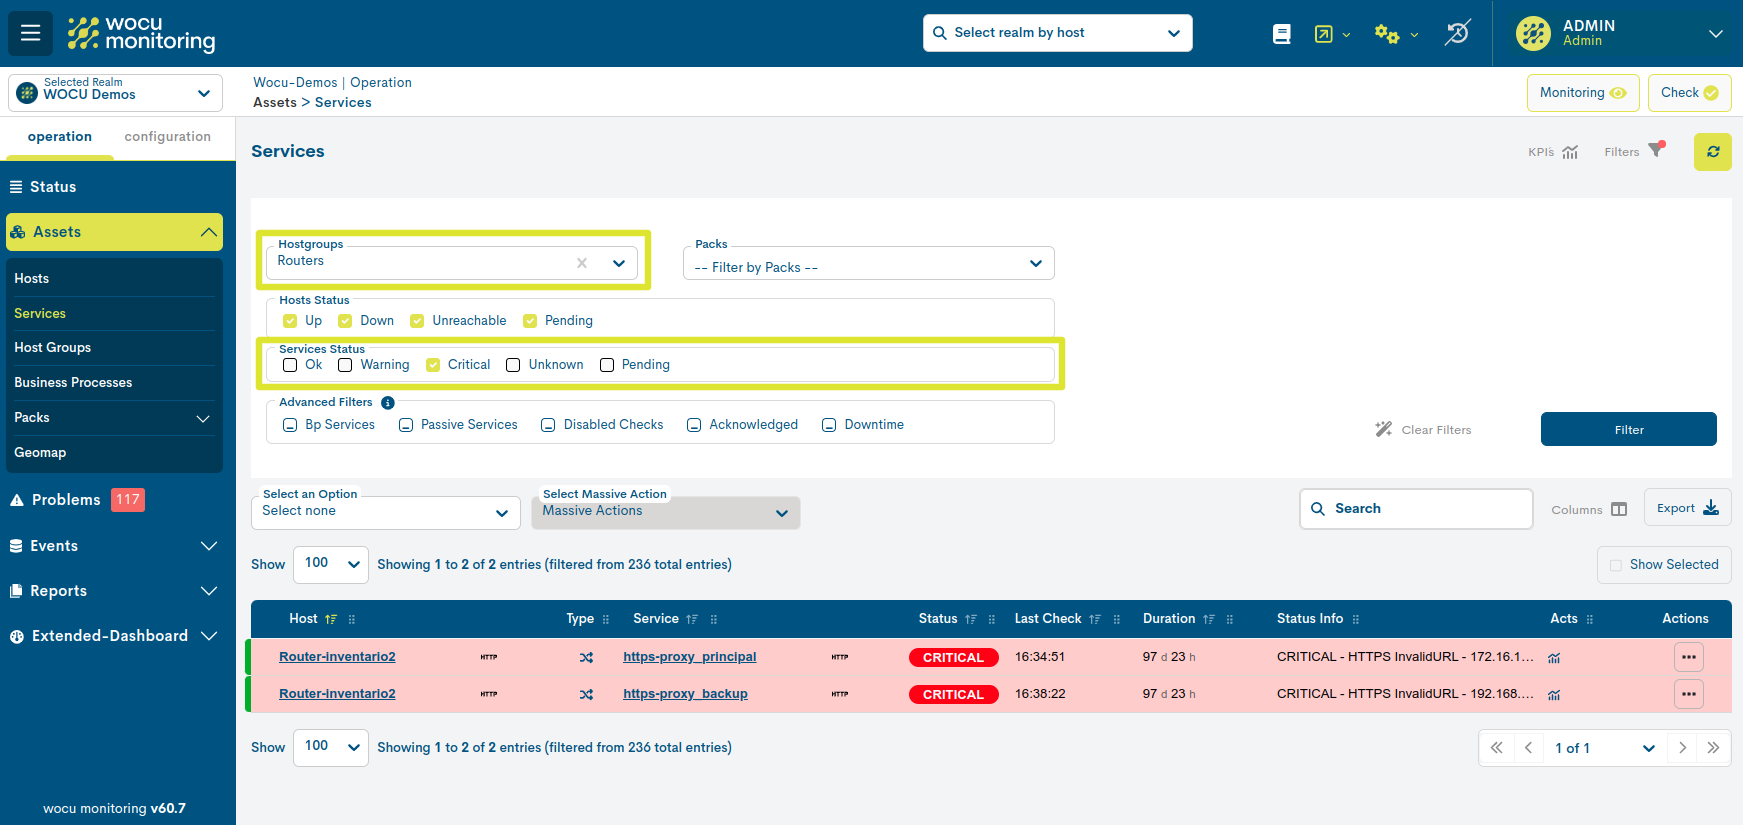
Like the previous bar, each status icon redirects the user to the updated Hosts Inventory, showing the filtered table with the Hosts members of the group, plus the selected availability status. The query is further refined by discriminating the rest of the elements, as shown in the following image:
Attention
This action shall be blocked in non-occurring monitoring states, i.e. whose value is 0.
✓ Services: this column counts the total number of Services that are associated to the Hosts that are members of the group. The data is accompanied by a percentage bar.

By clicking on the bar, the user is redirected to the updated Services Inventory, showing only the Hosts and associated Services belonging to the selected Host Group, i.e. the table is filtered with the Hosts and Services that are part of the group.
✓ Services by State: this field is a summary of the Services associated to the member Hosts of the group classified by their different operational states.

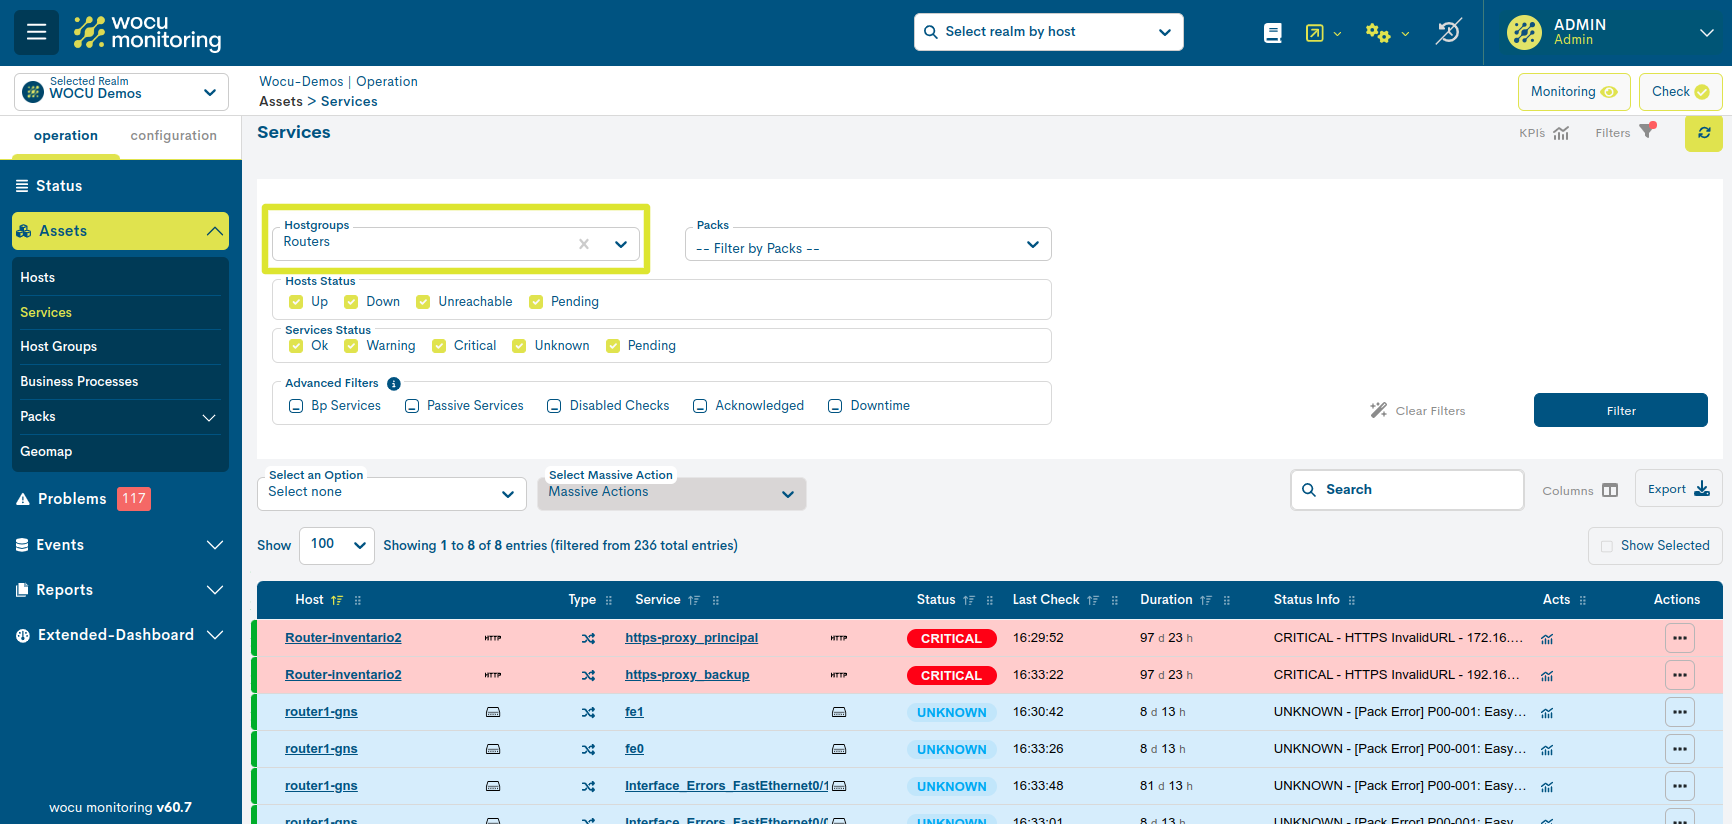
Like the previous bar, each status icon redirects the user to the updated Services Inventory, showing the filtered table with the Hosts and Services members of the group, plus the selected availability status. The query is further refined by discriminating the rest of the elements, as shown in the following image:
Remember
Although a Host Group itself does not have its own availability status, the system proceeds to determine and assign an overall status according to the percentage of Hosts that are members of the group that are active (Up).
The following monitoring state calculation method is implemented:
If more than
66%of the member Hosts are in Up, it is considered a Up state.If between
33 %and66 %of the member Hosts are in Up, it is considered a Unreachable state.If less than
33%of the member Hosts are in Up, it is considered a Down state.If finally there are no member Hosts in Up, a Pending state is considered.
Additionally, the status of the Host Group (as its own entity) can be known in the table according to the background colour of each of the rows of elements.
Each monitoring status is associated with an identifying colour. More information can be found at: Statements of Assets in WOCU.
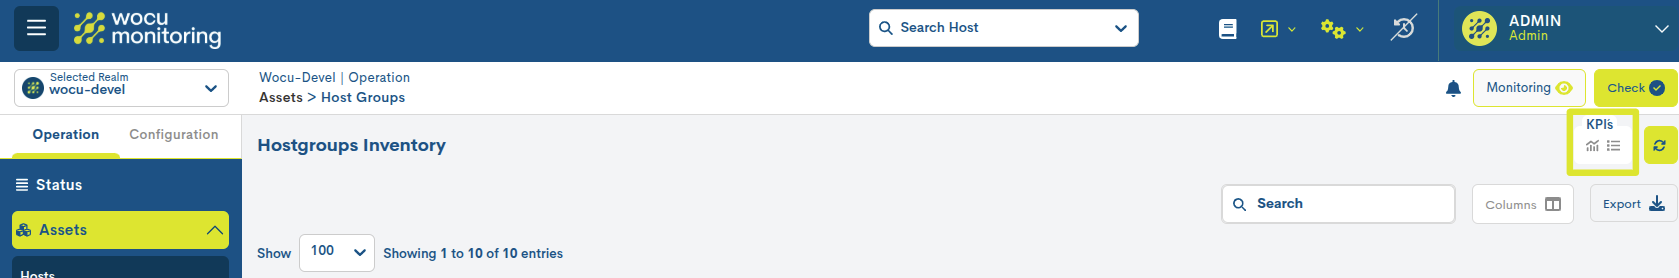
KPI`S
This space displays, by way of summary, a series of panels with key performance indicators and operational status of the assets present in the inventory.
KPIs can be viewed in two possible ways:
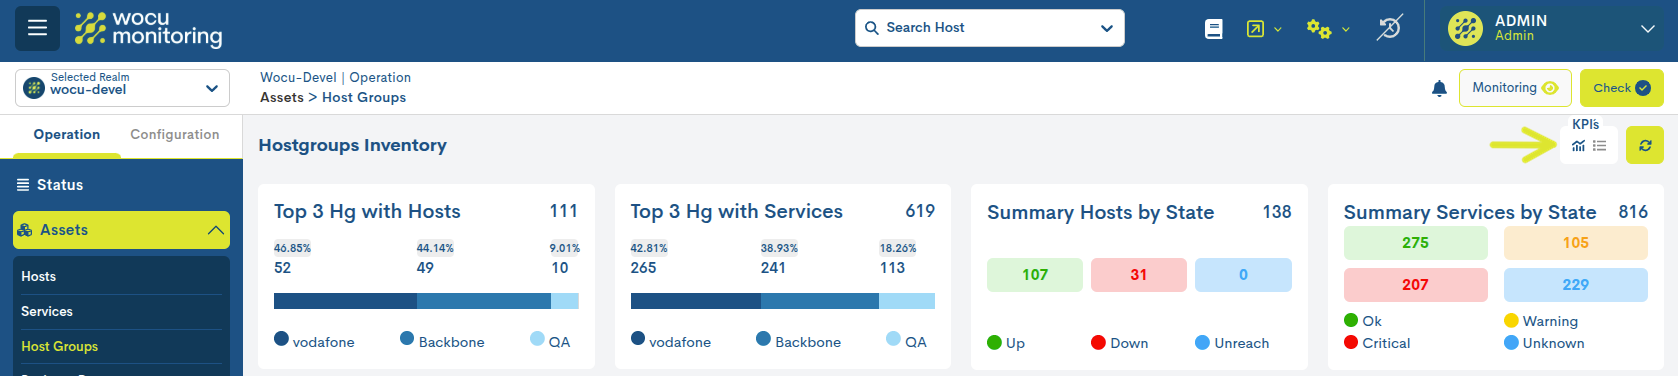
Full view
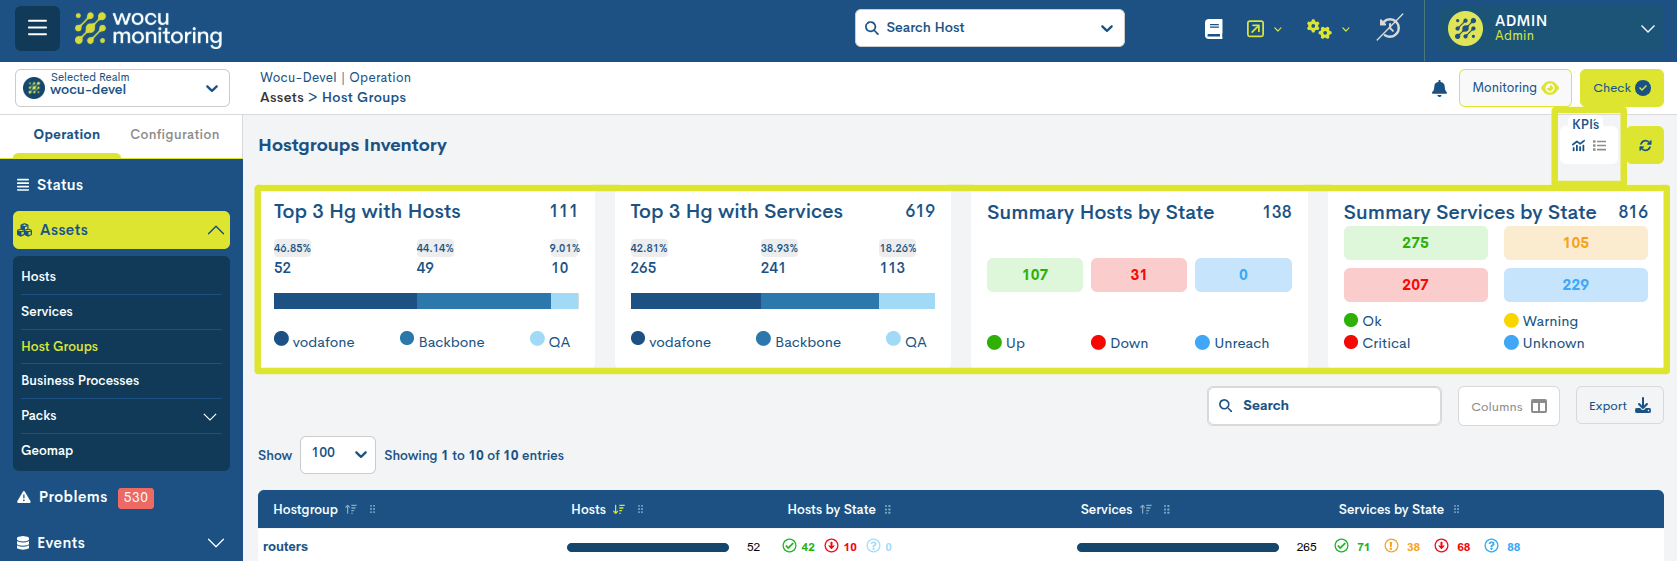
By activating the icon marked in the following image, the following KPIs are displayed with detailed data and interactive charts:
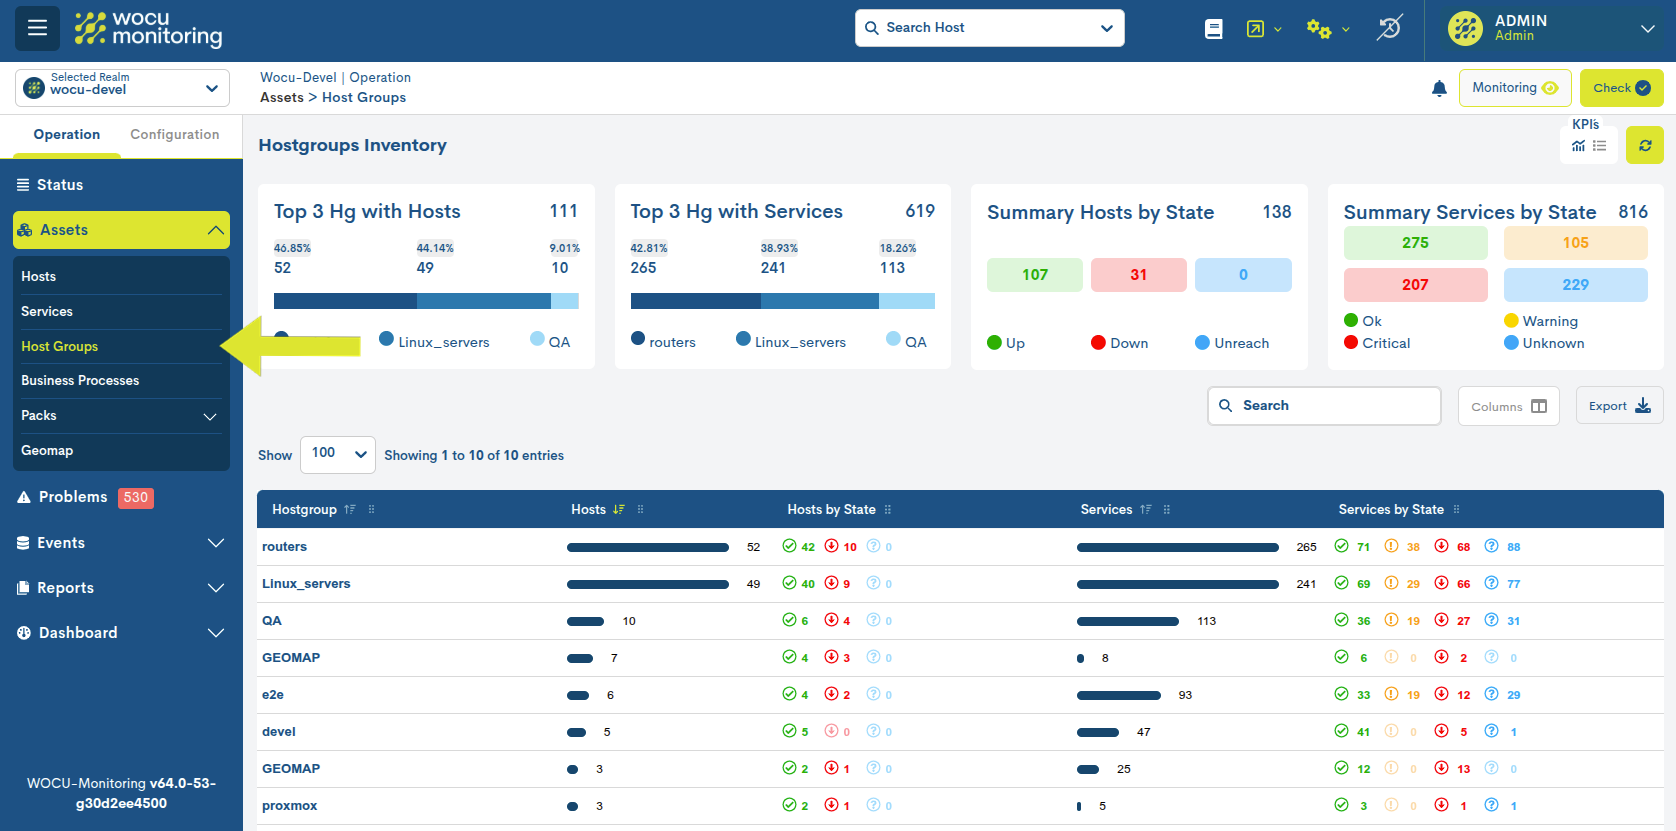
Top 3 Hg with Hosts
Ranking of the three Hostgroups with the highest number of devices in their interior.
According to the image above, 111 is the total number of devices among the three main groups. The routers group has the majority of devices, with 52 (46.85% of the total), followed by Linux_servers (44.14%) and QA (9.01%).
The bar chart visualizes the proportion of devices in each Hostgroup. Therefore, the routers group occupies the largest portion, followed by Linux_servers and QA.
Top 3 Hg with Services
Ranking of Hostgroups with the highest number of services inside.
According to the image above, 619 is the total number of service distributed among the three main groups.
The routers group has the highest number of services, with a total of 265, representing 42.81% of the total, followed by Linux_servers and QA.
The bar chart also visualizes the proportional distribution of services. Therefore, the routers group has the largest share, followed by Linux_servers and QA.
Summary Hosts by State
Inventory device count according to the current status of monitoring status. This information corresponds with the Hosts by state column.
Summary Services by State
Inventory service count according to the current status of monitoring current status.This information corresponds with the Services by State column.
Summary view
By activating the icon marked in the following image, the previous KPIs are displayed in a more compact format for quick reading:
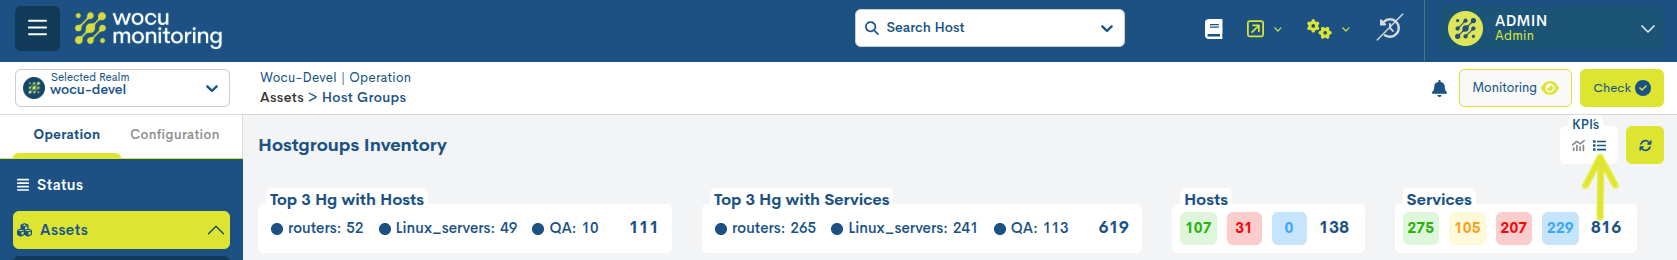
Likewise, it is possible to hide the panel block by toggling both buttons.
Exporting Host Groups from the inventory
Although WOCU-Monitoring offers a multitude of functions for the administration of data, metrics, graphs, etc., at some point it may be necessary to use other external tools to process this information. For this purpose, the export function is integrated, which facilitates the download of the inventory data in a file to the hard disk for further processing or use.
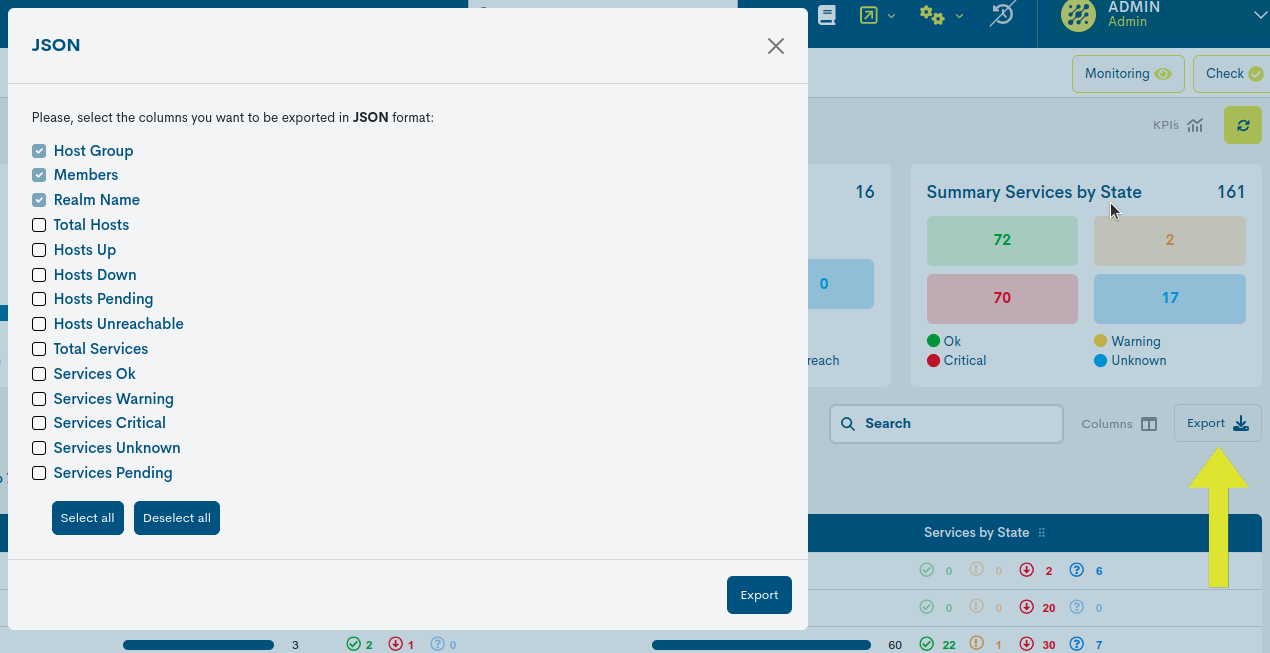
The two buttons next to the Search bar, CSV and JSON, facilitate the export of data in both formats:
CSV
Clicking on the corresponding button will open a new modal for the selection and marking of parameters to be exported at the user’s discretion. The available options are:
Host Group (Obligatory)
Members (Obligatory)
Realm Name (Obligatory)
Total Hosts
Hosts Up
Hosts Down
Hosts Pending
Hosts Unrepairable
Total Services
Services Ok
Services Warning
Services Critical
Services Unknown
Services Pending

JSON
This other option follows the same operation as the previous case, but initiates the download of a file in JSON (JavaScript Object Notation) format, a lightweight data interchange format capable of being read by any programming language and, therefore, used to exchange information between different technologies.
In both options, the system will offer the option to select the directory where to download and store the generated inventory file and to assign an alternative name to it. By default, the system assigns the following name:
assets_hostgroup_[nombre del reino]_00h-00min_dd-mm-aaaa y la extensión ``.csv`` o ``.json`` según la opción escogida.
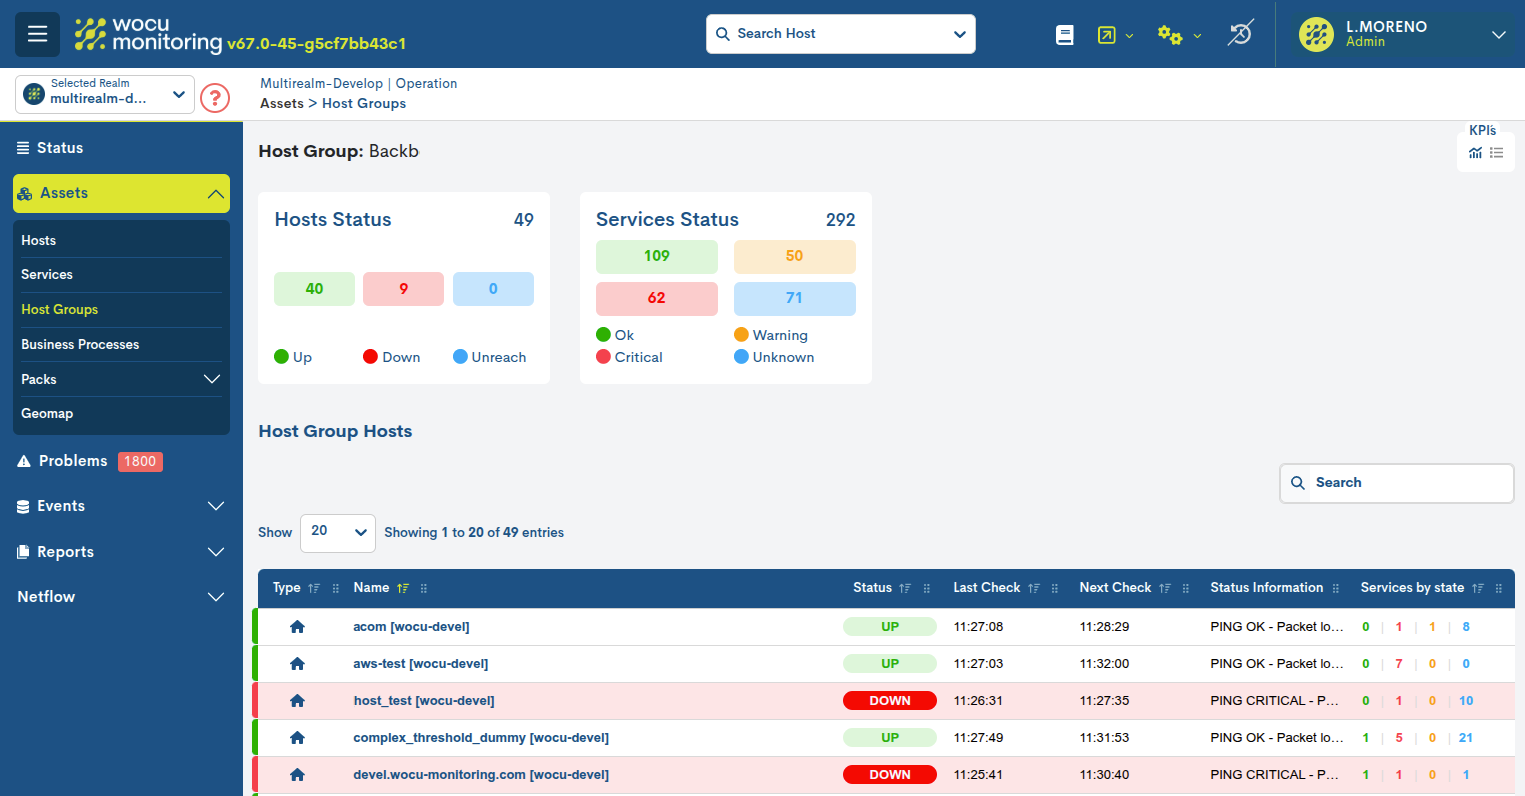
Multi-realm Hostgroup Management
Within Multi-Realm entities, Host Groups will follow a special casuistry, since WOCU-Monitoring allows a Host Group to have several associated Realms.
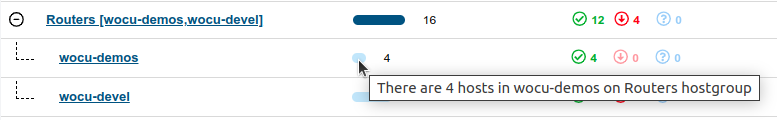
Unlike standard Realms, each list entry records a particular Hostgroup, followed by the Realm or Realms to which it is linked (enclosed in square brackets). Only Hostgroups with more than one Realm will display a button with the plus icon (+) inside it, which displays new sub-entries, one for each associated Realm.
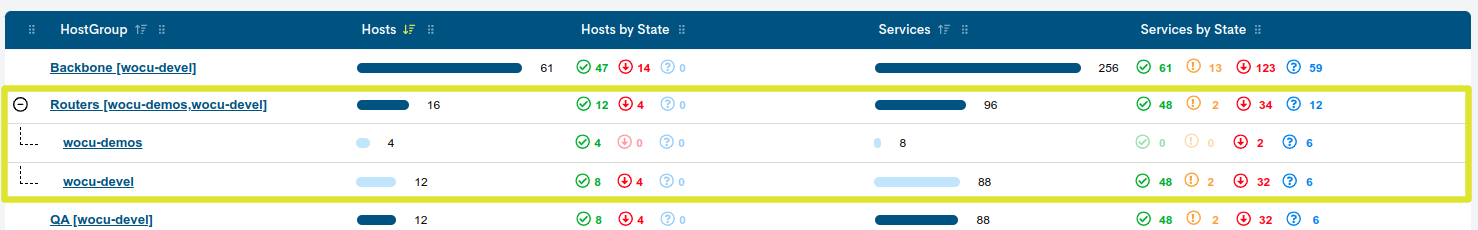
By placing the cursor over a percentage bar, the user will be able to consult the detail of the same through a pop-up text, where the total number of Hosts that constitute the Realm is counted.
Note
To retract the view repeat the action on the button (now with a minus sign inside) and the Realms will disappear from the list.
Access to their respective modes is facilitated by clicking on the name of a particular realm.
Next, you will access your Detailed view of a Host Group. This new view unfolds in a pop-up window located in front of the tab