Observability
The Observability module extends the capabilities of WOCU-Monitoring by utilising data stored in a backend based on Elasticsearch. This functionality enables users to query, analyse and contextualise the information associated with a monitored infrastructure, providing a more comprehensive view of asset behaviour, their metrics and the events generated on the platform.
Furthermore, the module incorporates an AI Assistant integrated into WOCU-Monitoring, designed to streamline the diagnosis of incidents relating to Hosts, Services and Problems. Using this feature, users can request assisted analyses, gain context on the status of monitored elements and continue their investigation via a chat-style conversation within the interface itself.
Configuring the Observability Realm
Manual configuration
Important
All configuration of spaces, keys and privileges described in the following stages must be carried out directly via the Elastic website or interface (Elasticsearch), as this procedure is native to that platform.
The configuration is based on three main elements:
Creating a Space in Elastic associated with the Realm.
Defining a custom role with permissions restricted to the Realm.
The generation of an API Key linked to those permissions.
The full process is set out below:
1. Access to the Observability project on Elastic
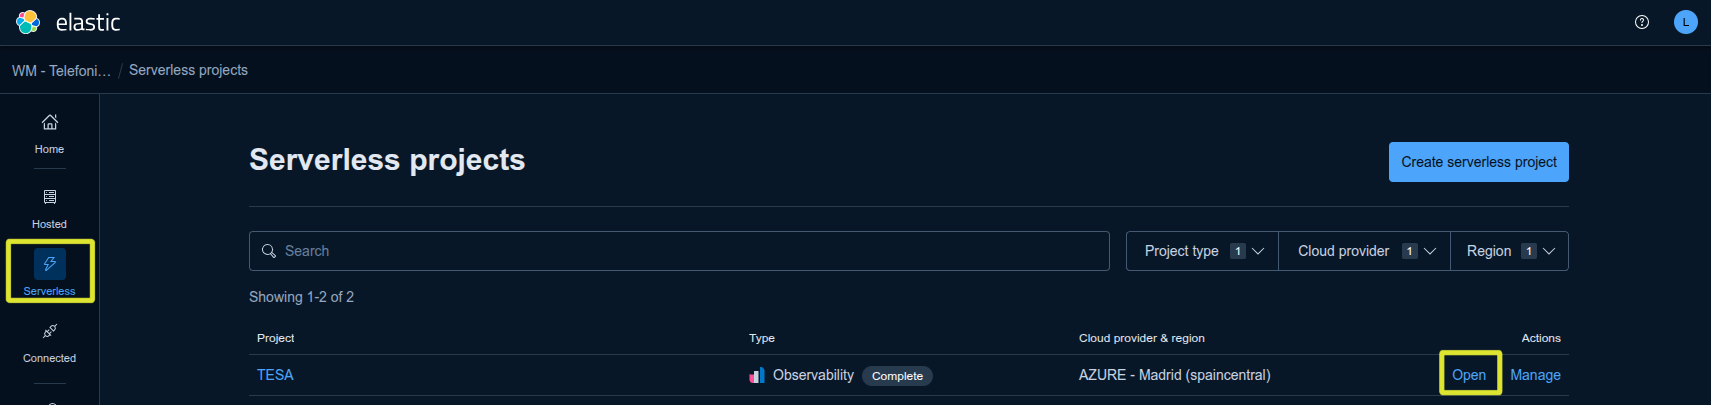
Go to the Elasticsearch interface and select the Serverless Project for observability set up by your administrator or Elastic owner.
Attention
Please check that you are in the correct environment before creating spaces, roles or API keys. This check is important to ensure that credentials are not generated in a project other than the one you will be using with WOCU-Monitoring
2. Creation of the Space associated with the Realm
The first step is to create a Space in Elastic for the Observability Realm.
To do this:
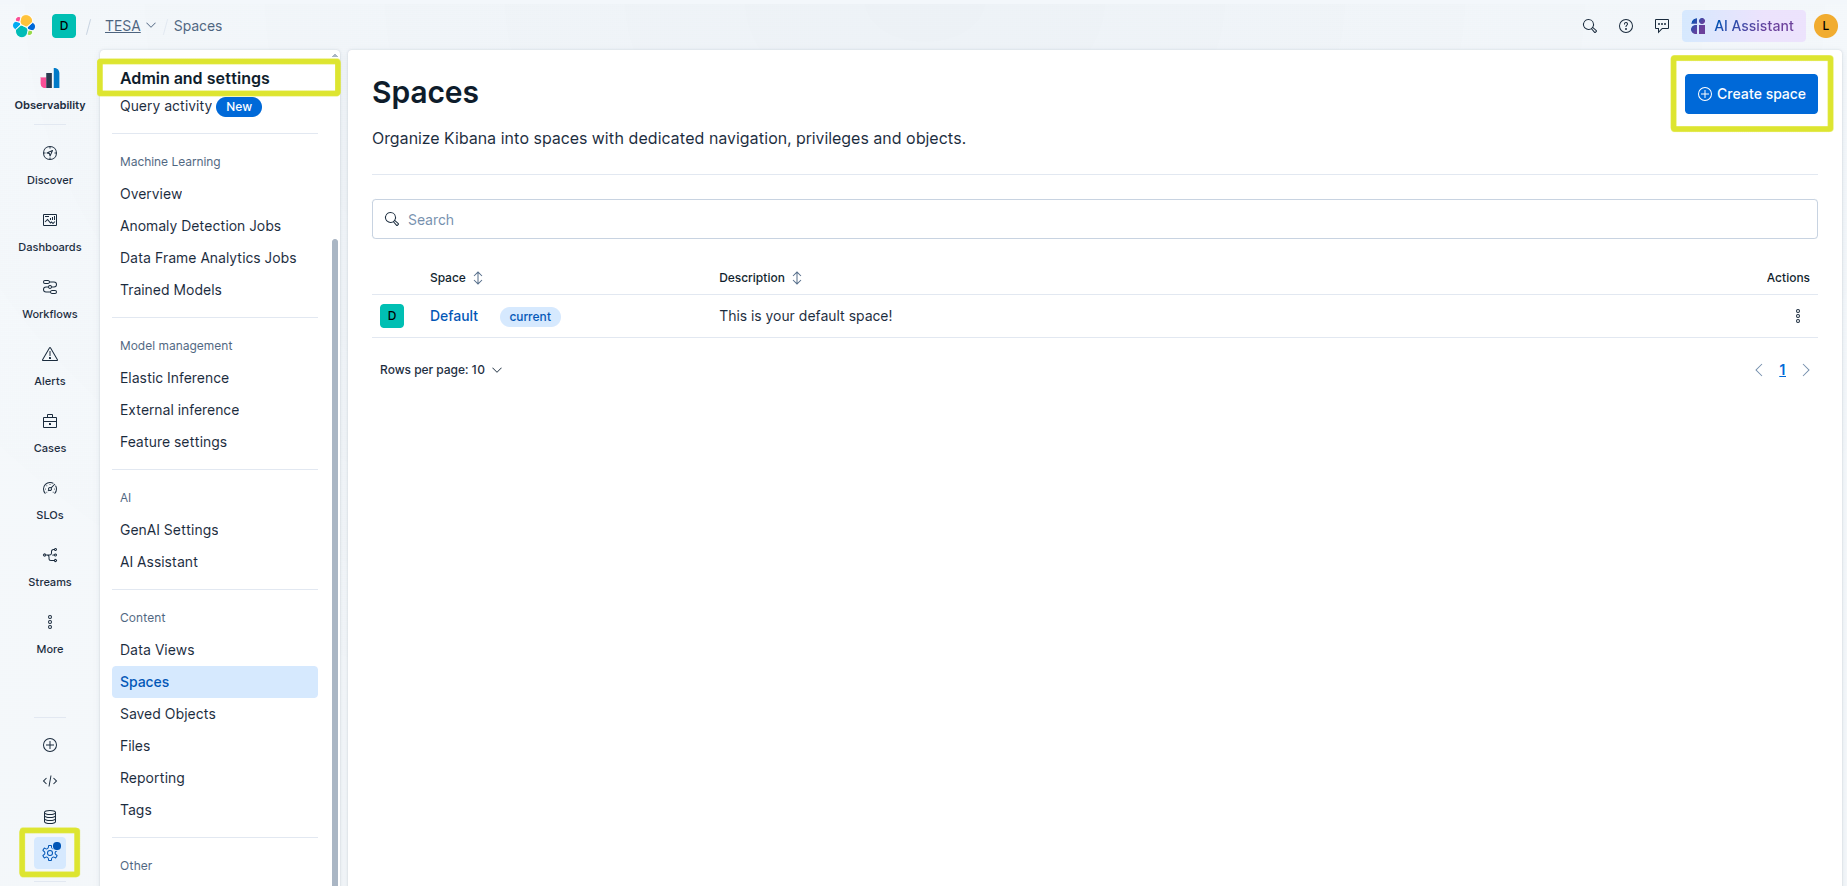
Open the side menu Admin and settings > Spaces.
Create a new space using the + Create Space option.
Next, configure the following fields in the creation form:
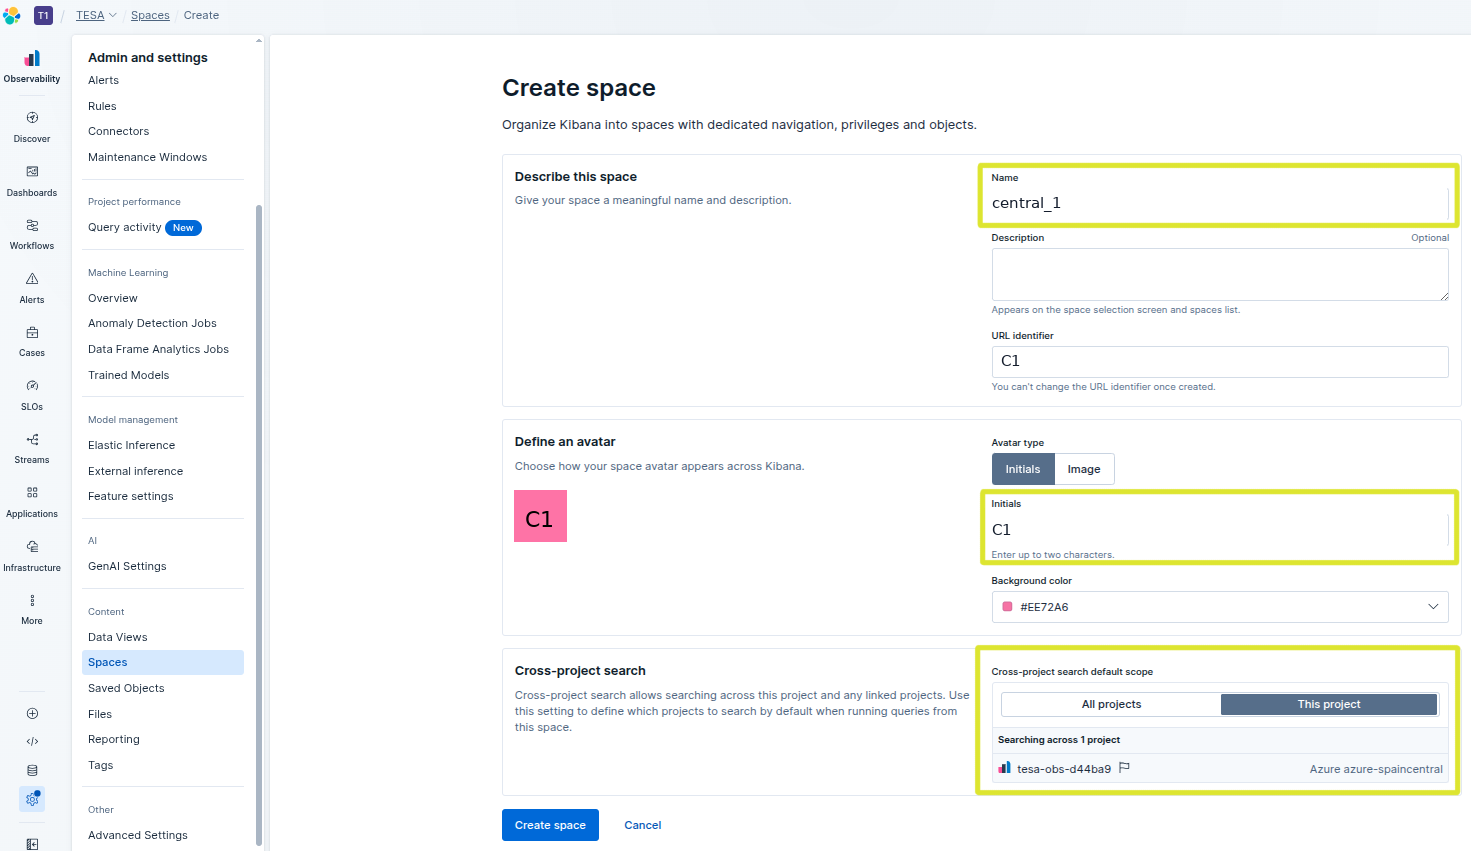
Name: enter a descriptive name for the Realm (e.g.
central_1). The name of the space must match the functional name of the Realm.Initials: enter a short term that will appear in the Space’s avatar box (e.g.
C1).Cross-project search: select the
This projectoption to limit searches to data from the current project only. This is the recommended option for keeping the focus on a single environment and optimising query performance.
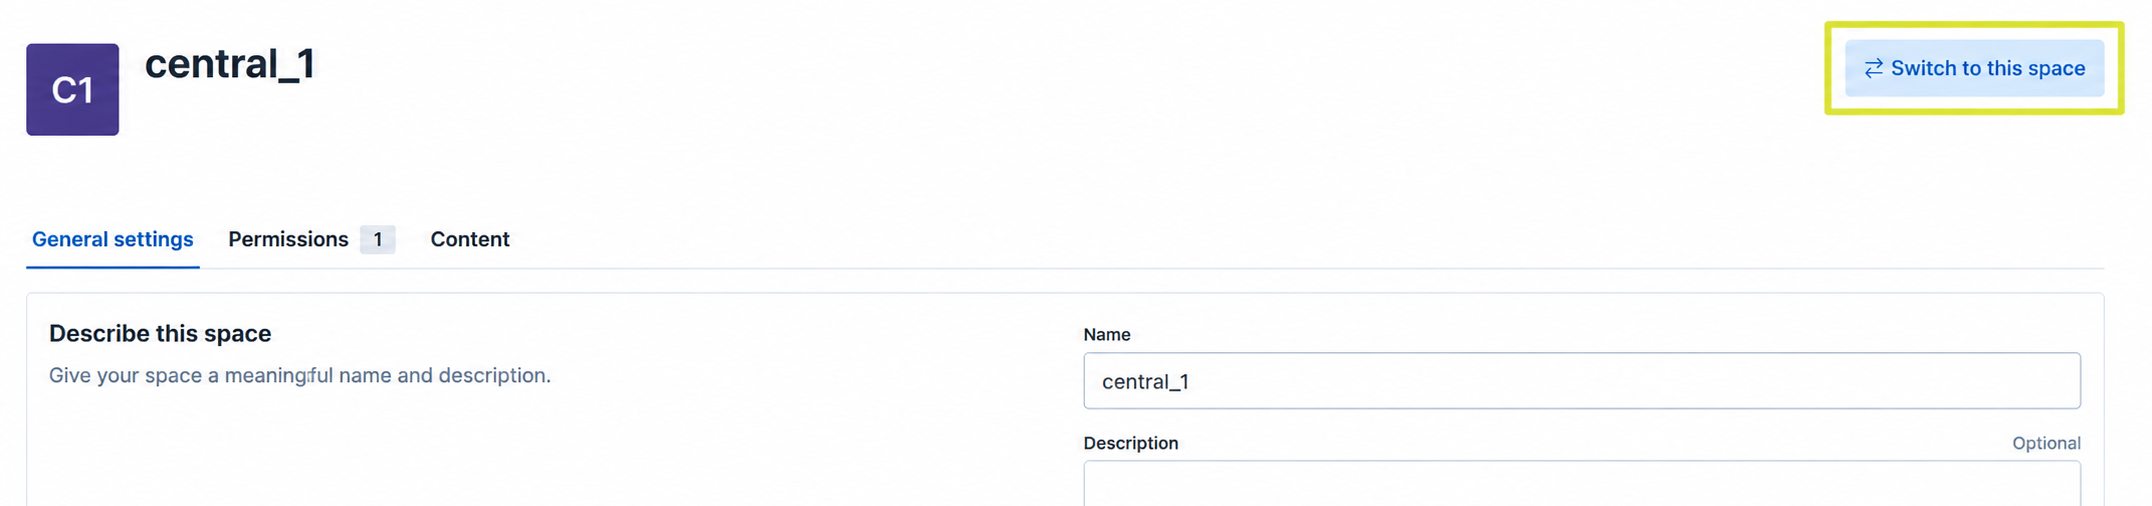
If this space is not your current workspace, click Switch to this space. When you do so, your Kibana session will automatically be redirected to the new space (central_1).
3. Creating a custom role
To avoid using credentials with global permissions, a custom role associated with the Realm must be created. This role acts as a permissions reference and allows access to be restricted solely to the necessary resources, such as metric indices, events or logs from the Realm and its corresponding Space in Kibana.
To do this:
Open the side menu Admin and settings > Custom Roles.
Create a new role using the + Create role option.
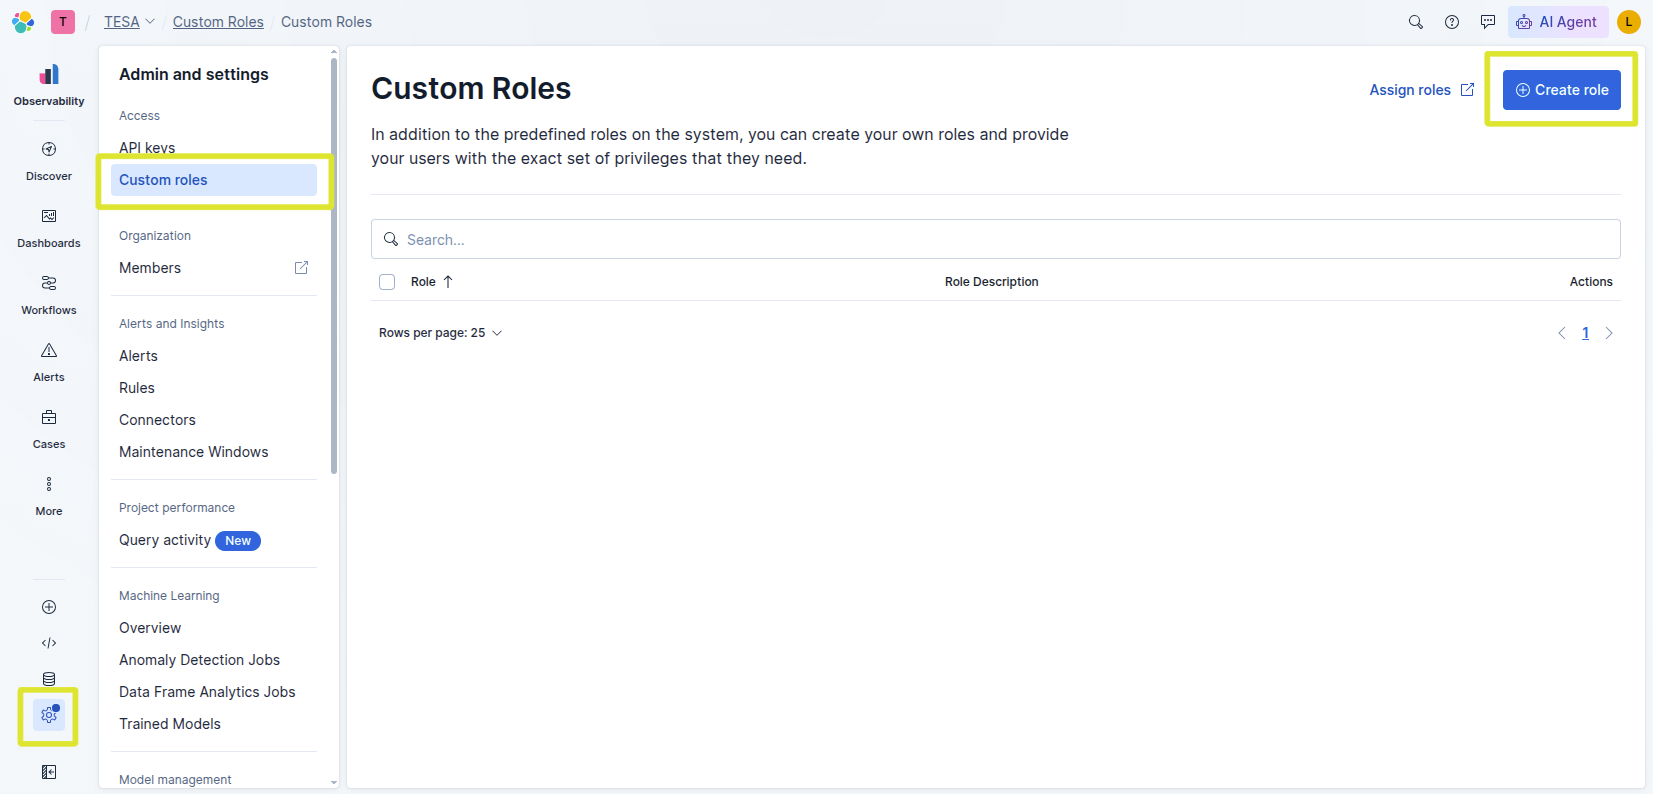
The role’s identifying details must be configured at the top of the creation form:
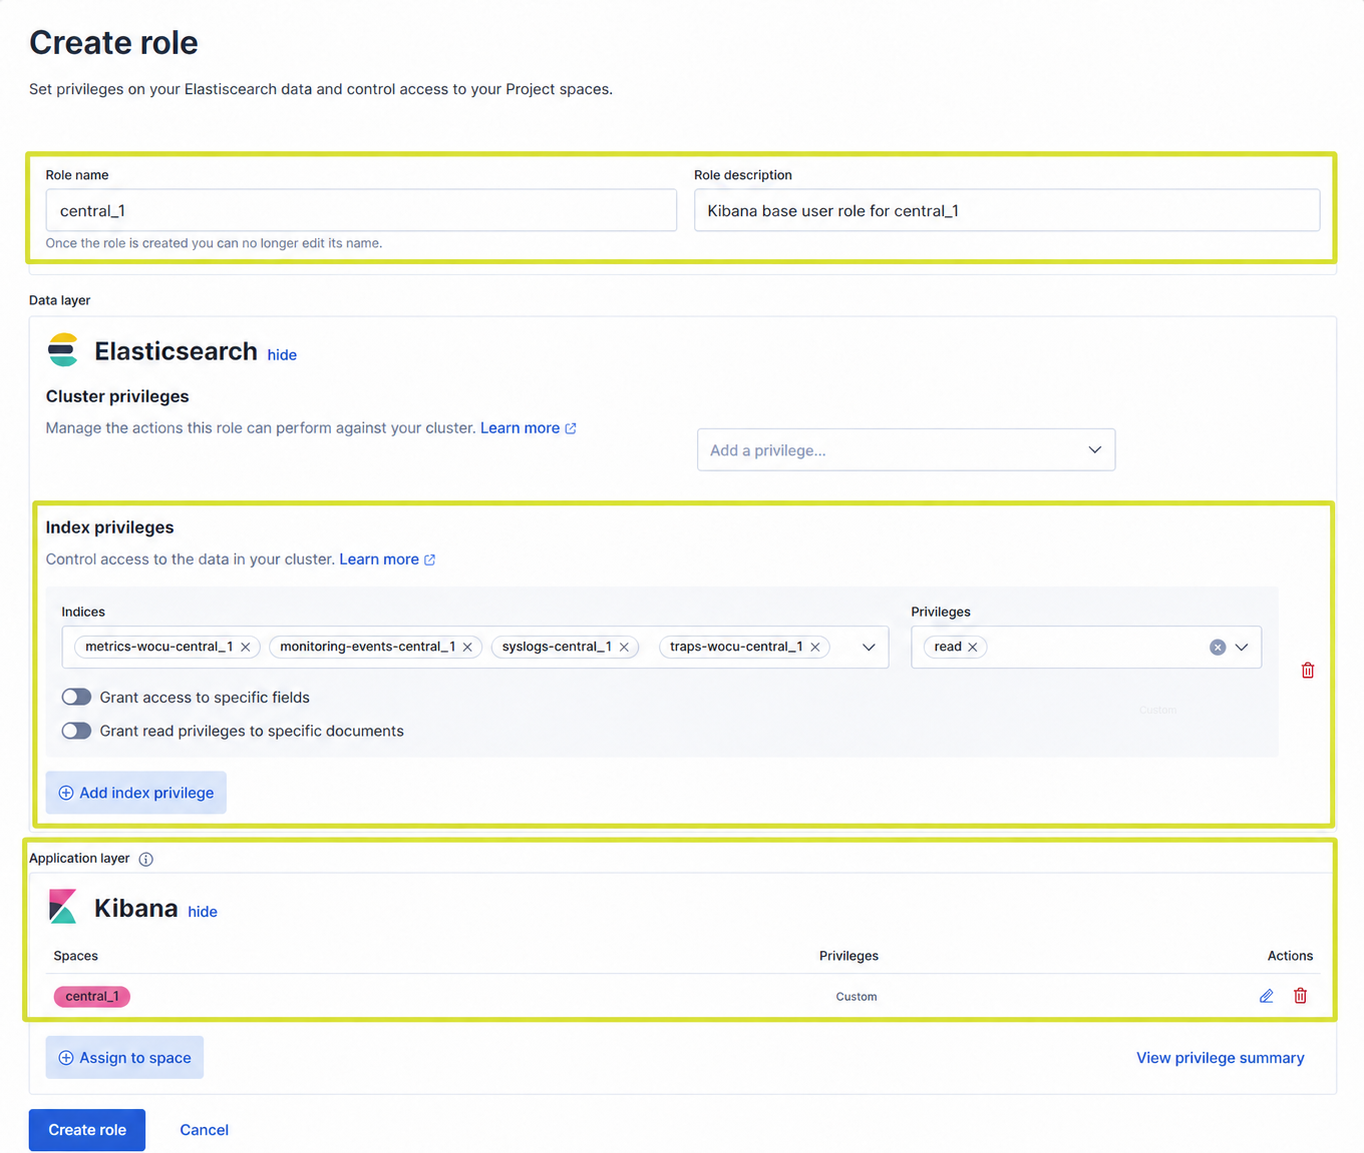
Role name: the unique name of the role. This cannot be changed once it has been created. It is recommended that you use a consistent naming convention that includes the realm identifier (e.g.
central_1).Role description: a functional description of the role. This field helps to identify the purpose of the role within Elastic (e.g.
Kibana base user role for central_1).Data Layer: this section defines the access permissions for data stored in Elastic.
Index privileges: the indexes associated with the Realm must be specified. These indexes define the data that the role will be able to query. For a Realm with the identifier
central_1, the indexes to be configured would be:metrics-wocu-central_1 monitoring-events-central_1 syslogs-central_1 traps-central_1Privileges: the read permission must be assigned. This permission allows the user to view metrics, events and logs for the Realm, without granting write or administrative access to the indices.
Grant access to specific fields and Grant read privileges to specific documents must remain disabled, unless additional filtering by fields or documents is required.
Application Layer: this section defines which Space and features the role will have access to within Kibana.
Spaces: select only the Space associated with the Realm (e.g.
central_1). It is not recommended to assign the role to all Spaces, as this would compromise the isolation between Realms.Privileges: select the Custom option to assign only the necessary permissions. As a general rule, the role should grant read access to the features required to view the Realm’s observability data, whilst avoiding administrative permissions.
Once you have configured the fields above, click Create role to save the new role.
4. Creating the API key
The API Key enables WOCU-Monitoring and its components to connect securely to Elastic in order to read and write observability data from the Realm, such as metrics, events, syslogs or traps.
Using it avoids the need to rely on global credentials or personal user accounts, and allows access to be restricted solely to the indexes and resources associated with the Realm.
To do this:
Open the side menu Admin and settings > API KEYS.
Create a new API using the + Create API key option.
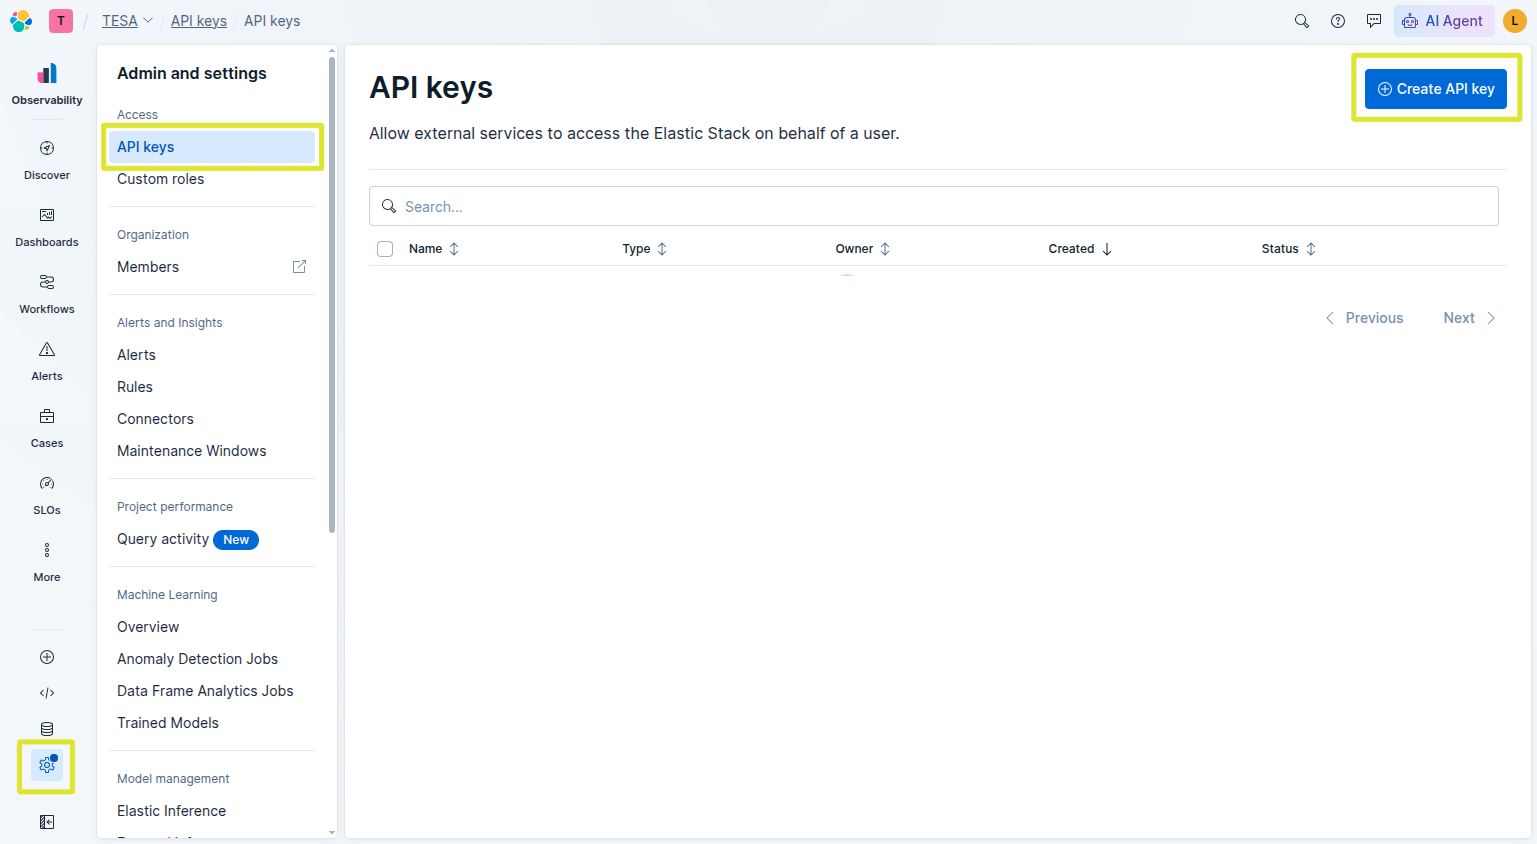
In the creation form, configure the fields:
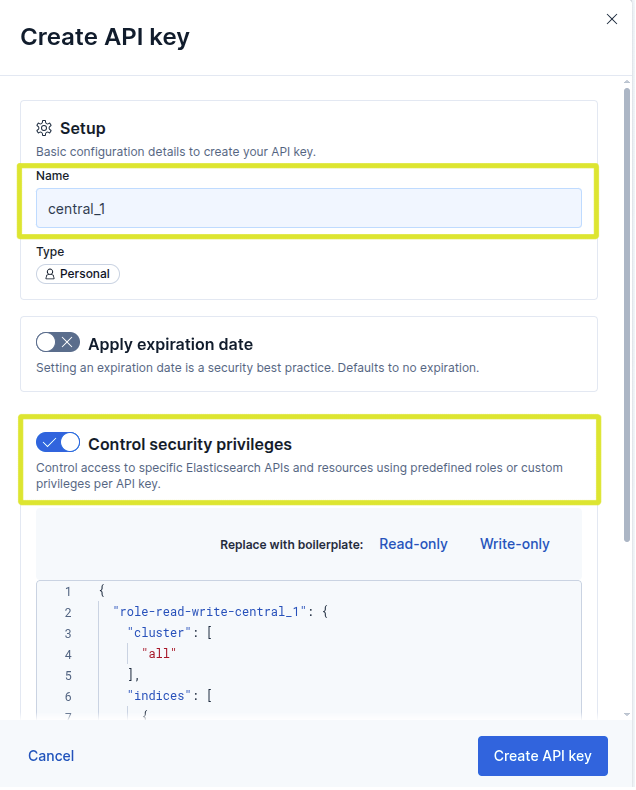
Name: a descriptive name for the new API (e.g.
central_1). It is recommended that a consistent naming convention be used, including the Realm identifier.Control security privileges: this option is used to limit the scope of the key. When enabled, Elastic will display a JSON editor where you can define the specific privileges that the API key will have.
Copy and edit the following JSON code in the editor to assign write permissions and define the indexes for your Realm.
Attention
You must replace [realm name] with your Kingdom’s actual identifier.
{
"role-read-write-[nombre del reino]": {
    "cluster": [
    "monitor_inference"
    ],
    "indices": [
    {
        "names": [
        "monitoring-events-[nombre del reino]",
        "metrics-wocu-[nombre del reino]",
        "syslog-[nombre del reino]",
        "flexwan-[nombre del reino]",
        "traps-[nombre del reino]",
        "import_tool_cache_conf_hosts",
        "import_tool_cache_conf_hostgroups",
        "import_tool_cache_realms_info",
        ".ml-anomalies-wocu-ml-job-[nombre del reino]",
        "*[nombre del reino]*",
        "task_summaries",
        "livestatus_evolution"
        ],
        "privileges": [
        "read",
        "write",
        "create_index",
        "view_index_metadata"
        ],
        "allow_restricted_indices": false
    }
    ],
    "applications": [
    {
        "application": "kibana-.kibana",
        "privileges": [
        "feature_agentBuilder.all",
        "feature_actions.read"
        ],
        "resources": [
        "space:[nombre del reino]"
        ]
    }
    ],
    "run_as": [],
    "metadata": {},
    "transient_metadata": {
    "enabled": true
    }
}
}
Once you have edited the JSON, click the Create API KEY button.
Permissions required by the AI Assistant (Elastic Agent Builder)
The IA Assistant uses the Elastic Agent Builder API, which requires an Enterprise license and, at minimum, Elastic Stack 9.3.
The Realm API Key must include the application privilege feature_agentBuilder.all on kibana-.kibana, as shown in the JSON above.
The read level is sufficient for conversations, but the internal consumption accounting uses an API that Kibana authorizes with the manageAgents privilege, which is included only in feature_agentBuilder.all``(empirically verified: with ``read it returns 403 indicating agentBuilder:manageAgents).
On the other hand, feature_agentBuilder.all also grants permission to create, edit and delete agents and tools. For this reason, the example restricts the application privilege to the Realm Space using "resources": ["space:[realm name]"]; using ["*"] would extend it to all Kibana Spaces and is not recommended. If your Kibana version exposes the manage_agents sub-privilege independently, you can replace feature_agentBuilder.all with ["feature_agentBuilder.read", "feature_agentBuilder.manage_agents"]; validate it against your deployment before applying it in production.
Availability depending on the Elastic version:
Stack 9.4 or later: Agent Builder is the default chat experience. No additional action is required.
Stack 9.3: Agent Builder is available as a preview and must be manually activated from the Kibana chat experience selector. If it is not activated, calls to
/api/agent_builder/*are unavailable even if the API key has the correct privileges. In 9.3, chat works, but consumption accounting (POST /api/agent_builder/agents/{agent_id}/consumption) is unavailable: WOCU-Monitoring skips time synchronization, and AI Assistant usage and cost reports are incomplete.**Consumption accounting requires Stack 9.4 or higher (or Serverless).**Serverless: is enabled by default.
Stack 9.2 or earlier: not supported.
Without this privilege, all calls to /api/agent_builder/* return 403 Forbidden and the AI Assistant does not work, even though the Realm’s other observability features continue to operate normally.
Additionally:
The example role does not grant generic cluster privileges(
"cluster": ["all"]would grant all cluster privilegesand is not required for WOCU-Monitoring). It only includesmonitor_inference, which is only needed if the agent uses an AI connector that invokes the Elasticsearch Inference API (for example, connectors managed by Elastic); otherwise, you can leave the cluster list empty.The agent’s tools require
readandview_index_metadataon the indexes they query. Both are included in the Realm’s index block.The
feature_actions.readprivilege is required to list the available inference connectors (/api/actions/connectors). Read access is sufficient: WOCU-Monitoring only queries the list; it does not create or modify connectors.The AI Assistant’s internal consumption accounting (periodic task of WOCU-Monitoring) queries
POST /api/agent_builder/agents/{agent_id}/consumption, available from Stack 9.4 (and in Serverless). Although it is a read operation, Kibana authorizes it with the privilegeagentBuilder:manageAgents, so the Realm API Key needsfeature_agentBuilder.all. In Stack 9.3 and in deployments without an available Agent Builder, the collection is automatically skipped.In deployments created before the migration to Agent Builder, the role granted
feature_observabilityAIAssistant.alland privileges on the internal index.kibana-observability-ai-assistant-conversations*. Both are deprecated: conversations are now handled by the Agent Builder API and not by direct access to the index. When updating an existing API Key, replace the old privilege withfeature_agentBuilder.all, remove the block from that index, and reduce``feature_actions.all`` tofeature_actions.read.
5. Obtaining the Token
The platform will generate the key in three output formats: Encoded, Beats and Logstash.
Select and copy the token in Encoded format and make a note of this value for now, as it will be used in the next section, specifically in the variable
ELASTICSEARCH_API_KEY.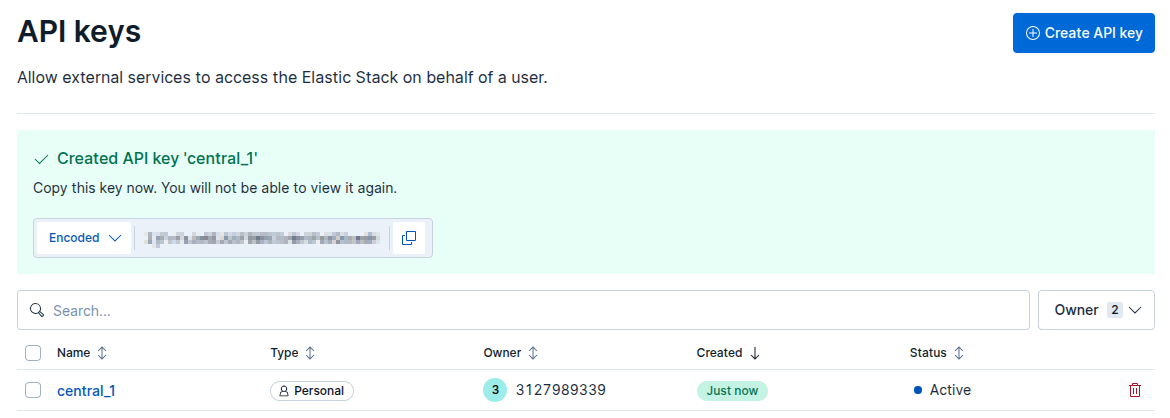
Optionally, you can also select the Beats and Logstash formats, required for Fluentd and TD-Agent configuration.
6. Realm Variable Settings
Once you have retrieved the data from Elastic, open the Realm configuration file and enter the following mandatory environment variables:
Important
The variables must be validated using the configuration specified by the engineering team for each deployment.
Server and Ingest Variables (Section: Monitoring)
LOGGER_SERVER: The public Elasticsearch endpoint associated with the project.LOGGER SERVER="endpoint"The value of the variable is retrieved from the Elastic console by accessing the relevant Serverless Observability project.
The path is as follows: Serverless projects > [project_name] > Overview
Next, locate the Application endpoints, cluster and component IDs section and select the Elasticsearch option.
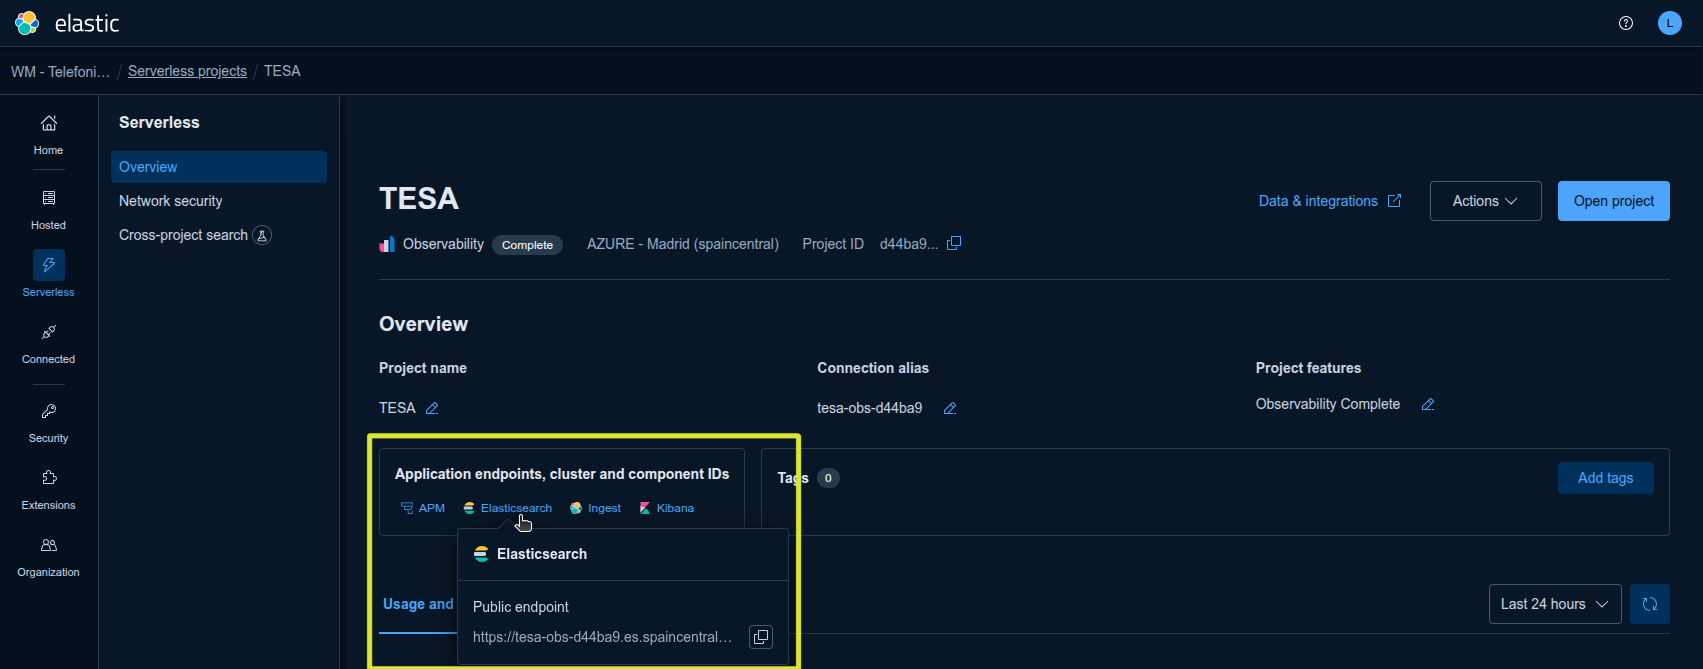
METRIC_SERVER: Metrics server (same value as inLOGGER_SERVER).METRIC_SERVER="endpoint"
ELASTICSEARCH_API_KEY: Authentication key copied in Encoded format (Step 5: Obtaining the token). Connects the system for reading and writing metrics, events and notifications.ELASTICSEARCH_API_KEY="clave de autenticación"Other Mandatory Configuration Variables
ELASTICSEARCH_SERVERLESS_MODE: Mandatory mode for serverless environments (always enabled).ELASTICSEARCH_SERVERLESS_MODE="True"
GCONF_ENABLED: Enables the Gconf service (always active).GCONF_ENABLED="True"
GCONF_SERVICES_HOST: Access URL for the provided configuration machine. It must be specified including the protocol, IP address, and corresponding port.GCONF_SERVICES_HOST="https://[IP]:[PORT]"
MYSQL_SERVER: IP address of the central database provided.MYSQL_SERVER="IP"
MYSQL_USER: Add the name of the realm as appropriate.MYSQL_USER="nombre_reino"
MYSQL_ROOT_PASSWORD: Database access password (same as the realm name).MYSQL_ROOT_PASSWORD="nombre_reino"
Note
For distributed infrastructures, authentication is also required from ProxySQL.
7. Creating an Observability Realm in WOCU-Monitoring
Finally, the observability_module module is enabled from the itself creation form of a realm, configured with the Elasticsearch backend.
To create a new standard monitoring realm, access the Settings menu and click the + New Realm button, as shown in the following image:
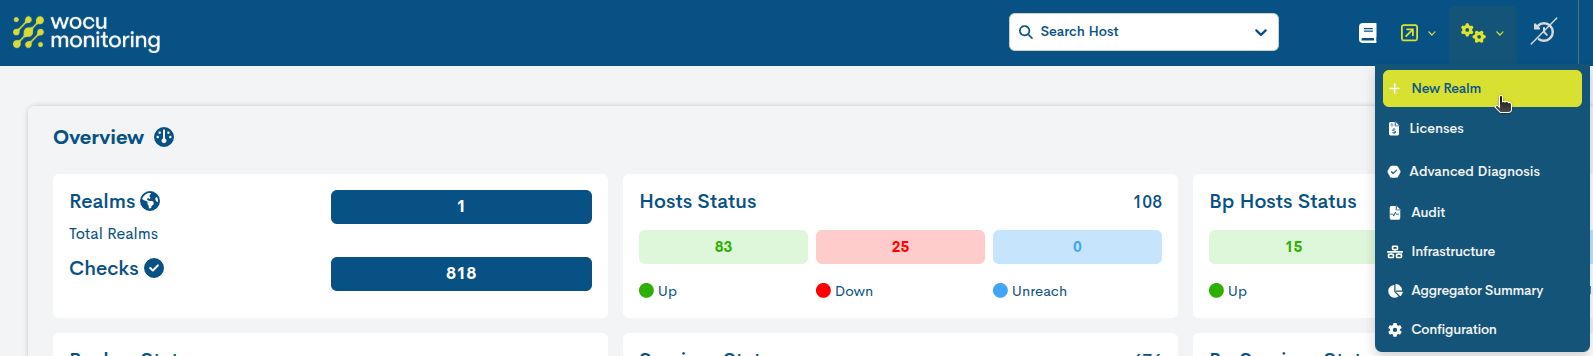
This action will open the Realm creation form. Next, the fields described in the following sections must be configured:
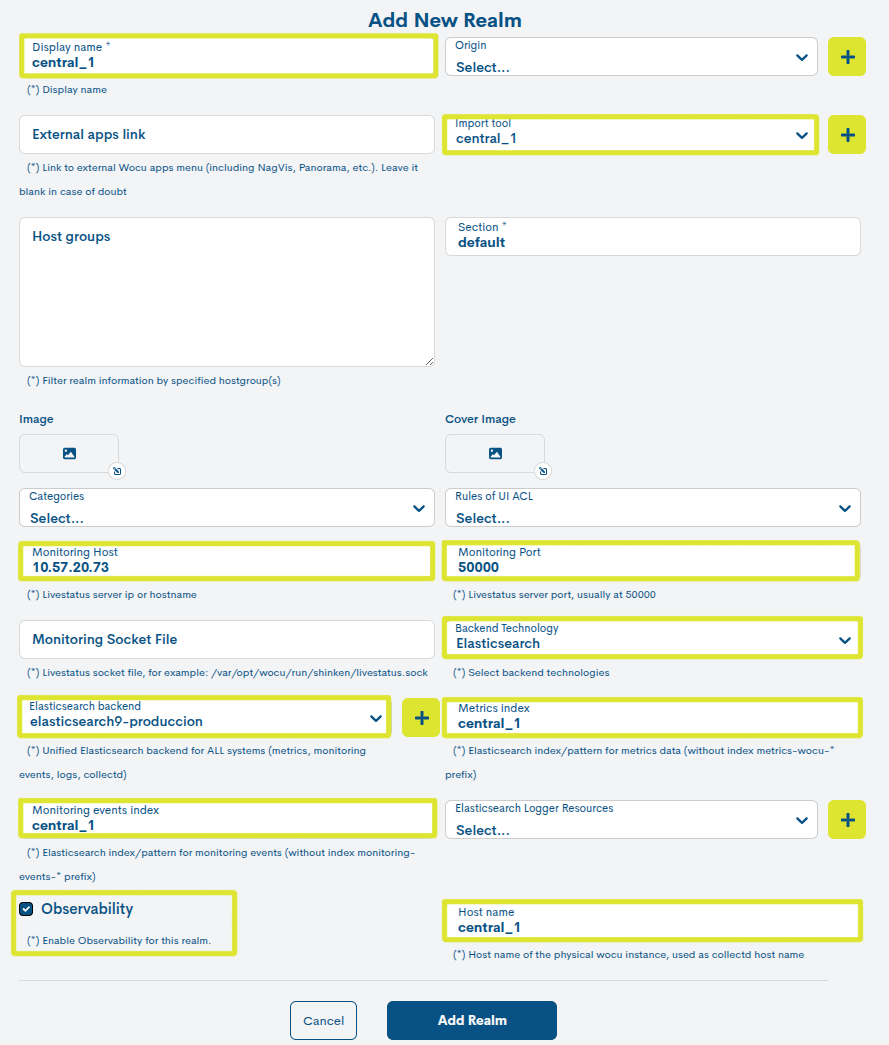
Display Name: add the Realm name (e.g., central_1).
Import Tool: to add an initial Import Tool, activate the + function next to the field.
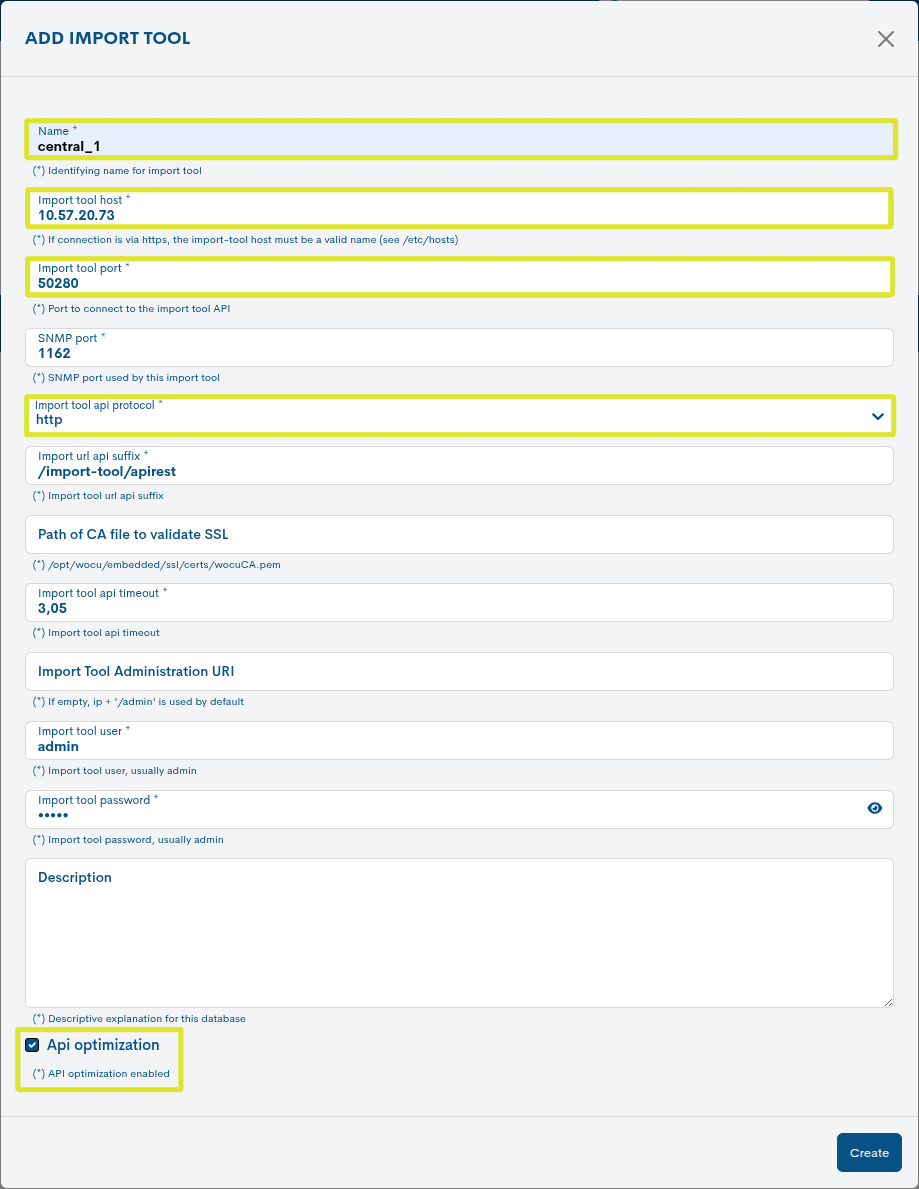
The fields that must be modified to set up a new Import Tool are:
Name: add the name of the Realm (e.g.,
central_1).Import tool host: IP address or hostname where the Import Tool is hosted (e.g.,
10.57.20.73).Import tool port: connection port for the Import Tool API (e.g.
50280).Import Tool API Protocol: protocol used by WOCU-Monitoringto connect to the Import Tool API. Select the
httpoption from the drop-down menu.API Optimization: check the box to enable optimization of queries made against the Import Tool API.
Next:
Confirm the changes made using the Create button
Select the new Import Tool from the drop-down menu to continue.

Monitoring Host: IP address or hostname of the machine hosting the database (e.g., 10.57.20.73).
Monitoring port: server network port. Default: 50000.
Backend technology: select the Elasticsearch option.
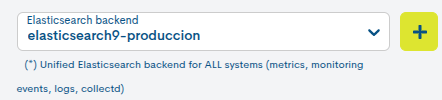
Elasticsearch backend: in this new selector, you can add a new backend by triggering the + function.
The fields that must be modified are:
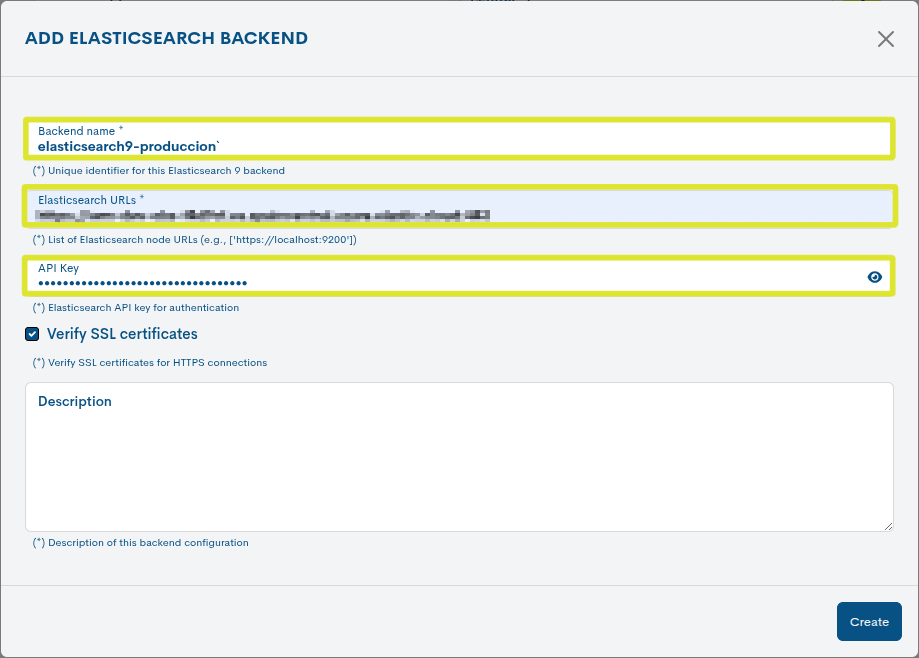
Backend name: identifying name for the Elasticsearch backend. It must be a unique value that is easily recognizable by the user (e.g.,
elasticsearch9-production).Elasticsearch URL: URL of the Elasticsearch 9 nodes to which WOCU-Monitoring will connect.
For deployments managed from the Elastic console, the value must be obtained by accessing the corresponding Observability Serverless project.
The access route is as follows:
Serverless projects > [project_name] > OverviewNext, locate the Application endpoints, cluster and component IDs block, select the Elasticsearch option, and copy the value shown under Public endpoint.
This endpoint is the value that must be configured in the Elasticsearch URL field.
API Key: This API Key is generated from within the Elastic tool itself. Here, you must enter the key generated in step 3. Obtaining the Token of this same process, which corresponds to the Realm’s own API Key.
Next:
Confirm the changes made using the Create button
elect the new backend from the dropdown menu to continue
Metric Index: add the name of the Realm (e.g., central_1). The system will internally add the corresponding prefix to the metrics index.
Monitoring Events Index: add the Realm name (e.g., central_1). The system will internally add the prefix corresponding to the monitoring events index.
Observability: Check this box to enable the Observability module in this new Realm.
Host Name: add the name of the Realm (e.g., central_1).
Once all the required data has been entered, save the form configuration using the Add Realm button.
8. Enable observability in an existing realm
It may be the case that you want to enable the Observability module in an existing Realm.
To do this, click on the Configuration option, which can be accessed via the Settings selector. This will open a new browser window giving you access to the advanced WM Console Admin module, from where you can manage a range of advanced WOCU-Monitoring functions.
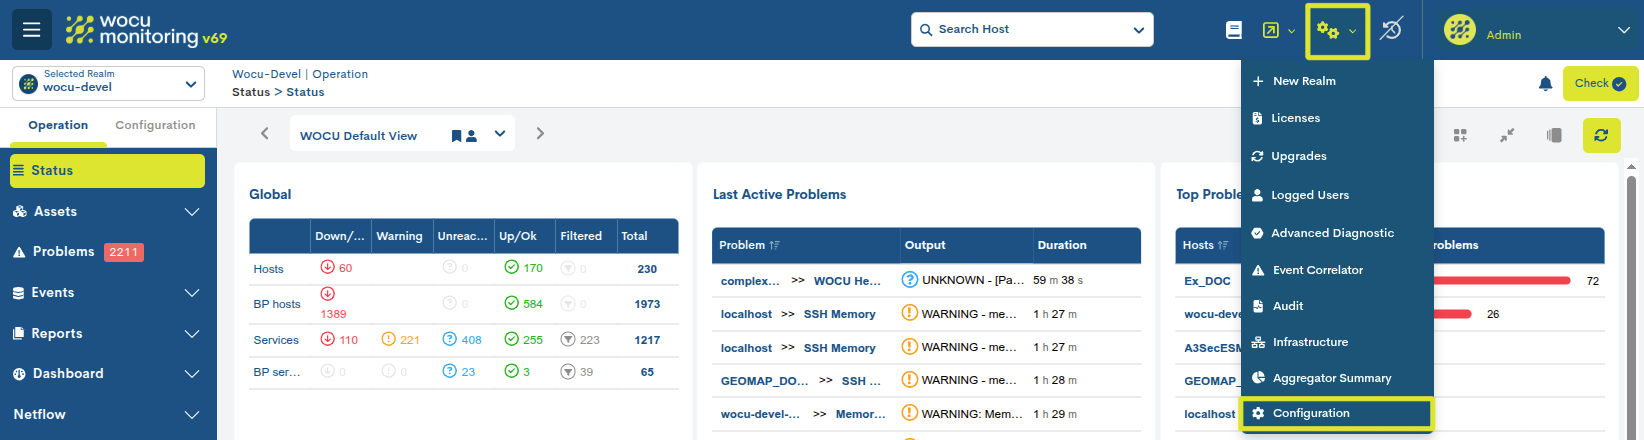
Next, select the Realm option from the left-hand side menu and navigate to the Realm you wish to edit. Once you are in the edit profile screen, tick the Observability box.
Finally, save your changes by clicking the Save button and return to the Realm to start using the module’s features.
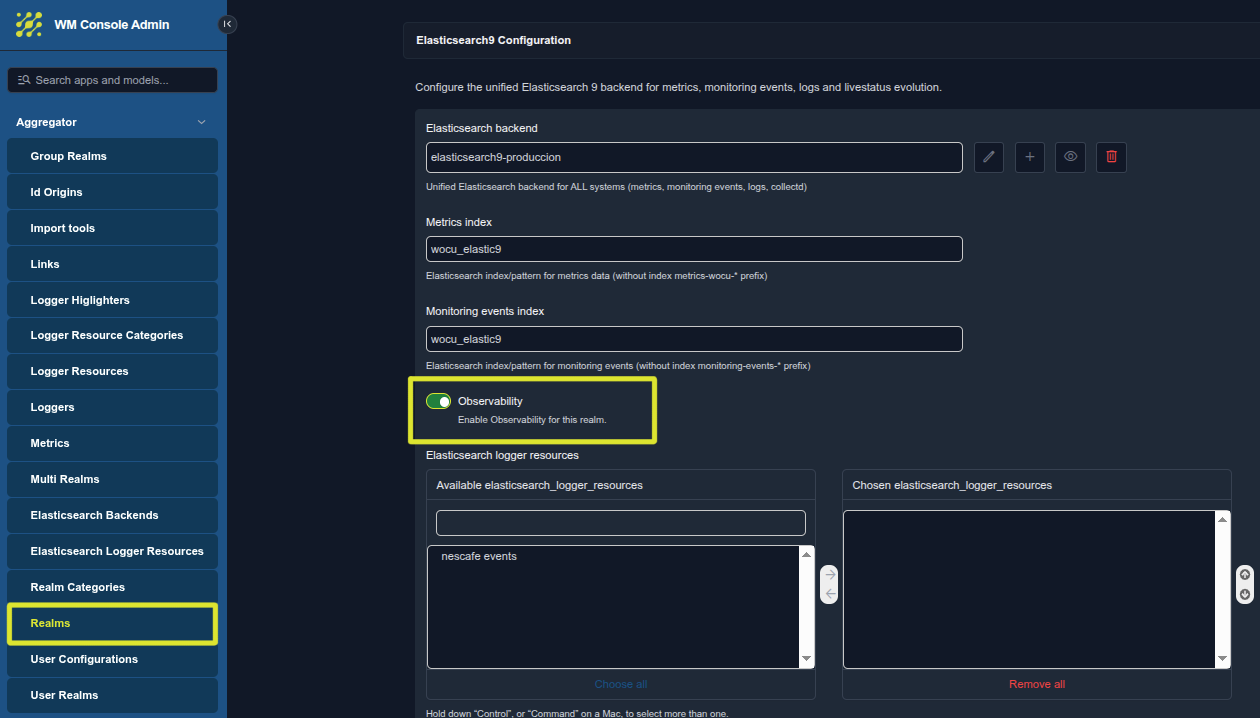
Congratulations! The initial configuration of the Observability module has been completed successfully.
Configuration via Script
Script-based configuration enables the automation of the Observability Realm creation in Elastic Cloud, reducing manual intervention and facilitating consistent configuration across different environments.
The full process is set out below:
1. Request for the Master API Key
Before executing the script, request the Elastic master API key from the Cloud environment administrator or superadmin.
This key is generated only once and, by default, must already exist in the environment. The Master API Key has sufficient permissions to create and configure the necessary resources for the Observability Realm in Elastic.
Once this key has been obtained, the necessary credential is availableto proceed with the configuration process via script.
Important
The master API key must be used solely for provisioning or initial configuration tasks. It should not be used as an operational credential for the Realm, as it grants global permissions over the environment.
2. Creating the Realm API Key
Once the master API Key is available, a secondary API Key associated with the Observability Realm must be created. This will be the operational key used by the Realm, with permissions scoped via a JSON privilege structure.
To create it, follow these steps:
Go to the Elasticsearch interface and select the Serverless Project for observability set up by your administrator or Elastic owner.
Attention
Please check that you are in the correct environment before creating spaces, roles or API keys. This check is important to ensure that credentials are not generated in a project other than the one you will be using with WOCU-Monitoring
Access Space by default.
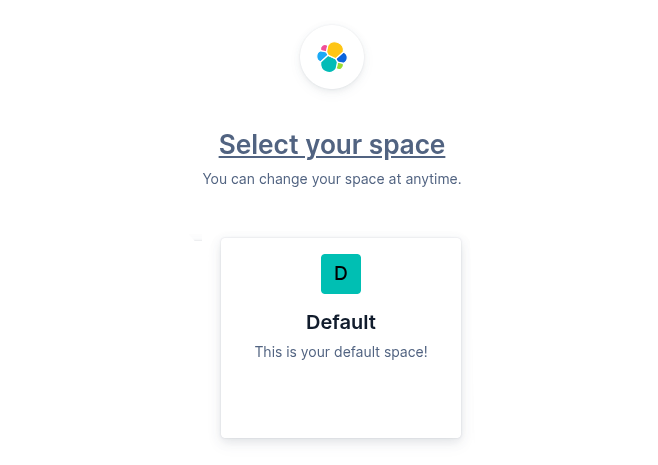
Navigate to the Admin and settings > API KEYS side menu and create a new API key.
In the creation form, configure the fields:
Name: descriptive name of the new API (e.g.,
central_1). It is recommended to use the same identifier as that of the Realm.Control security privileges: this option is used to limit the scope of the key. When enabled, Elastic will display a JSON editor where you can define the specific privileges that the API key will have.
Copy and edit the following JSON code in the editor to assign write permissions and define the indexes for your Realm.
Attention
You must replace [realm name] with your Kingdom’s actual identifier.
{
"role-read-write-[nombre del reino]": {
    "cluster": [
    "monitor_inference"
    ],
    "indices": [
    {
        "names": [
        "monitoring-events-[nombre del reino]",
        "metrics-wocu-[nombre del reino]",
        "syslog-[nombre del reino]",
        "flexwan-[nombre del reino]",
        "traps-[nombre del reino]",
        "import_tool_cache_conf_hosts",
        "import_tool_cache_conf_hostgroups",
        "import_tool_cache_realms_info",
        ".ml-anomalies-wocu-ml-job-[nombre del reino]",
        "*[nombre del reino]*",
        "task_summaries",
        "livestatus_evolution"
        ],
        "privileges": [
        "read",
        "write",
        "create_index",
        "view_index_metadata"
        ],
        "allow_restricted_indices": false
    }
    ],
    "applications": [
    {
        "application": "kibana-.kibana",
        "privileges": [
        "feature_agentBuilder.all",
        "feature_actions.read"
        ],
        "resources": [
        "space:[nombre del reino]"
        ]
    }
    ],
    "run_as": [],
    "metadata": {},
    "transient_metadata": {
    "enabled": true
    }
}
}
Click Create API Key to generate the key.
Important
The IA Assistant uses the Elastic Agent Builder API, so the API Key must include the feature_agentBuilder.all privilege. Without this privilege, calls to /api/agent_builder/* return 403 Forbidden. This functionality requires an Enterprise license and, at a minimum, Elastic Stack 9.3.
In Stack 9.3, Agent Builder is in preview and must be enabled manually from Kibana; starting with 9.4, it is the default experience. Token consumption tracking (usage and cost reports) requires Stack 9.4 or later; only chat is available in 9.3.
Refer to the section Creating the API Key for full details on permissions, version requirements, and instructions for updating keys created prior to the migration to Agent Builder.
3. Obtaining the Token
The platform will generate the key in three output formats:
Encoded
Beats
Logstash
Important
It is essential to save the key in the three available formats. These values are displayed only at the time the key is created. If they are not saved then, they cannot be recovered later, and it will be necessary to generate a new API Key.
4. Creating a Realm in WOCU-Monitoring and associating the API Key
Finally, the observability_module module is enabled from the itself creation form of a realm, configured with the Elasticsearch backend.
To create a new standard monitoring realm, access the Settings menu and click the + New Realm button, as shown in the following image:
This action will open the Realm creation form. Next, the fields described in the following sections must be configured:
Display Name: add the Realm name (e.g.,
central_1).Import Tool: to add an initial Import Tool, activate the + function next to the field.
The fields that must be modified to set up a new Import Tool are:
Name: add the name of the Realm (e.g.,
central_1).Import tool host: IP address or hostname where the Import Tool is hosted (e.g.,
10.57.20.73).Import tool port: connection port for the Import Tool API (e.g.
50280).Import Tool API Protocol: protocol used by WOCU-Monitoringto connect to the Import Tool API. Select the
httpoption from the drop-down menu.API Optimization: check the box to enable optimization of queries made against the Import Tool API.
Next:
Confirm the changes made using the Create button
Select the new Import Tool from the drop-down menu to continue.
Monitoring Host: IP address or hostname of the machine hosting the database (e.g.,
10.57.20.73).Monitoring port: server network port. Default:
50000.Backend technology: select the
Elasticsearchoption.Elasticsearch backend: to add an initial backend, activate the + function next to the field.
The fields that must be modified are:
Backend name: identifying name for the Elasticsearch backend. It must be a unique value that is easily recognizable by the user (e.g.,
elasticsearch9-production).Elasticsearch URL: URL of the Elasticsearch 9 nodes to which WOCU-Monitoring will connect.
For deployments managed from the Elastic console, the value must be obtained by accessing the corresponding Observability Serverless project.
The access route is as follows:
Serverless > [project_name] > OverviewNext, locate the Application endpoints, cluster and component IDs block, select the Elasticsearch option, and copy the value shown under Public endpoint.
This endpoint is the value that must be configured in the Elasticsearch URL field.
API Key: This API Key is generated from within the Elastic tool itself. Here, you must enter the key generated in step 3. Obtaining the Token of this same process, which corresponds to the Realm’s own API Key.
Next:
Confirm the changes made using the Create button
elect the new backend from the dropdown menu to continue
Metric Index: add the name of the Realm (e.g.,
central_1). The system will internally add the corresponding prefix to the metrics index.Monitoring Events Index: add the Realm name (e.g.,
central_1). The system will internally add the prefix corresponding to the monitoring events index.Observability: Check this box to enable the Observability module in this new Realm.
Host Name: add the name of the Realm (e.g.,
central_1).
Once all the required data has been entered, save the form configuration using the Add Realm button.
5. Executing the script from the aggregator console
The next step is to execute the configuration script from the aggregator console.
This script must be available in the environment and will use the previously configured environment variables, including the one for the master API Key. This API has broad permissions within the Elastic environment, so it should not be used as an operational credential for all Realms. Its use in this procedure is exceptional and limited to initial provisioning tasks, as it enables the automation of the creation and configuration of the necessary resources in the Elastic Cloud.
The goal of the script is to prepare the Observability Realm in Elastic, avoiding a full manual configuration and facilitating faster, consistent provisioning. Once the process is complete, each Realm must operate using its own specific API Key, with permissions restricted to its indices, Space, and associated resources.
To execute the script, use the following command from the aggregator’s console:
/opt/wocu/embedded/bin/python3 /opt/wocu/embedded/wocu/wocu-aggregator/wocu-aggregator/manage.py configure_kibana_realm_spaces <nombre_del_reino>
Where <realm_name> appears, it must be replaced with the actual identifier of the realm to be configured.
Example:
/opt/wocu/embedded/bin/python3 /opt/wocu/embedded/wocu/wocu-aggregator/wocu-aggregator/manage.py configure_kibana_realm_spaces central_1
Important
The master API key must be used solely for this type of initial configuration task. It must not be reused as an operational key for Realms, as it possesses global permissions over the Elastic environment.
Congratulations! The initial configuration of the Observability module has been completed successfully.
Observability View
IA Assistant
WOCU-Monitoring incorporates the AI Assistant, an artificial intelligence feature included within the Observability module and designed to streamline the analysis and diagnosis of incidents affecting monitored elements, such as Hosts, Services and Problems.
Important
This assistant utilises the capabilities of Elastic Observability, enabling users to perform natural language queries on the information available in Elastic, including metrics, events, alerts and logs associated with the Realm’s assets.
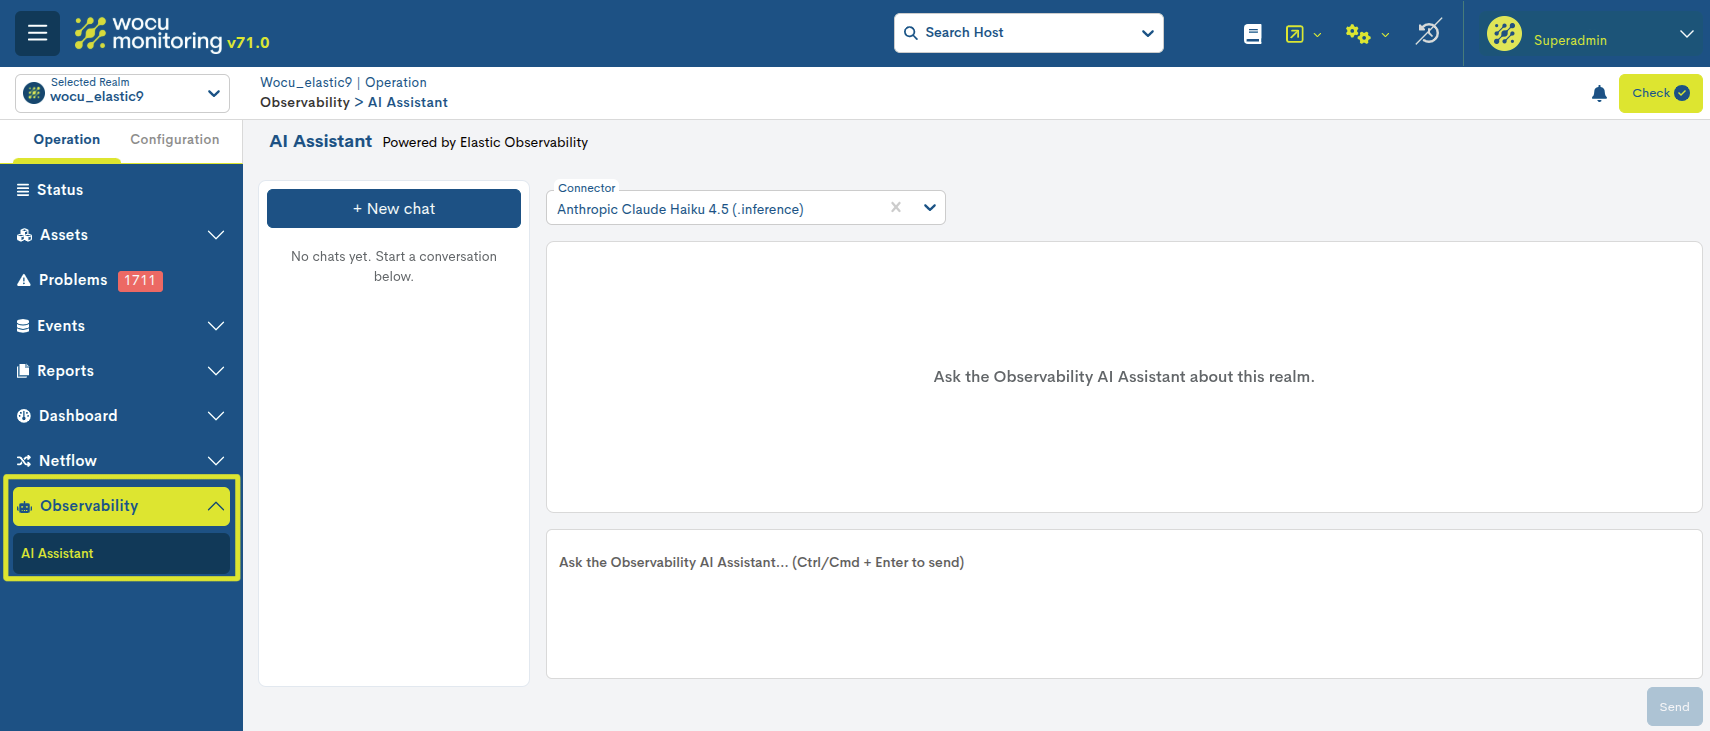
The AI Assistant tab therefore provides a chat function that allows users to converse and interact with the AI Assistant, using natural language to quickly and centrally view alerts, metrics, events and logs associated with monitored assets.
Components
Its main components are:
Conversation history: a sidebar displaying the user’s conversations, grouped by date. From this area, you can revisit previous analyses, start a new conversation, and rename or delete conversations.
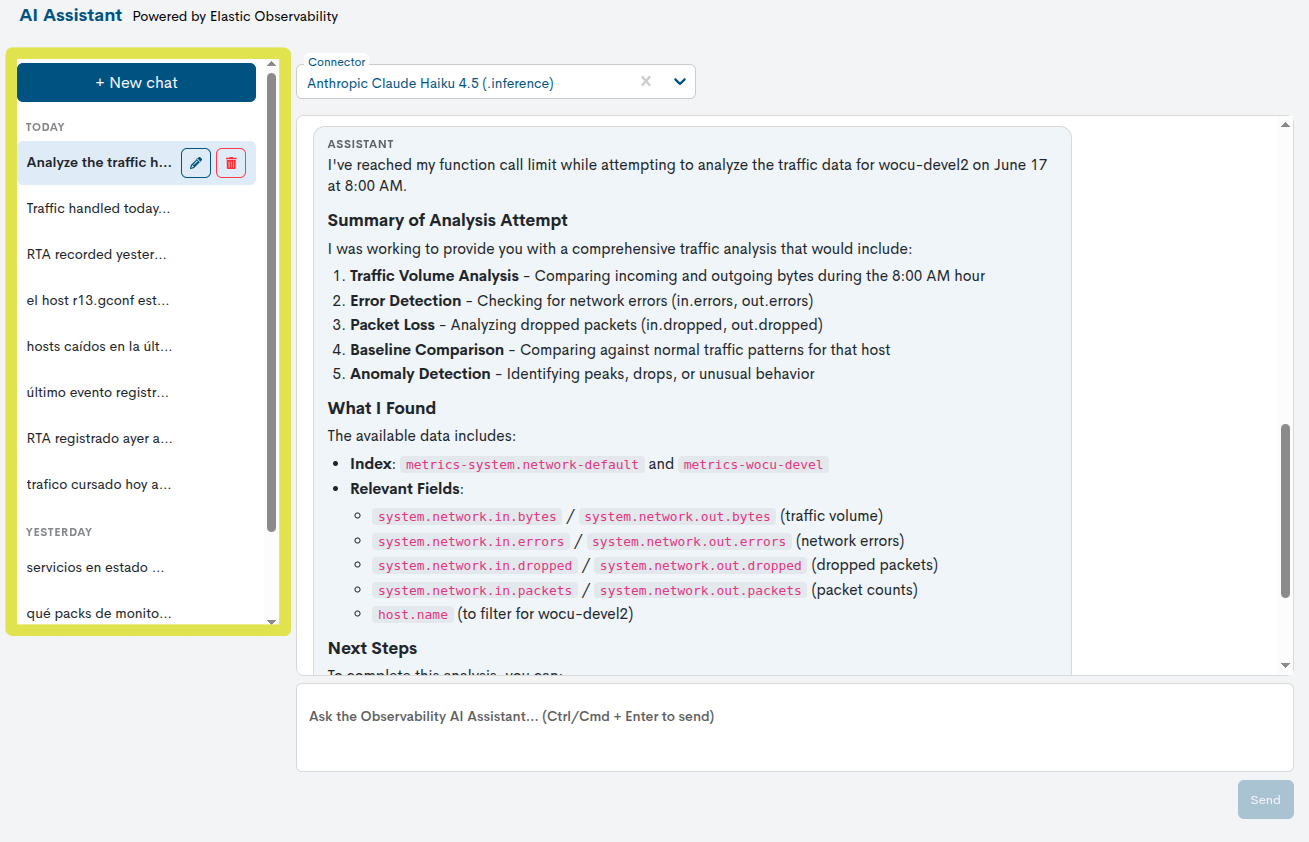
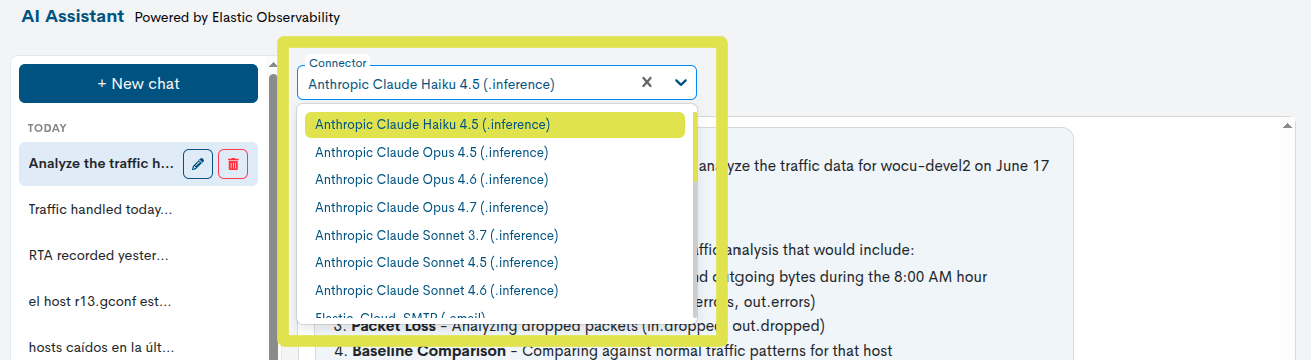
Connector selector: a drop-down menu that allows you to select the AI connector that the assistant will use to process the query. Each connector represents an AI model or backend that has been previously configured in Elastic.
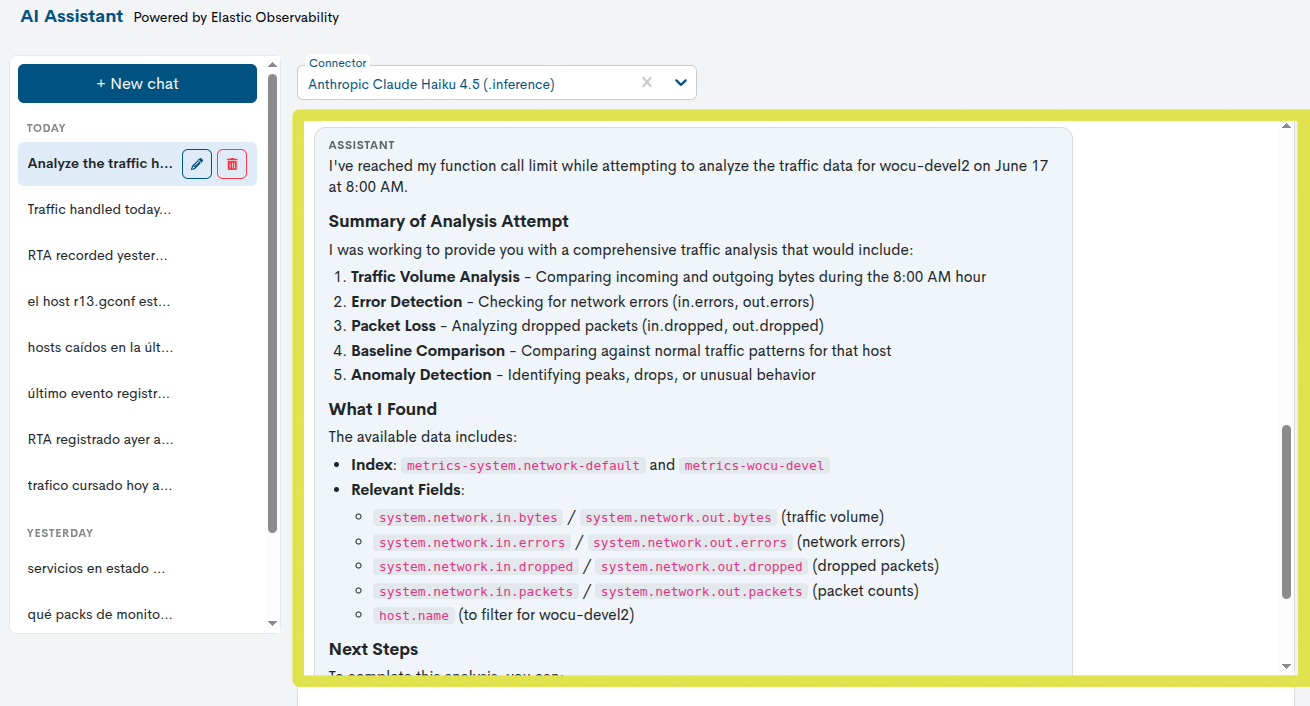
Conversation area: the main part of the screen where messages exchanged between the user and the assistant are displayed. This area shows both the queries made and the responses generated by the AI.
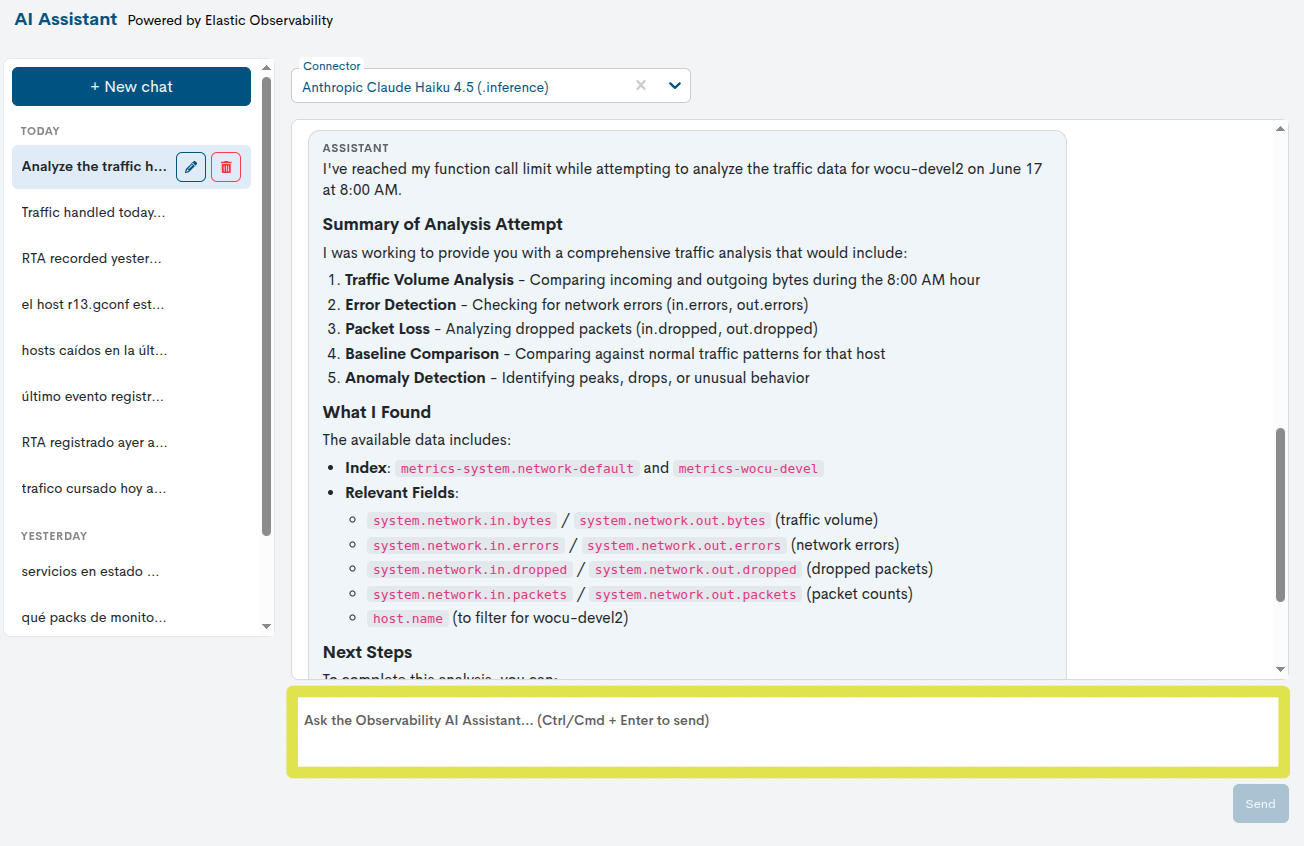
Query field: a text box into which the user enters a question or instruction in natural language. The query may relate to recent events, performance metrics, active alerts, logs or any other observability information available to the Realm.
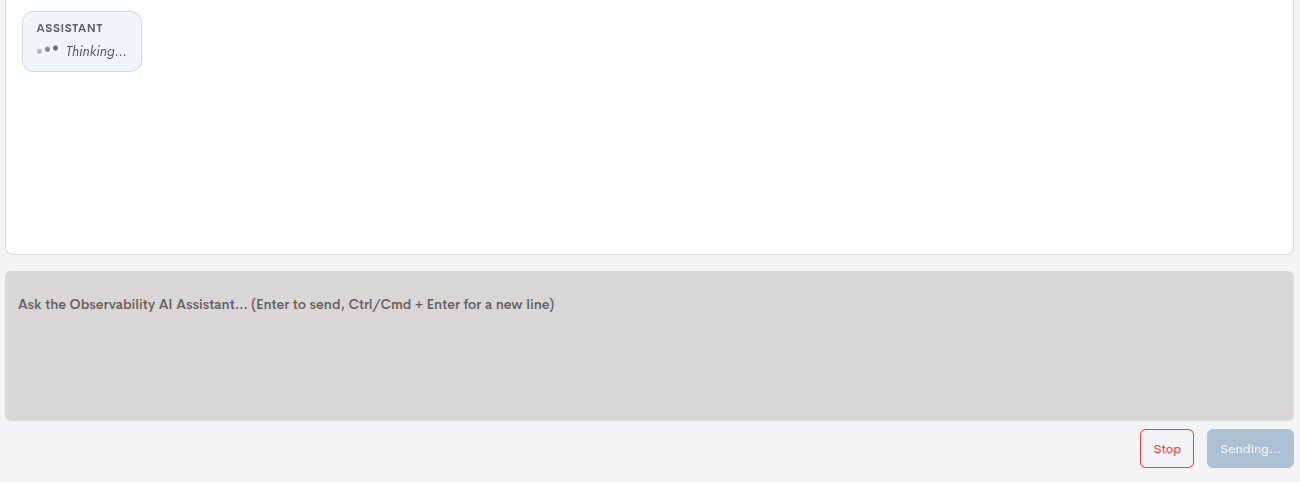
Send button: allows you to send your query to the assistant. You can also use the keyboard shortcut shown on the interface itself to send the message quickly.
While the response is being generated, the process can be stopped using the Stop button, located next to the Send button.
How it works
The AI Assistant feature is very straightforward to use and is based on a chat-style interaction between the user and the AI Assistant.
To make a query, the user must type their question or command into the query field at the bottom of the view. This query may relate to metrics, events, alerts, logs or any other observability information available for the Realm.
Once you have written your query, you must click the Send button to send it to the Assistant.
Once the request has been sent, the Assistant processes it using the selected connector and returns the response in the conversation area.
This section displays, in sequence, both the questions asked by the user and the answers generated by the AI.
This conversation is automatically saved in the conversation history, located in the side panel of the view, allowing the user to return to it later and continue the analysis from where they left off.
AI Assistant usage limits and cost
WOCU-Monitoring allows you to control the AI Assistant’s spending by Realm and by user, and view its cost. All configuration is done from the Django admin (Observability section).
Quota per Realm
In AI Assistant Realm Limits, a monthly token limit is defined per Realm. When the month’s consumption reaches that limit, new chat turns are blocked with a notification to the user.
Each Realm receives a default quota upon creation(
WOCU_AI_DEFAULT_REALM_TOKEN_LIMIT); with the limit disabled, the Realm is unlimited.Sub-limit and user activation
In AI Assistant User Policies, you can, per user-realm pair, disable AI or set your own monthly sub-limit within the quota of the Realm.
A user without a policy uses the Realm’s pool with AI enabled.
Important
The cap is preventive, not an exact billing cutoff: consumption is known at the end of each shift (and, as a backup, with the time sync),so the shift that crosses the limit is completed and several simultaneous shifts can slightly exceed it before being blocked.
Realm administrators and superusers are not affected by the limits, so as not to be left without a diagnosis.
Models and cost (€)
In AI Assistant Model Prices, the inference models are listed. They are automatically discovered (via the hourly task and the Sync models from Elastic button), with a default reference price that can be adjusted. A disabled model disappears from the chat selector and is rejected if an attempt is made to use it. The cost is calculated using the price (per million input and output tokens) of the model used in each conversation plus the cost of the Agent Executions from Elastic (
WOCU_AI_EXECUTION_PRICE). The Limits & Cost Dashboard panel shows, by Kingdom and month, consumption versus the limit and the estimated cos in the configured currency (WOCU_AI_CURRENCY).
Anomalies
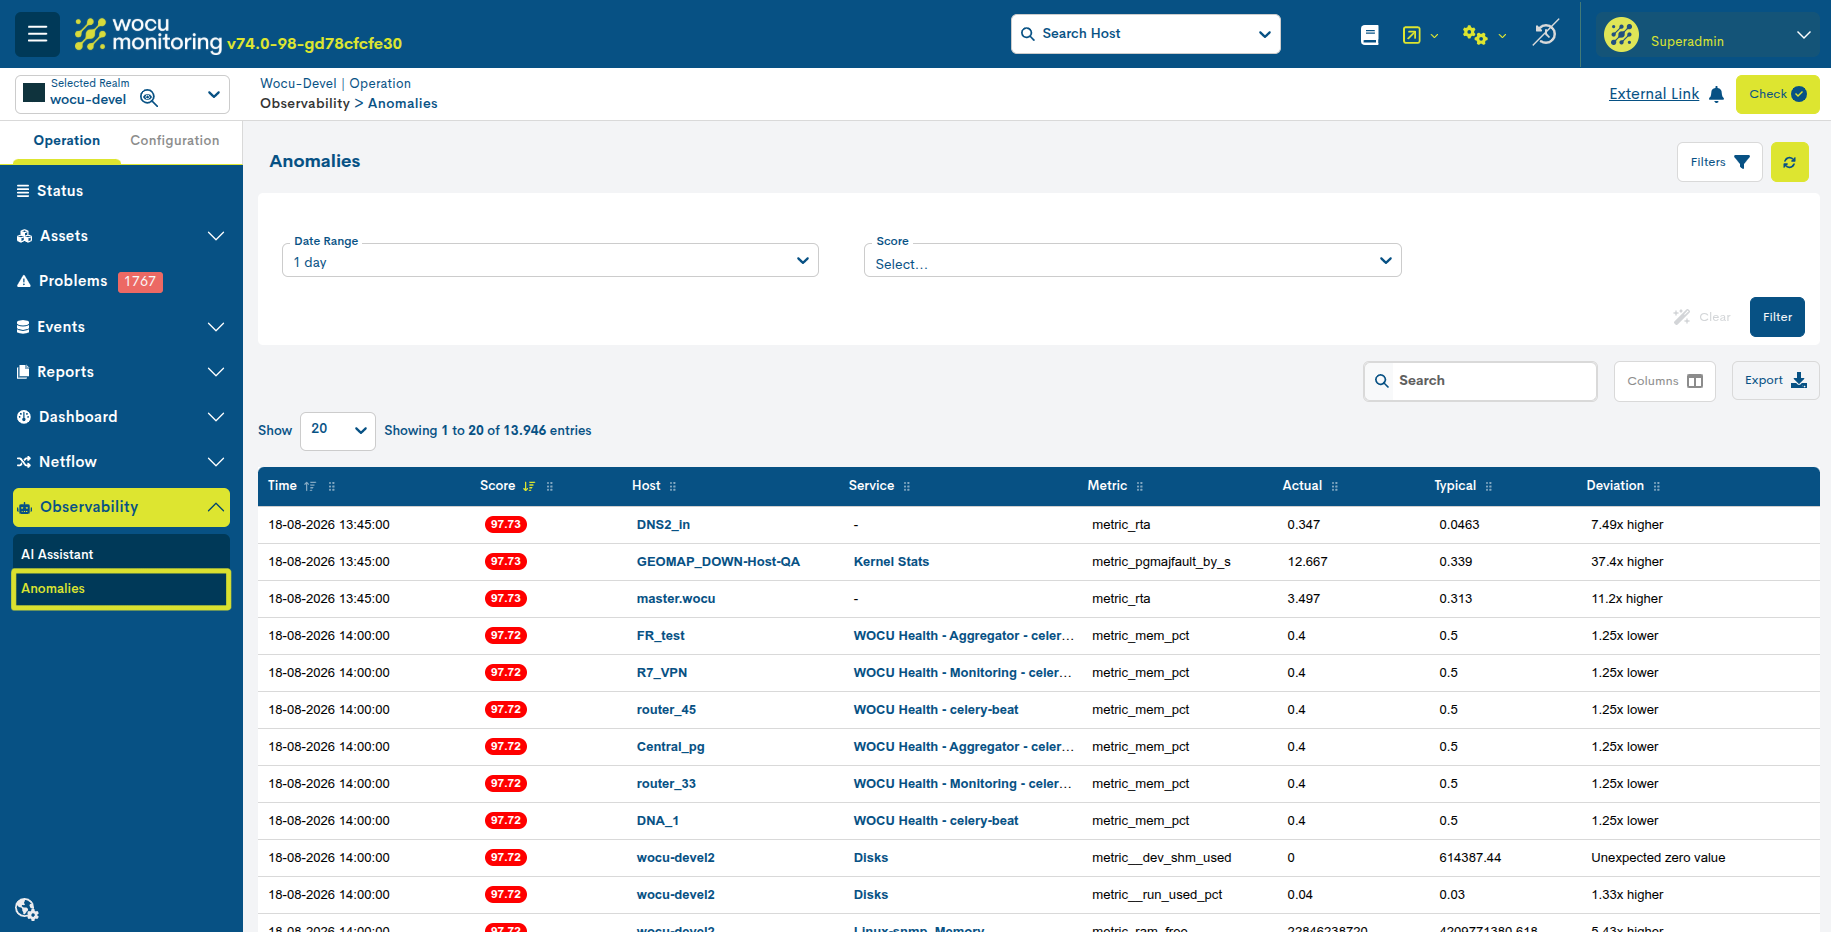
The Anomalies view, included in the Observability module, allows you to centrally view the deviations detected in the metrics of the Hosts and Services monitored within a Realm.
What is it for?
This view is designed to facilitate the early detection and analysisof anomalous behavior in the monitored infrastructure.
It allows, among other uses:
Identify metrics whose behavior deviates significantly from their usual pattern.their usual pattern.
Detecting variations that might go unnoticed using onlyfixed thresholds.
Prioritize anomalies according to their relevance using the Anomaly Score.
Compare the actual observed value with the expected value for that metric.
Quickly locate the Host, Service, and metric where the deviation has occurred.
Note
An anomaly does not necessarily imply the existence of an incident.It indicates that the behavior of a metric has deviated from its usual patternand, therefore, may require review by the user.
How does it work?
WOCU-Monitoring uses the analytical capabilities of Elastic Observability to analyze the time series of metrics and determine their expected behavior. When a value deviates from this behavior, it is identified as a potential anomaly and assigned a score between 5 and 100. The higher the score, the more significant the detected deviation.
The Score allows anomalies to be classified according to their relevance:relevance:
5 - 25: Low anomaly. The value shows a slight deviation from the expected value.
25 - 50: moderate anomaly. The deviation begins to be significant.
50 - 75: High anomaly. The observed behavior deviates clearly from the expected pattern.
75 - 100: very high anomaly. Represents the most ” “relevant or unusual deviations.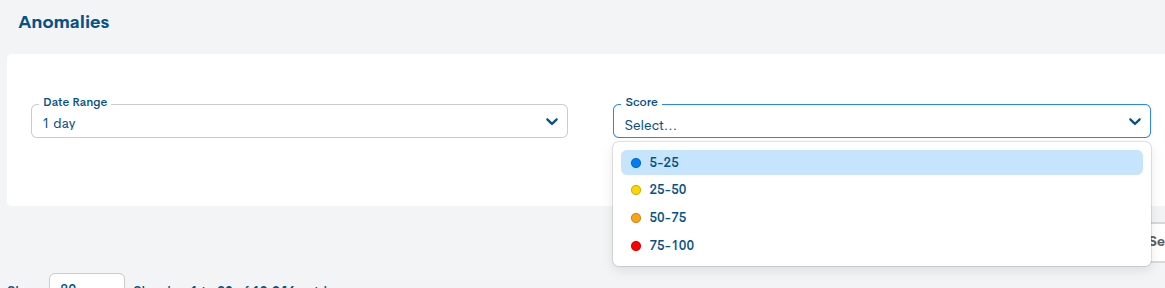
Important
The Score does not represent the percentage of deviation from the metric. For example, a value of 75 does not mean that the metric has deviated by 75%, but rather represents a normalized score of the relevance of the anomaly.
To facilitate interpretation, each anomaly also includes the following values:values:
Actual: actual value recorded at the time of the anomaly.
Typical: expected value for that metric.
Deviation: difference between the observed value and the typical value, expressed in a way that facilitates the interpretation of the deviation.
For example, a value “7.49x higher” indicates that the recorded value has been approximately “7.49” times higher than expected.

How is it used?
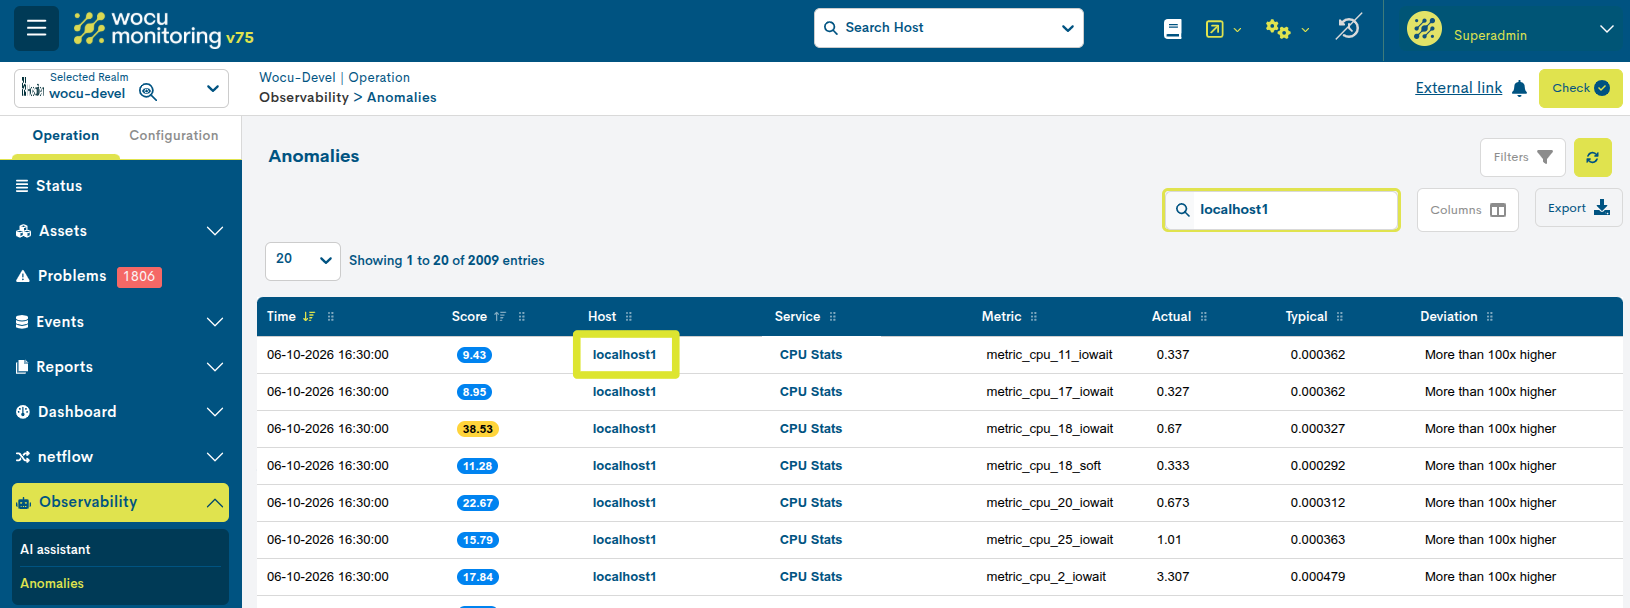
Access the Observability view > Anomalies. From here, the user has access to a table that compiles the anomalies detected in the Realm.
To make an inquiry:
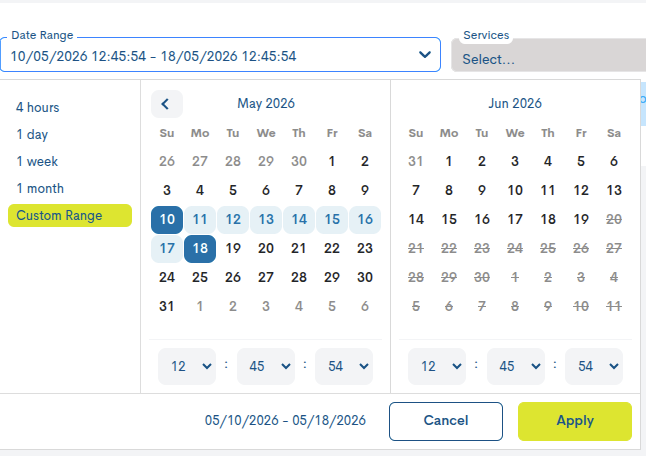
In Date Range, select the period you wish to analyze. The available intervals are 4 hours, 1 day, 1 week, and 1 month, as well as Custom Range, which allows you to manually define the start and end dates and times.
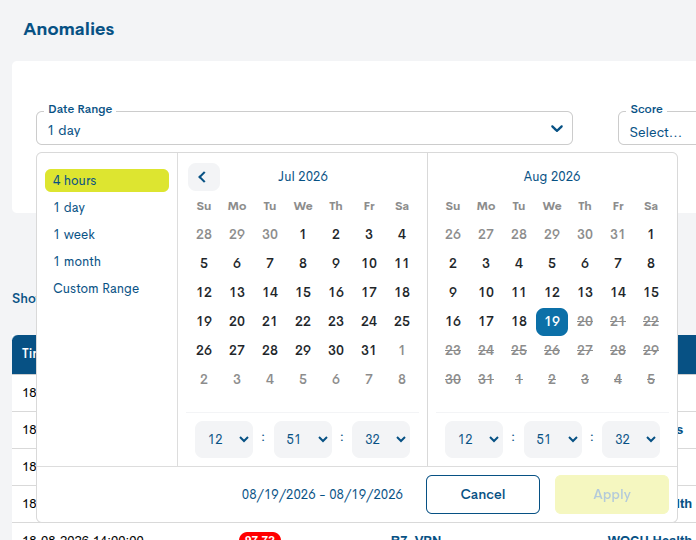
Use the Score filter to limit the results to the level of relevance of the anomalies you wish to view. As explained in the previous section, the filter groups the results into four ranges:
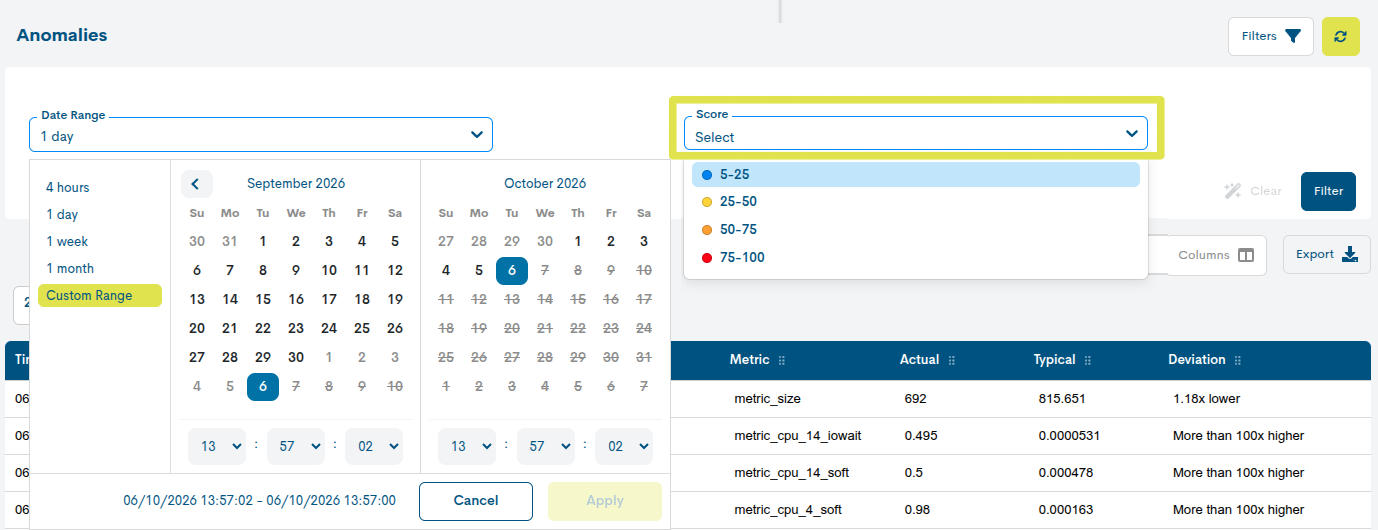
5 - 25: low anomaly.25 - 50: moderate anomaly.50 - 75: high anomaly.75 - 100: very high anomaly.Click Filter to apply the selected criteria. The Clear option allows you to remove the filters and restore the original query.
Main table
The resulting table shows the detected anomalies along with theinformation necessary to identify and assess each deviation:
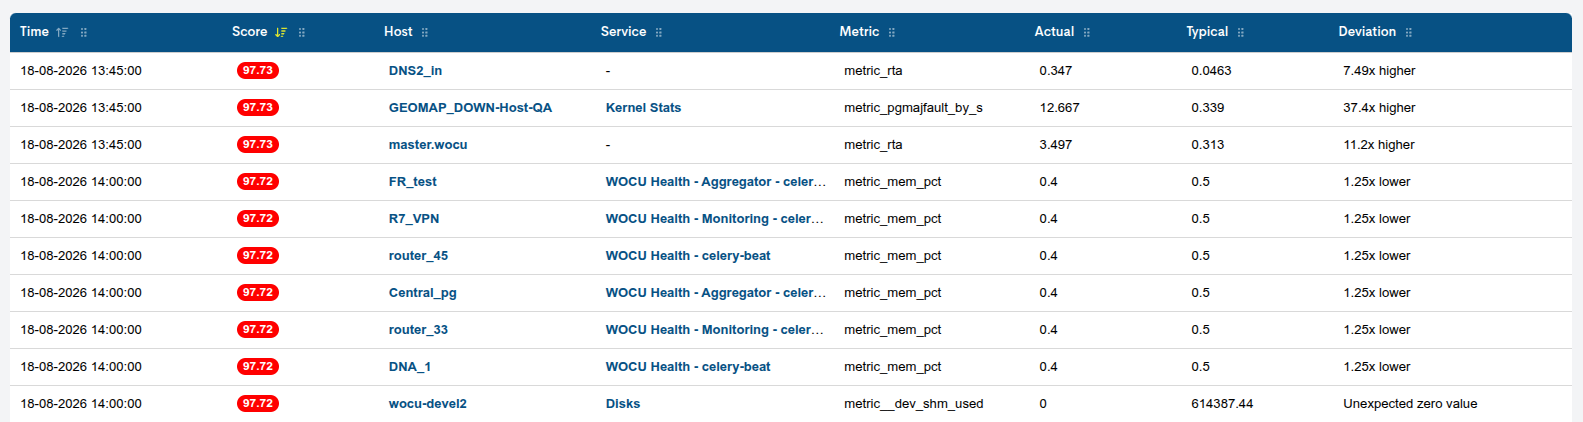
The information provided is as follows:
Time: date and time the anomaly was detected.
Score: score assigned to the anomaly. The higher the value, the greater its relevance.the greater its relevance.
Host: Associated device. Clicking on the name accesses the detail view of the specific device.
Service: service in which the anomaly has been identified, when applicable. Clicking on the name accesses the specific service details view.
Metric: affected metric.
Actual: value observed at the time of detection.
Typical: expected value for that metric.
Deviation: difference between the observed value and the typical value, expressed in a way that facilitates the interpretation of the deviation.
In this way, the user can directly compare the actual behavior of a metric with its usual behavior and quickly identify anomalous situations.
Interpretation of the results
To evaluate an anomaly, it is recommended to analyze both the Score and Deviation together.
The Score indicates the statistical significance of the deviation from the usual behavior, while Deviation allows us to understand more directly how far the actual value has deviated from the expected value.
For this reason, an anomaly with a high Score should be considered as a priority item for review, but it should be compared with the other information available in WOCU-Monitoring, such as monitoring events, alerts, or recent changes in the Host or Service.
Exporting results
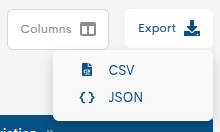
The Export option allows you to download the information available in the anomaly table for external analysis or processing. The available formats are:
CSV: Exports data in tabular format, compatible with spreadsheet applications.
JSON: exports data in a structured format for processing or integration with other tools.
Host Anomalies View
Attention
The Anomalies tab will be available when the Realm has the Observability enabled and anomaly analysis configuration exists for Host metrics.
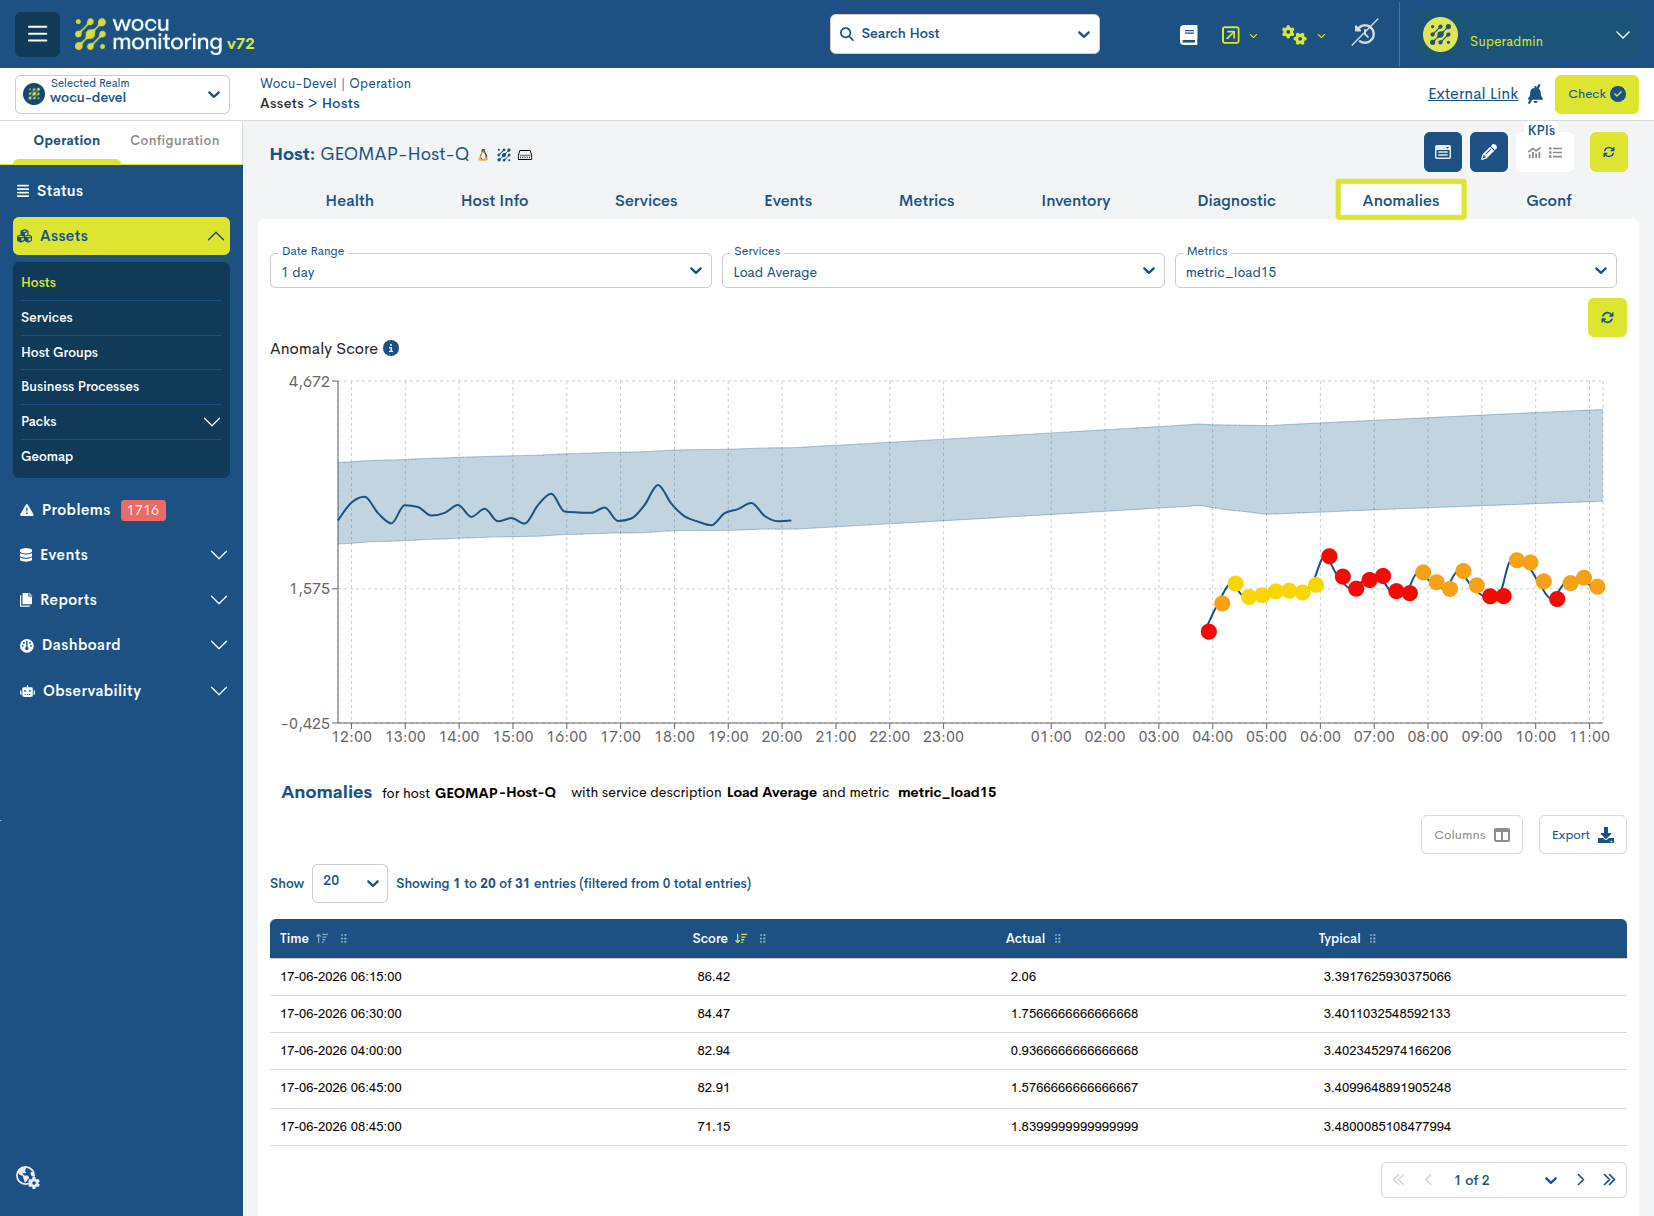
The Anomalies view allows you to view the anomalies detected in the metrics of a host being monitored in WOCU-Monitoring. To do this, it combines query filters, a graph showing the metric’s trend over time, and a table detailing the detected anomalies.
This feature forms part of the Observability module and draws on the analytics capabilities of Elastic Observability. Using the data stored in Elastic, the time series of the monitored metrics are analysed to identify values that deviate from the expected normal behaviour.
Note
Anomaly detection is not based solely on static thresholds, but on a comparison between the observed value and the behaviour pattern learnt from historical data. In this way, the dashboard helps to identify unexpected changes, significant deviations or unusual behaviour that may require operational review.
To access the anomalies view for a host:
Go to the relevant Realm.
Select the Host (column Host) that you want to analyze.
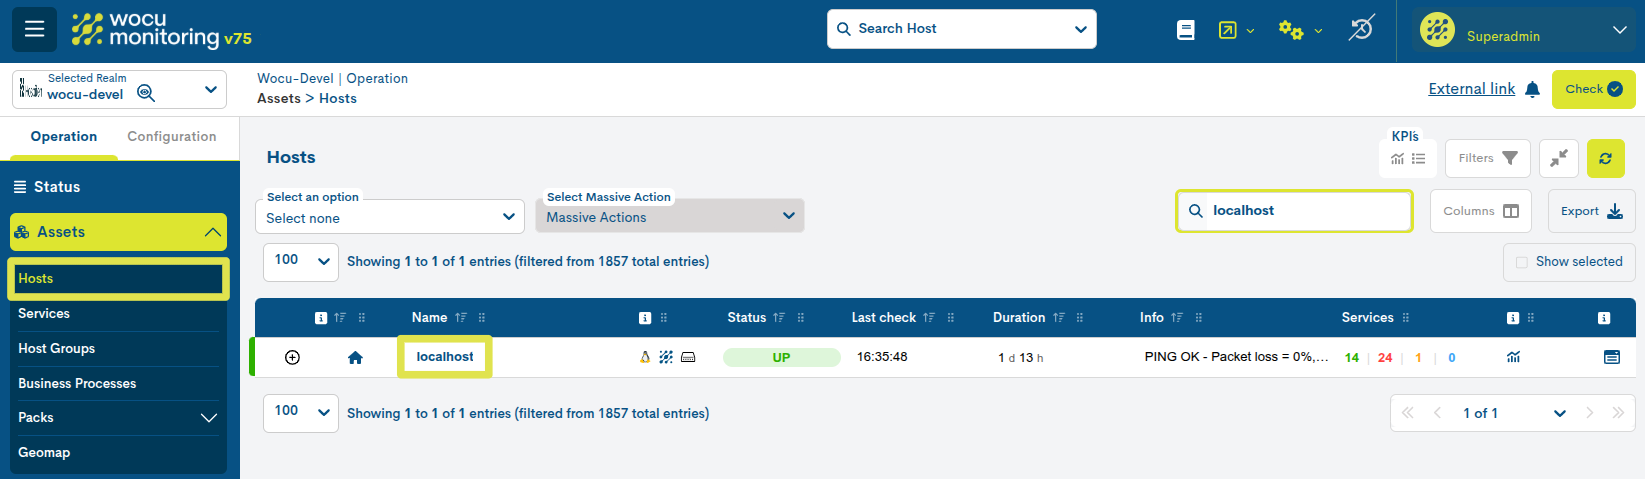
Once inside the Host details view, click the Anomalies.
You can also access it from the global list of Anomalies by clicking on the name of a specific device, visible in the Host column.
View components
The Anomalies view consists of several elements designed to filter, display and view the detected anomalies.
Query filters
The filters that define the analysis are displayed at the top of the view:
Date Range
This allows you to specify the time period for which you wish to run the query. The selector offers several predefined ranges:
4 hours, to view the anomalies detected over the last four hours.
1 day, to analyse the behaviour recorded over the last day.
1 week, to extend the search to the last week.
1 month, to review a monthly period.
Custom Range, to manually select a start date and time and an end date and time.
When Custom Range is selected, a calendar opens, allowing the user to define the exact analysis range. As well as selecting the days, it is possible to set the hour, minutes and seconds for the start and end of the period. To apply the selection, click the Apply button.
Services and Metrics
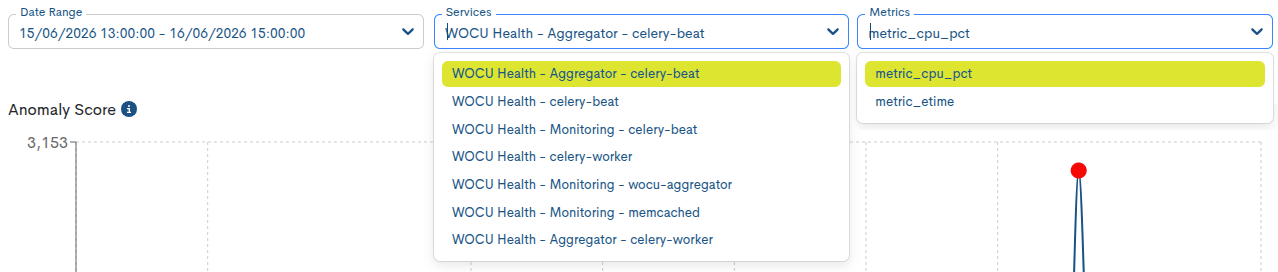
This allows you to select the specific context for analysis within the Host, combining the service and the metric for which you wish to check for anomalies.
The Services field displays the services available for the selected host. When you select a service, the Metrics field is automatically updated to show only the metrics associated with that service.
Once the combination of service and metric has been selected, the view retrieves the relevant data and updates both the anomaly chart and the table below with the results detected for the selected host, service, metric and time range.
Score
It allows filtering anomalies according to their level of relevance. The score, ranging from 0 to 100, quantifies the degree to which the observed value deviates from the expected behavior. The higher the score, the greater the significance of the anomaly.
The Score value is expressed on a scale of 0 to 100: the higher the value, the more significant the detected deviation and, therefore, the greater relevance of the anomaly.
The filter groups the results into four ranges:
5 - 25: Low anomaly. The value shows a slight deviation from the expected value.
25 - 50: moderate anomaly. The deviation begins to be significant.
50 - 75: High anomaly. The observed behavior deviates clearly from the expected pattern.
75 - 100: very high anomaly. Represents the most ” “relevant or unusual deviations.
Note
It is important to note that the Score does not directly represent a percentage of deviation. For example, a Score of 75 does not mean that the value has deviated by 75%. It is a normalized score of the severity of the anomaly, calculated from the difference between the actual value and the expected behavior.

Refresh button
The refresh button allows you to refresh the information displayed in the view.
This action is useful for viewing recent data or checking whether any new anomalies have been detected for the selected host, service and metric.

Anomaly Score Chart
The central area of the view displays a graph associated with the selected metric. This graph allows you to compare the actual behaviour of the metric with the expected behaviour calculated by Elastic.
There are three distinct elements in the graph:
Blue line: represents the actual recorded value of the metric.
Shaded blue band: expected range or typical behaviour calculated by the model.
Coloured dots: actual values detected as anomalies, coloured according to their severity or score.
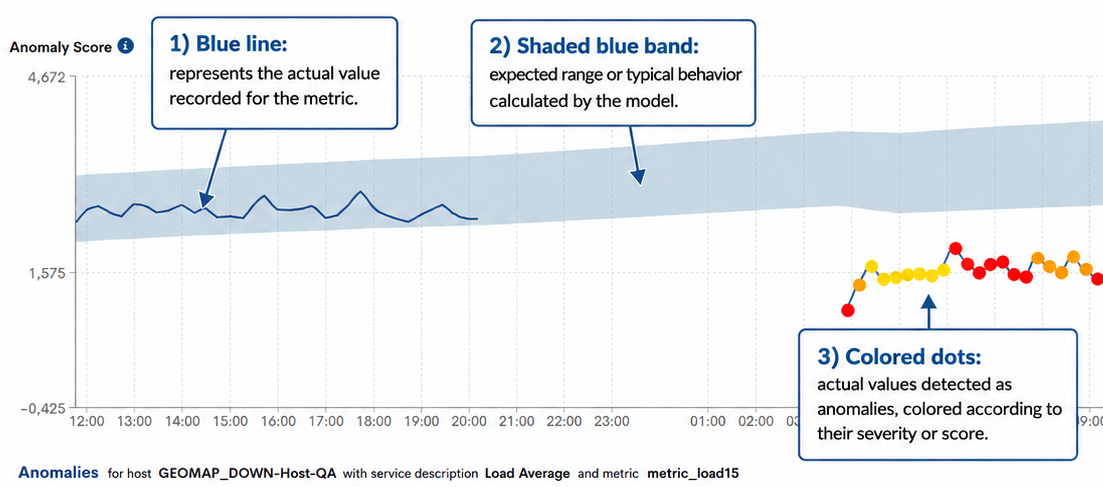
There is a Anomaly Score metric that classifies anomalies by severity. This score does not represent the value of the metric, but rather the degree of deviation from expected behaviour.
The available ranks are:
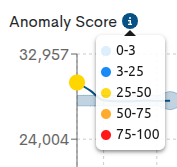
0–3: minimal deviation or no significant abnormality.
3-25: low-severity anomaly.
25–50: moderate abnormality.
50–75: high abnormality.
75–100: critical or very significant anomaly.
The higher the Anomaly Score, the greater the significance of the anomaly. For this reason, points with higher scores should be reviewed as a matter of priority.
However, a high score does not necessarily indicate an incident. The anomaly must be analysed alongside the rest of the available information about the host, such as events, active issues, alerts or recent changes.
Note
Queries are carried out via authenticated endpoints, which are responsible for retrieving the anomalies and the data required to generate the graph based on the selected combination of host, service and metric.
When you hover the cursor over a point, the tooltip displays details of that specific data point on the graph.
Take a look at this example:
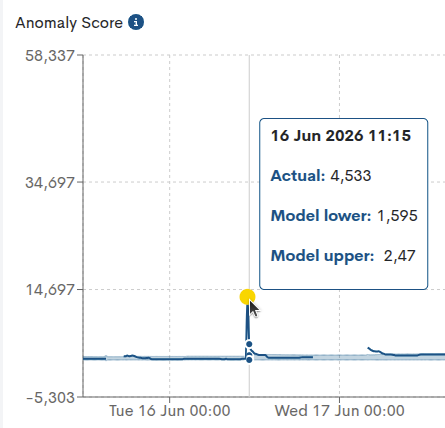
The exact date and time to which the point refers (
16 Jun 2026 11:15).Current: This is the actual measured value of the metric at that moment (
4.533).Model lower: This is the lower bound of the range predicted by the model for that point in time (
1.595).Model upper: This is the upper limit of the range predicted by the model for that point in time (
2.47).
In this case, the actual value of 4.533 is above the expected upper limit of 2.47, which is why the data point is flagged as an anomaly. In other words, the metric was abnormally high compared with what the model considered normal for that date and time.
Table of anomalies
Below the graph is a paginated table showing details of the anomalies detected for the selected host, service and metric.
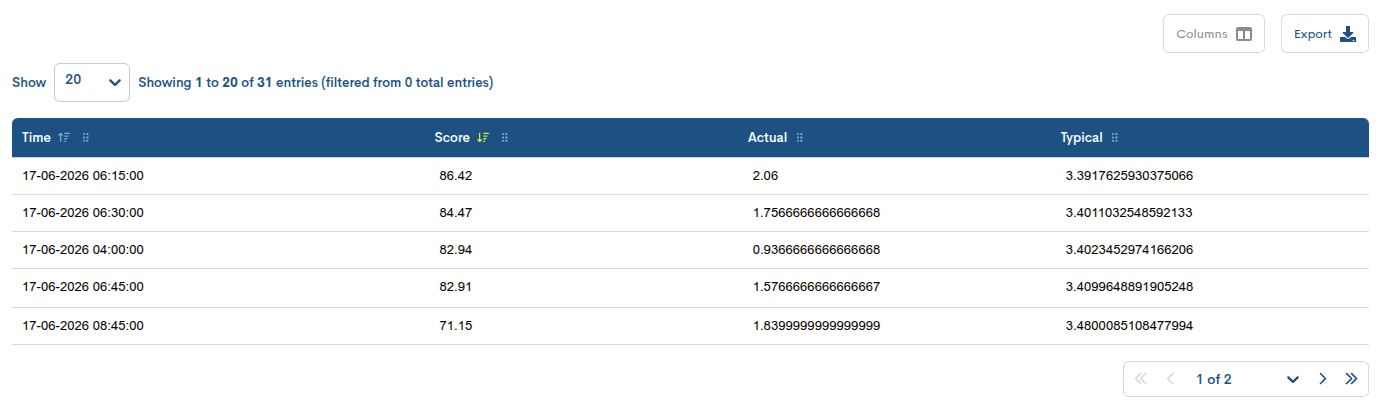
The table contains the following columns:
Time
Date and time when the anomaly was detected.
Score
Score assigned to the anomaly. A higher value indicates a more significant deviation from expected behaviour.
5 - 25: Low anomaly. The value shows a slight deviation from the expected value.
25 - 50: moderate anomaly. The deviation begins to be significant.
50 - 75: High anomaly. The observed behavior deviates clearly from the expected pattern.
75 - 100: very high anomaly. Represents the most ” “relevant or unusual deviations.
Current
The actual value recorded for the metric at that time.
Typical
The expected or typical value calculated for that metric within the same time frame.
Deviation
Difference between the observed value (Actual) and the typical value(Typical), expressed in a way that facilitates the interpretation of the deviation. For example, a value of 3.42x higher indicates that the recorded value is approximately 3,42 times higher than the expected value.
How it works and interpreting the results
The operation of the Anomalies view is based on the selection of an analysis context that allows for the delimitation and analysis of the anomalies detected on the monitored devices.
First, the user must define the time interval using the Date Range filter. You can then select the Service of the device and the specific Metric you want to analyze.Once this context is defined, the Score filter allows you to limit the results according to the degree of relevance of the anomalies detected,facilitating the analysis of those deviations with greater or lesser significance.
Based on the combination of these filters, WOCU-Monitoring queries the information available in Elastic Observability using authenticated endpoints. These endpoints retrieve both the detected anomalies and the data necessary to represent the evolution of the selected metric.
The results are displayed on two levels:
A graph of the metric, showing its trend over time alongside the detected anomalies.
A paginated table detailing each identified anomaly according to the applied filters.
The Score and Deviation fields offer complementary information for evaluating an anomaly. While Score provides a normalized measure of its significance, Deviation allows for a more direct interpretation of how far the actual value has deviated from the expected behavior. Therefore, a high Score should not be interpreted directly as a percentage or deviation factor.
In addition to these values, it is advisable to compare the detected anomalies with the events, problems, or alerts recorded on the Host during the same time interval. This correlation allows us to determine whether the anomalous behavior is related to an actual incident or to some significant change in the monitored environment.
An anomaly does not necessarily indicate an incident, but it does identify behaviour that deviates from the metric’s usual pattern. For this reason, it should be used as a starting point for operational analysis and cross-checked against the rest of the information available for the host.
Service Anomaly Overview
Attention
The Anomalies tab will be available when the Realm to which the Device and associated Services belong has the Observability enabled.
Just as there is an Anomalies view associated with a specific Host concreto, it is also possible to access an anomalies view from the context of a specific Service.
To access the anomaly view for a Service:
Go to the relevant Realm.
Select the Service you want to analyze (Column Service).
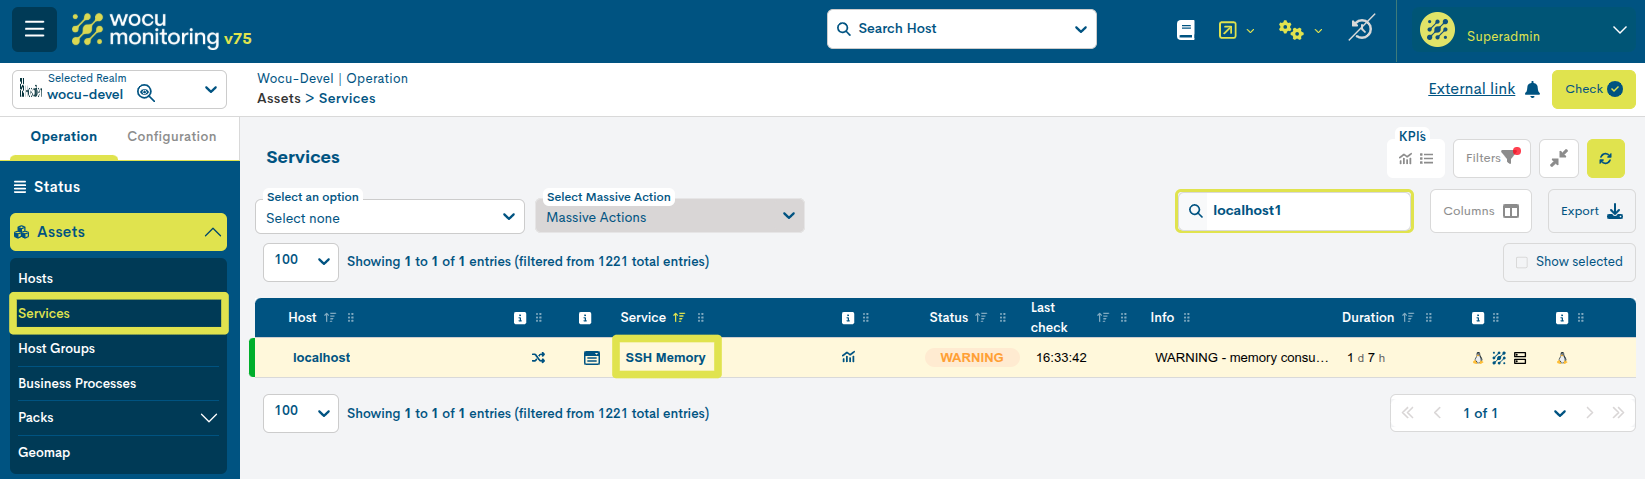
Once inside the Service details viewclick the Anomalies tab.
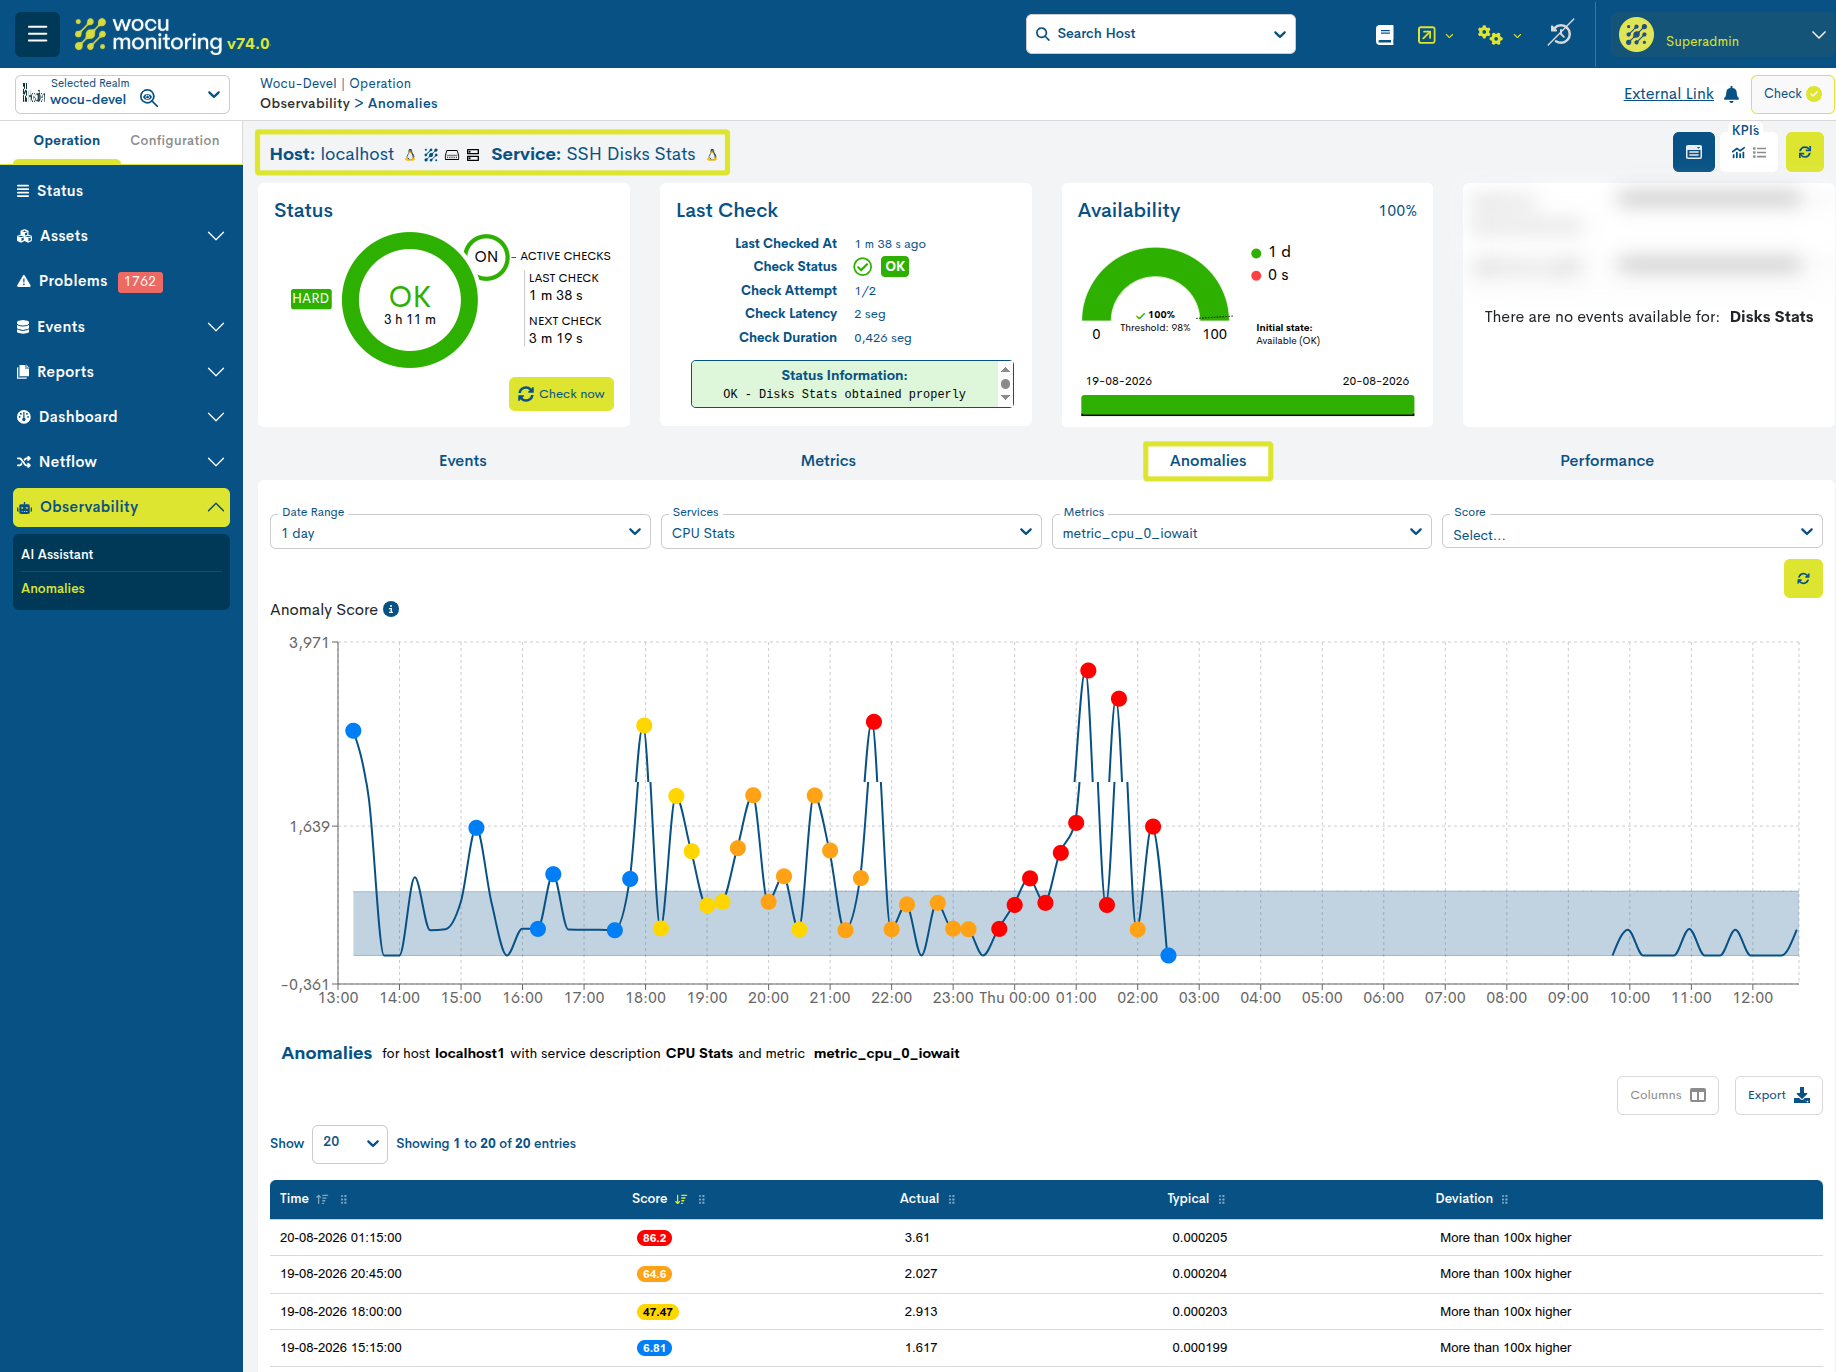
You can also access it from the ref:global list<anomalies_table> of Anomalies, by clicking on the name of a specific service, visible in the Service column.
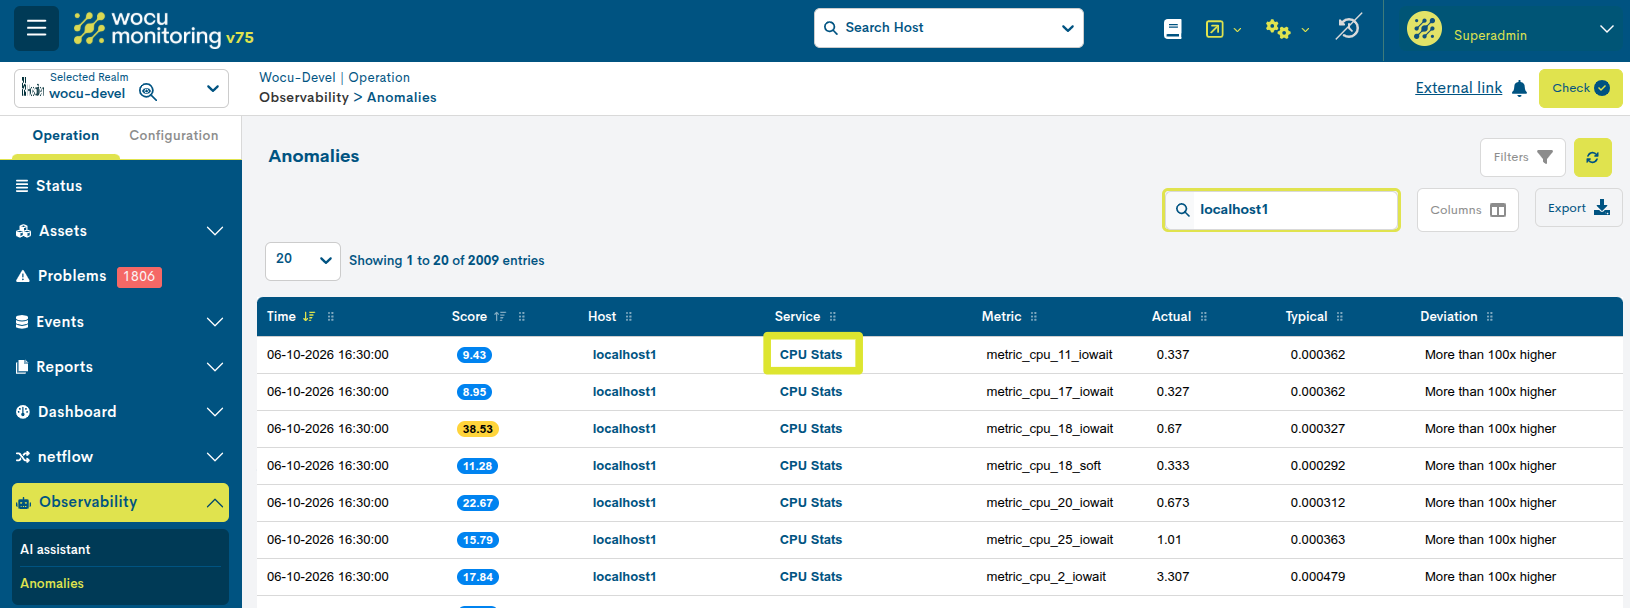
This view functions similarly to the one described for the hosts, but focuses the analysis exclusively on the selected service. This allows the user to view the anomalous behavior of the metrics associated with that service within a specific time interval.
Therefore, the main difference compared to the anomaly view of a device is the analysis context: while in the device view it is possible to select between its different services and metrics, in the Service view the analysis is previously limited to the service from which it is accessed.
Action Ask IA about a problem
Attention
This action will be available when the Realm has the Observability enabled and anomaly analysis is configured for the metrics of the selected host or service.
The Ask AI about a problem action allows you to request an AI-assisted diagnosis on a monitored Host, Service, or Problem, using the WOCU-Monitoring AI Assistant.
Its objective is to facilitate the understanding of an incident through the analysis of the state of the selected element and the operational information available in WOCU-Monitoring and Elastic Observability.
What is it for?
In the event of an incident, this action provides an interpretationautomatic status of the monitored element, helping the operator tounderstand what is happening, identify possible causes and determinethe next steps for your diagnosis.
The analysis uses contextual information such as the Host or Service state, the last check performed, the plugin output, the business impact, and the observability data available in Elastic.
Unlike the Action Root Cause Analysis (RCA), which is geared towards correlating events and information from different sources to investigate the origin of an incident, Ask IA about a problem focuses on offering an explanation and recommendations about the specific problem selected.
For example, when a Service is in a CRITICAL state due to high CPU consumption,the action can explain the detected state, interpret the information returned by the check, and recommend further checks to investigate the problem.
How is it used?
This option is available in the listings of Hosts, Services and Problems, within the menu of actions applicable to each item.
To run an analysis:
Locate the Host, Service, or Problem you want to analyze and select the Ask IA about a problem** option from the actions menu.
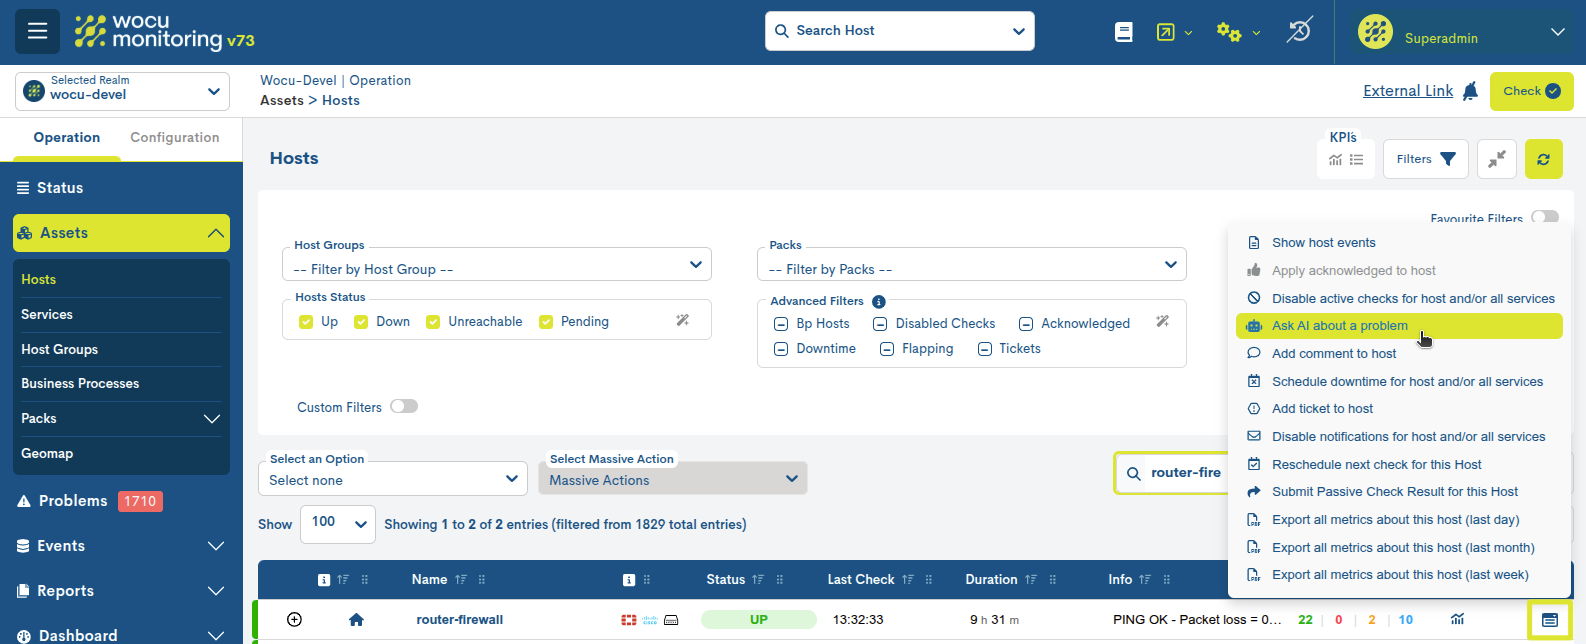
WOCU-Monitoring will use the operational and observability information available to generate a contextual diagnosis of the selected element.
Once the analysis is generated, a diagnostic window will be displayed with the results provided by the AI Assistant.
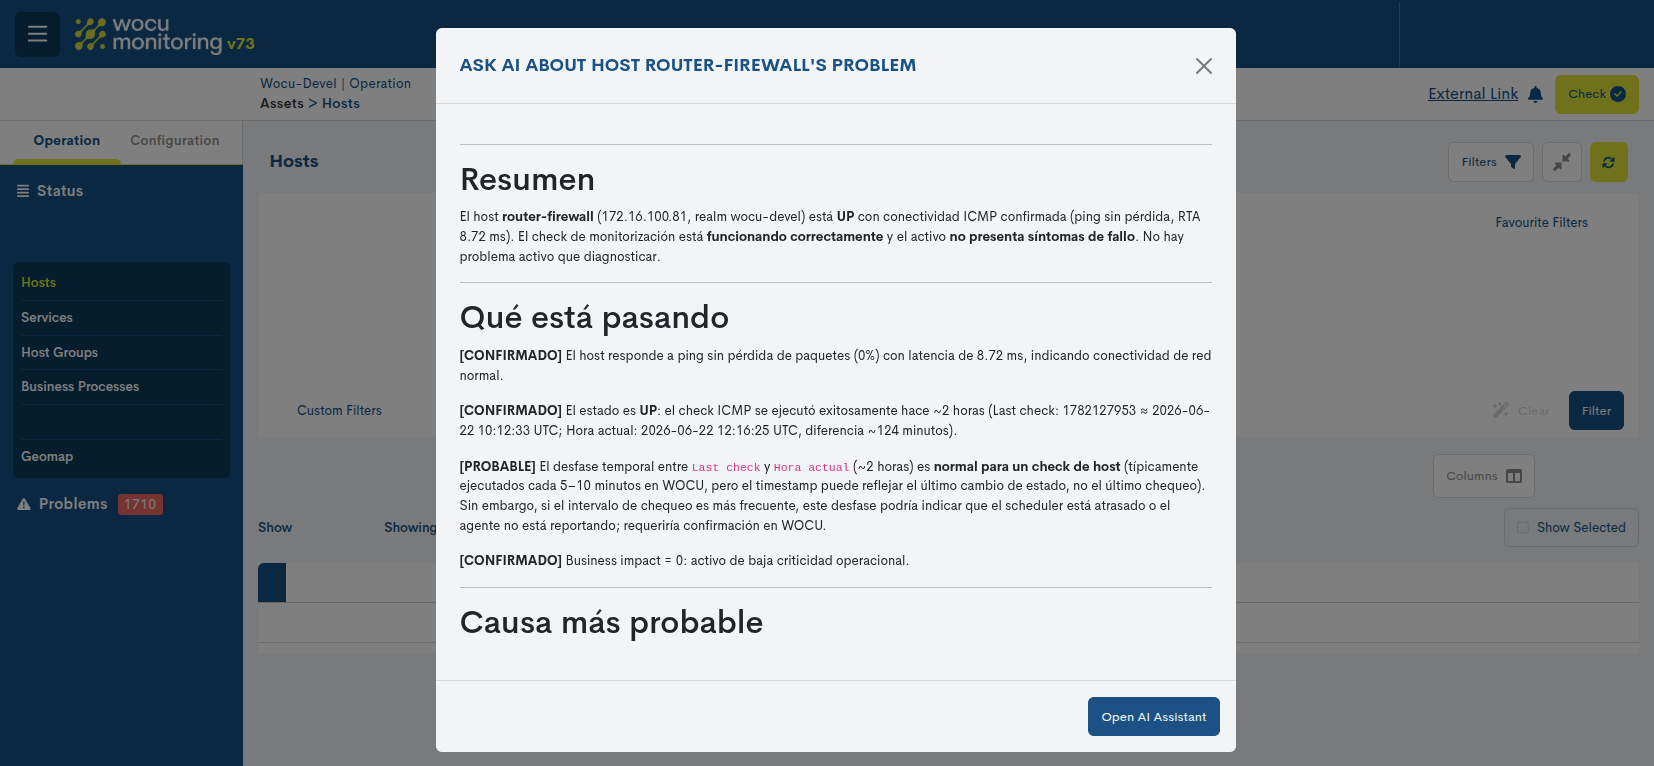
The diagnosis may include:
Summary of current status: general description of the situation of the monitored element.
What’s going on?: Explanation of the behavior or problem detected.
Probable cause: interpretation of the possible reasons for the incident.
Diagnostic Information: Relevant data and recommended commandsfor performing additional checks.
Recommended next step: proposed course of action to continue the investigation.
The result should be used to support the diagnosis, allowing the operator to interpret the available information and guide the necessary checks to confirm the cause of the incident.
Continue the research with the AI Assistant
From the results window, you can select Open AI Assistant to continue the analysis by having a conversation with the WOCU-Monitoring AI Assistant.
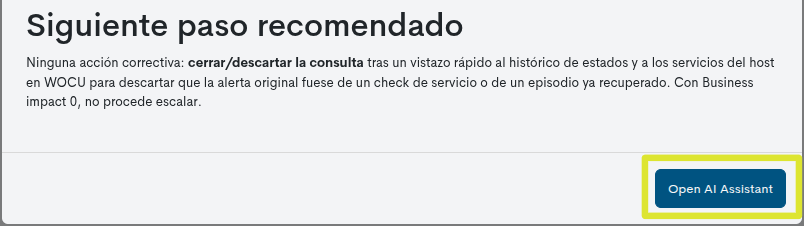
By selecting this option, the user accesses the view Observability > AI Assistant, where the context of the diagnosis performed is loaded.
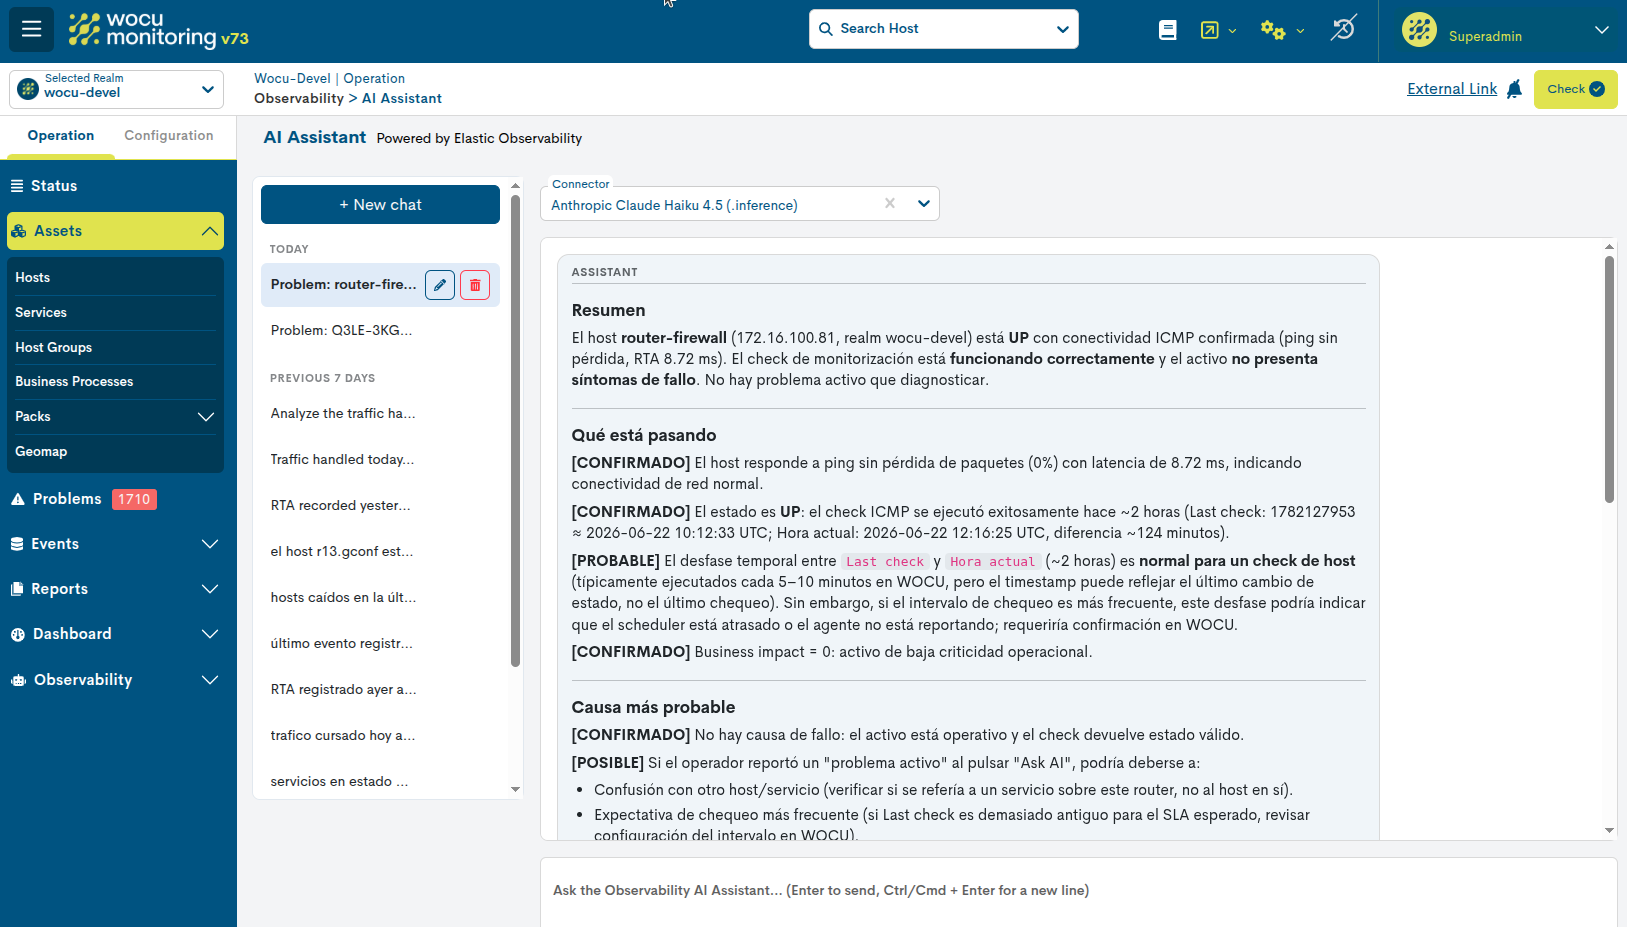
From this conversation, the operator can ask additional questions, request clarifications about the diagnosis, delve deeper into the possible causes, or ask for recommendations to continue the investigation.
Considerations and limitations
The Ask IA about a problem functionality requires that the Realm have a properly configured Elasticsearch backend and the Observability module.
This action does not modify the status of the monitored elements nor does it make changes to the infrastructure. Its sole purpose is to facilitate the diagnosis and interpretation of incidents.
Action Root Cause Analysis (RCA)
Attention
This action will be available when the Realm has the Observability enabled and anomaly analysis is configured for the metrics of the selected host or service.
The Root Cause Analysis (RCA) action allows you to perform an automatic root cause analysis on a monitored Host or Service, using the WOCU-Monitoring IA Assistant.
Its objective is to facilitate the diagnosis of incidents by gathering and correlating the information available from the various observability sources in the Kingdom to try to identify what may have caused the problem and what events may be related to each other. To do this, the analysis may use information from Metrics, Monitoring, Syslogs, and Traps.
What is it for?
In the event of an incident, the user may have access to information scattered across metrics, monitoring events, logs, or traps. The RCA action centralizes this context and analyzes it together, helping to reduce the time needed to manually investigate each source.
Unlike the Action Ask IA about a problem, which focuses on analyzing a specific problem,this action looks for relationships between different events and available data around the device, to determine the most likely origin of the incident.
For example, when a Service is in a CRITICAL state due to a high CPU load, the analysis could relate that state change to a previous increase in certain metrics, messages logged in Syslog, or events detected in the same time interval.
How is it used?
This option is available in the listings of Hosts, Services and Problems, within the menu of actions applicable to each item.
Note
When the action is performed on a Host, it acts as the main elementaround which all the retrieved information is correlated.
If the analysis is initiated from a Service, WOCU-Monitoring continues to use the associated Host as the primary correlation link, but prioritizes information related to the selected Service.
To run an analysis:
Locate the Host or Service experiencing the issue and select the Root Cause Analysis option from the actions menu.
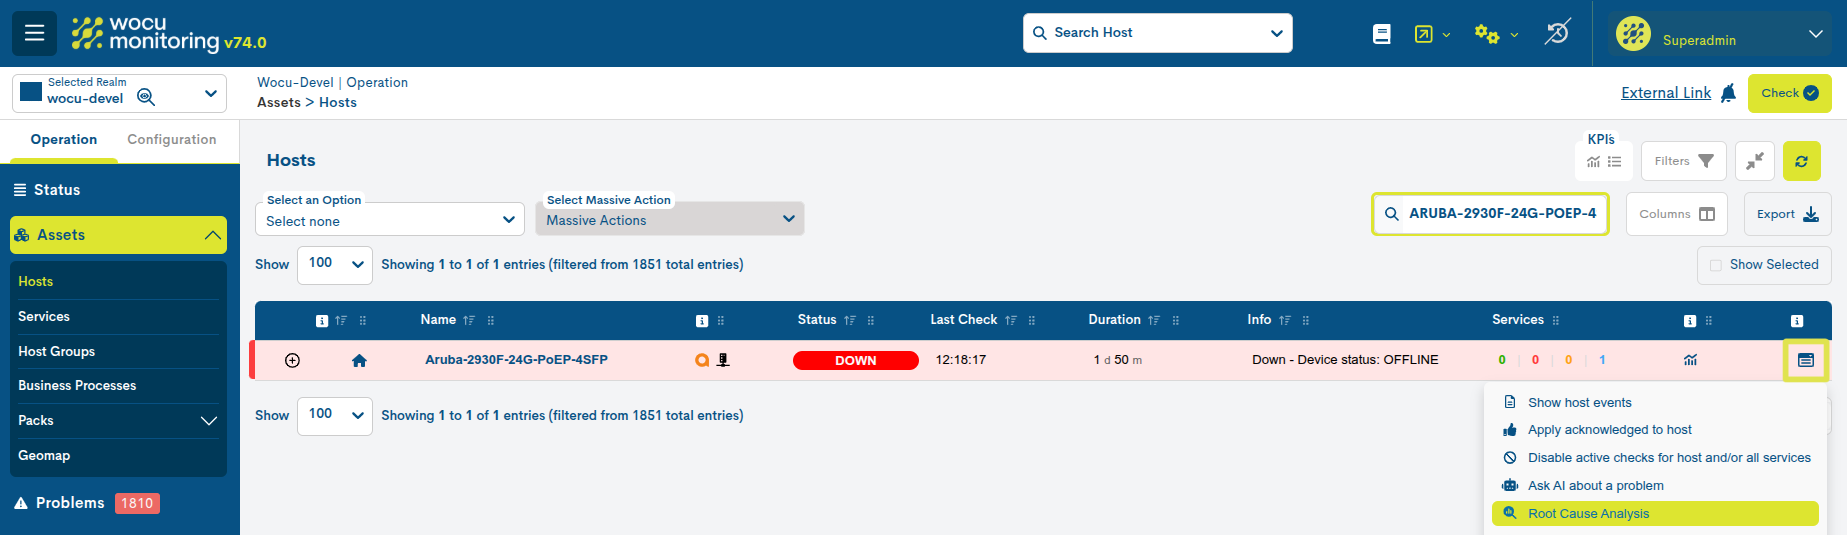
WOCU-Monitoring will collect the available information and perform the analysis.
Once completed, a diagnostic window will be displayed with the result generated by the AI Assistant. The result may include a summary of the problem, the chronology of related events, a possible causal chain, the sources of information used, and recommendations or checks to continue the investigation.
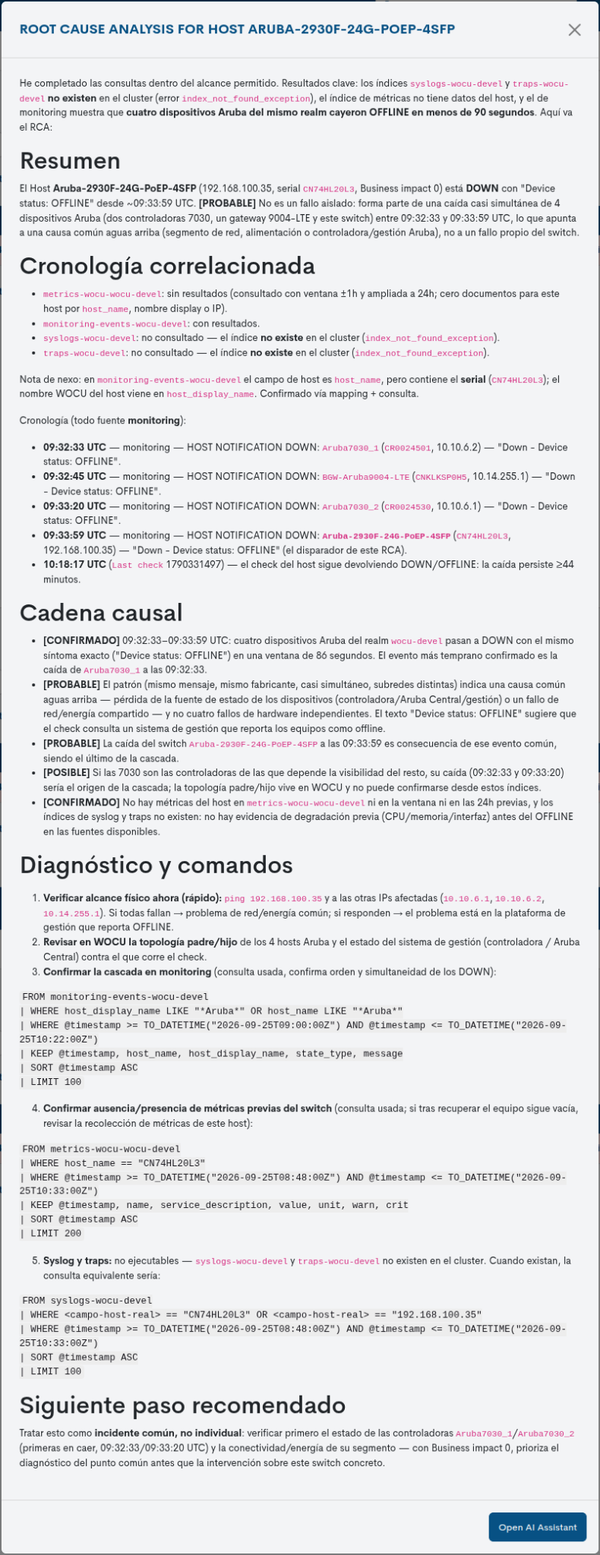
The result provided by RCA should be used to support the diagnosis, allowing the operator to have additional context and guide the subsequent checks necessary to confirm the cause of the incident.
Continue the research with the AI Assistant
From the results window itself, you can select Open AI Assistant to continue the analysis by having a conversation with the :ref:`ia_assistant`and asking additional questions about the diagnosis obtained.
This option allows you to ask additional questions about the diagnosis obtained, request clarifications, or delve deeper into certain events or evidence detected during the RCA analysis.
Considerations and limitations
The Root Cause Analysis functionality requires that the realm has a properly configured Elasticsearch backend and the Observability.
Forecast in Metrics
The Metrics view incorporates the Forecast functionality, which allows you to visualize an estimate of the future evolution of a metric based on the historical data available in WOCU-Monitoring. The forecast can extend up to one additional day beyond the viewed time period and is displayed directly on the metric’s graph.
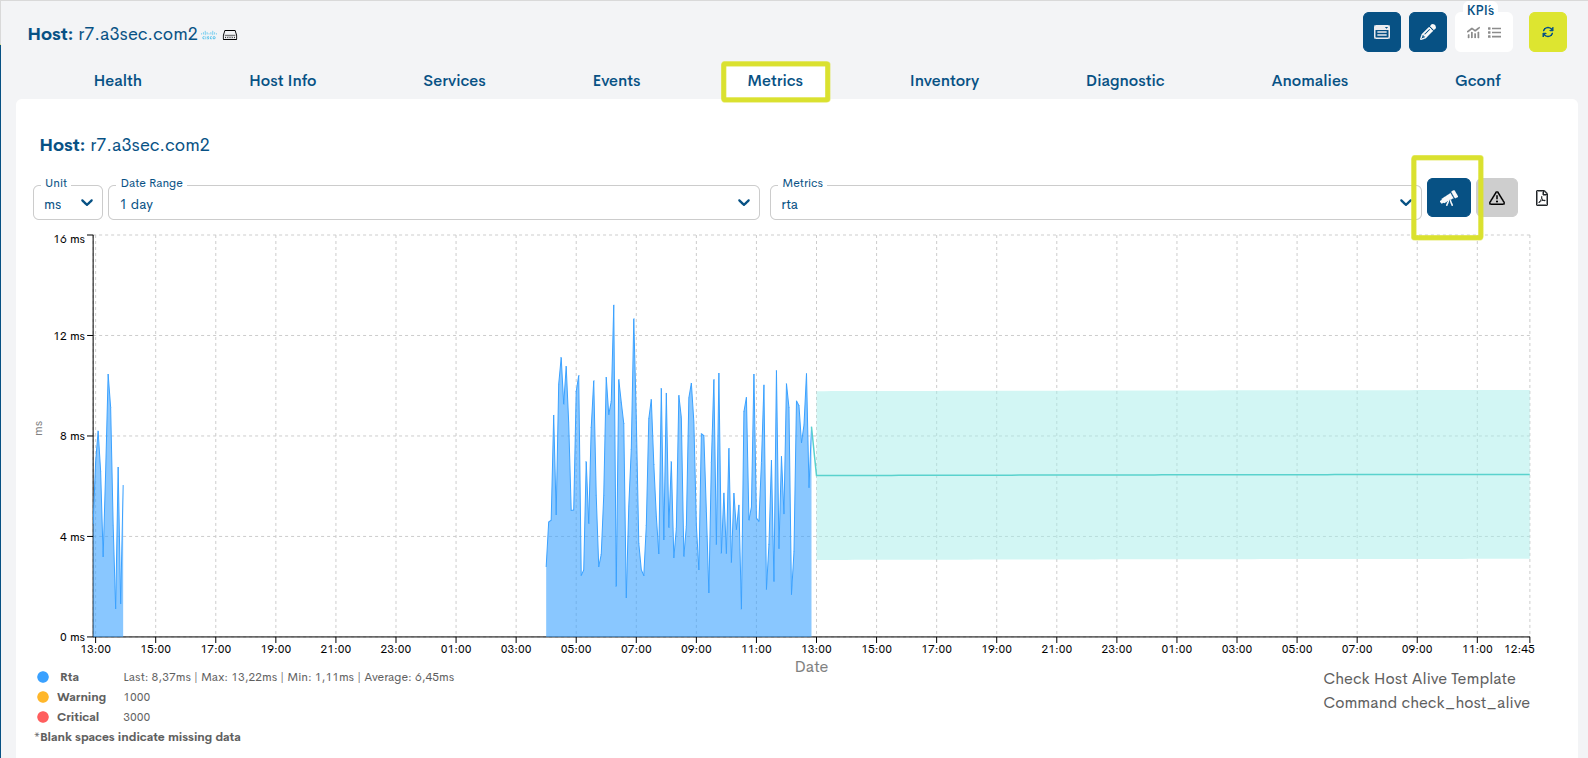
Forecast is designed to facilitate more proactive monitoring of the monitored resources. Instead of only analyzing what has already happened, it allows you to observe the expected trend of a metric and anticipate possible anomalous behavior or approaches to Warning or Critical levels.
For example, if a CPU utilization metric shows an upward trend, Forecast allows you to visualize how it might evolve over the next few hours and assess whether there is a risk of approaching the configured thresholds. The prediction should be interpreted as an estimate based on observed behavior, and not as an actual value already recorded by the system.
Note
More information on how it works and how to use it can be found at the following link: Metrics Forecast.