Specific views of the monitored infrastructure
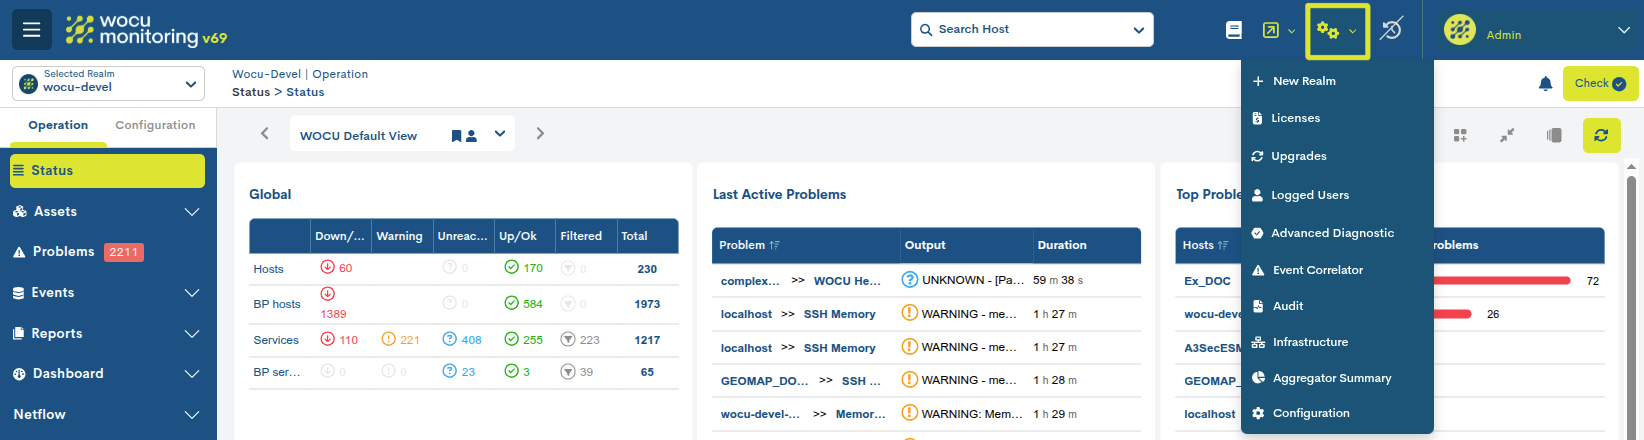
It is accessed from the Settings dropdown, present in the Top Menu.
Infrastructure
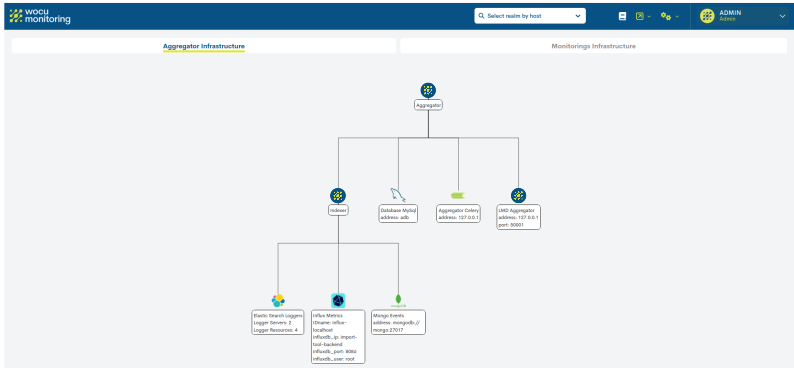
An interactive and informative module that summarises and maps the various elements/nodes that WOCU-Monitoring has deployed at the time of the query.
This feature provides a comprehensive, integrated overview of the various components that make up the monitored network infrastructure, making it an invaluable tool for solution administrators.
You can expand and collapse nodes to make navigating the nested tree easier and to track the various hierarchical levels. Simply click on a specific node to hide or expand its child nodes.
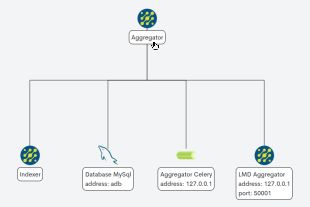
Icons representing the technologies used are employed to depict and identify nodes.
The section is divided into two distinct areas:
Aggregator Infrastructure
This view shows all services related to the aggregation console (Aggregator), which hosts components such as databases, metric indexing systems, log collectors, etc.
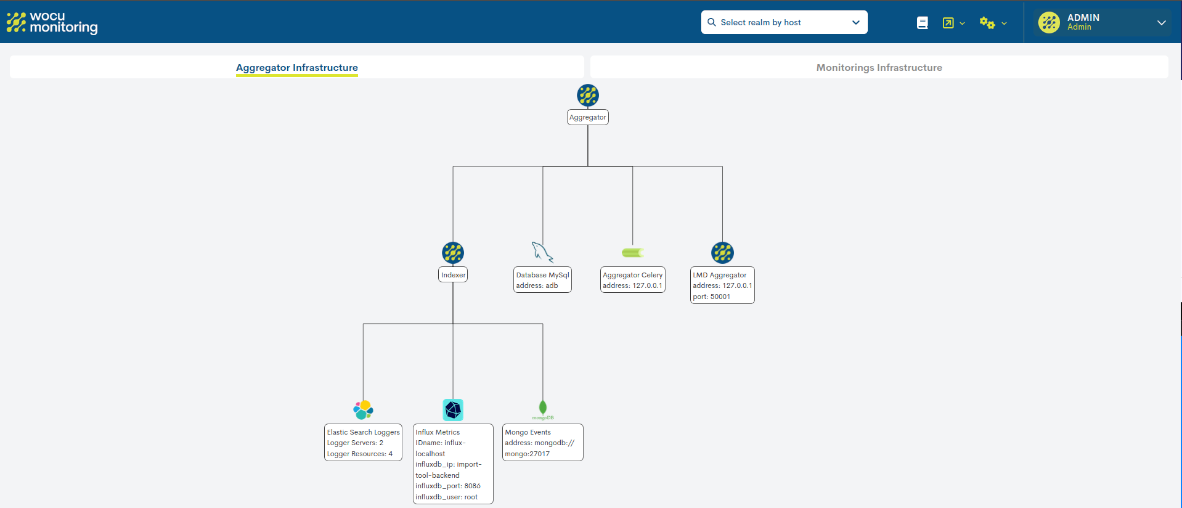
Monitoring Infrastructure
This view displays all the services for each Monitoring (Import-Tool) managed within the solution.
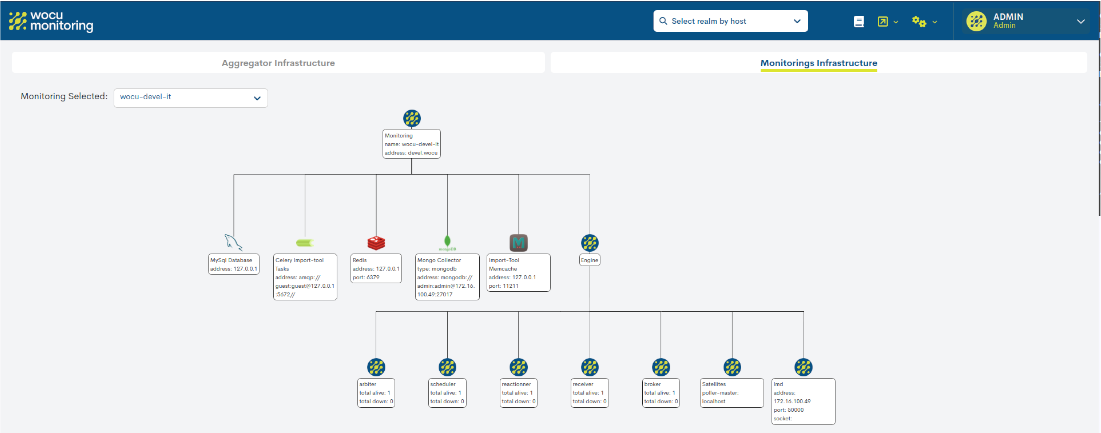
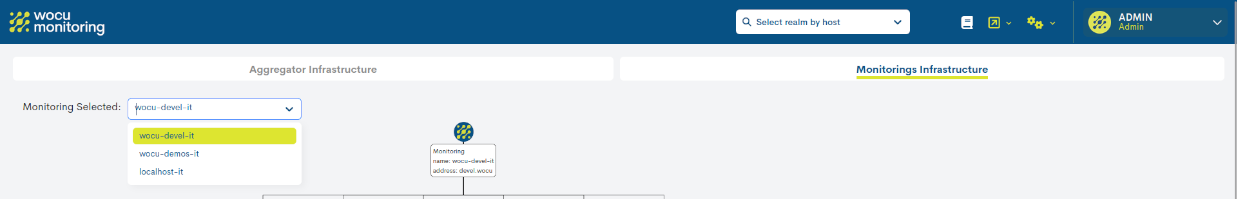
A selector is available to navigate between the different monitors (Monitorings) and view the details of each one’s infrastructure.
Although the representation is fairly basic, it provides a comprehensive overview that can identify non-operational components which may be affecting the stability of the monitored infrastructure.
Audit
A standalone module designed to provide a detailed record of actions carried out in WOCU-Monitoring, tracking all changes made to asset configurations and updates recorded by the system, with the aim of facilitating a subsequent audit of the processed data.
Attention
This module will only be available to Administrators (Super-admins).
In this new tab, you will find two different sections:
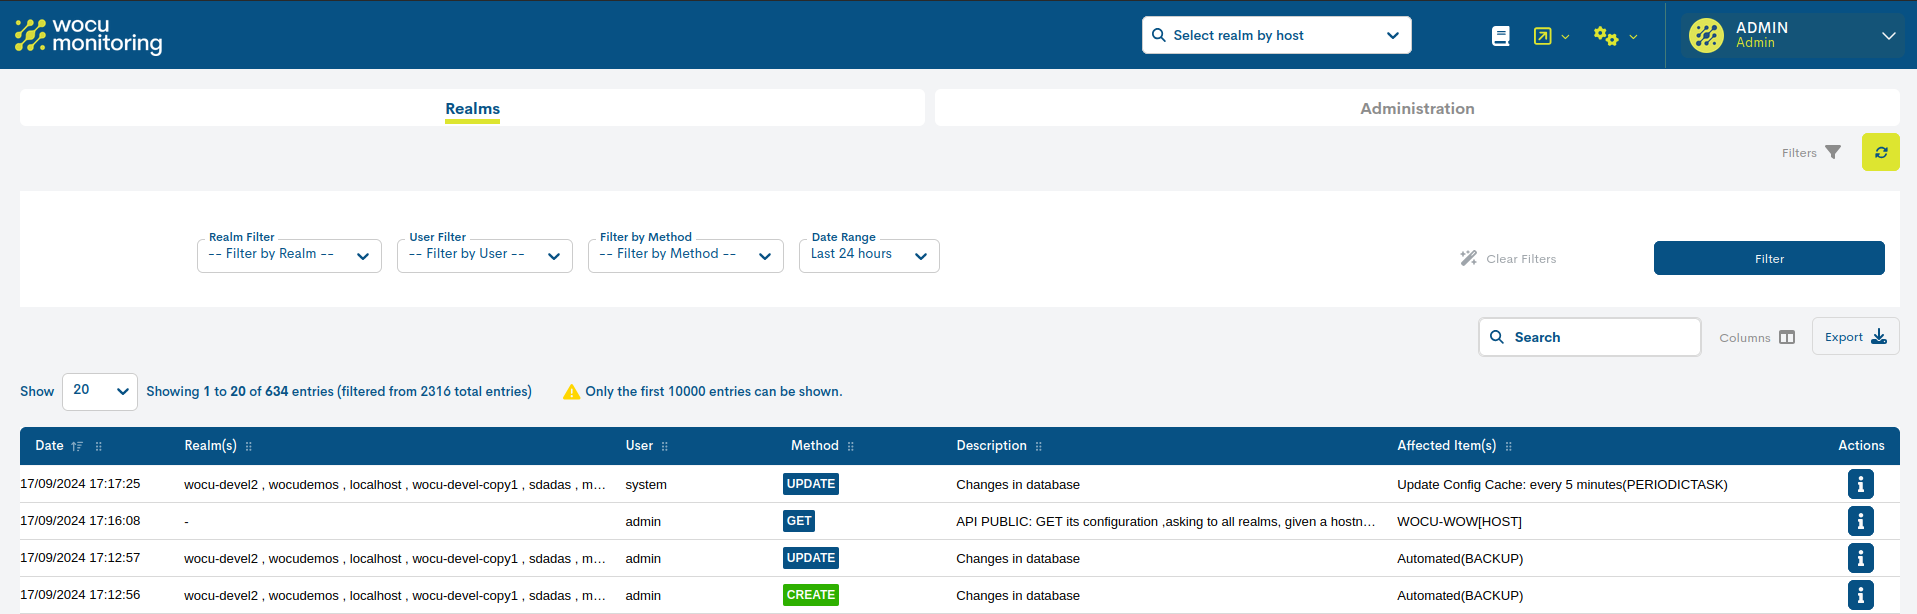
Realms
This section displays all the actions and operations carried out on Realms; in other words, it provides the information that is audited at the Realm level.
Note
As stated in the text: Only the first 10,000 entries can be displayed, only the first 10,000 entries will be displayed, in order to streamline the process and reduce the computational load of queries.
Table columns/fields
The fields at the top of the table are described below:

✓ Date: the exact date and time when the action was recorded in the system, and consequently, a significant event occurred in the functioning and internal operation of the infrastructure.
✓ Realm: an entity or set of entities where the action has been recorded.
✓ User: the user profile that performed the action logged in the infrastructure.
Note
There is a user called System, which runs automatic and scheduled tasks managed within the application (such as Import Tasks (Tasks), schedule_report, etc.). This user is assigned when there is no specific user associated with the action performed.
✓ Method: indicates the method used, depending on the origin or nature of the audited action. It is categorised as follows:
Changes made at the database level, i.e. operations carried out in a specific realm via its Basic Configuration Module (Import-Tool).
These are:
CREATE
UPDATE
DELETEAudited requests based on the HTTP protocol.
GET
POSTRelating to automated processes that have been run (such as schedule_report and Import Tasks (Tasks)). Some of the available options are:
SCHEDULED <Name> REPORT: Scheduled Availability Report, Scheduled Multimetrics Report, Top Hosts Report, etc.
<Name> REPORT: Availability Report, Multimetrics Report, Top Hosts Report, etc.
SNMP IMPORT
CSV IMPORT
SNMP IMPORT INVENTORYNote
There is a filter called Filter by Method that allows you to filter the table by HTTP requests (Requests), database queries resulting from configuration changes (Changes in configuration), or automated processes (Automatic Process).
✓ Description: contains a general description of the recorded transaction.
✓ Affected Item(s): the type of asset affected by the action taken. There are many different types of items stored in the database (HOST, SERVICES, REPORTS, etc.).
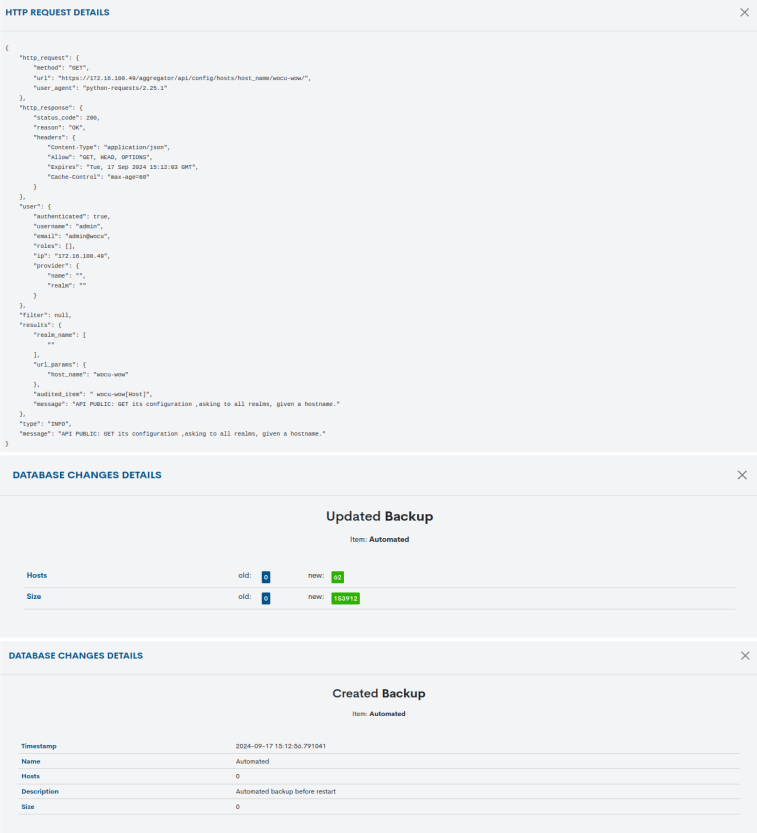
✓ Actions: provides detailed information about the characteristics of the action performed on an object.
Note
The text displayed in any of the columns may exceed the available space; in this case, the text will be truncated at the end of each column, followed by an ellipsis (…) to indicate that the text continues but has been cut off. However, you can view the full text by hovering your cursor over it.
Available data filters
You can filter the items in the table using the following drop-down menus:
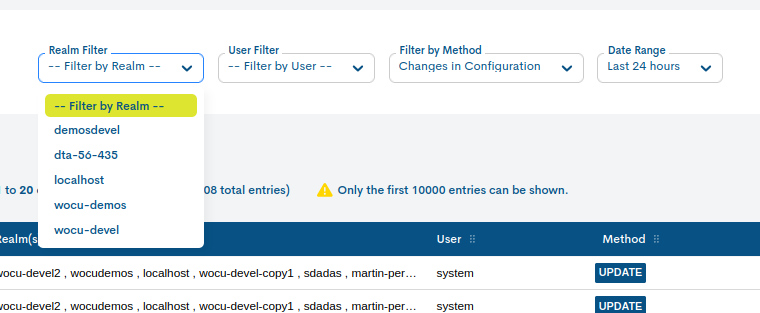
✓ Realm Filter: this selector lists all the realms managed within the infrastructure. Once one has been selected, the table will be filtered to show only the operations performed on those systems.
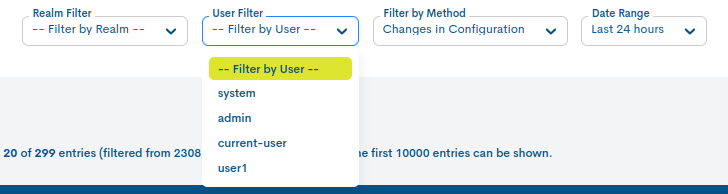
✓ User Filter: this selector lists all users registered in the system. Once a user has been selected, the table will be filtered to show only the operations performed by that user.
✓ Filter by Method: this selector lists all possible methods, categorised according to the origin or nature of the action:
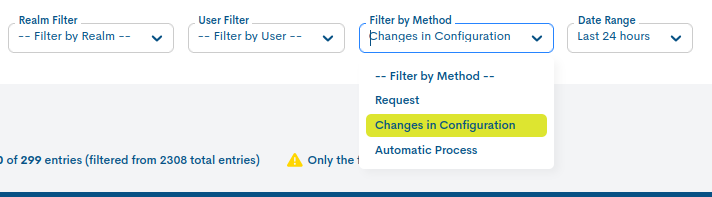
Changes in configuration: this covers changes made at the database level, i.e. operations carried out in a specific realm via its basicconfiguration module (Import-Tool).
These are:
CREATE
UPDATE
DELETERequest: refers to audited requests based on the HTTP protocol.
GET
POSTAutomatic Process: relating to automatic processes that are executed (such as schedule_report and Import Tasks (Tasks)). Some of the available options are:
AUTOMATIC REPORT
AUTOMATIC SCHEDULED REPORT
SNMP IMPORT
CSV IMPORT
SNMP IMPORT INVENTORY✓ Date range: audited actions can be filtered based on the dates on which they were recorded. A date filter is used for this purpose.
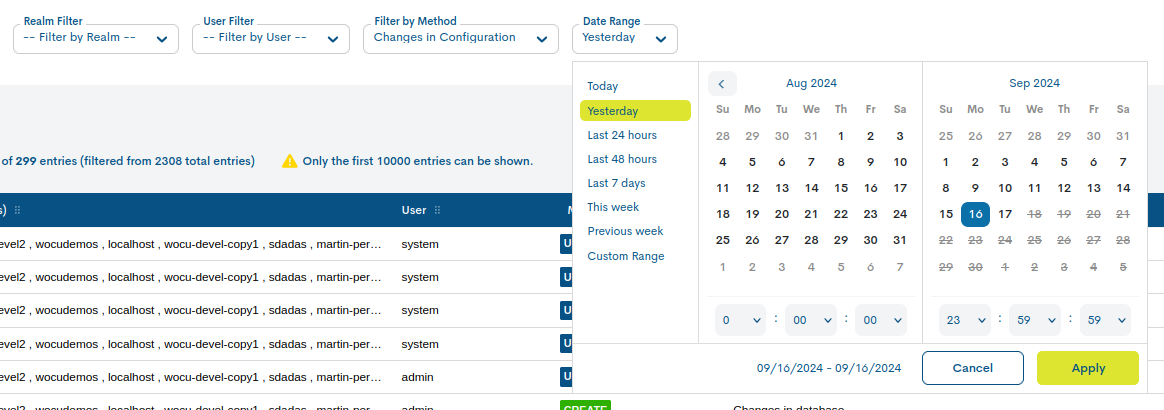
There are several predefined time-based criteria for filtering actions:
Today: filters and displays only the audited actions generated during the time elapsed so far today.
Yesterday: actions recorded yesterday.
Last 24 hours: actions recorded in the last 24 hours.
Last 48 hours: actions recorded in the last 48 hours.
Last 7 Days: actions recorded over the last seven days.
This Week: actions recorded during the period spanning the current week (from the start of the week to today).
Previous Week: events recorded during the previous full week (Monday–Sunday).
If you wish to set a specific time period, you can use the Custom Range option. To configure the time frame, you need to set a start date and an end date. Clicking on one of the days will select that date, which will be highlighted with a blue background. In addition to the day, you can set a specific time for that day; to do this, use the drop-down menus in the hour, minute and second fields to set the desired time.
Attention
To streamline queries and reduce the computational load, filtering items by date range is limited to a maximum of seven days; in other words, the defined range cannot exceed this interval (seven days).
Naturally, it is not possible to select start and end dates that are later than the current date, nor to set an end date that is earlier than the start date.
Exporting the list of items
The two buttons next to the Search bar, CSV and JSON, make it easy to export data in both formats for further processing or use.
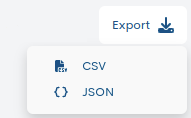
CSV
Clicking the relevant button will open a new modal window where you can select and tick the parameters to be exported according to your preferences. The available options are:
Date (Required)
Realm
User (Required)
Method
Description
Affected Item (Obligatorio)
Details
Once the selection has been confirmed, a file in CSV (Comma Separated Value) format begins to download. This is a very simple format that organises columns using a separator (semicolon “;”) and rows using a line break.
JSON
This alternative option follows the same procedure as the previous example, but begins by downloading a file in JSON (JavaScript Object Notation) format, a lightweight data exchange format that can be read by any programming language and is therefore suitable for exchanging information between different technologies.
In both cases, the system will allow you to select the directory where the generated inventory file is to be downloaded and stored, and to give it a different name.
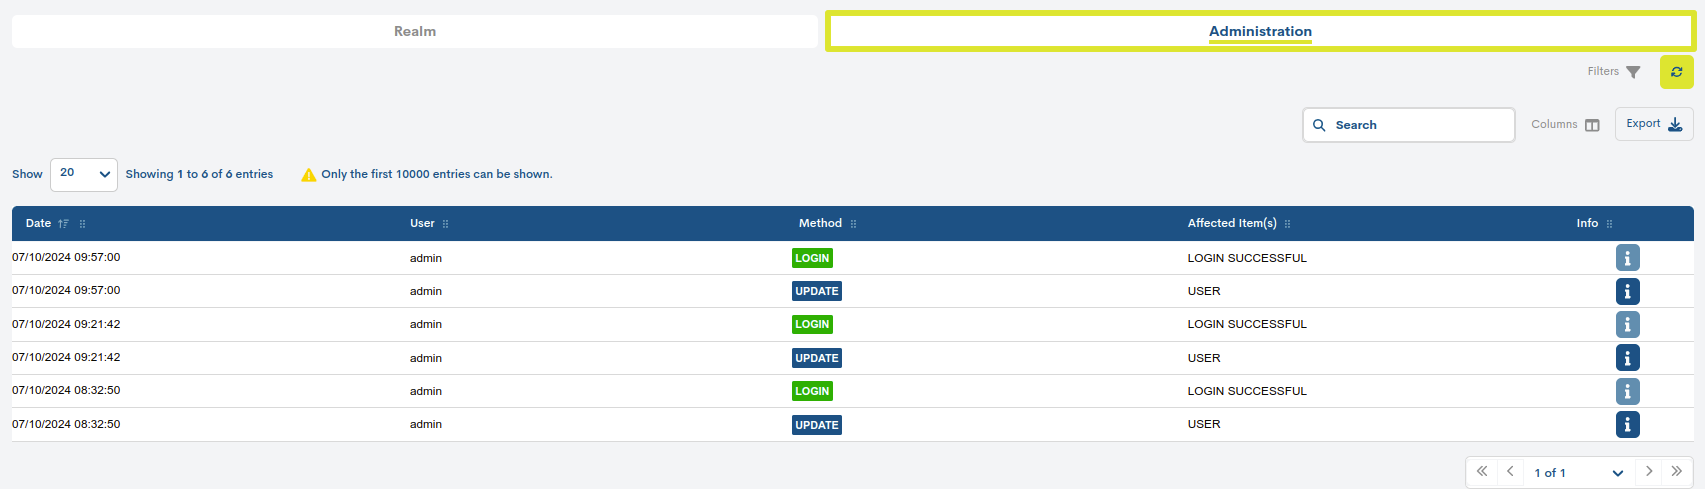
Administration
In this section, you can view all changes made at the administration level (rather than at the Realm level) within the application, whether in the Advanced Configuration Module or Login Control (including failed attempts) or WOCU-Monitoring administration: adding, removing or modifying Realms, loggers, metrics, creating and assigning users, etc.
Note
As stated in the text: Only the first 10,000 entries can be displayed, only the first 10,000 entries will be displayed, in order to streamline the process and reduce the computational load of queries.
Table columns/fields
The fields at the top of the table are described below:

✓ Date: the exact date and time when the action was recorded in the system, and consequently, a significant event occurred in the functioning and internal operation of the infrastructure.
✓ User: the user profile that performed the action logged in the infrastructure.
Note
There is a user called System, which runs automatic and scheduled tasks managed within the application (such as Import Tasks (Tasks), schedule_report, etc.). This user is assigned when there is no specific user associated with the action performed.
✓ Method: indicates the method used, depending on the origin or nature of the audited action. It is categorised as follows:
Changes made at the database level, i.e. operations carried out in the Basic Configuration Module (Import Tool).
These are:
CREATE
UPDATE
DELETEAudited requests based on the HTTP protocol.
GET
POSTNote
There is a filter called Filter by Method that allows you to filter the table by HTTP requests (Requests) or database queries resulting from changes to the configuration (Changes in configuration).
✓ Affected Item(s): the type of asset affected by the action taken. There are many different types of items stored in the database (HOST, SERVICES, REPORTS, etc.).
✓ Actions: provides detailed information about the characteristics of the action performed on an object.
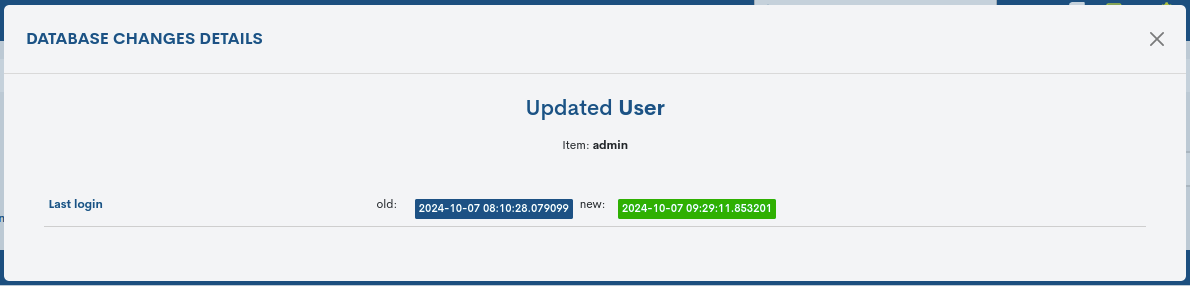
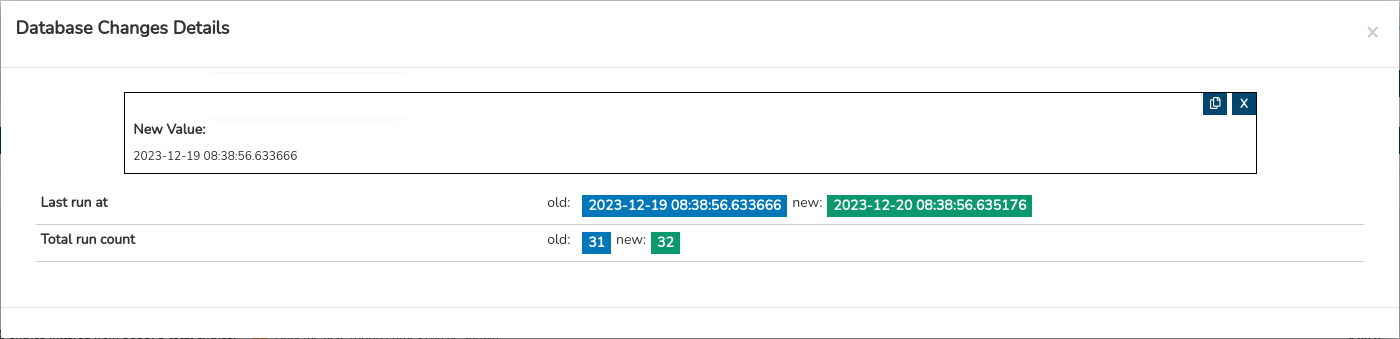
Note
Clicking on any of the dates marked with the labels Old or New will bring up a new information box displaying the full text. The view also includes a copy-to-clipboard function (located in the top-right corner), making it easy to copy data with a single click.
Available data filters
You can filter the items in the table using the following drop-down menus:
✓ User Filter: this selector lists all users registered in the system. Once a user has been selected, the table will be filtered to show only the operations performed by that user.
✓ Date range: audited actions can be filtered based on the dates on which they were recorded. A date filter is used for this purpose.
There are several predefined time-based criteria for filtering actions:
Today: filters and displays only the audited actions generated during the time elapsed so far today.
Yesterday: actions recorded yesterday.
Last 24 hours: actions recorded in the last 24 hours.
Last 48 hours: actions recorded in the last 48 hours.
Last 7 Days: actions recorded over the last seven days.
This Week: actions recorded during the period spanning the current week (from the start of the week to today).
Previous Week: events recorded during the previous full week (Monday–Sunday).
If you wish to set a specific time period, you can use the Custom Range option. To configure the time frame, you need to set a start date and an end date. Clicking on one of the days will select that date, which will be highlighted with a blue background. In addition to the day, you can set a specific time for that day; to do this, use the drop-down menus in the hour, minute and second fields to set the desired time.
Attention
To streamline queries and reduce the computational load, filtering items by date range is limited to a maximum of seven days; in other words, the defined range cannot exceed this interval (seven days).
Naturally, it is not possible to select start and end dates that are later than the current date, nor to set an end date that is earlier than the start date.
Exporting the list of items
The two buttons next to the Search bar, CSV and JSON, make it easy to export data in both formats for further processing or use.
CSV
Clicking the relevant button will open a new modal window where you can select and tick the parameters to be exported according to your preferences. The available options are:
Date (Required)
User (Required)
Method
Description
Affected Item (Obligatorio)
Details
Once the selection has been confirmed, a file in CSV (Comma Separated Value) format begins to download. This is a very simple format that organises columns using a separator (semicolon “;”) and rows using a line break.
JSON
This alternative option follows the same procedure as the previous example, but begins by downloading a file in JSON (JavaScript Object Notation) format, a lightweight data exchange format that can be read by any programming language and is therefore suitable for exchanging information between different technologies.
In both cases, the system will allow you to select the directory where the generated inventory file is to be downloaded and stored, and to give it a different name.
Aggregator Summary
This is a platform designed to provide a comprehensive overview of the monitored infrastructure, based on the nature, connectivity and configuration of domains and member assets, at the time of the query.
This module stands out for its ability to translate the complexity of the infrastructure into clear, intuitive sectoral charts, which greatly simplifies the interpretation of key data.
Attention
The data will vary depending on the location from which the Aggregator Summary view is accessed.
If accessed from a specific Realm (section Dashboards), the data is collected from the assets within that Realm; if, on the other hand, it is accessed from the Settings in the global view, the data covers the entire monitored infrastructure.
Due to its length, the module is divided into four main sections:

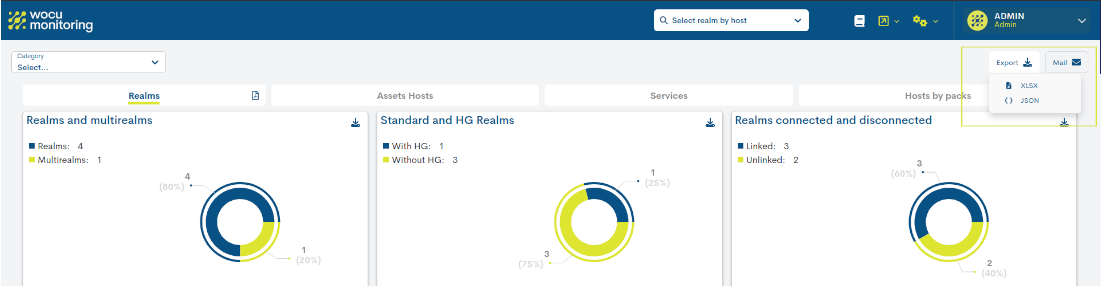
Realms
This view is divided into three widgets, whose charts illustrate the different types of realms (managed within the system) and their connectivity.
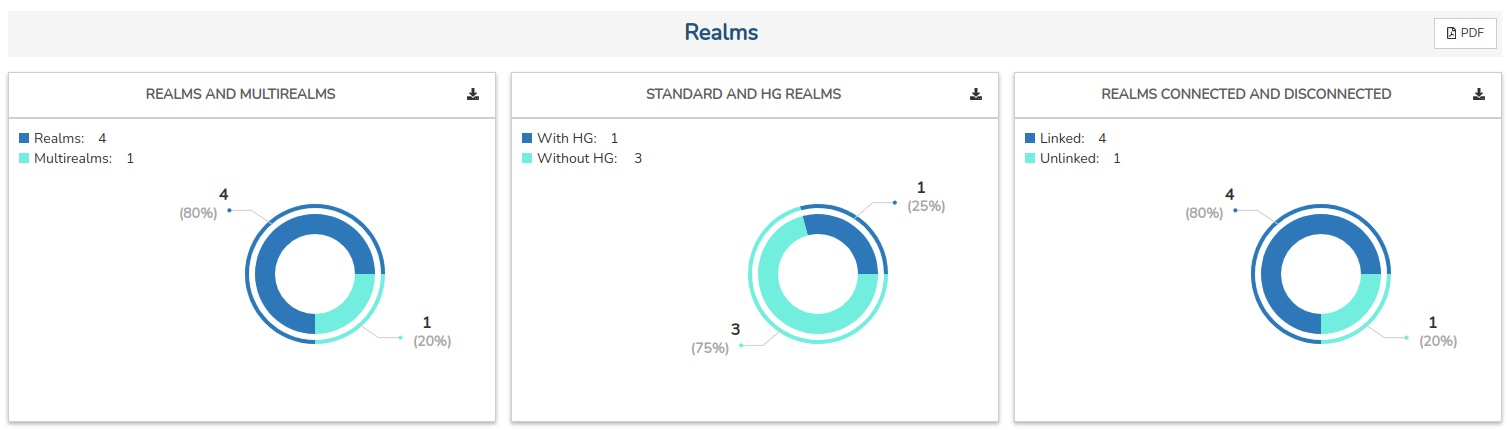
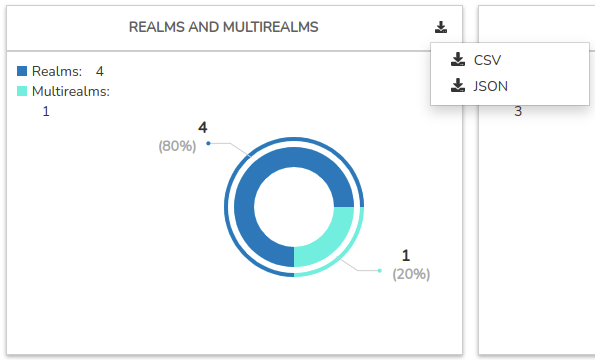
Realms and Multirealms
This ring diagram distinguishes between Multi-realms and the set of standard and Hostgroup-based realms that are being managed in WOCU-Monitoring.
Please use the legend to identify each category. The percentage and total figure are shown for each sector of the chart, making it easier to identify and interpret.

If you click on one of the sectors in the chart, a new window will appear showing a detailed list of the kingdoms that make up that category.
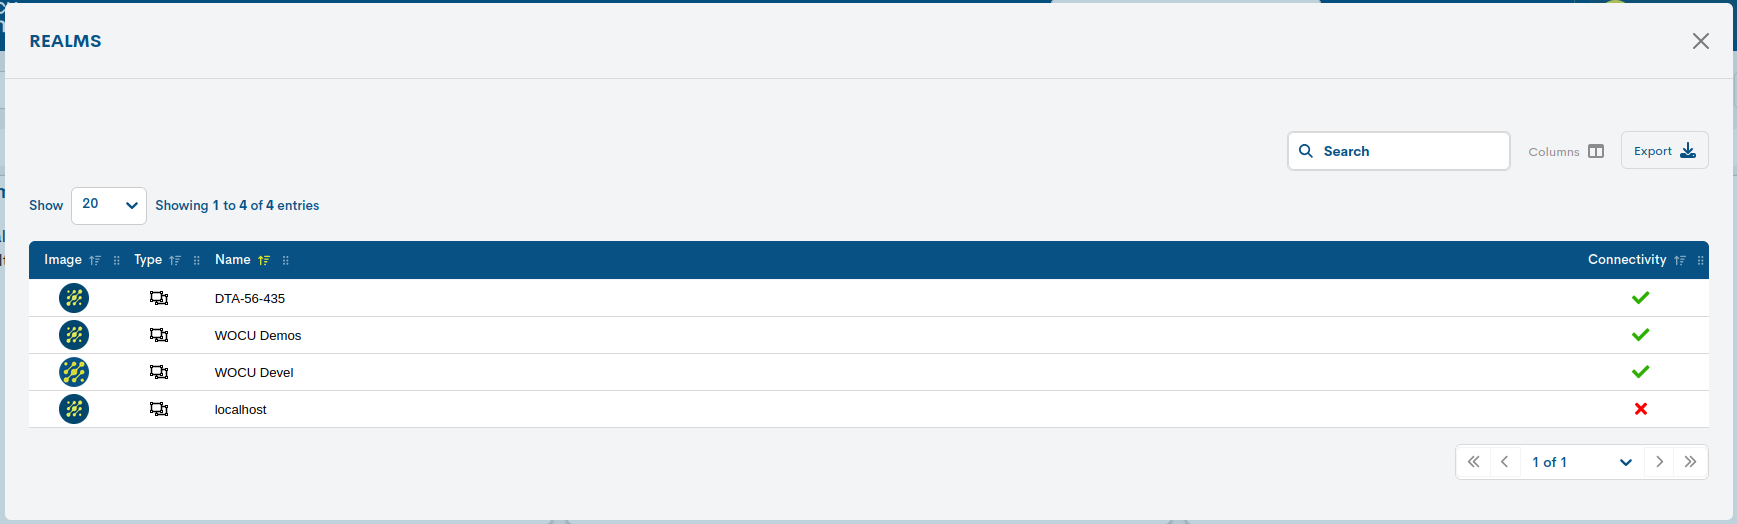
The following information is presented in tabular form:
Image: the Realm’s profile picture, visible on various screens and summary panels within the tool.
Type: indicates the type of realm via its representative icon.
Name: the Kingdom’s identifying name.
Connectivity: indicates the Kingdom’s status in terms of connectivity and availability.
Standard and HG Realms
This ring diagram distinguishes between realms based on host groups and standard realms, which are being managed in WOCU-Monitoring.
Please refer to the legend to identify each category. The percentage and total figure are shown for each sector of the chart, making it easier to identify and interpret.
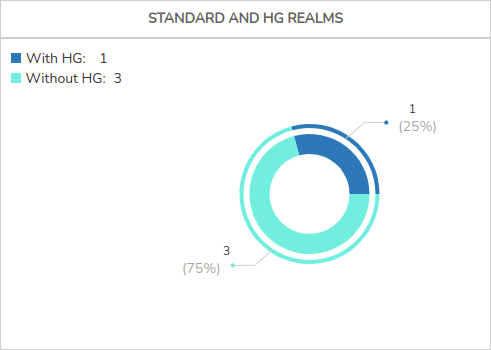
If you click on one of the sectors in the chart, a new window will appear showing a detailed list of the kingdoms that make up that category.
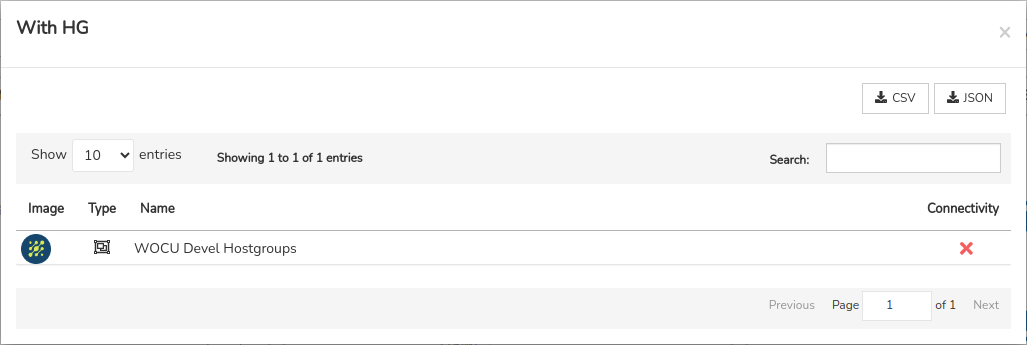
The following information is presented in tabular form:
Image: the Realm’s profile picture, visible on various screens and summary panels within the tool.
Type: indicates the type of realm via its representative icon.
Name: the Kingdom’s identifying name.
Connectivity: indicates the Kingdom’s status in terms of connectivity and availability.
Realms connected and disconnected
This ring diagram distinguishes between realms with connectivity (in terms of availability) and non-operational realms, where there is no communication between the plant’s devices and WOCU-Monitoring.
This panel takes into account all types of realms managed within the tool, whether they are standard, Hostgroup-based or multi-realm.
Please use the legend to identify each category. The percentage and total figure are shown for each sector of the chart, making it easier to identify and interpret.
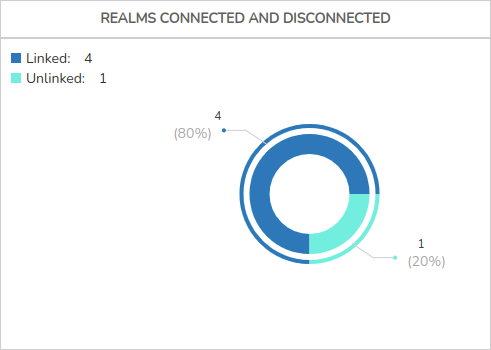
If you click on one of the sectors in the chart, a new window will appear showing a detailed list of the kingdoms that make up that category.
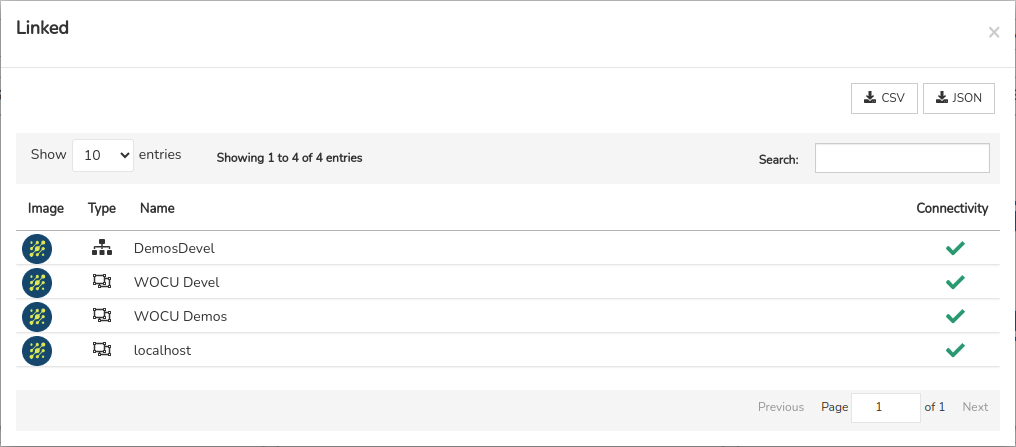
The following information is presented in tabular form:
Image: the Realm’s profile picture, visible on various screens and summary panels within the tool.
Type: indicates the type of realm via its representative icon.
Name: the Kingdom’s identifying name.
Connectivity: indicates the Kingdom’s status in terms of connectivity and availability.
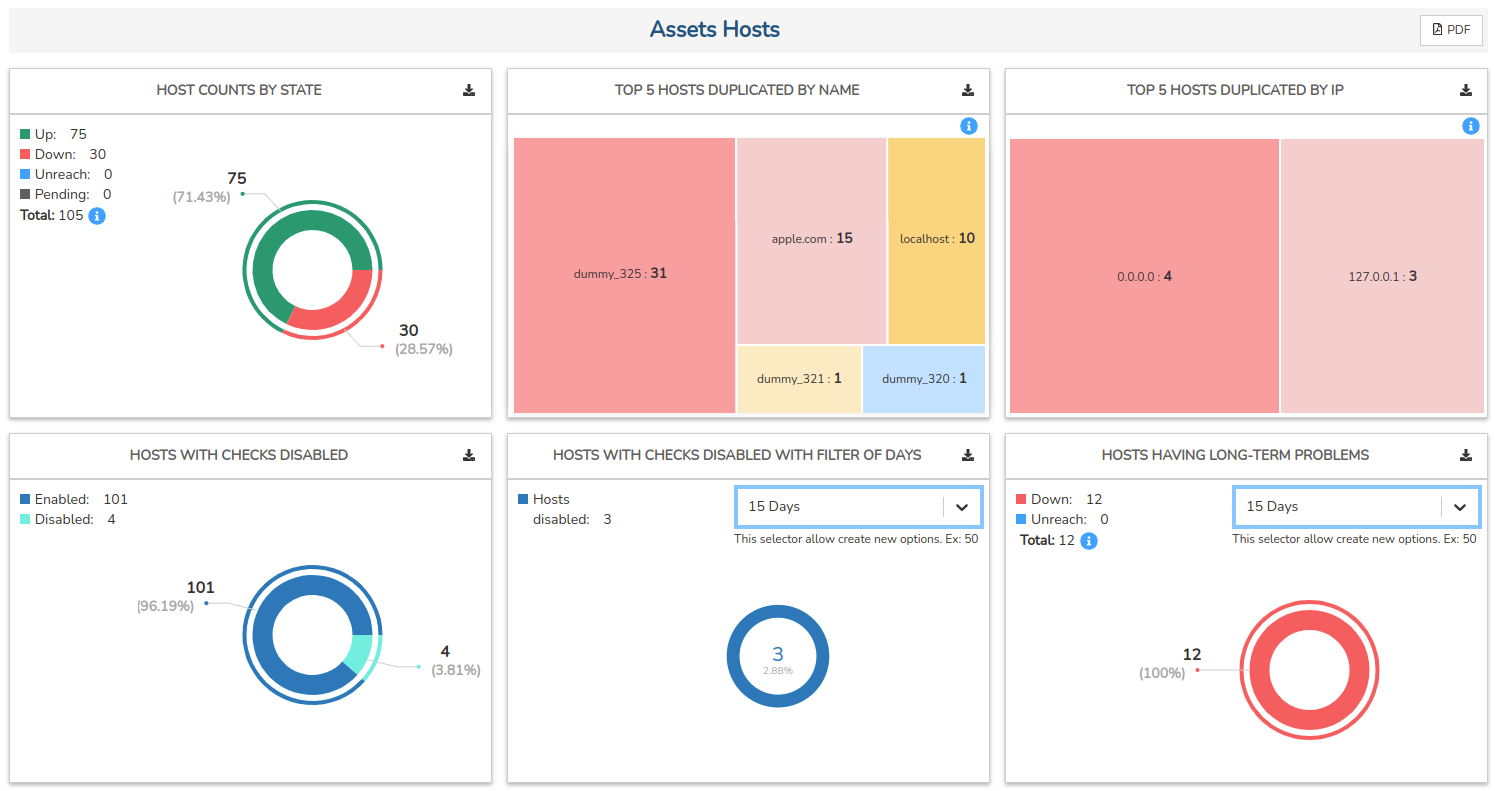
Assets Hosts
This view is divided into six widgets, whose charts distinguish between recorded monitoring statuses, devices duplicated by name and IP address, and those with checks disabled.
Host counts by State
This ring chart distinguishes between devices based on the type monitoring state they are in, as well as showing the total sum of all of them.
Please refer to the legend to identify each status type and the total number of devices displaying that status at the time of the query. Furthermore, each sector of the chart shows the percentage and total figure, making it easier to identify and interpret.
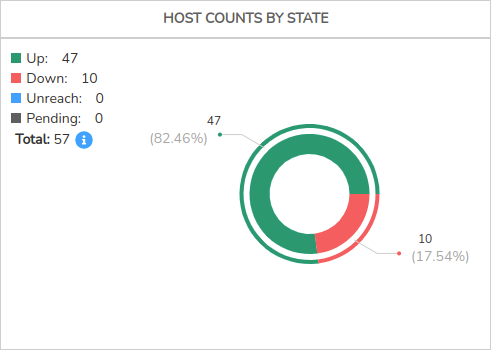
If you click on one of the sectors in the graph, a new window will appear showing a detailed list of the devices recording that monitoring status.
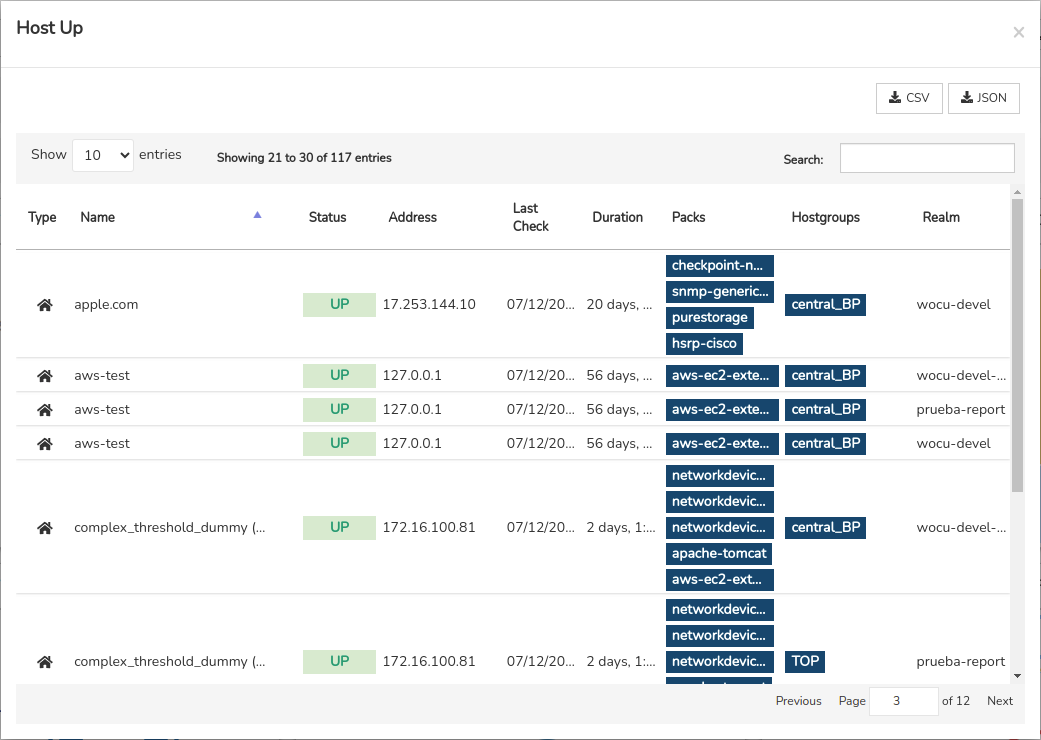
The following information is presented in tabular form:
Type: indicates the asset type via its representative icon.
Name: the device’s name or formal identifier.
Active Checks icon: when the Disable active checks action is enabled, a “no entry” icon (🚫) is displayed, indicating that the active monitoring tasks performed by WOCU-Monitoring are temporarily suspended.
Status: reports the monitoring status of the asset.
Address: contains the device’s network or IP address.
Last Check: shows the date of the last check of the device’s monitoring status.
Duration: indicates the length of time the device has been available on the system without experiencing any downtime or complete failures.
Packs: this field contains a list of labels that provide information about the Monitoring Packs that have been configured.
Hostgroups: indicates the hostgroups to which the device belongs.
Realm: indicates the realm to which the asset belongs.
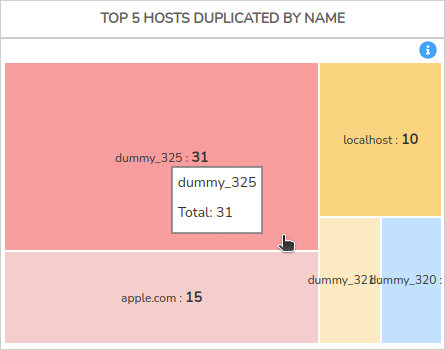
Tops 5 Hosts duplicated by Name
This panel displays devices with duplicate names using a treemap, which is divided into five blocks of different sizes. Each rectangular block represents a specific device, and its size varies according to the total number of devices with the same name. In other words, the larger the block representing a device, the greater the number of duplicate devices with that name.
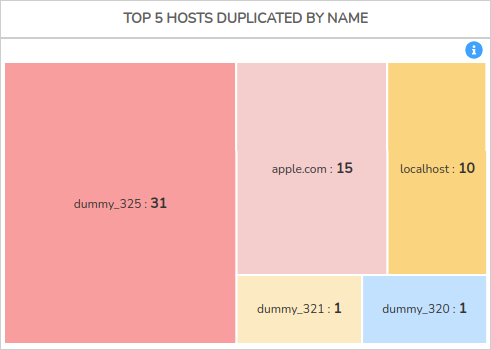
Each rectangle on the map shows the name, followed by the total number of duplicates. If you hover the cursor over one of the blocks, a tooltip will appear displaying this information.
In addition, clicking on any block opens a new window displaying a detailed list containing information about each item.
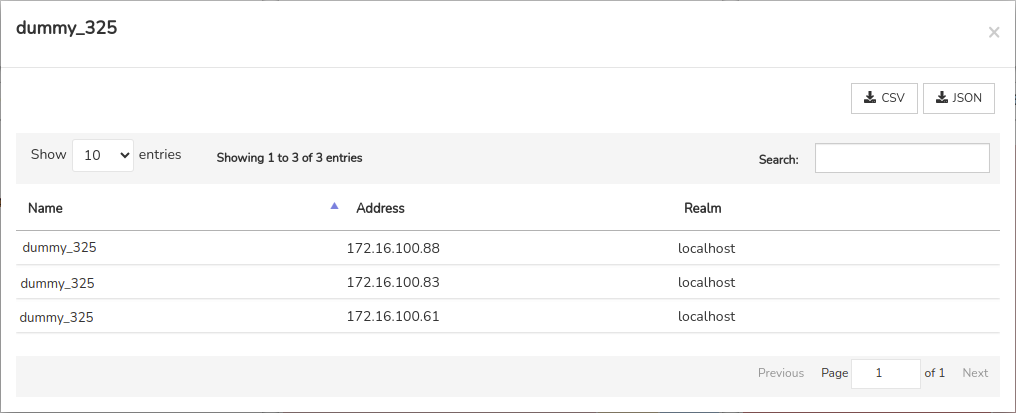
The following information is presented in tabular form:
Name: name of the duplicate device.
Address: contains the device’s network or IP address.
Realm: indicates the realm to which the device belongs.
Tops 5 Hosts duplicated by IP
This panel displays duplicate devices by IP address using a treemap, which is divided into five blocks of varying sizes. Each rectangular block represents a specific IP address, and its size varies according to the total number of devices sharing that IP address. In other words, the larger the block representing an IP address, the greater the number of duplicates.
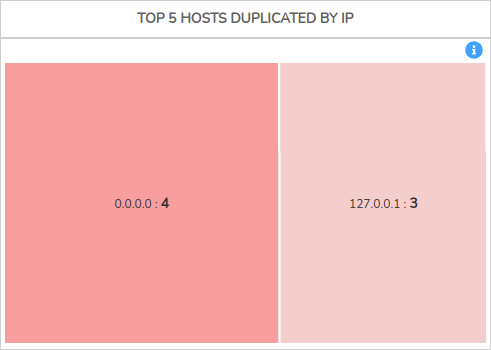
If you click on one of the sectors in the graph, a new window will appear showing a detailed list for a specific IP address:
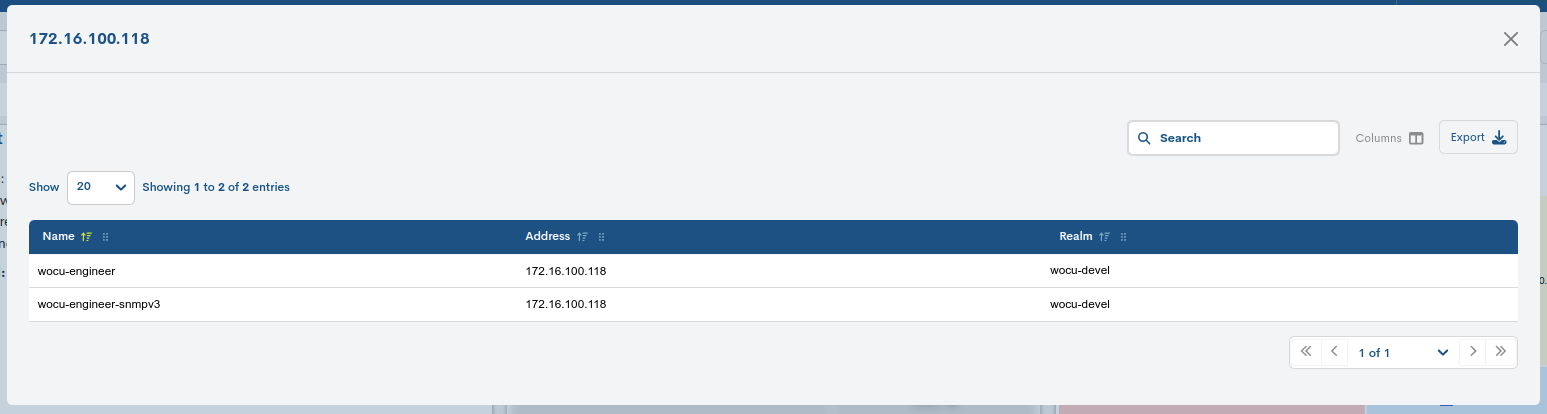
The following information is presented in tabular form:
Name: Name of the device sharing the IP address.
Address: contains a duplicate network or IP address.
Realm: indicates the realm to which the device with the duplicate IP address belongs.
Hosts with checks disabled
This pie chart distinguishes between devices with checks enabled and disabled, as well as showing the total for each category.
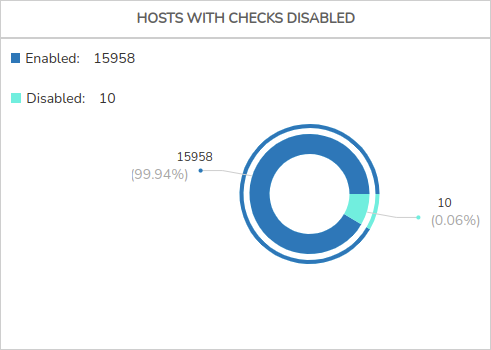
Please use the legend to identify each type of device. In addition, the percentage and total figure are shown for each sector of the chart, making it easier to identify and interpret.
When you click on one of the sectors in the chart, a new window will appear showing a detailed list of each device that belongs to one group or another.
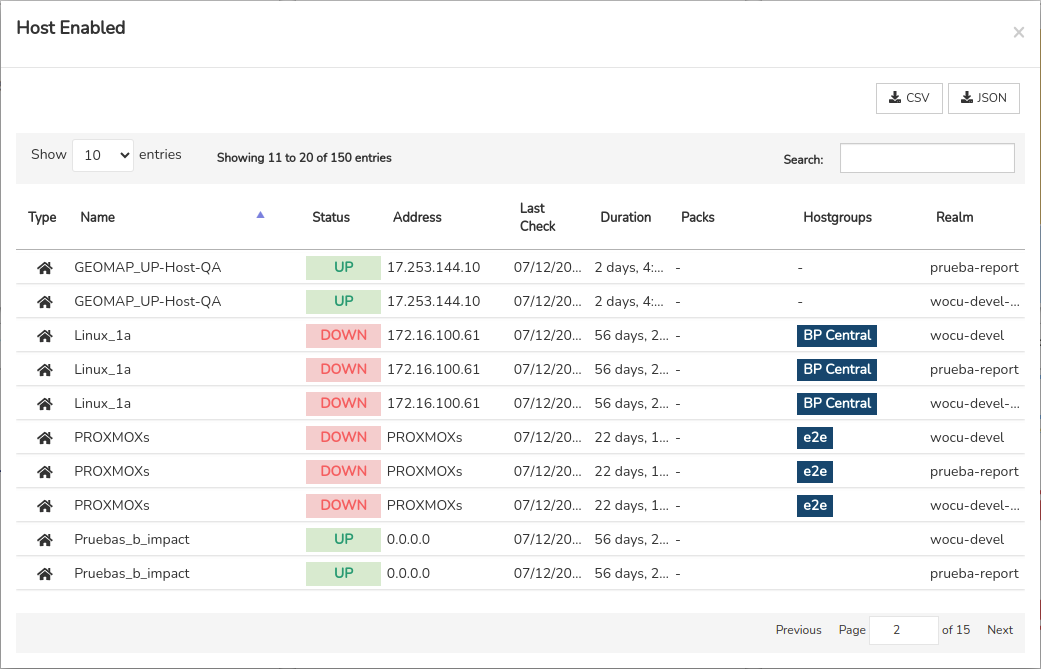
The following information is presented in tabular form:
Type: indicates the asset type via its representative icon.
Name: the device’s name or formal identifier.
Active Checks icon: when the Disable active checks action is enabled, a “no entry” icon (🚫) is displayed, indicating that the active monitoring tasks performed by WOCU-Monitoring are temporarily suspended.
Status: reports the monitoring status of the asset.
Address: contains the device’s network or IP address.
Last Check: shows the date of the last check of the device’s monitoring status.
Duration: indicates the length of time the device has been available on the system without experiencing any downtime or complete failures.
Packs: this field contains a list of labels that provide information about the Monitoring Packs that have been configured.
Hostgroups: indicates the hostgroups to which the device belongs.
Realm: indicates the realm to which the asset belongs.
Hosts with checks disabled with filter of days
This ring chart shows the total number of devices with checks disabled, based on a specific time filter.
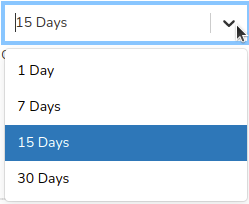
The default options are:
1 day
7 days
15 days
30 days
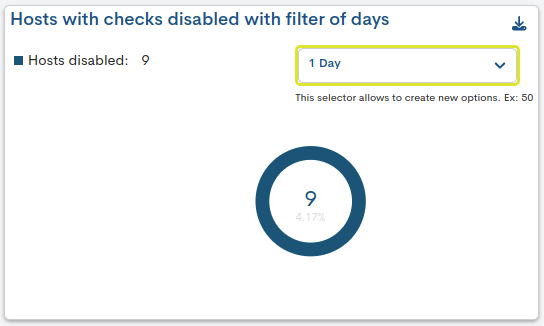
In addition, you can create and customise new time ranges by entering an integer; for example, if you enter 100, a new filter option for 100 days will be created automatically.
Clicking on the graph will bring up a new window showing a detailed list of devices whose checks are disabled.
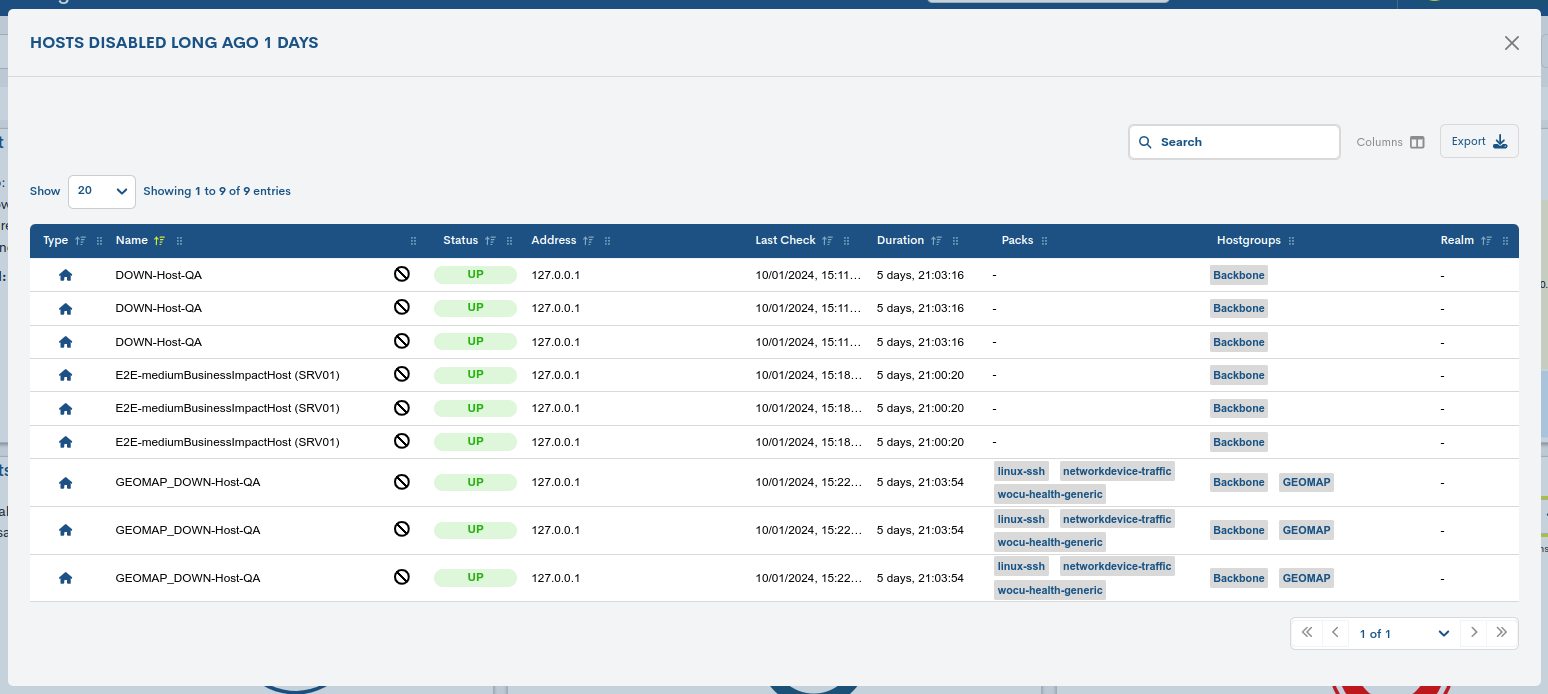
The following information is presented in tabular form:
Type: indicates the asset type via its representative icon.
Name: the device’s name or formal identifier.
Active Checks icon: when the Disable active checks action is enabled, a “no entry” icon (🚫) is displayed, indicating that the active monitoring tasks performed by WOCU-Monitoring are temporarily suspended.
Status: reports the monitoring status of the asset.
Address: contains the device’s network or IP address.
Last Check: shows the date of the last check of the device’s monitoring status.
Duration: indicates the length of time the device has been available on the system without experiencing any downtime or complete failures.
Packs: this field contains a list of labels that provide information about the Monitoring Packs that have been configured.
Hostgroups: indicates the hostgroups to which the device belongs.
Realm: indicates the realm to which the asset belongs.
Hosts having long-term Problems
This ring diagram distinguishes between devices in the DOWN (down) or UNREACHABLE (unknown status) state, based on a specific time filter.
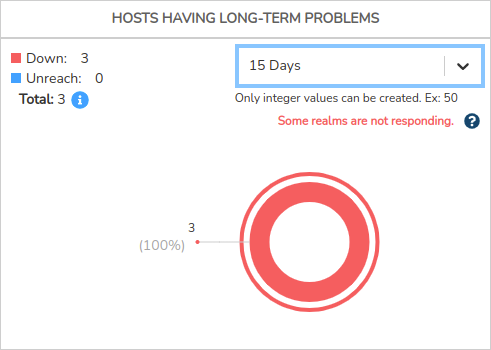
The default filter options are:
7 days
15 days
30 days
In addition, you can create and customise new time ranges by entering an integer; for example, if you enter 100, a new filter option for 100 days will be created automatically.
Please refer to the legend to identify each status type and the total number of devices displaying that status at the time of the query. Furthermore, each sector of the chart shows the percentage and total figure, making it easier to identify and interpret.
If you click on one of the sectors in the graph, a new window will appear showing a detailed list of the devices recording that monitoring status.
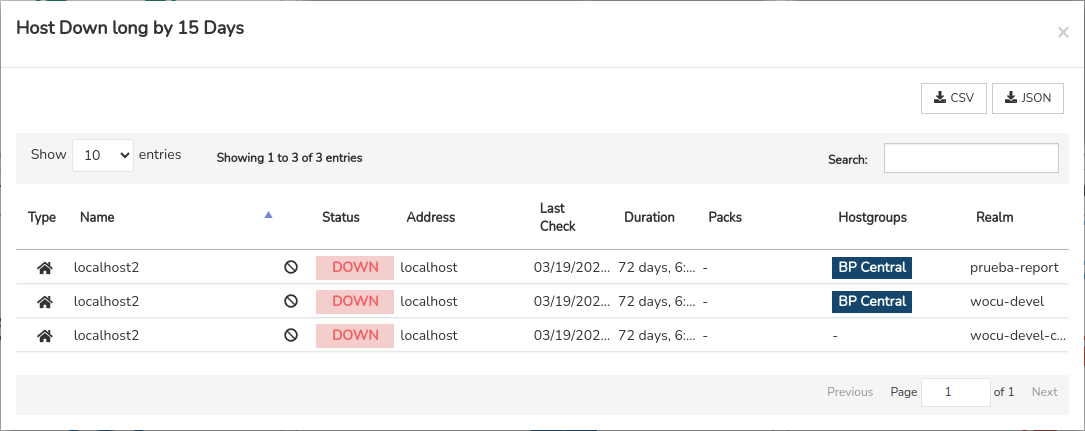
The following information is presented in tabular form:
Type: indicates the asset type via its representative icon.
Name: the device’s name or formal identifier.
Active Checks icon: when the Disable active checks action is enabled, a “no entry” icon (🚫) is displayed, indicating that the active monitoring tasks performed by WOCU-Monitoring are temporarily suspended.
Status: reports the monitoring status of the asset.
Address: contains the device’s network or IP address.
Last Check: shows the date of the last check of the device’s monitoring status.
Duration: indicates the length of time the device has been available on the system without experiencing any downtime or complete failures.
Packs: this field contains a list of labels that provide information about the Monitoring Packs that have been configured.
Hostgroups: indicates the hostgroups to which the device belongs.
Realm: indicates the realm to which the asset belongs.
Services
This view is divided into four widgets, whose charts distinguish between critical monitoring statuses recorded and services with checks disabled.
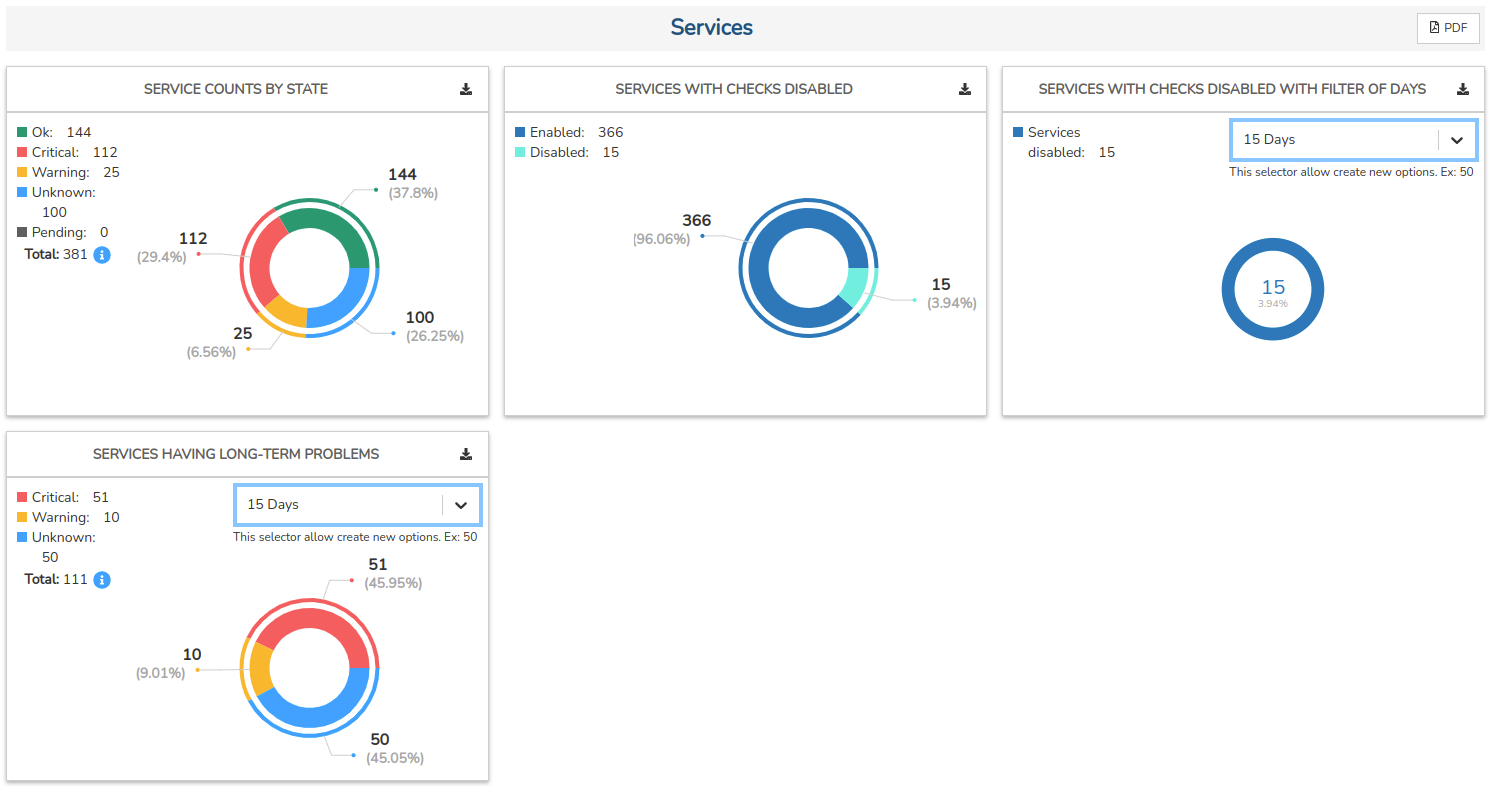
Service counts by State
This ring chart distinguishes between Services based on the type monitoring state they are in, as well as showing the total sum of all of them.
Please refer to the legend to identify each type of status and the total number of services displaying that status at the time of the query. In addition, the percentage and total figure are shown for each sector of the chart, making it easier to identify and interpret.
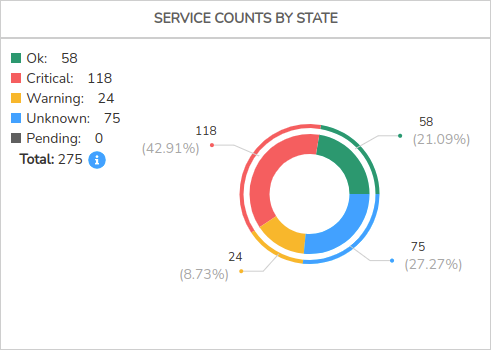
If you click on one of the sectors in the graph, a new window will appear showing a detailed list of the services for which that monitoring status applies.
The following information is presented in tabular form:
Type: indicates the asset type via its representative icon. The available options are:
Standalone services: indicated by the crossed-out arrow icon.

Business Process Services (BP Services): identified by the icon of crossed arrows within a circle.

Host: records the formal identifier of the device to which the service in question is associated.
Host Status: reports the current monitoring status of the device.
Service: name of the monitoring service.
Status: reports the current monitoring status of the Service.
Last Check: shows the date of the last check of the device’s monitoring status.
Duration: indicates the length of time the device has been available on the system without experiencing any downtime or complete failures.
Packs: this field contains a list of labels that provide information about the Monitoring Packs that have been configured.
Hostgroups: indicates the hostgroups to which the device belongs.
Realm: indicates the realm to which the asset belongs.
Service with checks disabled
This pie chart distinguishes between Services with checks enabled and disabled, as well as showing the total for each category.
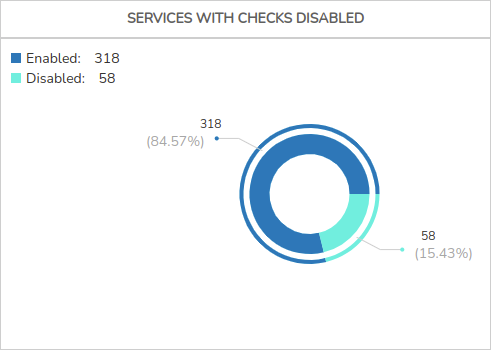
Please refer to the legend to identify each type of service. In addition, the percentage and total figure are shown for each sector of the chart, making it easier to identify and interpret.
If you click on one of the sectors in the chart, a new window will pop up showing a detailed list of each service included in one group or the other.
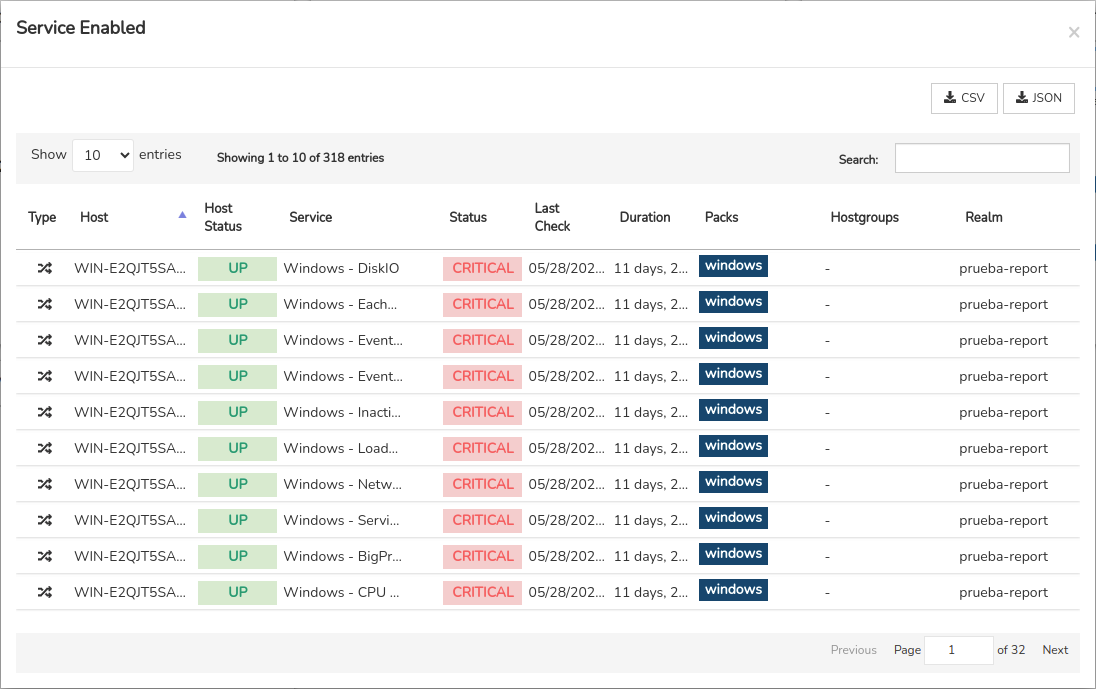
The following information is presented in tabular form:
Type: indicates the asset type via its representative icon. The available options are:
Standalone services: indicated by the crossed-out arrow icon.
Business Process Services (BP Services): identified by the icon of crossed arrows within a circle.
Host: records the formal identifier of the device to which the service in question is associated.
Host Status: reports the current monitoring status of the device.
Service: name of the monitoring service.
Status: reports the current monitoring status of the Service.
Last Check: shows the date of the last check of the device’s monitoring status.
Duration: indicates the length of time the device has been available on the system without experiencing any downtime or complete failures.
Packs: this field contains a list of labels that provide information about the Monitoring Packs that have been configured.
Hostgroups: indicates the hostgroups to which the device belongs.
Realm: indicates the realm to which the asset belongs.
Service with checks disabled with filter of days
This doughnut chart shows all Services with checks disabled, based on a specific time filter.
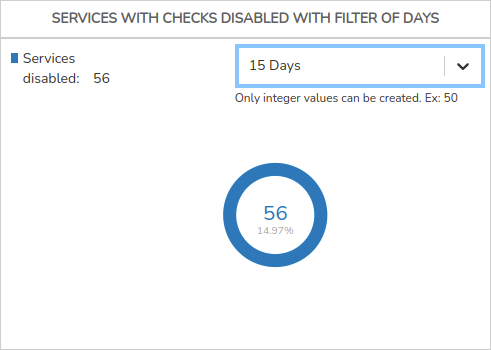
The default options are:
7 days
15 days
30 days
In addition, you can create and customise new time ranges by entering an integer; for example, if you enter 100, a new filter option for 100 days will be created automatically.
Clicking on the graph will bring up a new window showing a detailed list of services whose checks are disabled.
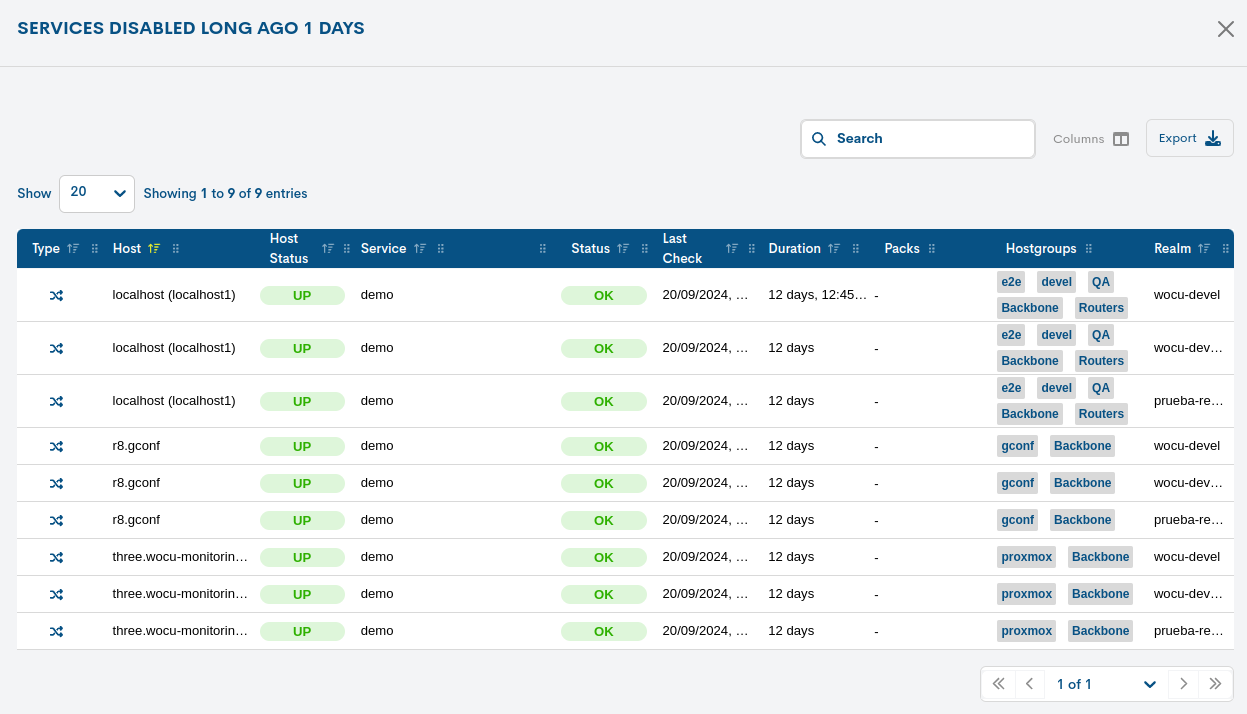
The following information is presented in tabular form:
Type: indicates the asset type via its representative icon. The available options are:
Standalone services: indicated by the crossed-out arrow icon.
Business Process Services (BP Services): identified by the icon of crossed arrows within a circle.
Host: records the formal identifier of the device to which the service in question is associated.
Host Status: reports the current monitoring status of the device.
Service: name of the monitoring service.
Status: reports the current monitoring status of the Service.
Last Check: shows the date of the last check of the device’s monitoring status.
Duration: indicates the length of time the device has been available on the system without experiencing any downtime or complete failures.
Packs: this field contains a list of labels that provide information about the Monitoring Packs that have been configured.
Hostgroups: indicates the hostgroups to which the device belongs.
Realm: indicates the realm to which the asset belongs.
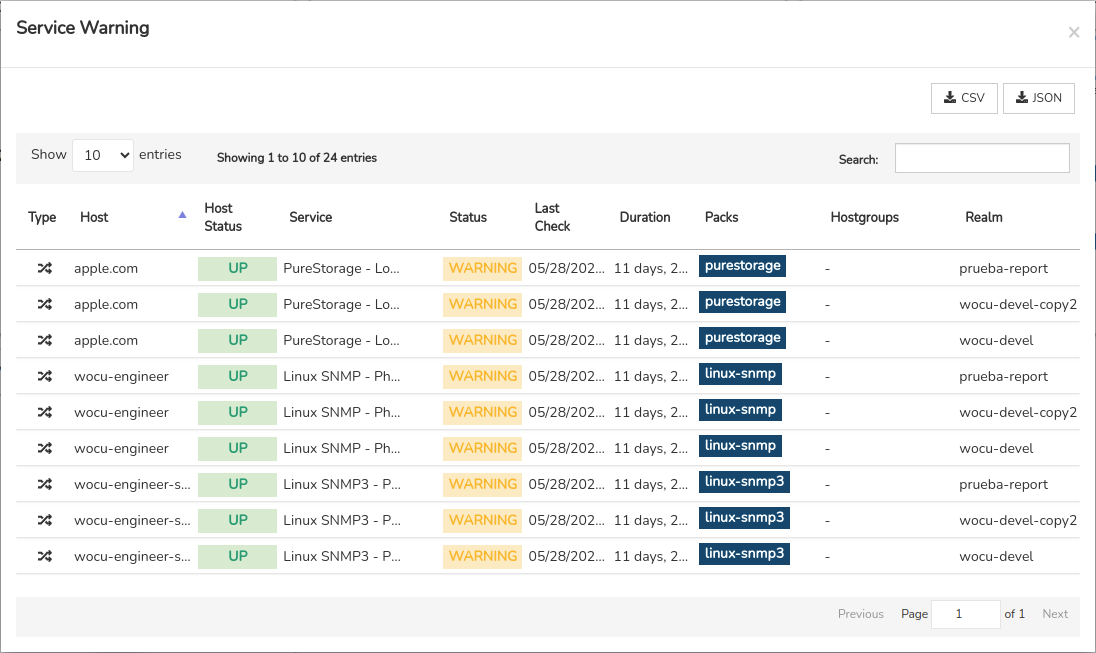
Service having long-term Problems
This ring chart distinguishes between Services with a status of CRITICAL (down) or UNKNOWN (status unknown), based on a specific time filter.
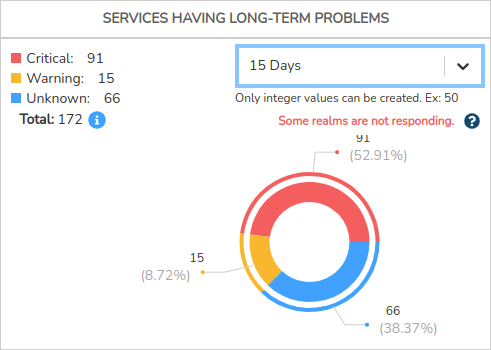
The default filter options are:
7 days
15 days
30 days
In addition, you can create and customise new time ranges by entering an integer; for example, if you enter 100, a new filter option for 100 days will be created automatically.
Clicking on the graph will bring up a new window showing a detailed list of services whose checks are disabled.
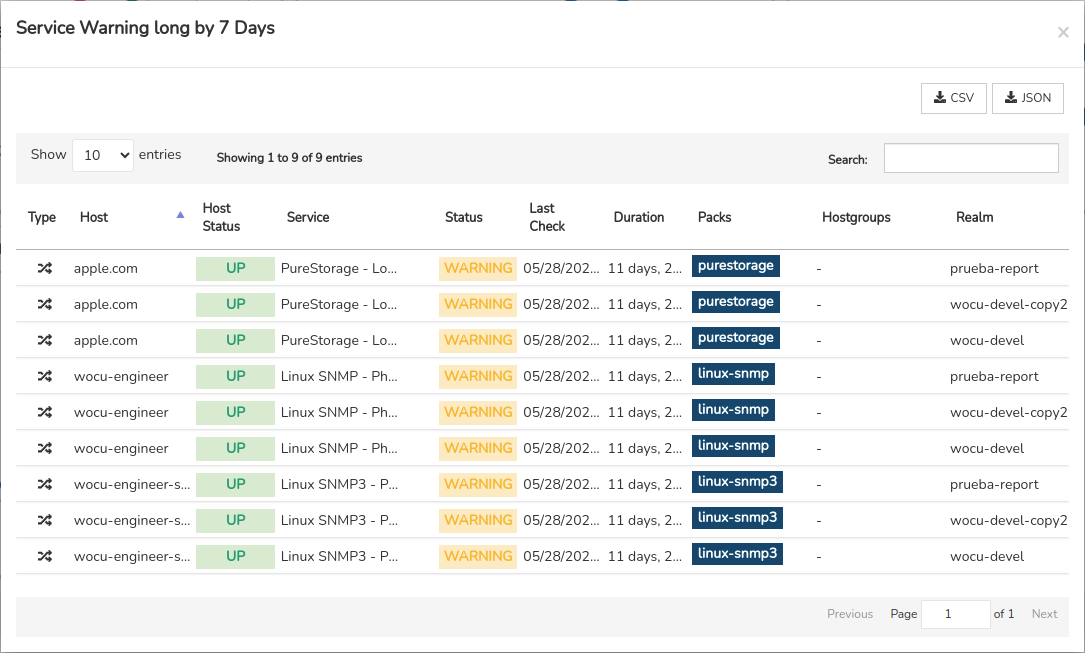
The following information is presented in tabular form:
Type: indicates the asset type via its representative icon. The available options are:
Standalone services: indicated by the crossed-out arrow icon.
Business Process Services (BP Services): identified by the icon of crossed arrows within a circle.
Host: records the formal identifier of the device to which the service in question is associated.
Host Status: reports the current monitoring status of the device.
Service: name of the monitoring service.
Status: reports the current monitoring status of the Service.
Last Check: shows the date of the last check of the device’s monitoring status.
Duration: indicates the length of time the device has been available on the system without experiencing any downtime or complete failures.
Packs: this field contains a list of labels that provide information about the Monitoring Packs that have been configured.
Hostgroups: indicates the hostgroups to which the device belongs.
Realm: indicates the realm to which the asset belongs.
Hosts By Packs
This view is divided into two widgets, whose graphs are linked to the use of Monitoring Packs.
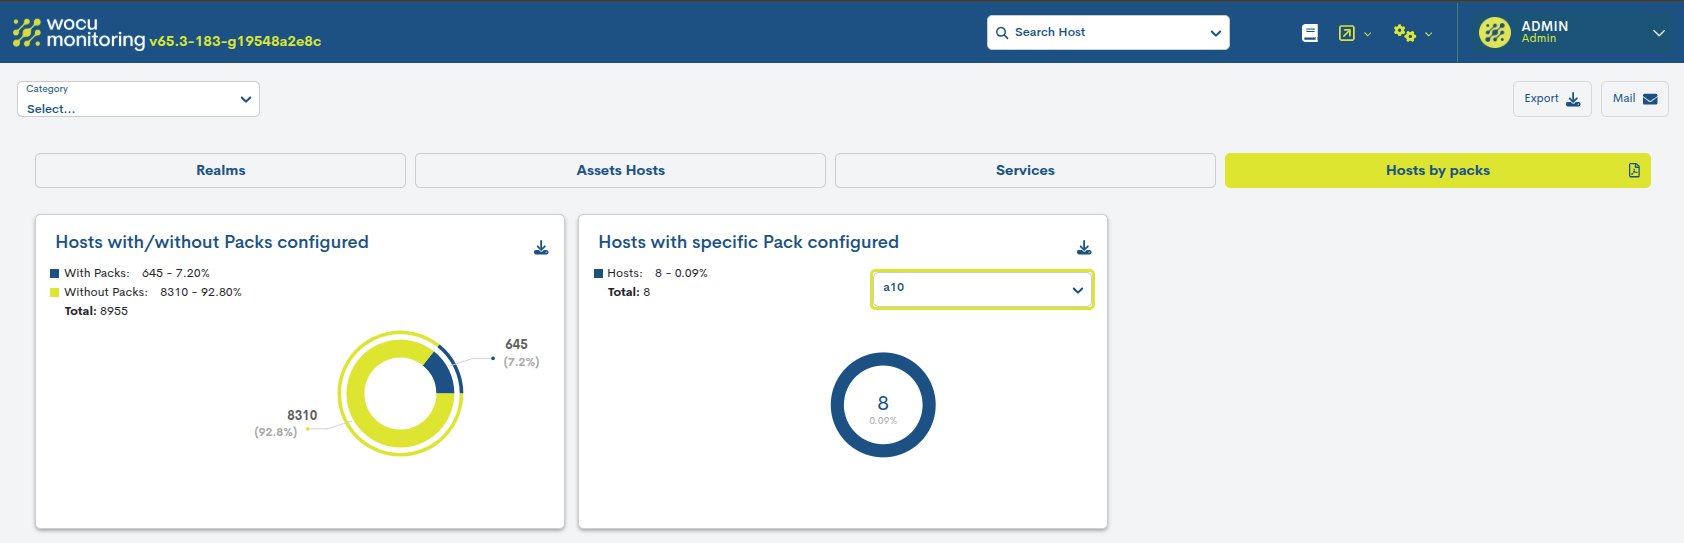
Hosts with/without Packs configured
This pie chart distinguishes between devices with Monitoring Packs configured and those without.
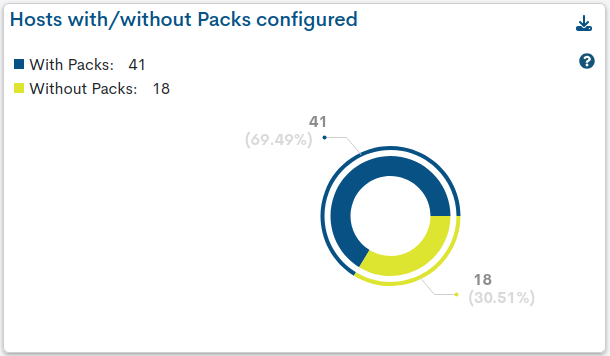
Please use the legend to identify each type of device. In addition, the percentage and total figure are shown for each sector of the chart, making it easier to identify and interpret.
When you click on one of the sectors in the chart, a new window will appear showing a detailed list of each device that belongs to one group or another.
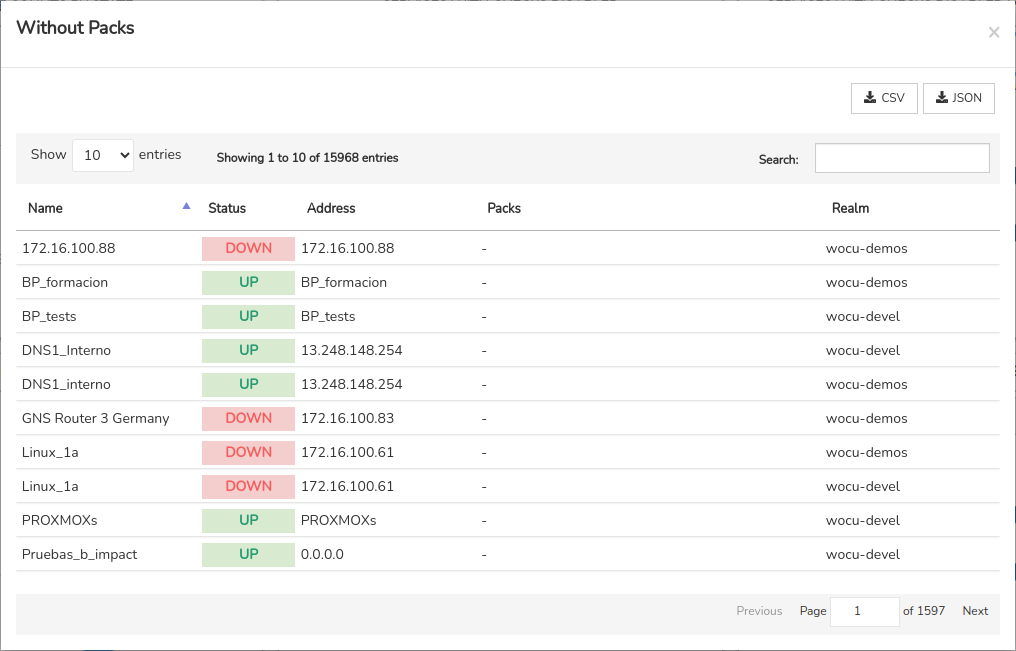
The following information is presented in tabular form:
Name: records the formal identifier of the device in question.
Status: reports the current monitoring status of the Service.
Address: contains the device’s network or IP address.
Packs: a list of Monitoring Packs associated with the device in question.
Realm: indicates the realm to which the asset belongs.
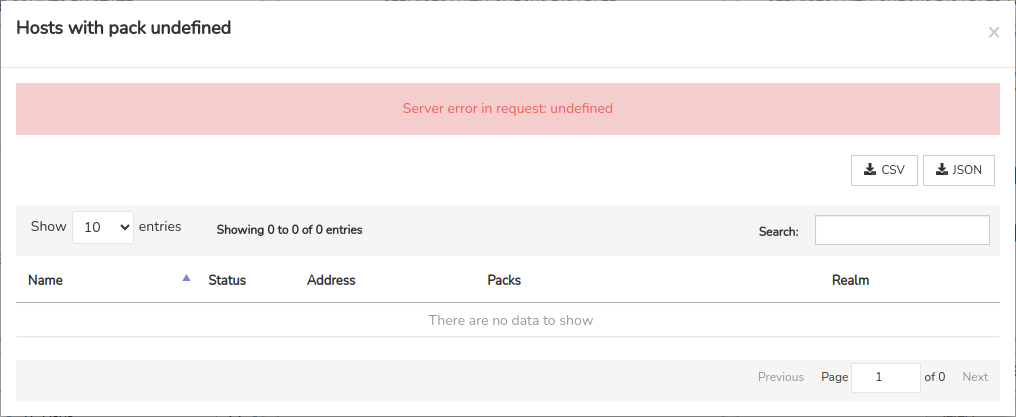
Hosts with specific Pack configured
This ring chart shows all devices with a specific Monitoring Pack. To do this, you must use the pack selector, which acts as a filter. Once a specific pack has been selected, the chart will update immediately. If, on the other hand, no packs have been configured, the selector will be disabled.
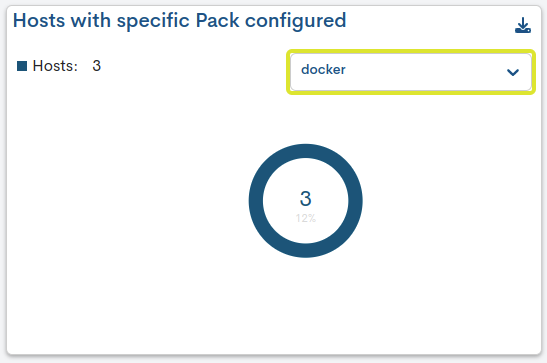
Please refer to the legend to see the total number of devices associated with a particular package. The chart also shows the percentage and the total figure.
Clicking on the graph will bring up a new window showing a detailed list of devices associated with a specific package.
The following information is presented in tabular form:
Name: records the formal identifier of the device in question.
Status: reports the current monitoring status of the Service.
Address: contains the device’s network or IP address.
Packs: a list of Monitoring Packs associated with the device in question.
Realm: indicates the realm to which the asset belongs.
Export the full view
Export
Download a file containing the data for the fifteen widgets using the XLSX and JSON buttons (and formats) in the Download function at the top of the overview.
Email
The system allows you to send a report via email, which compiles data from the fifteen widgets. The Mail drop-down menu at the top of the overview screen offers the following sending options:
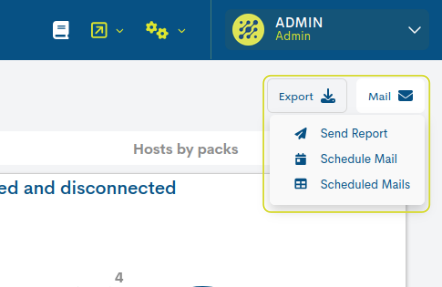
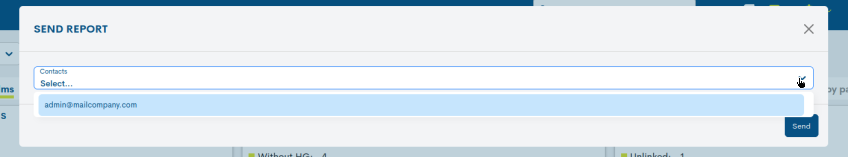
Send Report:
This feature allows you to email a report detailing the activity and status of the monitored infrastructure.
The report can only be sent to the user who is currently logged in. Therefore, in the Contacts drop-down menu, you must select the account of the user who is currently logged in.
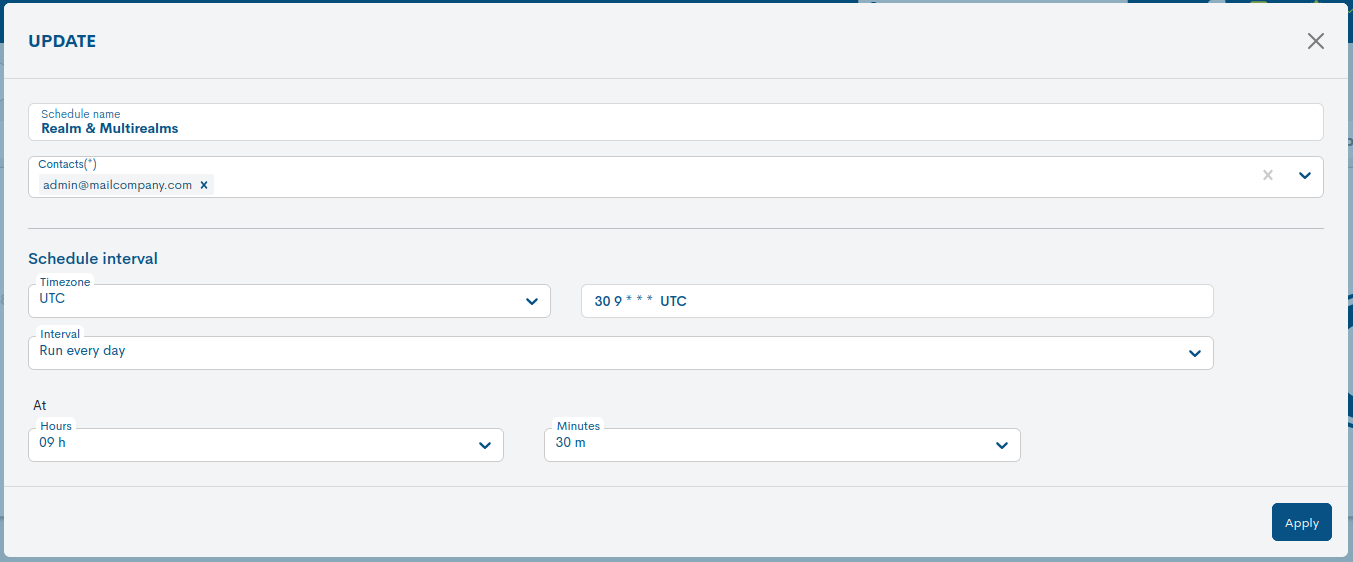
Schedule Mail:
This option allows you to schedule regular reports to be sent according to your preferences.
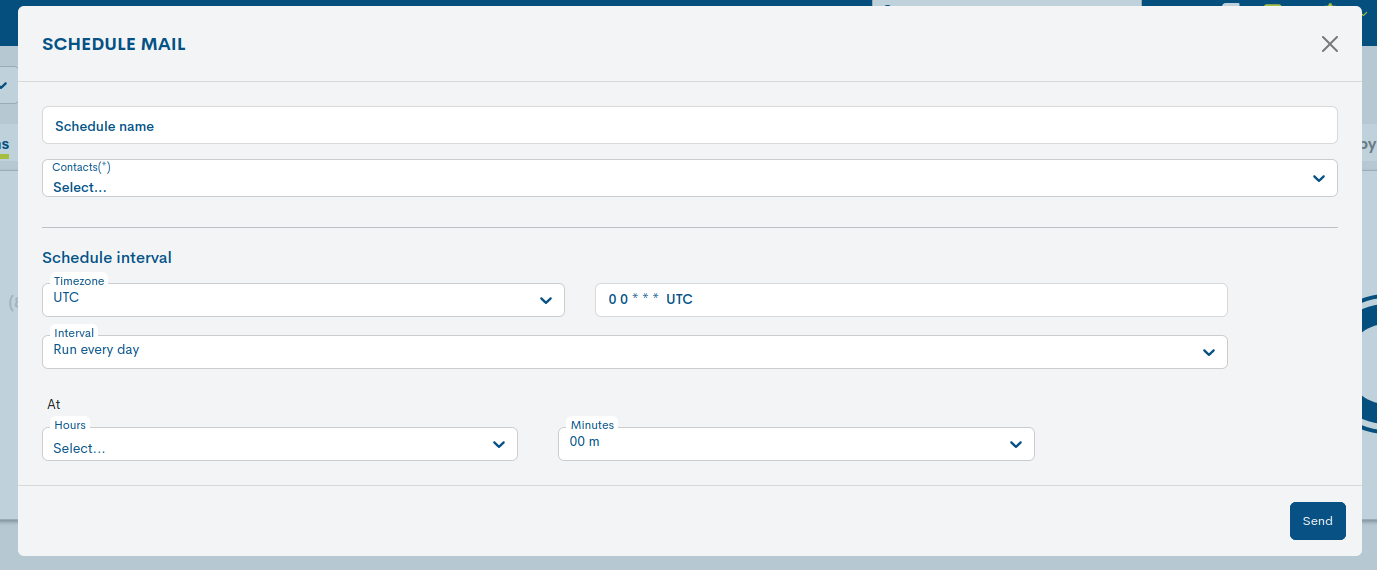
Configurable fields:
Schedule name: a mnemonic name assigned to a report schedule.
Contacts: selector for the account to which the report is sent.
Schedule interval: this section is used to set the frequency at which the report will be generated and sent. To do this, there is a drop-down menu with several options; depending on which one is selected, the settings corresponding to that option will be displayed.
Run every day: this option will run the report on a daily basis. To configure it, you will need to specify the hour and minute at which the report will be run and sent each day.
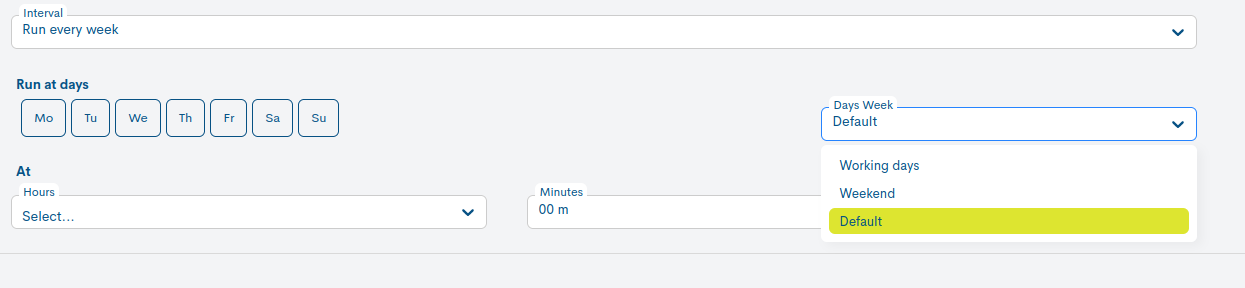
Run every week: this option will run the report on a weekly basis. A series of selectors appears in the settings:
Run on days: to specify the day or days of the week on which the task runs.
Starting at: to set the hour and minute.
Presets: a selector for predefined settings for the automatic generation of reports. When you click on one of the available options, the corresponding settings will be applied automatically:
Working days: reports will only be generated on working days (Mon, Tue, Wed, Thu, Fri).
Weekend: reports will only be published at weekends (Sat, Sun).
Default: this option sets the default report generation to Mondays (Mo) at the time specified by the user.
This makes it possible to specify which days of the week and at what exact time the report will be generated.
Run every month: this option will run the report on a monthly basis. The following selectors are displayed in its settings:
On day: to specify the day of the month on which the report will be published. The numbers 1 to 31 represent the days of the month.
At: to set the hour and minute at which the report will be generated on a specific day of each month.
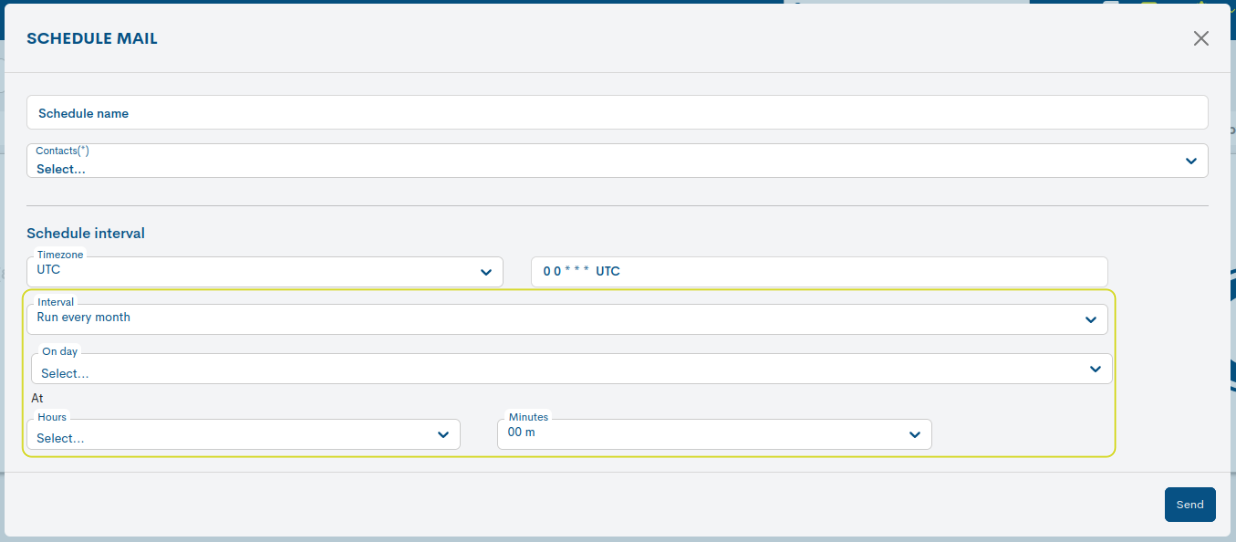
Attention
If you select the 29th, 30th or 31st, months with fewer days are excluded from the calculation.
Run on a cron schedule: finally, this option allows you to configure settings in exactly the same way as you would in Crontab format, giving you all the flexibility this tool offers for more specific scenarios.
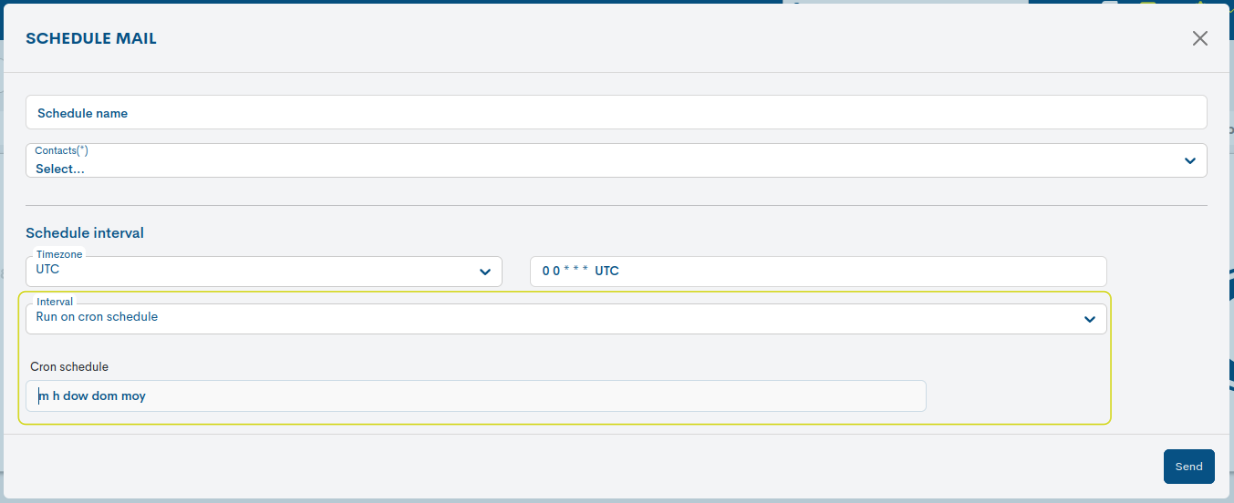
Important
To use this option, you need to be familiar with the Crontab format tool.
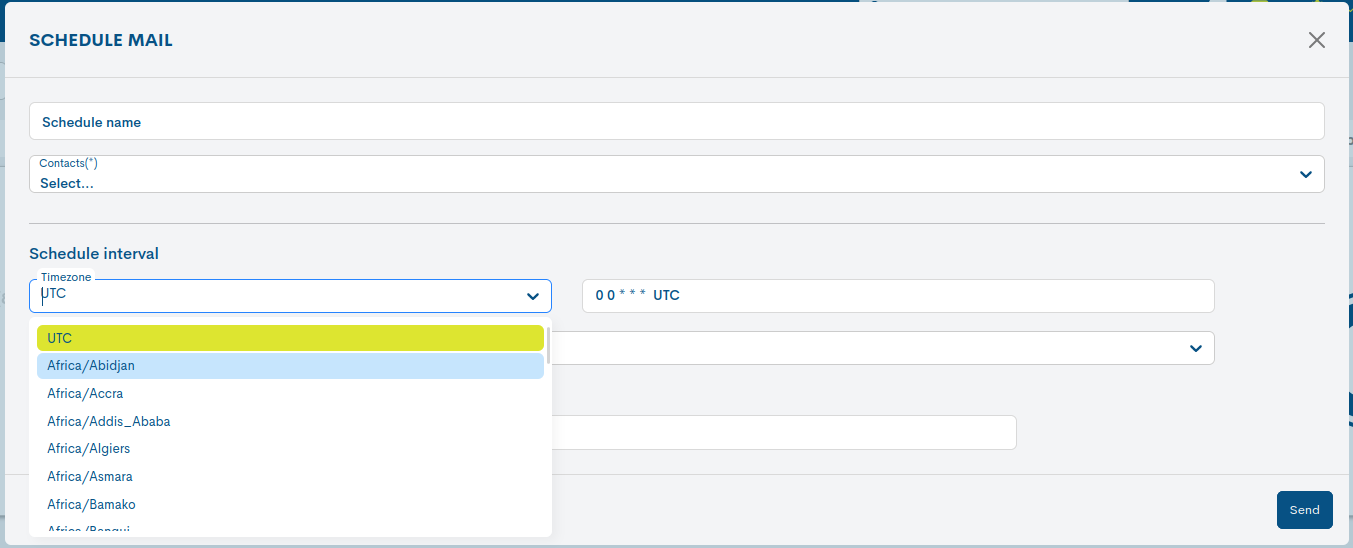
In addition to all the above options, there is the Time Zone Selector, which is useful for operators who wish to schedule reports using a time zone other than their own.
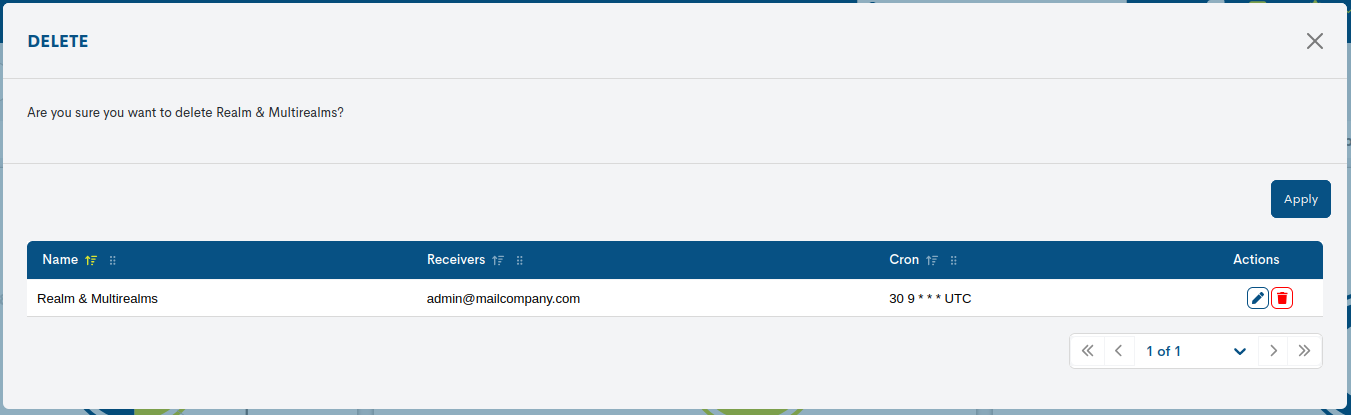
Scheduled Mail: This view displays all existing report schedules in detail, allowing you to manage and edit them individually.
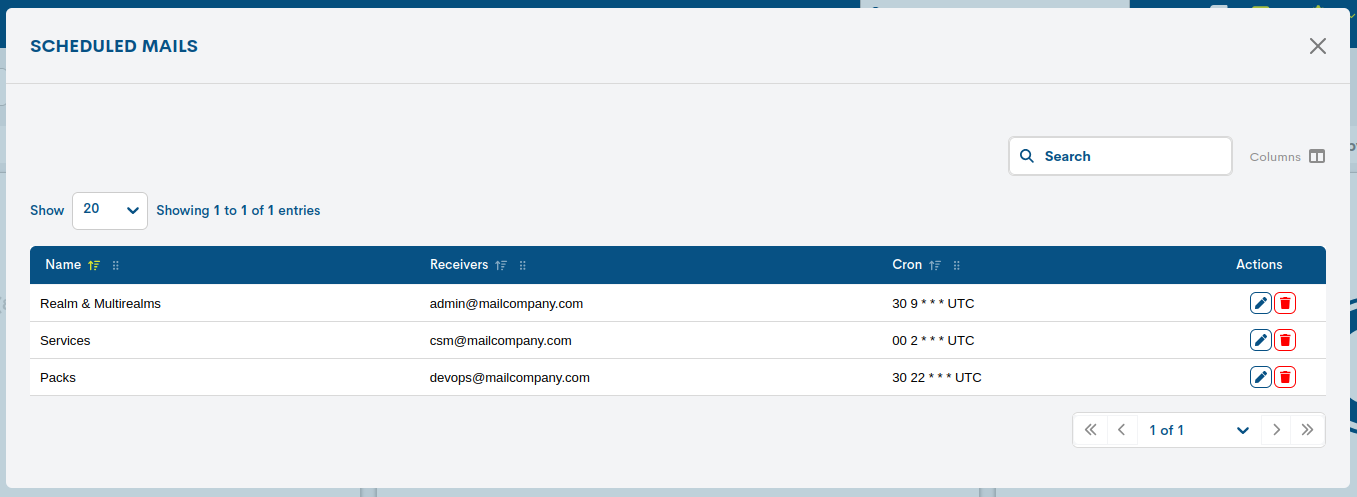
For each booking made via email, the following information is provided:
Name: a mnemonic name assigned to a report template.
Recipients: email address for the report.
Cron: specifies how often the report will be generated, in accordance with Crontab format.
In addition, the actions available for each report schedule are described below:
Edit: action for editing the schedule of the summary report. The form corresponds to the Schedule interval option in Email.
Delete: action to permanently delete the selected programme.
Exporting a section
Export and download a file containing data for a specific section using the PDF button (and format) located in the banner of each section.

Exporting a widget
Export and download a file containing the data for a specific widget using the CSV and JSON buttons (and formats) located at the top of each widget.
The exported files consolidate all the information displayed in the widgets into a document that is easy to share and analyse.
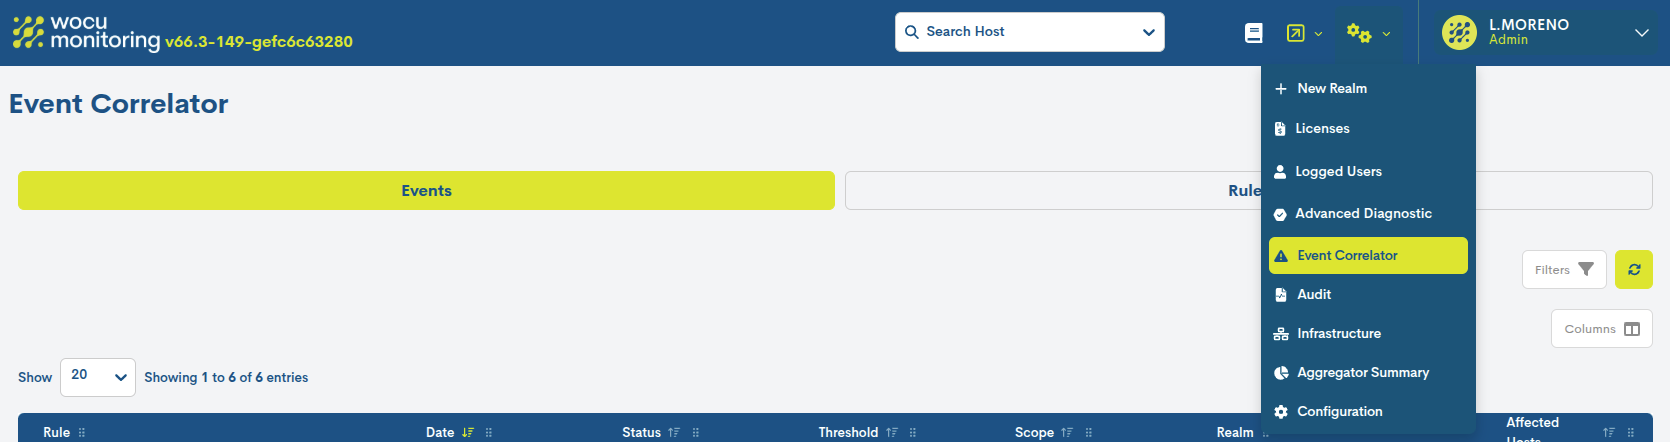
Event Correlator
A standalone module designed to predict mass outages of monitored devices that share a common characteristic, defined by the assignment of tags.
This module can be accessed from the Settings menu.
The system is based on the definition of rules that enable associations to be established between devices and thresholds to be applied based on a minimum percentage of devices that have gone down over a specific period of time. When these conditions are met, the module automatically generates a mass outage event and notifies the relevant users, facilitating an early response and proactive incident management.
The module is divided into two sections:
Events: provides a history of the rules that have been triggered, along with the date and the percentage of devices affected.
Rules: where you create and manage all correlation rules.
Creating and configuring rules
In the Rules section, you can create new correlation rules using the + Add button.
The Create Correlation Rules form will then appear, containing the following configuration fields:
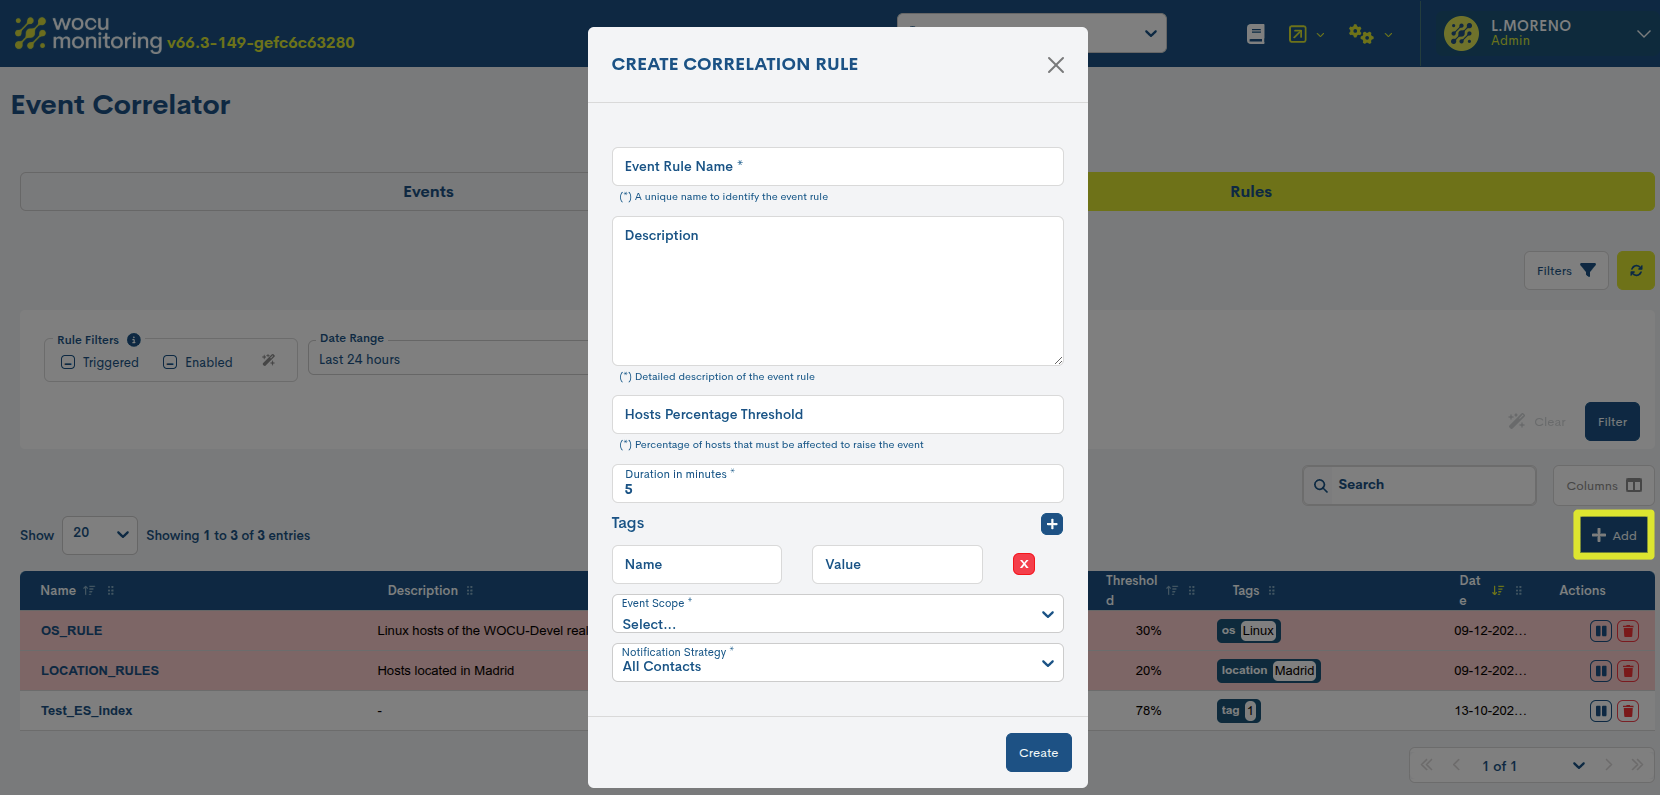
Event Rule Name: the name assigned to the rule.
Description: a field for adding additional information to provide further context about the rule.
Hosts Percentage Threshold: the minimum percentage of devices that must be in a Down state for the rule to be triggered and, consequently, for a correlation event to be generated.
Duration in minutes: the minimum duration, expressed in minutes, for which a device must remain in the Down state for the rule to be triggered and the corresponding correlation event to be generated.
Tags: this is the key element of the correlation rule. They are used to define and assign the common attribute that will allow devices sharing the same tag to be grouped together. A device may have additional tags, but these will be ignored provided that the tags specified in the rule match.
Tags are defined freely using the format
name = value(name-value), where:
Name refers to the name of the attribute or category you wish to describe.
Value refers to the specific value assigned to that attribute.
Example:
location = datacenter-1In addition to defining the tag in the correlation rule, the user must assign that tag in the settings of all devices that share this attribute. This mapping can be carried out from the following locations:
Example
Out of a set of 10 devices sharing the Location=Madrid tag, at least 30% (Hosts Percentage Threshold) must register a Down status for at least 5 minutes (Duration in minutes) in order to exceed the defined thresholds and thus trigger a correlation event.
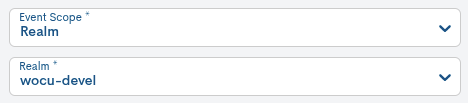
Event Scope: determines the scope of the rule. The available options are:
Global: runs the correlation rule across all available realms.
Realm: applies the rule only to a specific realm. Selecting this option enables the Realms selector, allowing you to specify the relevant realm.
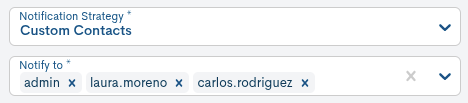
Notification strategy: defines the strategy for notifying the contact or group of contacts about the event. The available options are:
All Contacts: notifies all contacts registered in the system.
Realms Contacts: Notifies only those contacts who have access to the realm selected in the Event Scope setting.
Custom Contacts: allows you to select one or more specific contacts from the Notify to drop-down menu.
Once you have configured all the parameters for the correlation rule, click the Create button to complete the process.
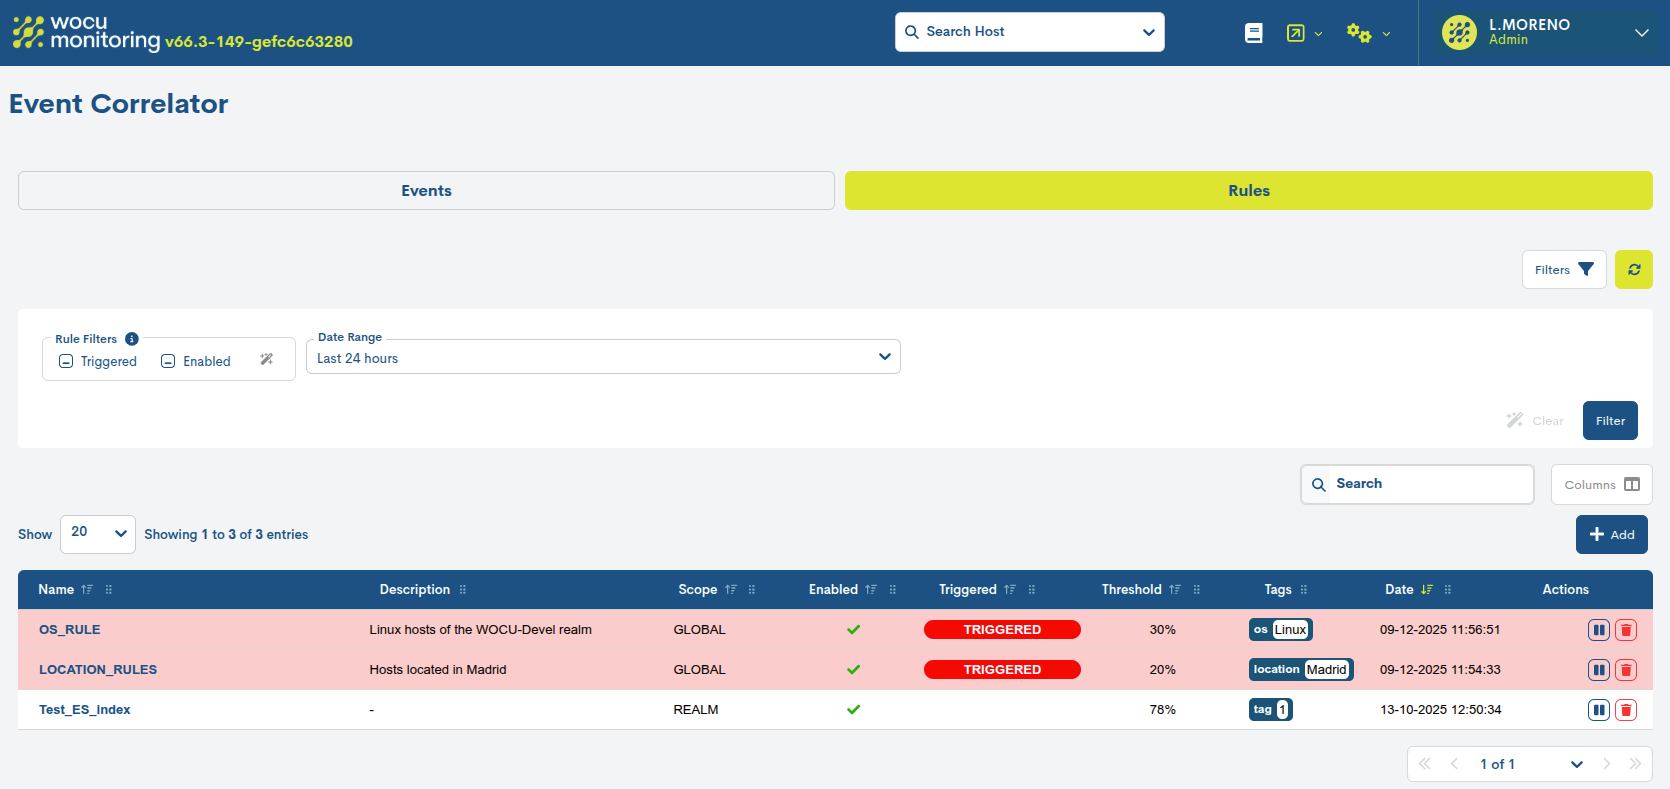
Viewing and enabling correlation rules
All correlation rules created are centralised in the Rules view. From this view, users can create, edit, pause and delete rules.
The main table shows the following information for each rule:
Name: the rule’s official name. Clicking on the name displays a detailed view of the rule’s settings. You can also edit the rule from this view.
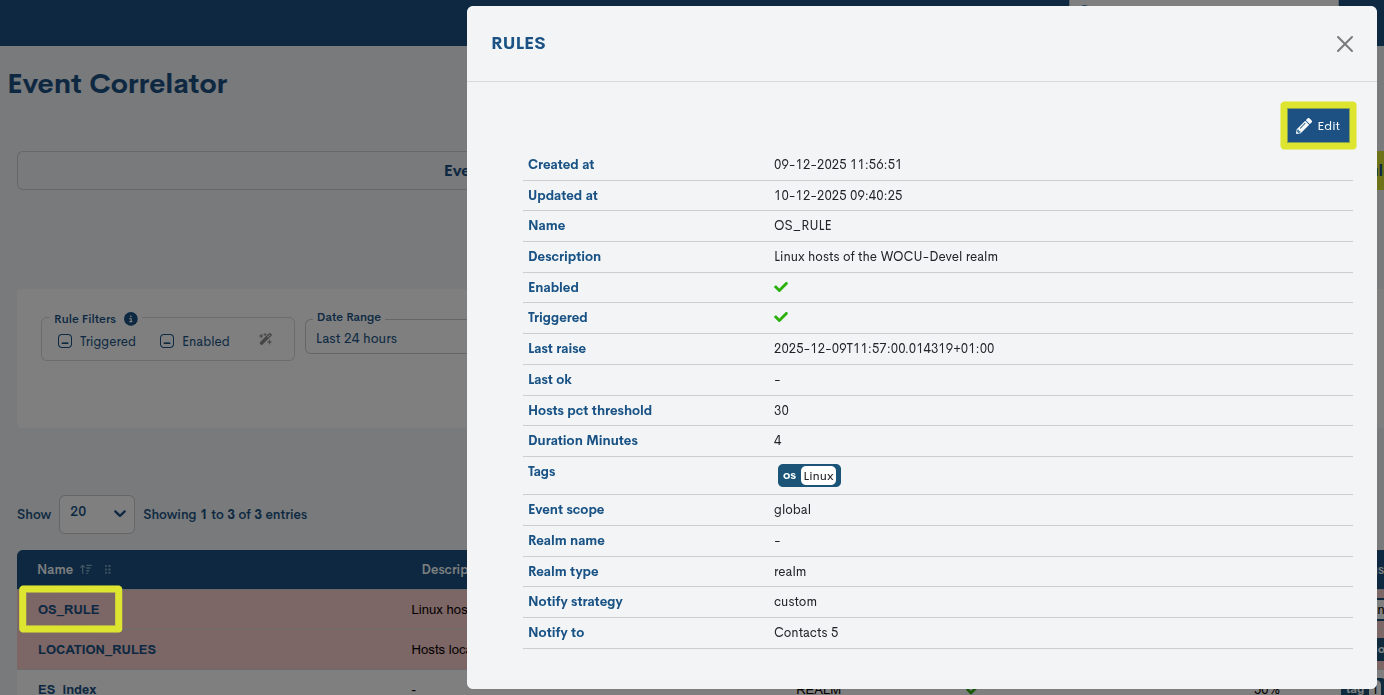
The information in this view is more comprehensive, as it provides the following details:
Created on: the exact date and time when the rule was created.
Updated on: the exact date and time when the rule was created.
Name: the name assigned to the correlation rule.
Description: descriptive text providing additional information on the purpose or scope of the rule.
Enabled: indicates whether the rule is currently enabled for execution.
Triggered: indicates whether the rule has been triggered (executed) at any point recently, i.e. whether the defined conditions have been met.
Last Raise: the date and time when the rule last generated a correlation event.
Last OK: the date and time when the rule returned to its normal state (the event was resolved) after being triggered.
Hosts pct Threshold: the minimum percentage of devices in the Down state required to trigger the rule.
Duration (minutes): the minimum duration, in minutes, for which devices must remain in the Down state in order for the activation conditions to be met.
Tags: a list of tags configured to group the devices affected by the rule. Each tag represents a common attribute in the format Name = Value.
Event scope: the scope of the rule. It can be global or restricted to a specific realm.
Realm name: the name of the realm to which the rule applies, when the selected scope is not global.
Realm type: the type of realm to which the rule belongs.
Notification strategy: the notification strategy defined for sending alerts generated by the rule.
Notify: a list of contacts or contact groups who will receive notifications when the rule is triggered.
Description: descriptive text providing additional information on the purpose or scope of the rule.
Scope: the scope of the rule. It can be GLOBAL or restricted to a specific realm (REALM).
Enabled: indicates whether the rule is currently enabled for execution.
Triggered: indicates whether the rule has recently been triggered, i.e. whether the conditions set for its execution have been met. This status is visually represented by the background of the row corresponding to the rule turning red. The system evaluates compliance with the rules every minute via an internal task. The triggered status is maintained until the percentage of hosts in the Down state falls below the configured threshold and until a new check is performed.
Threshold: the minimum percentage of devices in the Down state required to trigger the rule.
Tags: a list of tags configured to group the devices affected by the rule. Each tag represents a common attribute in the format Name = Value.
Date: the date the rule was created.
Actions: actions that can be applied individually to each rule.
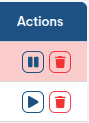
The first button contains two functions that allow you to check the execution status of a rule:
Start (▶️) activates the rule when it is paused. The rule resumes execution once its conditions are met.
Pause (⏸️) temporarily pauses the rule. It stops running, but is not deleted.
Delete: action for permanently deleting a rule. It is indicated by a bin icon.
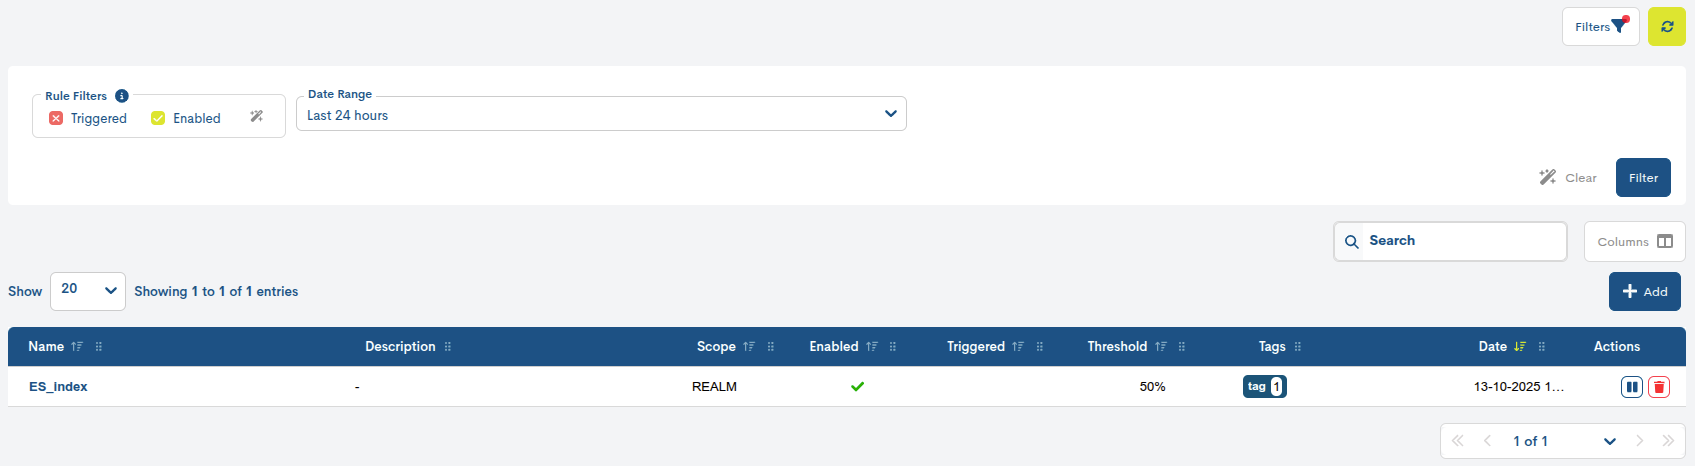
Rule filtering
Alongside the overall list, there is a set of filters to help you find a specific rule more easily:
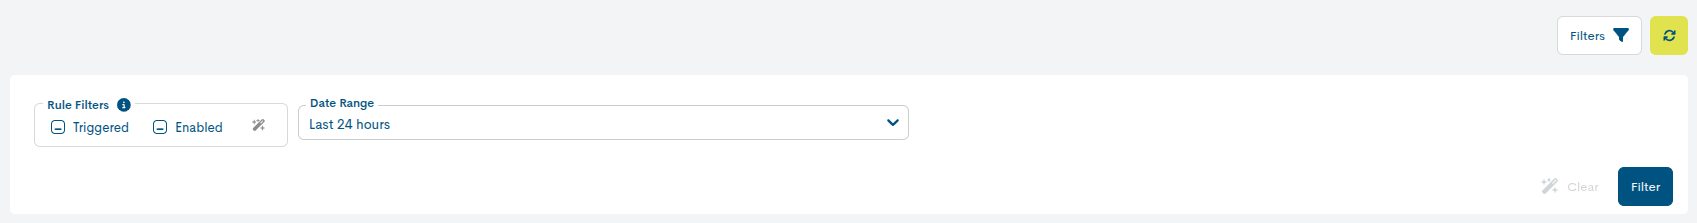
Rule Filters
This section allows you to apply quick filters to the list of rules to make it easier to view and analyse them. The available filters are:
Triggered: when this option is selected, only those rules that are currently triggered are displayed; in other words, those whose thresholds have been exceeded and have generated a correlation event.
Enabled: when selected, only the rules that are enabled for execution are displayed.
Next, click the Filter button to apply the filter criteria to the table.
These filters can be activated individually or in combination, allowing the user to customise the view to suit their needs. This is possible because each filter can have three states, as summarised in the table below. Simply tick the filter box several times to cycle through the different states.
States Icon
Amount
Description
No text was provided for translation.
Off
The filter is not enabled. The table displays all items by default.
✔
True
Filter enabled. The table is now updated to show the items that meet the filter criteria.
✖
False
Filter enabled. The table is updated to hide items that meet the filter criteria.
See the following example, where the list hides the rules that are not currently active and displays only those that are enabled.
Date Range
You can use this filter to retrieve rules based on the date they were created (see the Date column for further details).
It allows you to choose from a range of predefined time periods:
Today: filters and displays only the rules created during the time elapsed so far today.
Yesterday: rules created yesterday.
Last 24 hours: rules created in the last 24 hours.
Last 48 hours: rules created in the last 48 hours.
Last 7 Days: rules created in the last seven days.
This Week: rules created during the current week (from the start of the week to today).
Previous Week: generated during the previous full week (Monday to Sunday).
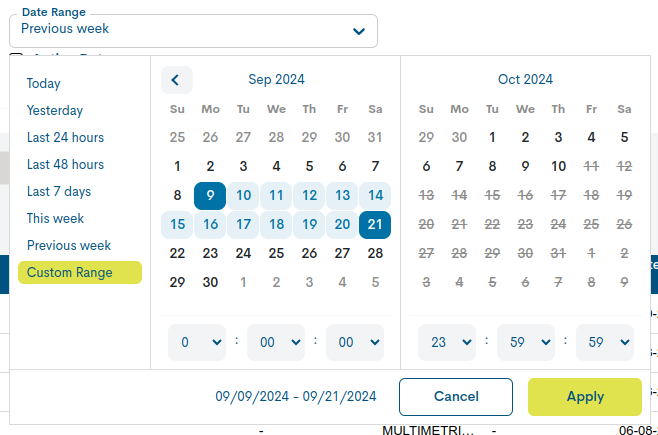
Custom Range: to set a specific time period. To configure the time frame, you need to set a start date and an end date. Clicking on one of the days will select that date, which will be highlighted with a blue background. In addition to the day, you can set a specific time for that day; to do this, use the drop-down menus for the hour, minute and second fields to set the desired time. The selected date and time will be visible both in the top boxes and at the bottom of the view.
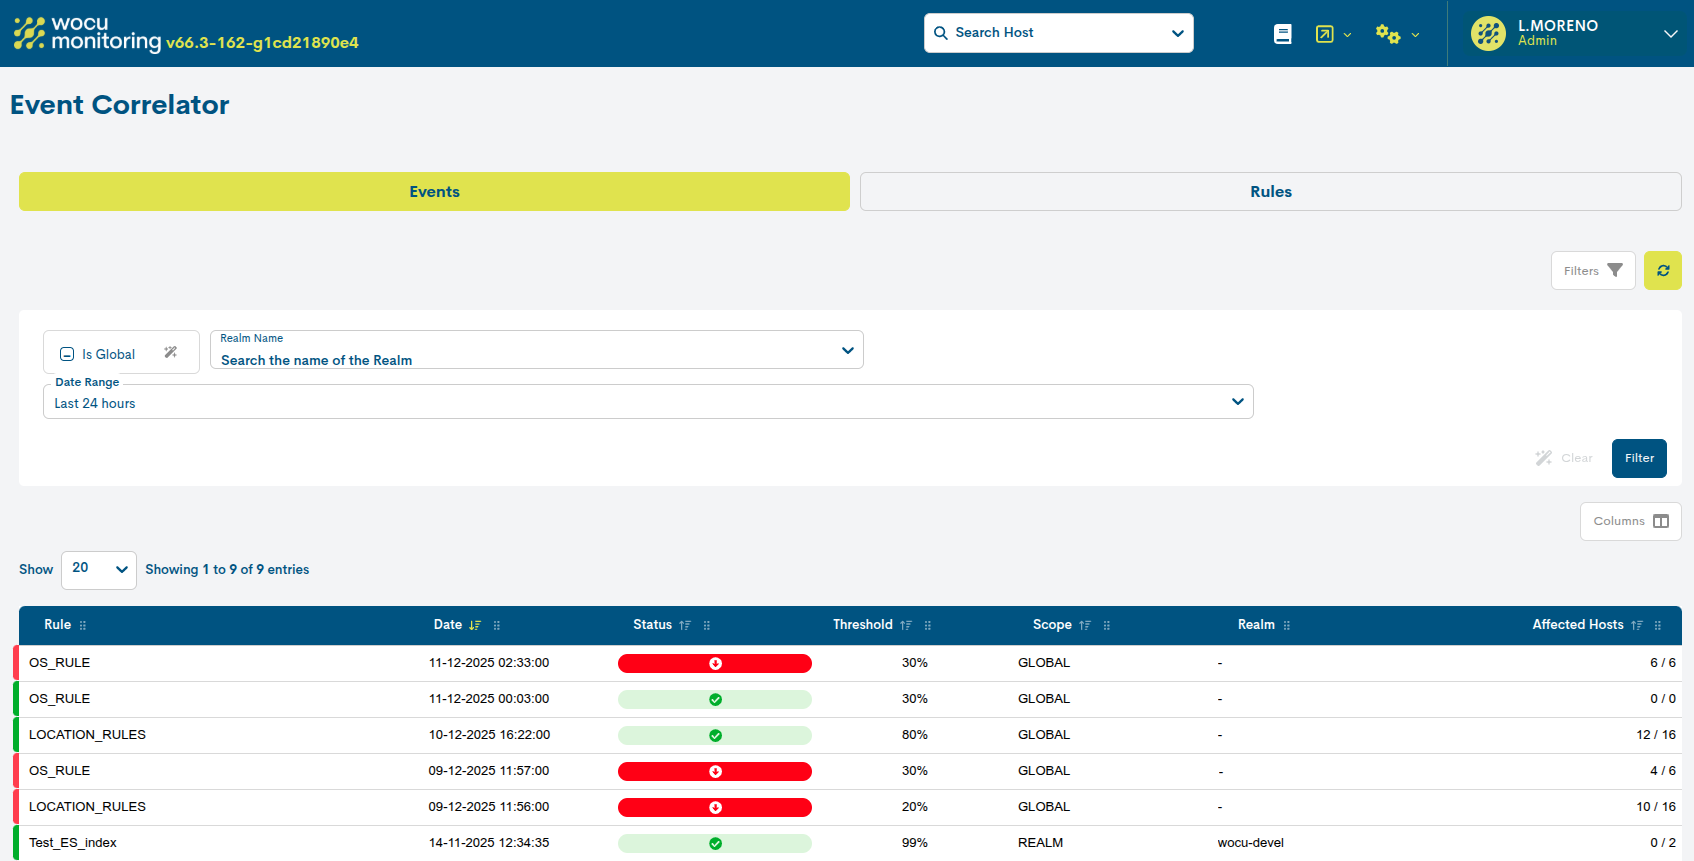
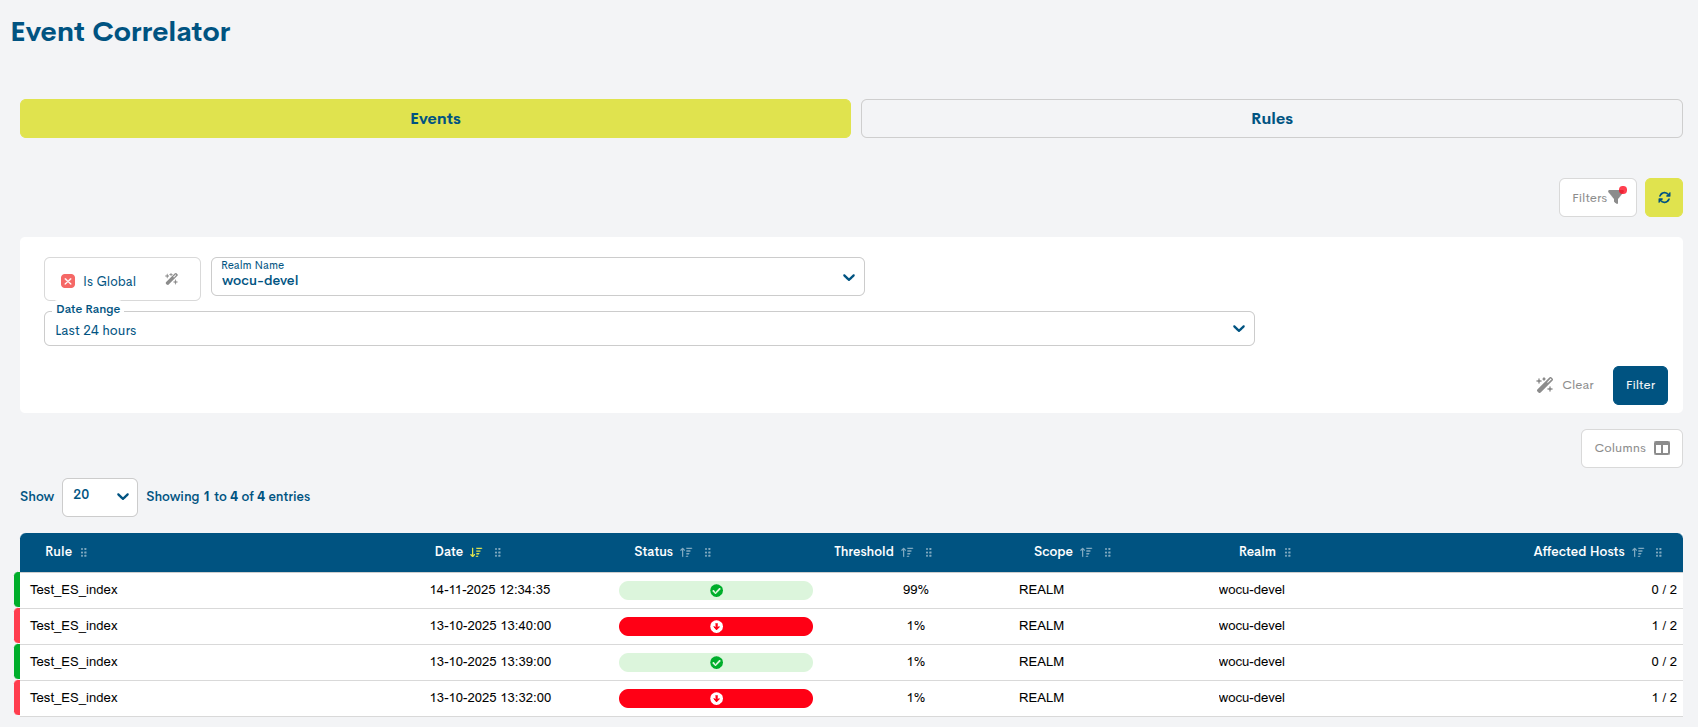
Display of correlation events
The Events section displays an activity log detailing both the activation and deactivation of correlation rules. This log includes the date of each event and the percentage of devices that were down at the time of activation.
The following information is displayed for each event that has occurred:
Rule: a correlation rule that triggers an event.
Date: the exact moment at which the rule is activated or deactivated, i.e. when the event is triggered. Events are specific points in time, not time ranges.
Status: indicates the operational status of the rule using a colour-coded system. It is displayed in red when the rule is triggered, i.e. when the affected devices are down and the Threshold has been exceeded; and in green when the devices become available again and, therefore, the number has fallen below the minimum required for the rule to be active.
Threshold: the minimum percentage of devices in the Down state required to trigger the rule.
Scope: specifies the scope of the rule. It can be GLOBAL or restricted to a specific realm (REALM).
Realm: the name of the realm to which the rule applies, when the selected scope is not global.
Affected Hosts: displays the total number of devices to which the rule applies and how many of them are currently in a Down state. This value allows you to check whether the threshold defined in the rule (Hosts Percentage Threshold) is being met.
Event filtering
Alongside the main list, there is a set of filters to help you find a specific event more easily:

Is Global
If you tick this box, the list will be filtered to show only those rules that have triggered an event on any of the realms available in the system; in other words, rules with a global scope will be displayed.
These filters can be activated individually or in combination, allowing the user to customise the view to suit their needs. This is possible because each filter can have three states, as summarised in the table below. Simply tick the filter box several times to cycle through the different states.
States Icon
Amount
Description
No text was provided for translation.
Off
The filter is not enabled. The table displays all items by default.
✔
True
Filter enabled. The table is now updated to show the items that meet the filter criteria.
✖
False
Filter enabled. The table is updated to hide items that meet the filter criteria.
Realm name
If, on the other hand, you wish to filter by rules that apply to a specific realm, you can use this drop-down menu to select a specific realm from the overall list.
See the following example, where the list shows only those rules whose scope corresponds to a realm (i.e. they are not global), in this case, Wocu-devel.
Date Range
Using this filter, you can retrieve rules based on the date on which activity was recorded (activation/deactivation of the rule).
It allows you to choose from a range of predefined time periods:
Today: filters and displays only the rules that triggered an event during the time period covered by today.
Yesterday: rules that recorded any type of event that took place yesterday.
Last 24 hours: rules that have recorded any type of event in the last 24 hours.
Last 48 hours: rules that have recorded any type of event in the last 48 hours.
Last 7 Days: records showing any type of event that has occurred in the last seven days.
This Week: rules that recorded any type of event during the period spanning the current week (from the start of the week to today).
Previous Week: records of any type of event that occurred during the previous full week (Monday to Sunday).
Custom Range: to set a specific time period. To configure the time frame, you need to set a start date and an end date. Clicking on one of the days will select that date, which will be highlighted with a blue background. In addition to the day, you can set a specific time for that day; to do this, use the drop-down menus for the hour, minute and second fields to set the desired time. The selected date and time will be visible both in the top boxes and at the bottom of the view.
Next, click the Filter button to apply the filter criteria to the table.
Issuing of notifications
Notifications are sent to the user for each event generated.
The recipient(s) are configured during the rule creation in the Notification strategy field, where you define the strategy for notifying a contact or group of contacts about the event.
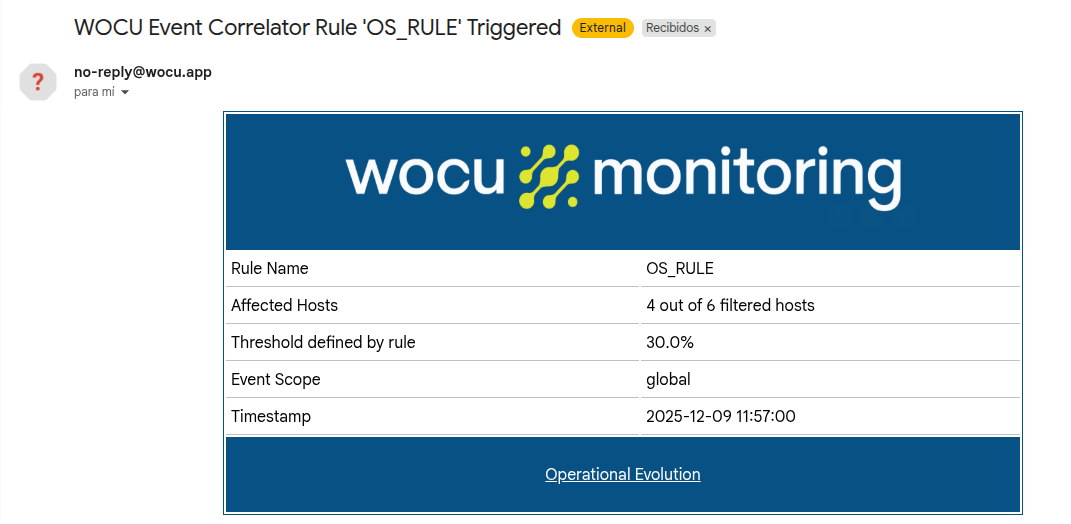
Each email notification includes key details of the event in question, to make it easier to identify and analyse.
The message states:
Rule name: the name of the rule that triggered the event.
Affected hosts: shows the total number of devices to which the rule applies and how many of them are currently in a Down state.
Threshold defined by rule: the configured threshold that triggered the event.
Event scope: the scope of the event as defined by the condition in the rule.
Timestamp: the exact date and time when the event occurred.
This ensures that the user receives clear information, enabling them to assess the incident quickly and take the appropriate action.