Release Notes 0.36
Below are the new features of version 0.36 of WOCU Monitoring, a tool in continuous evolution, which continues to advance and adapt to the needs of the market and the customer.
In this new version, new options have been added for more flexible asset filtering and searching, with a new alternative of searching by IP address in the Host inventory or restricting the view of realms based on their connectivity.
In addition, a new section BP Trace has been added to the Hosts and Services modalities, on causes of failure in a Business Process. The operator will now be able to visualise a tree traced from the Business Rule (BP Rule) to see in detail the status of the parts of the process and locate the root cause of an anomalous monitoring status.
Last but not least, we have a new look & feel. With this aesthetic renovation, we have tried to homogenise the look of the tool and achieve a more attractive design for the user.
Read on for a full list of what’s new in this version of WOCU and get the most out of all our latest features.
Interface
Connectivity filtering and new Realms display options
New elements have been added for filtering and displaying the data shown in the Home:
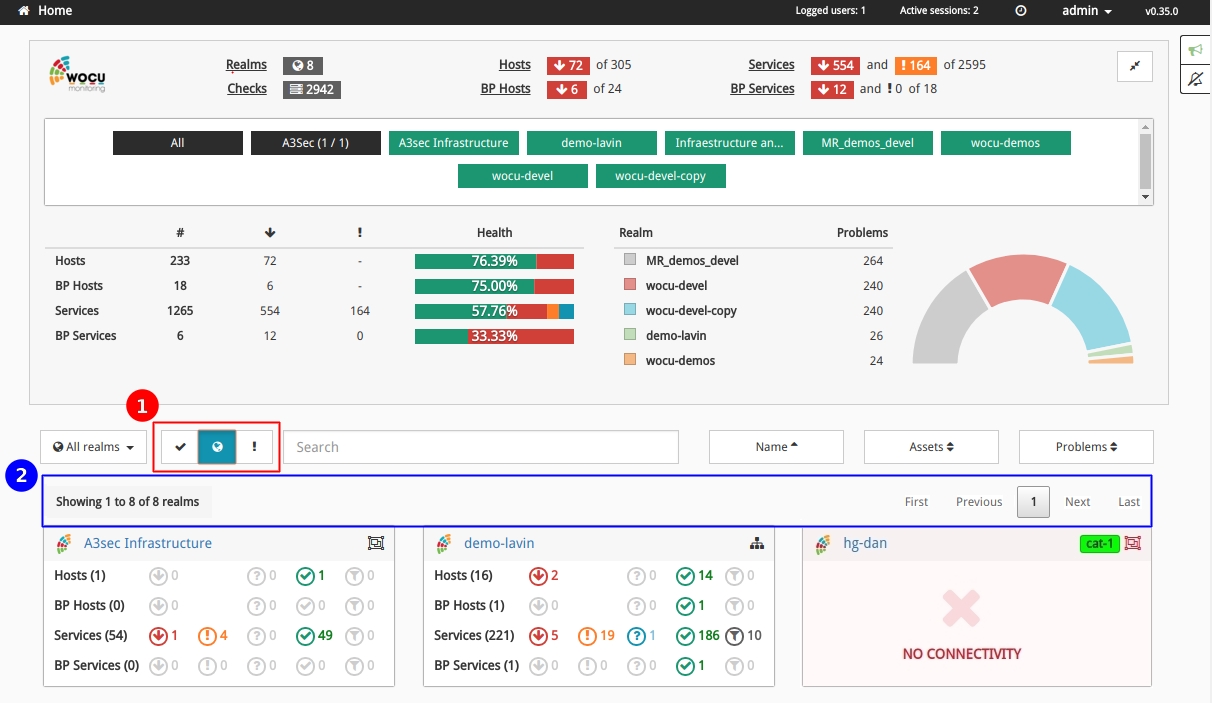
1) Filter realms according to their connectivity: with this filter it is possible to restrict the display of realm summary panels in the Home view, according to their connectivity and accessibility status. The possible options are:
Icon |
Typology |
|---|---|

|
Show realms with connectivity |

|
Show all realms |

|
Show realms without connectivity |
Note
More information can be found at: Filter by connectivity.
2) Informative and navigational elements for data visualisation: depending on the filtering option chosen, the number of realms presented will vary.
Therefore, at the top of the list of summary panels by realm, an information box has been added indicating the number of realms displayed in relation to the total number of realms associated with the applied filtering category:
Showing 1 to n of N” realms
Depending on the above configuration and filtering, the realms displayed will be arranged in different pages. The whole set of pages will be accessible through a pagination menu located at the top and bottom right of the current view.
These new functionalities are intended to guide the user and make it easier to navigate and read the data displayed, as WOCU supports extensive monitoring infrastructures, which can result in a large number of realms.
Nuevo look & feel
In this new version, WOCU has a new look, a general change of image.
With this aesthetic renovation, the aim was to homogenise the look of the tool and achieve a more attractive design for the user.
This is an evolution to keep adapting, growing and performing better in many more contexts. In addition, our personality continues to match the expectations of our users and therefore their interactions with the tool.
This change of appearance will be the starting point for the creation of customised style themes for clients, accommodating the working environment according to corporate visual attributes.
In short, the new visual identity becomes more cohesive and polished, while remaining true to the original WOCU line.
Search by IP address in the Host inventory
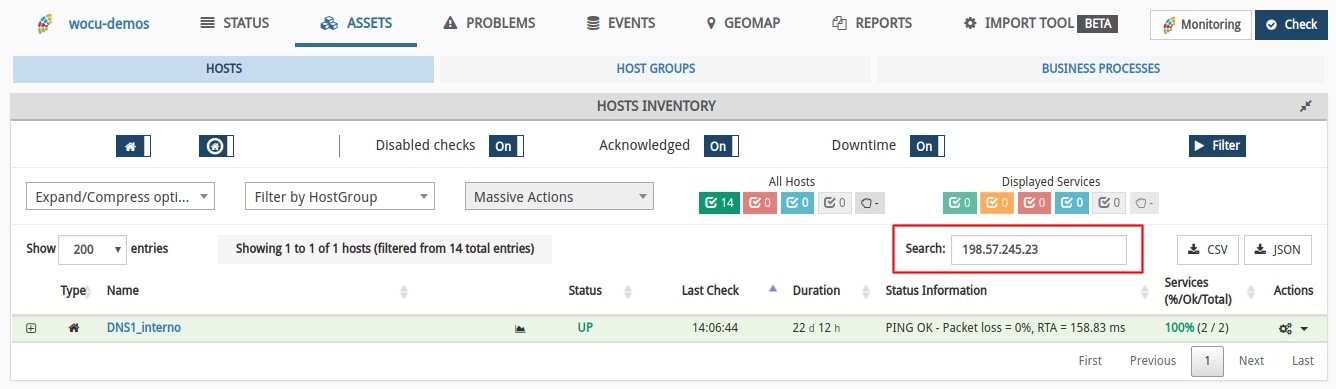
It is now possible to search by IP address in the Host inventory of the Assets section of a specific realm. Remember that WOCU supports very large technological infrastructures, so it is essential that the search tool is flexible and allows filtering the information displayed by various criteria and attributes, so that a particular Host can be displayed more easily in cases where there are very large inventories.
The following image shows how the system returns Host DNS1_internal when searching for its IP address.
New BP Trace tab on causes of failure in a Business Process
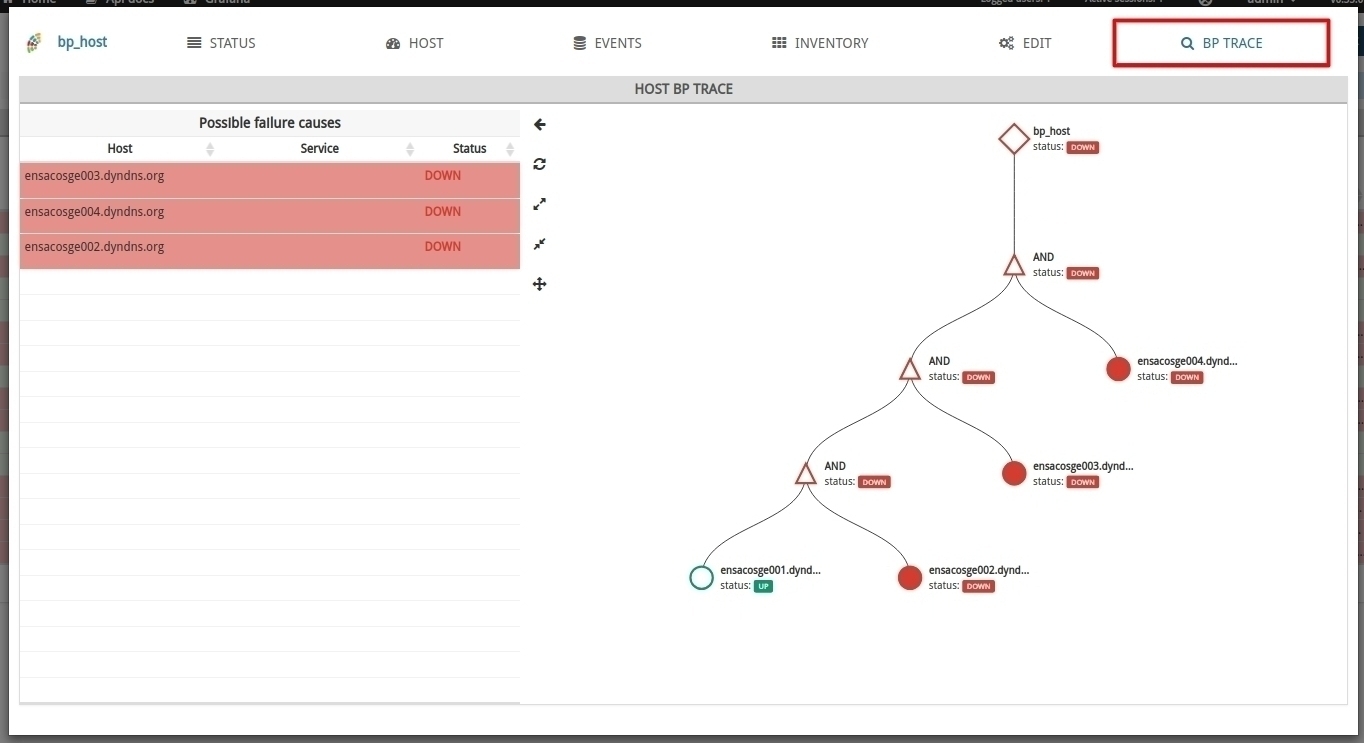
A new tab BP Trace has been incorporated in the modal (detail view) of Assets and Services associated to a Business Process. This tab shows a widget with detailed information on the status of the parts of the Business Process and the causes of its status, by means of a tree display traced from the defined Business Rule (BP Rule) of Assets. Thanks to the representation with nodes and logical relationships, in addition to knowing the state of the Business Process, the user will be able to analyse and locate the root cause of an anomalous monitoring state.
The widget consists of two parts:
1) Possible failure causes: a list of assets that are causing the Business Process to be in a Critical, Down or Unknown state. This list shows the name of the asset and its status.
2) Business Process Tree: a tree representation of the Business Process definition. This tree uses colour coding, shapes and labels to represent the status of each part of the Business Process.
Important
The colour of the tree nodes corresponds to their state.
The node labels contain the name and status of the node.
The shape of the nodes corresponds to their type.
Note
More information can be found at: BP Trace.
Import tasks
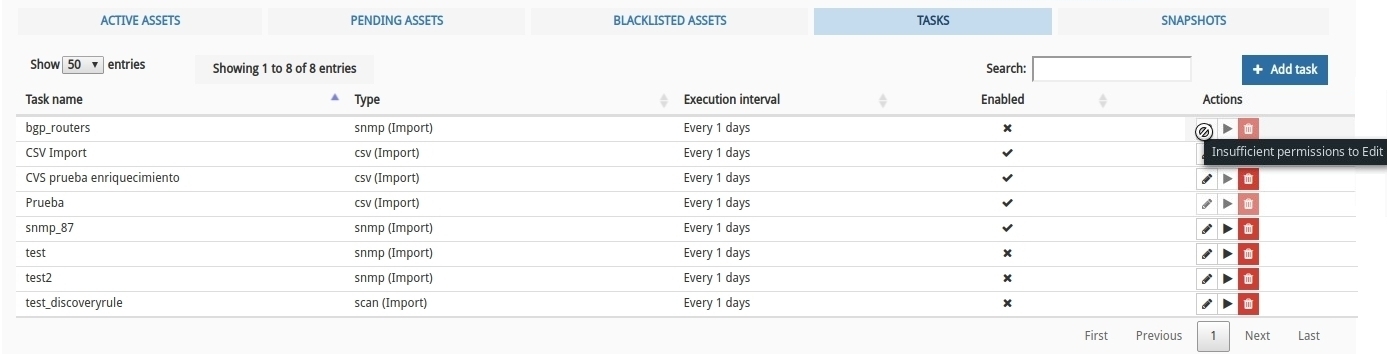
Disable actions on Import-tool tasks
It is now possible to disable certain actions in the Import Tasks (Tasks). These actions are, at the moment: create, edit, delete and execute. It is possible, through internal application configuration, to disable any or all of these actions on one or more tasks.
In case a certain action is disabled, it will be disabled in the interface, except in the case of creation, where it will simply be impossible to create the task if the creation action for that task has been disabled.
Monitoring packs
Manual reconfiguration of thresholds of the call-manager-cisco package
For technical reasons, the macro names of the thresholds in the call-manager-cisco pack have been changed. After this update, the system will apply the default values set in the pack, so the values defined in the previous macros will be lost.
For this reason, from now on, the operator will have to manually reconfigure the thresholds with the values they had previously configured. However, if the default values of the new macros seem valid, it will not be necessary to update them.
Note
Access the Monitoring Packs catalogue at the following link: link.