Release Notes 60
Date of Publication: 29/04/2024
This document covers the new features, functionalities, improvements, and fixes integrated into version 60 of WOCU-Monitoring, addressing the requests and suggestions of our users and current market needs.
The recent Aggregator Summary view has been enhanced to provide a more comprehensive overview of the monitored infrastructure, featuring new interactive graphs that facilitate exploring the operational status of assets and interpreting key data.
Likewise, the Metrics Services view has evolved with new visual and export functions. Among other developments, now all series of a metric are displayed in a single graph, simplifying monitoring, in addition to the PDF report export capability, which facilitates data exchange and contributes to more informed decision-making.
On the other hand, the information available in email notifications has been significantly expanded. System administrators can customize the subject and content of the message, as well as include additional relevant information for the notification, such as aliases or event impact.
We have improved our self-management system for the various components of WOCU-Monitoring. In this initial interaction, various checkpoints have been increased, significantly enhancing the information about the tool’s own health, reducing recovery times in case of anomalies.
Finally, the technical documentation of WOCU-Monitoring has been updated with three important additions: the creation of Monitoring Packs, user password changes, and Business Rules construction. Detailed and precise instructions are provided for each of them.
Without further ado, let’s delve into all the new features brought by this latest version of WOCU-Monitoring.
1. Evolution of the Metrics Services View
New visual and export functions have been integrated into the charts of Metrics within the Services Modal, which are detailed below due to their relevance:
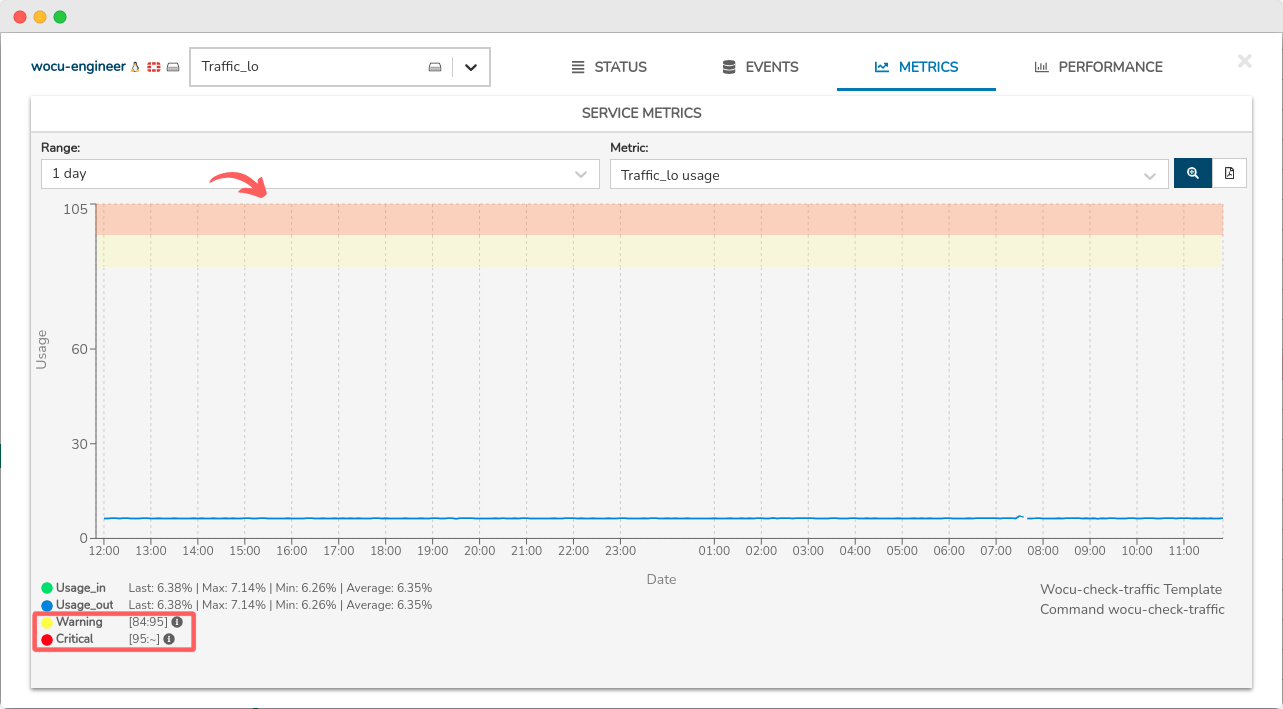
Dynamic Thresholds in Services
This parameter sets the value (in percentage) of the minimum threshold level of service considered adequate or acceptable. From now on, the Services graphs accept Dynamic Thresholds, which means this value is no longer fixed and can be dynamically adjusted within a predefined range. This update provides greater flexibility and adaptability in managing SLA levels.
In the graph, you can see how the Warning and Critical states are now configured with this new function, represented according to the ranges defined for each of them.
Monitoring of all series of a metric in a single graph
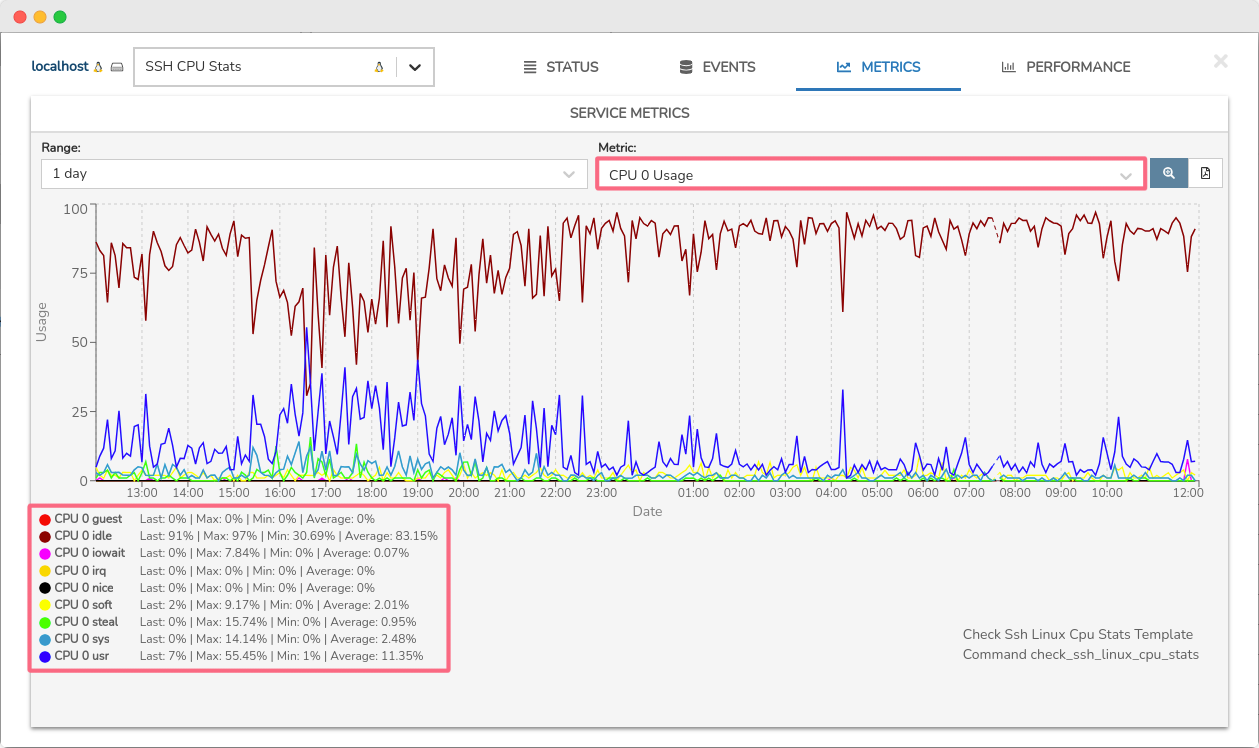
From now on, all series captured from the same metric of a Service are represented in a single graph. This facilitates resource monitoring on a broader scale, as it allows comparing and analyzing all series related to a metric in one place.
Identification of null values in the graph
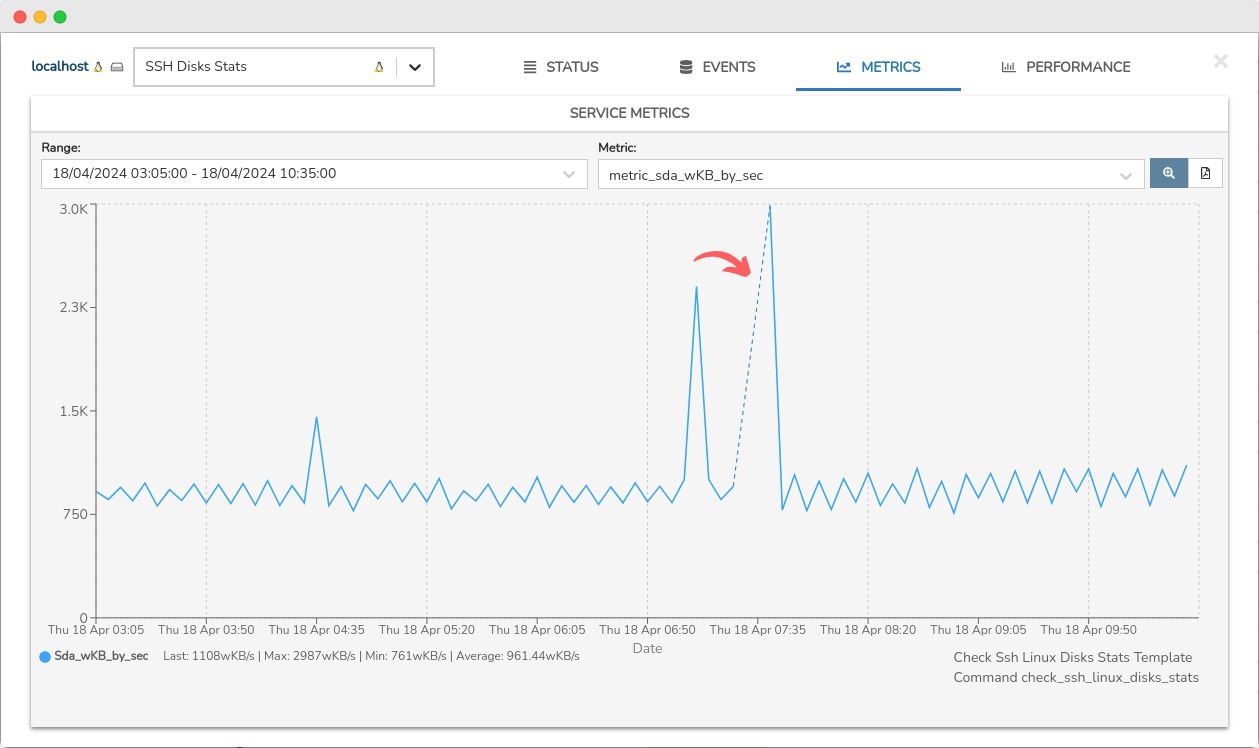
A new representation method for null values in Service metrics is included.
Previously, when there were no metric data available for specific points in time, the line showed a gap between adjacent data points; now, a dashed line is displayed, facilitating the identification of these null spaces.
Export of Metrics reports via the new button
Through the new Export button, the system generates a report in PDF format, which includes all the metric graphs associated with a specific Service. If the number of graphs is large, they will extend over several pages.
This makes it easier for users to save and share the collected information, thereby improving management and decision-making.

Additionally, these new reports are also available in the action of Export Metrics from a Host.
2. Update of the Aggregator Summary module
In this version, work has been done on the development and evolution of the Aggregator Summary view.
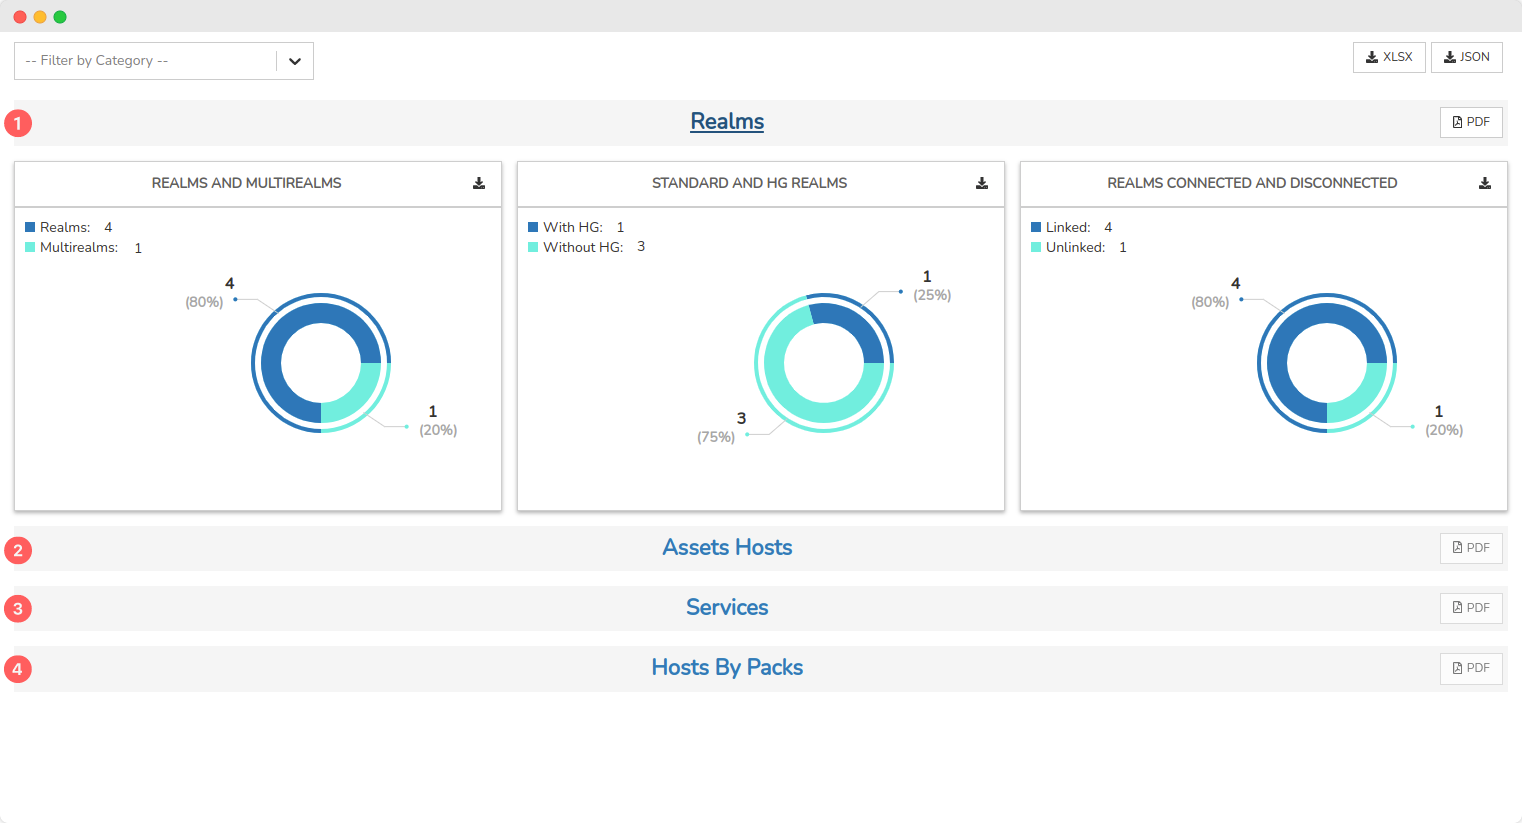
This space is conceived as a tool designed to provide a comprehensive view of the monitored infrastructure. It has focused on providing relevant information about the nature, connectivity, and configuration of the realms and member assets at the time of the query.
One of the main innovations is the introduction of new interactive sectoral graphs, which allow users to explore in detail the operational status of different assets, as well as simplify the interpretation of key data.
The view is divided into four sections and associated widgets:
These improvements represent our ongoing commitment to excellence in user experience and effectiveness in infrastructure management.
3. New Infrastructure Health Monitoring System
In this version, our self-management system for the different components of WOCU-Monitoring has been improved. In this initial interaction, various checkpoints have been increased, significantly enhancing the information about the tool’s own health. This system performs periodic checks, reducing recovery times in case of anomalies.
In future versions, additional features will be implemented, such as automatic notification of failures in components, aiming to enhance the Infrastructure view.
4. Extension of Fields in Email Notifications
Due to their relevance, work continues on the evolution of notifications. WOCU-Monitoring plays a crucial role in the proactive detection of network issues by providing system administrators with real-time insight into how their infrastructure is operating. And this is achieved through increasingly comprehensive notifications.
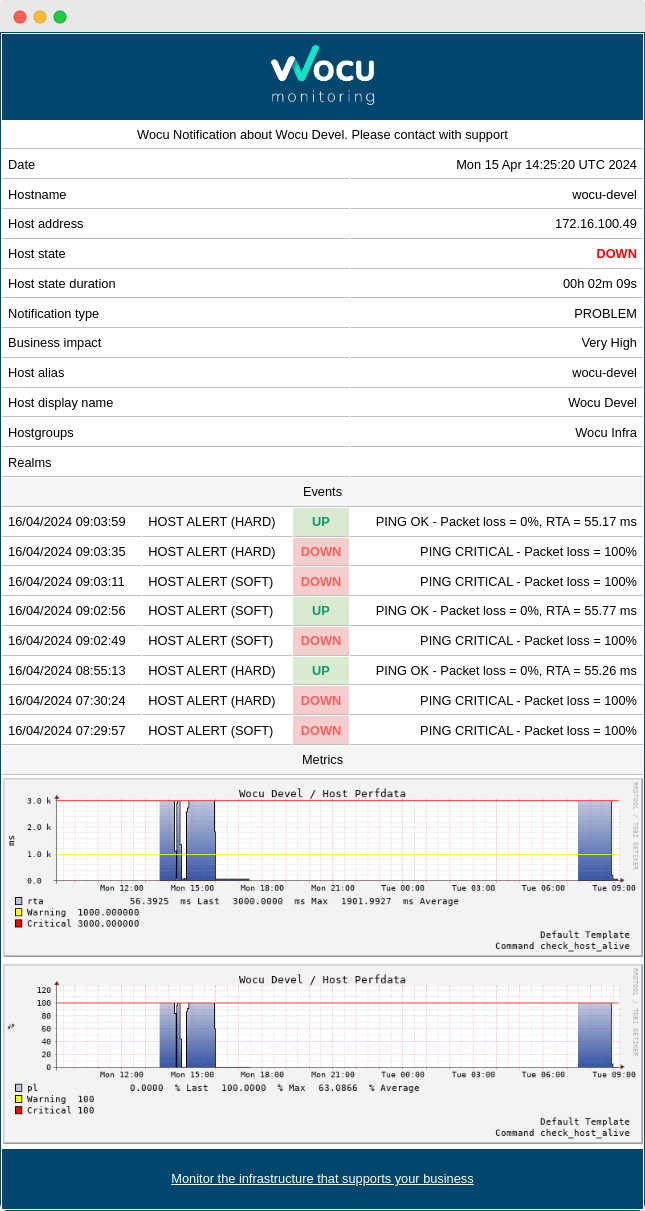
In this version, the information included in the email alert notifications has been expanded, adding the following parameters:
Email subject: field to enter the subject or reason for the email notification. You can use quick actions to construct a customized subject with information about the asset subject to the notification.
Notification message: field to compose the content of the email notification. In this attribute, there are also quick actions to construct a customized message.
Extra info: field that allows recording additional information to the notification of the asset that has generated the alert (for example, Alias, Business Impact, coordinates, etc.).
This greatly flexibilizes the construction of alert models adapted to user needs. See the following example:
5. Evolution of the Configuration Issues View
Given its relevance, in this version, work has continued on the development and improvement of the Configuration Issues view. The following are the details of the included updates:
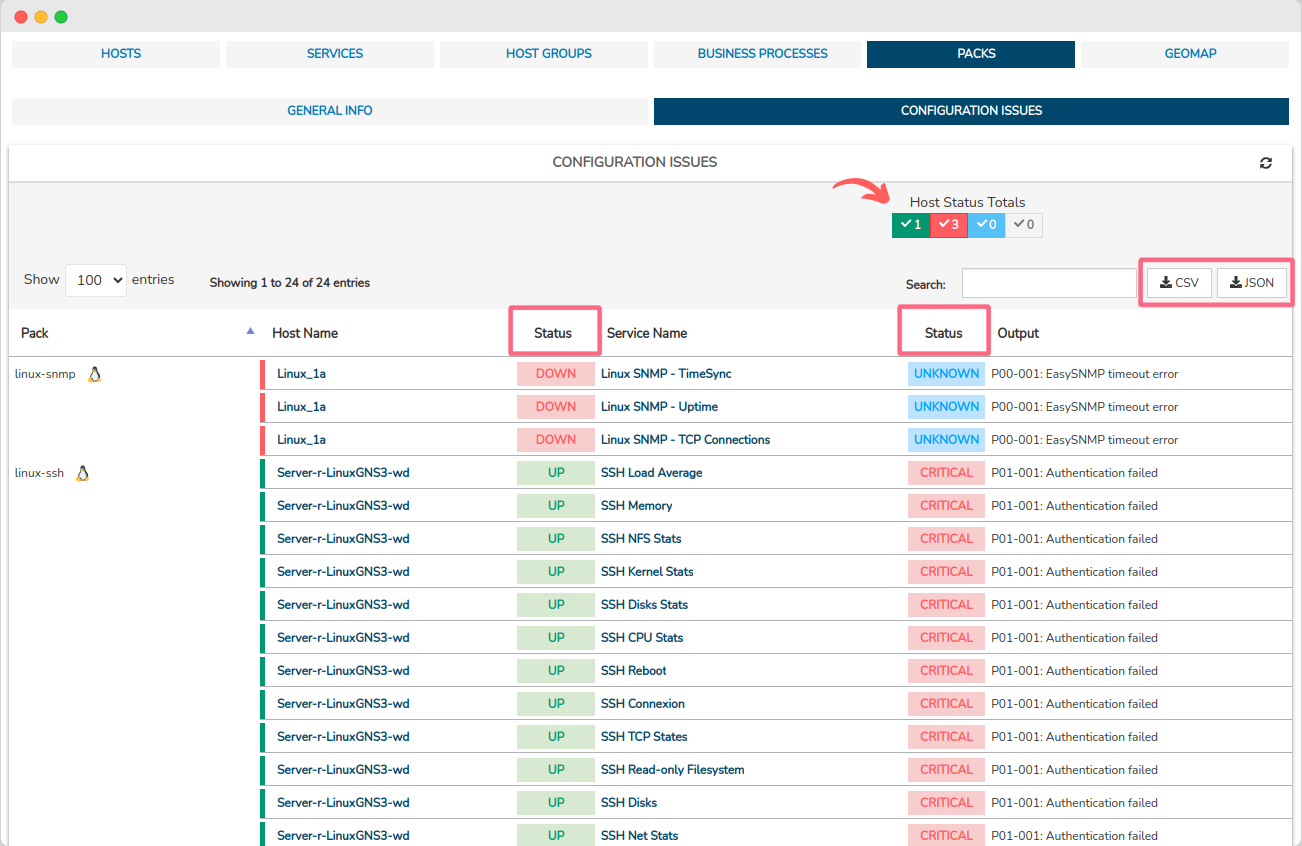
Columns Status of Devices and Services in the packs table. Through this field, WOCU-Monitoring provides information about the current monitoring status (in terms of availability) of Devices and Services associated with a specific pack.
New filter for Devices by typestatus: the Hosts Status Totals component modifies the display of the inventory, by filteringdata according to monitoring state registered in the assets (Devices and associated Services) listings.
Capability of Pack inventory data export: The export function is integrated in widely used formats such as CSV and JSON. This function facilitates the download of inventory data into a file for later use according to the diverse needs of the user.
6. New Contacts Section in WOCU Engine
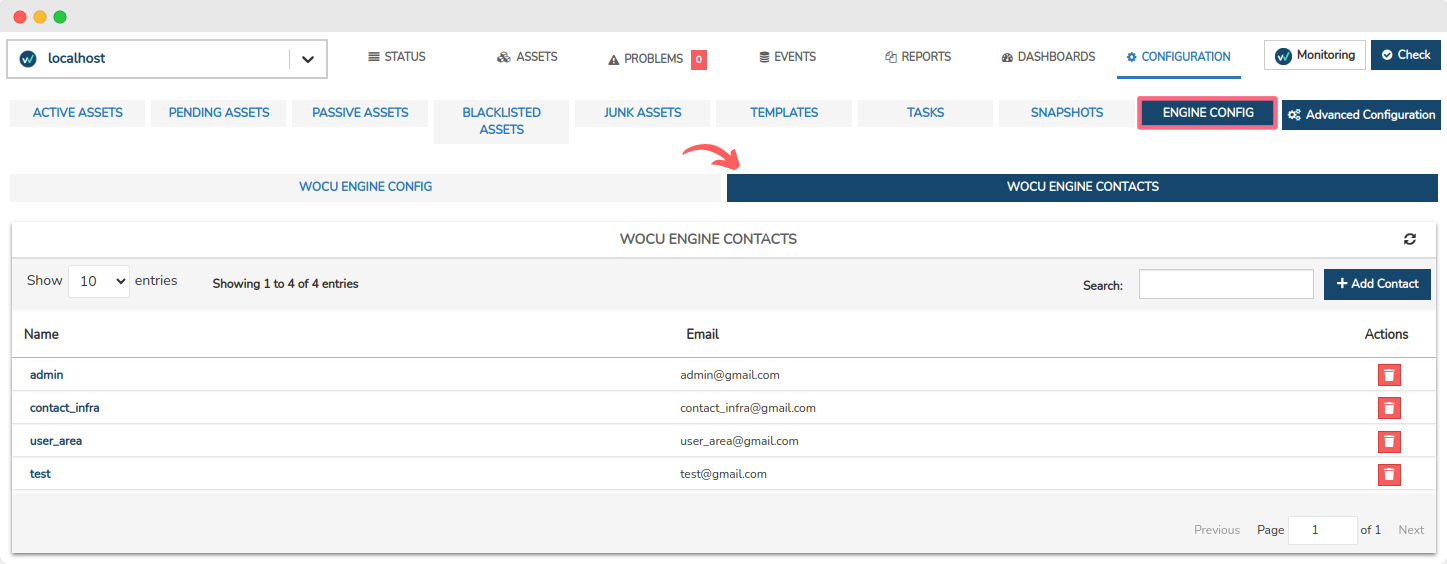
The Engine Config section adds a new subsection for the storage and management of contacts linked to the configuration of global notifications.
From the new space WOCU Engine Contacs, it is possible to edit, delete, and create new contact profiles designated to receive certain alerts or relevant messages. This functionality provides greater flexibility and control in notification management in Engine Config.
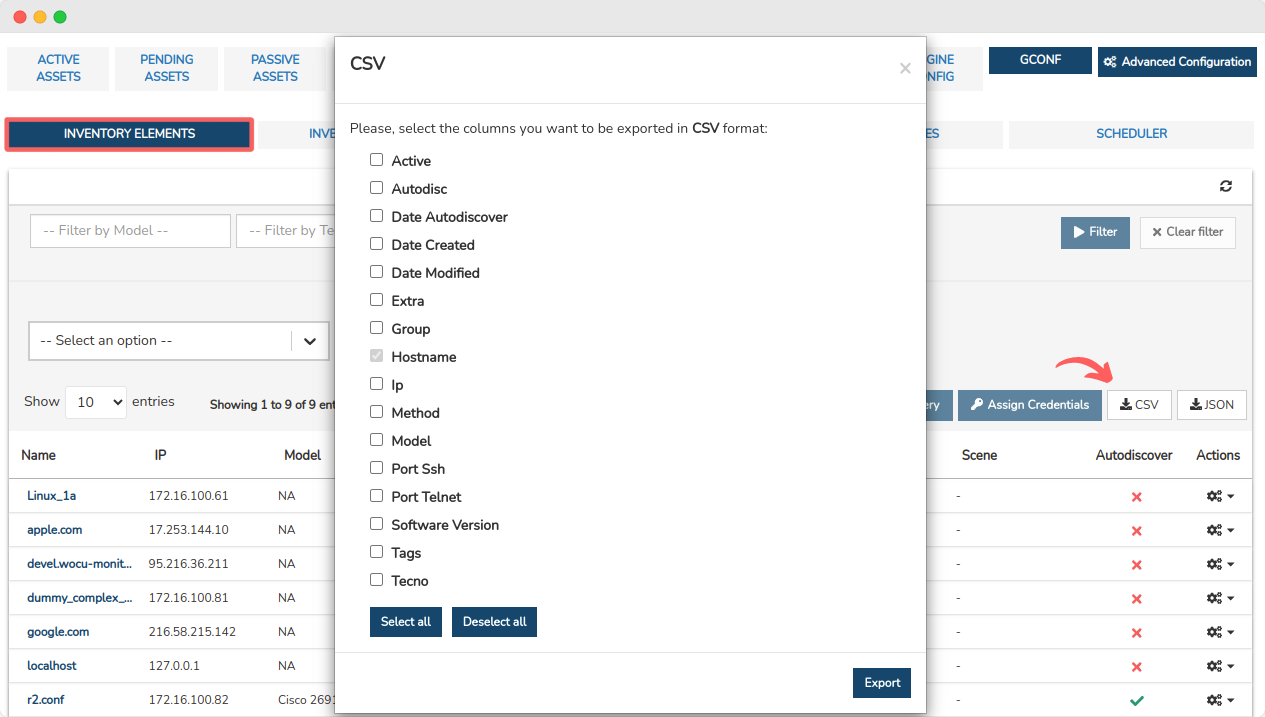
7. Data Export Capability in Inventory Elements
Although WOCU-Monitoring offers a multitude of functions for data administration, metrics, reports, logs, etc., there may be times when the use of other external tools is required to process such information.
To address this, a new option for exporting is incorporated within the Device Inventory of the GConf Module. As in the rest of the application, the possible formats are CSV and JSON.
The download of report data is useful for subsequent use according to the diverse needs of the user. Now, with the capability to export data, users can perform deeper and customized analysis using other third-party tools.
8. Asset Exclusion in Gconf during Import
The newly integrated task of Asset Import to Gconf (Gconf_import) has been updated in this version. Its function is to import new assets into WOCU-Monitoring which, initially, will be placed in the GConf for further processing.
This time, the new field Exclude gconf csv has been included to attach a file in CSV format with assets to exclude from that module. That is, Devices that will be automatically ignored during the import activity, instead of being imported into the GConf, for subsequent configuration management, backups, and version control.
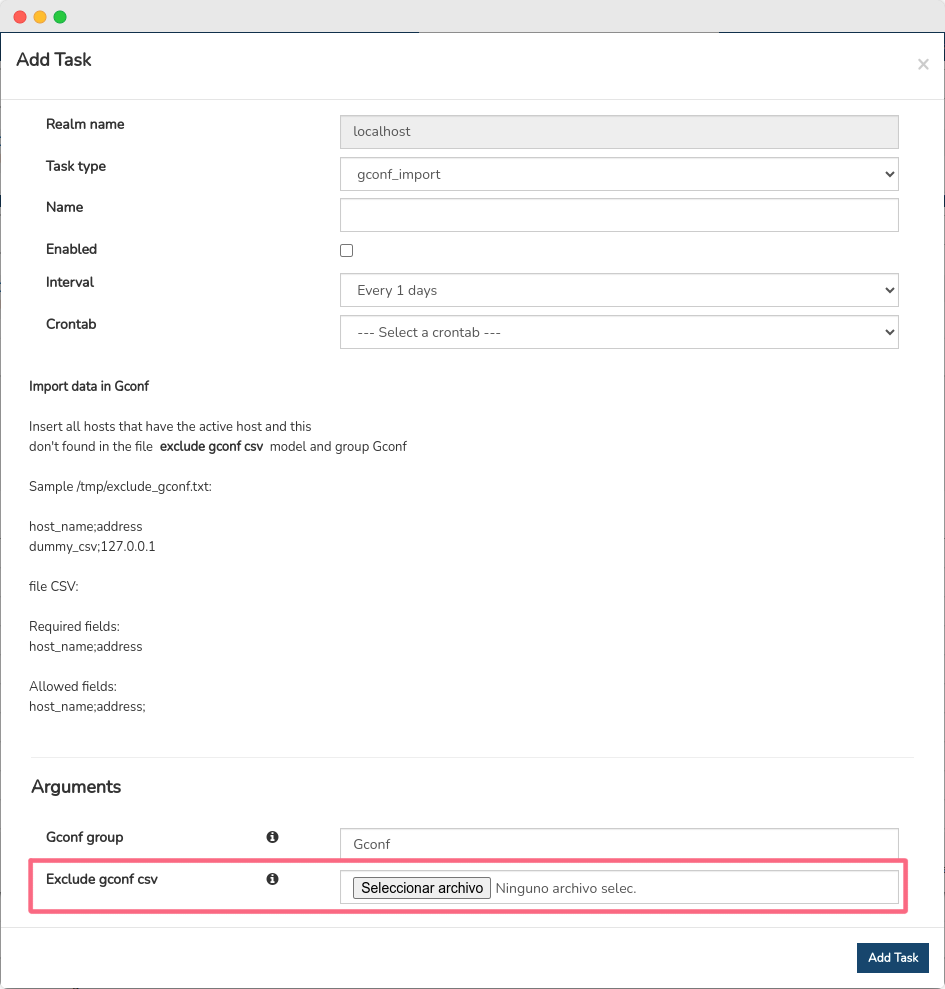
This update provides greater flexibility in task execution.
9. Update of WOCU-Monitoring Technical Documentation
Use Case on Creating Monitoring Packs
Due to its importance, the process of Creation of Monitoring Packs has been documented. This addition includes step-by-step instructions for creating and configuring packs efficiently, ensuring that users have detailed and accurate information.
Discover everything that WOCU-Monitoring can monitor through these packs here.
Use Case on Changing User Passwords
Another new addition to the WOCU-Monitoring Administration Manual is the use case for Change or reset the user password, essential for ensuring security and efficient management of user accounts in the tool.
It’s a simple process, but it involves several steps explained in detail in this guide.
Section on How Business Rules Are Constructed
WOCU-Monitoring is capable of monitoring Business Processes through the definition of Business Rule. These logical rules are an essential component within process management and monitoring.
The creation of rules is highly flexible and can be as complex as spanning from the hardware layer, operating system, network, and applications to user experiences. It can also be simplified, based simply on the states of a device.
For more information, we invite you to explore the new section: Business Rule.
10. Monitoring packs
Check out our catalogue of Monitoring Packs in the following link.
New packs Wocu traps health
A new pack has been developed for monitoring the health of the Traps reception service in WOCU-Monitoring.
Includes the following services:
Directory
/var/spool/snmptt: alert if the number of unprocessed files process exceeds the thresholds.Trap buffer: monitors that the socket receiving SNMP traps is listening, and that the number of traps in the buffer does not exceed the thresholds.
Demons: monitor the status of the
snmptt,td-agentandredis-server. Other new processes can be added involved in the SNMP trap service.
New pack Fortigate tunnels
New pack designed to monitor the VPN tunnels existing on Fortigate devices.
The pack includes a discover that allows you to select the tunnels you want to monitor.
One service shall be created for each selected tunnel, and these services shall, shall return CRITICAL status when the tunnel status is DOWN, “will return OK status when the tunnel status is UP.


New pack F5 tls licenses
The new F5 tls licenses pack has been developed to monitor the expiry date of TLS certificates installed on a branded F5 device.
The pack verifies all installed certificates in a single service. It detects if they are expired or about to expire, and if the number of days remaining to expire is less than the number of days set by the thresholds, the service shall issue an alert and indicate which specific specific certificates triggered the alert.

The pack configuration includes the macro _EXCLUDE_REGEX, which allows, through a regular expression, to exclude which allows, through a regular expression, to exclude the names of the certificates to be excluded from the check.
An extended output has been added to the service with the complete list of certificates, sorted by those that have expired, those that expire in less than one month, those expiring in less than one year, those expiring in more than one year, and the certificates excluded by the macro _EXCLUDE_REGEX.
Finally, also included are metrics indicating the number of certificates included in each category (total, expired, near expired and excluded).

Other improvements and fixes
Every new version is full of small changes, fixes and optimisations that should be briefly highlighted. We list the most notable ones in this version:
The attributes Name, Address, Alias and Display name of the table Host Info include the new function of copying (to the clipboard) of the information they record. This facilitates the process of copying data in one click.
Fixed a global bug in the tool, caused when the had the proper permissions on the Downtime and attempted to execute on Devices and Services.
Fixed an error in the display of Hosts Inventory, caused by not having the proper permissions on the action Add comment to host.
New fields/attributes are modified and added in export actions (in CSV and JSON formats), present in Hosts Inventory and Business Processes Inventory.
New fields/attributes are modified and added in export actions (in CSV and JSON formats), present in Hosts Inventory and Business Processes Inventory.
The library used for the representation and graphics display. From now on, when positioning the cursor over a region of the graph, the rest of the sectors will take on a dimmed, highlighting the selected location.
The position of the date configuration panel is modified during the new-scheduling, to avoid display errors.
The Multimetrics Reports prior to the version in use, are again are again available for consultation.
Fixed a bug in deleting devices from Junk Assets.
The add comments button of the Add comment to host action, is operational again.
Fixed certain minor bugs in the Reports module.
An additional information message is added when trying to download Availability Periods Reports (in PDF format) when these are too heavy.
The TOP HG has been reset to represent all Host Groups, regardless of significant disparities in size.
In this version, the routing of the application has been implemented, which makes it possible for users to share specific points in the Kingdom. This enhancement promotes a smoother and more enriching user experience, fostering and simplifying communication and collaboration between users of the application.
Fixed a bug in the time period selectors when configuring the same time interval.
Informational error messages are incorporated in the action Program drop time so that the user is aware of the nature of the error and can act on it.
From this version onwards, both tables in the Problems, will show their entries sorted according to the field Duration.
New functionality added to the Filtros avanzados (Advanced Filters) section’s Problems. Specifically, the inventory can be filter by Alarms associated with Devices experiencing a rapid alternation of monitoring state changes, known as Flapping.
The Macros attribute is added in the forms of export in CSV and JSON, within Inventory Hosts in Monitored Assets.
The new UTC selector is added in the Report Schedule Creation Form, for the selection of the time zone to be taken into consideration for the data collection for the new report.
The sorting method of the Multimetrics Reports tables is is performed by the Host name column and its associated metrics.
The operation of the Filter by Monitoring Packs present in the Hosts Inventory.
In the Geomap section of Multi-Realm, under Devices that share Display name, the Realm to which it belongs shall be indicated with the in order to avoid identification problems.
Fixed a bug in Metrics Evolution Reports configuration that occurred when the Chart Title field was not defined.
Updated software
As always, other pieces of software have been incorporated and updatedin this new version of WOCU-Monitoring:
Software |
Previous version |
Current version |
Observations |
|---|---|---|---|
LMD |
2.1.7 |
2.2.0 |
|
Fluent |
0.12.43 |
1.3.3 |
https://www.fluentd.org/blog/fluentd-v1.3.3-has-been-released |
About WOCU-Monitoring
WOCU-Monitoring is a monitoring tool that integrates the latest Open Source technologies for monitoring, visualization, metric graphing, and log management, providing extensive visibility into the status and availability of network elements, servers, databases, and workstations (among others). This is achieved through custom Monitoring Packs.
In addition to the Free, the Enterprise version of WOCU-Monitoring allows for deployments of thousands of IP devices in a distributed environment, with customizations tailored to the infrastructure of each client.