Release Notes 50
Publication Date: 04/04/2022

This document deals with the new features, functionalities, improvements and corrections integrated in version 50 of WOCU-Monitoring, responding to the requests and suggestions of our users and the current market needs.
Always committed to an optimal user experience, this version introduces a new realms selector that makes it easy to change realms from anywhere in the application and without the need to go back to the start.
In harmony, the Services Inventory has been provided with a new option of filtering by Host availability status types, of which you want to visualise their monitoring services. In addition, the user will be able to manage all the search options and filters applied on the inventory, from the new function of visualisation of applied filters.
The icons identifying technologies, manufacturers, usage patterns, etc., are once again present in this version thanks to the inclusion of the Behaviour field added in the detailed view Host, where all the icons associated to services and monitoring packs of the Host are listed.
A new control and restriction measure is incorporated, which blocks the action of deleting elements that are associated with Business Processes. Thus, any element linked to a Host Business Processes or Service Business Processes will be frozen by the system, since its elimination could leave orphan elements. This new condition will be indicated through the Protected column in the Monitored Assets table and with the new informative action in the Junk Assets table.
This is not all, the Diagnostic Tool continues to be refined with new configuration parameters, custom development of Monitoring Packs and various refactorings that promise a more homogeneous and cohesive design.
Without further ado, we will now take a closer look at all the new features of this new version of WOCU-Monitoring.
1. New Realm selector and status info button
WOCU-Monitoring is a tool that seeks to simplify, streamline and transform processes.
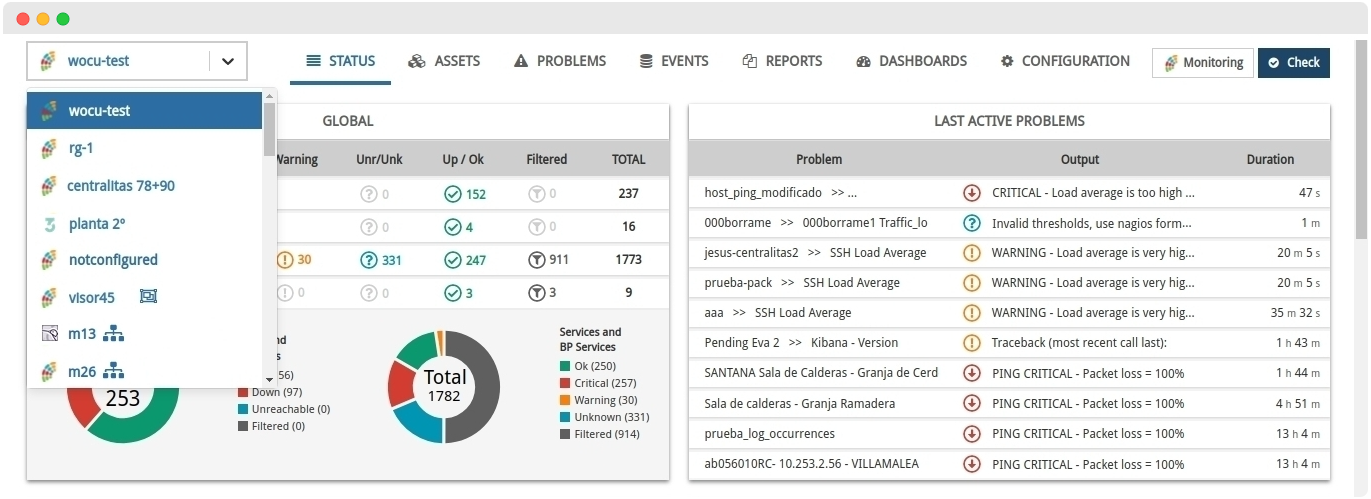
Based on this, a new permanent Realm Selector has been included in the main-header, in order to be able to switch realms at any time and from any location in the tool, without having to go through the Home.
When a Realm is selected, the view will be updated immediately, showing in the first instance the Status section, with detailed information about the chosen infrastructure.
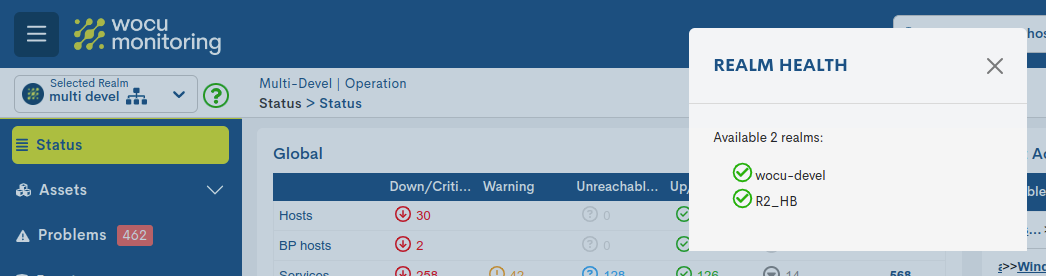
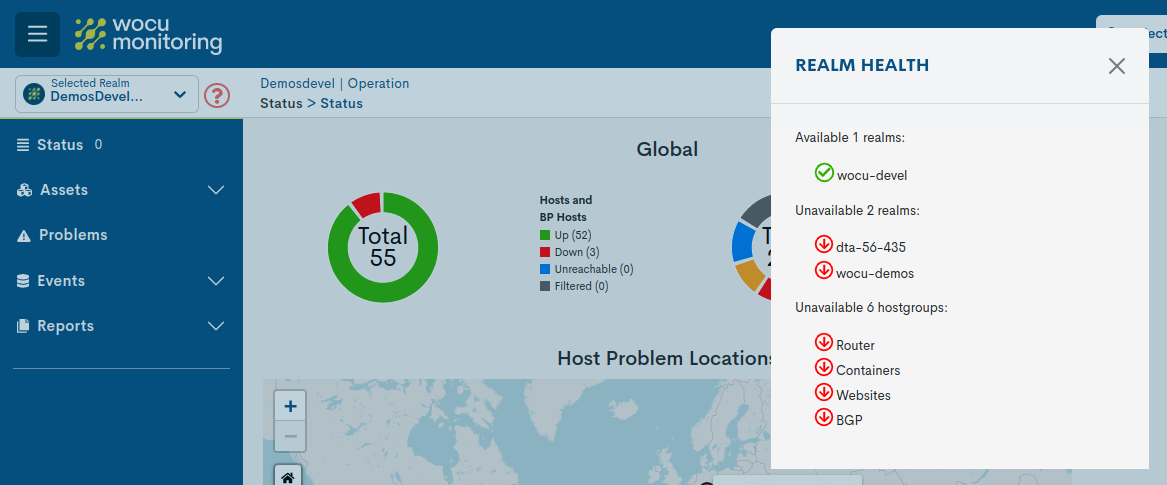
Another element introduced is the new Information on the health of Multi-realms and Realms based on Hosts Groups.. Clicking on the ? icon (next to the Realm Selector) will bring up a new information window, which provides a breakdown of the status/availability of the positioned Realm.
It is very simple, the system will proceed to determine and assign a global status according to the availability of the different entities that make up the Realm. That is, if all the member entities of the Realm are operational, the ? button will be shown in green; if, on the other hand, there is a loss of availability of one of its members, the button will be shown in red (always associated to a negative scenario).
Remember
This button will only be displayed in Multi Realms and Realms based on Host Groups, never in standard Realms.
Although this new function is merely informative, it is another way that the tool offers to know the current situation of the monitored infrastructure. There are no more excuses for having everything under control.
2. Optimising the Monitoring Services Overview
WOCU-Monitoring offers various filtering functions to keep inventories, tables, dashboards, etc. as clean and uncluttered as possible, so that the operator can concentrate on an orderly and smooth management and search of assets.
In this version, work has been done to refine and enhance the centralised view of monitoring services given its high information load. To this end, the following functions have been introduced and are detailed below:
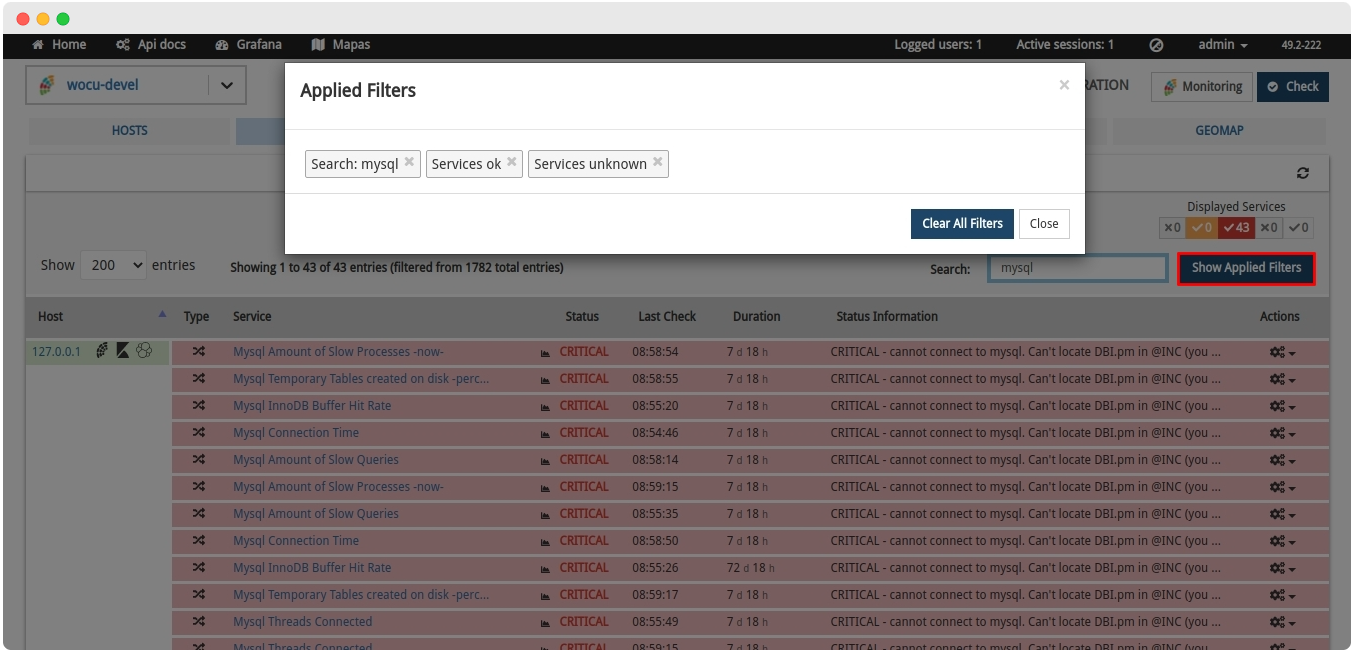
New styles to highlight and emphasise the search applied and to be able to know at a glance by which specific criteria the page is being narrowed down.
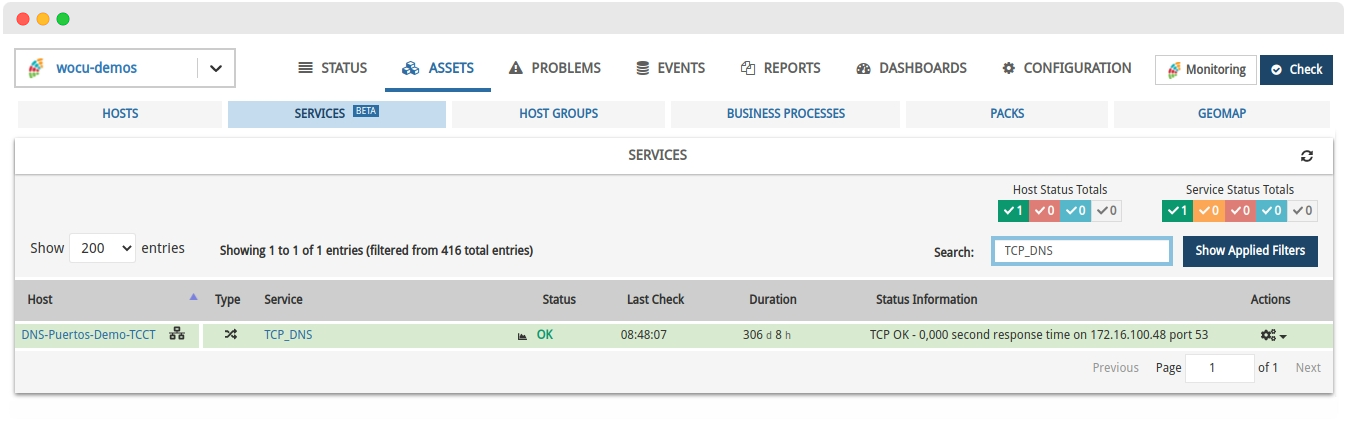
New function for the Filtering by availability status types of Hosts, of which you want to display the associated Monitoring Services. It works very simply, by clicking on a checkbox, the filtering option is toggled.
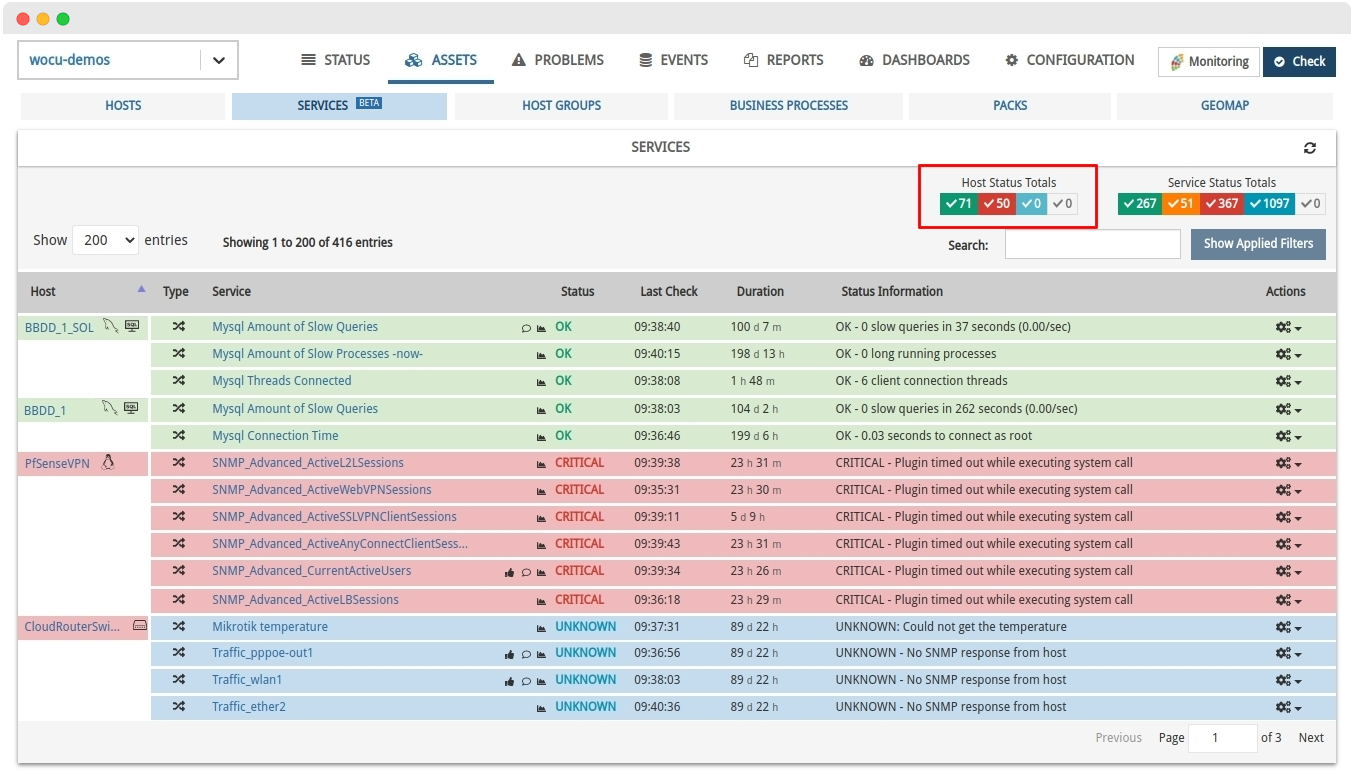
To control and manage the above functions, a new Show Applied Filters Button has been added, which shows the user the filters currently being applied in the listing. This button will be disabled when all assets are presented and none of them have been excluded.
These latest integrations are intended to increase the functionality and dynamicity of the view.
3. Implementation of actions on monitored services
Since version 47 added the Services Inventory (in BETA state) to the solution, this view has been subject to change. On that occasion, it adds the ability to execute a wide variety of actions on each of the Services inventoried. These include:
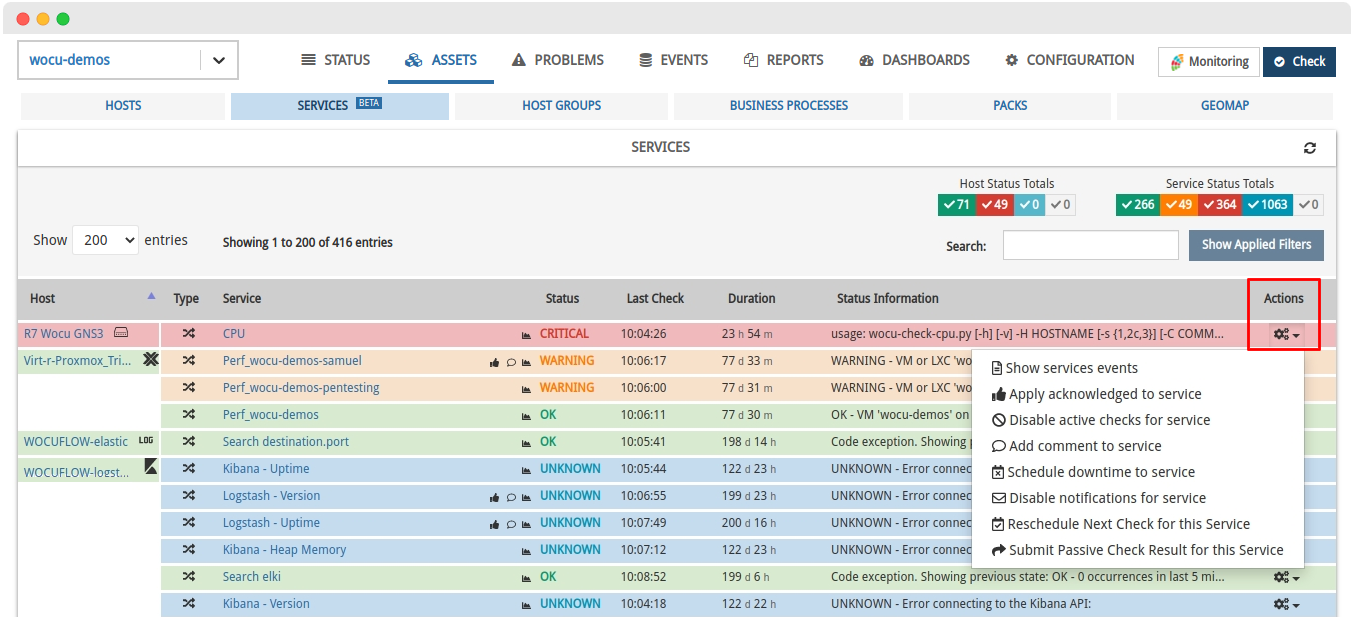
Like the Hosts Inventory, this view brings together all the operations and monitoring tasks that the operator requires for the comprehensive control and maintenance of the IP infrastructure.
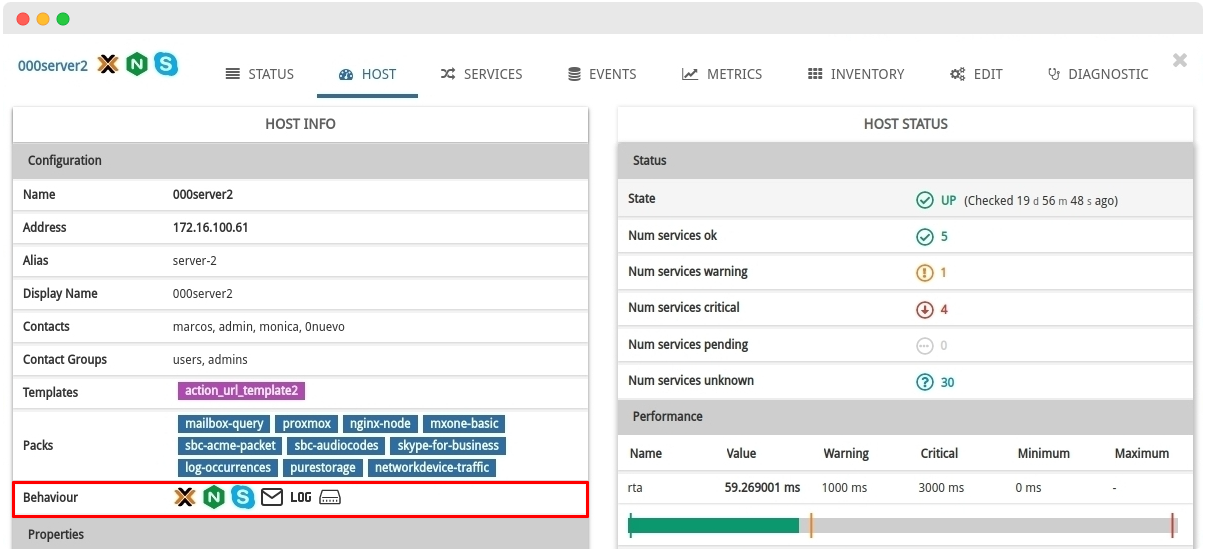
4. New field Behaviour with the complete list of icons associated to Packs.
In the rendering of identifying icons for technologies, manufacturers, usage patterns, etc., the system displays a maximum of three icons ordered by a scale of weights already stipulated, with the intention of avoiding overloading or saturating headers, menus or other blocks of information
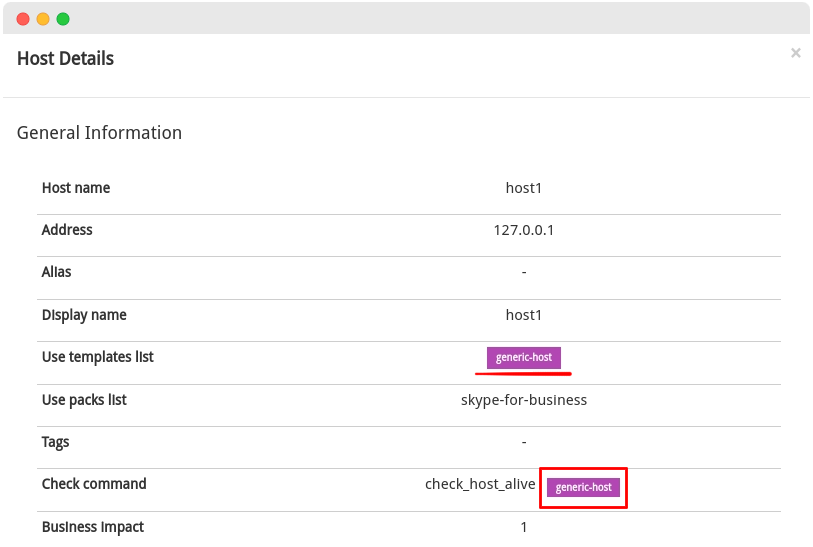
In accordance with the above criteria, the new Behaviour field has been integrated in the Host View of the Host Mode, where all the icons associated with monitoring services of the Host are included, without discrimination due to lack of space or any other reason.
5. Marking of attributes inherited from Templates
The use of Templates serves as a basis for the creation and registration of new assets, identifying default values for their attributes and streamlining the mass creation of similar hosts.
It is important to note that the assignment and aggregation of Templates in no case overwrites values, only empty attributes are filled in, thus inheriting the predefined value. The order of selection of multiple Templates is also taken into consideration, as the attributes of each Template will be inherited in a sequential order from left to right.
How to differentiate which attributes are inherited from Modeling Templates?To identify this situation, in the Monitored Assets and Pending Assets information form, any inherited attribute will be accompanied by a coloured label, which indicates that the assigned value has been inherited from the Template linked to the Host in question.
With the addition of this new element, the nature of each attribute can be clearly displayed.
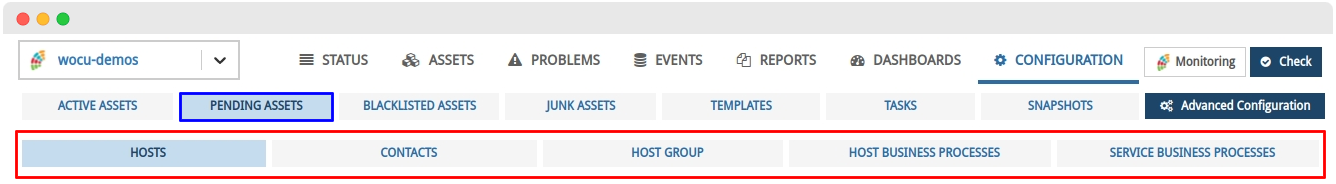
6. New asset information elements in Junk Assets.
The Junk Assets section incorporates several new options that extend the information provided by each rubbish asset in the global table. These are detailed below:
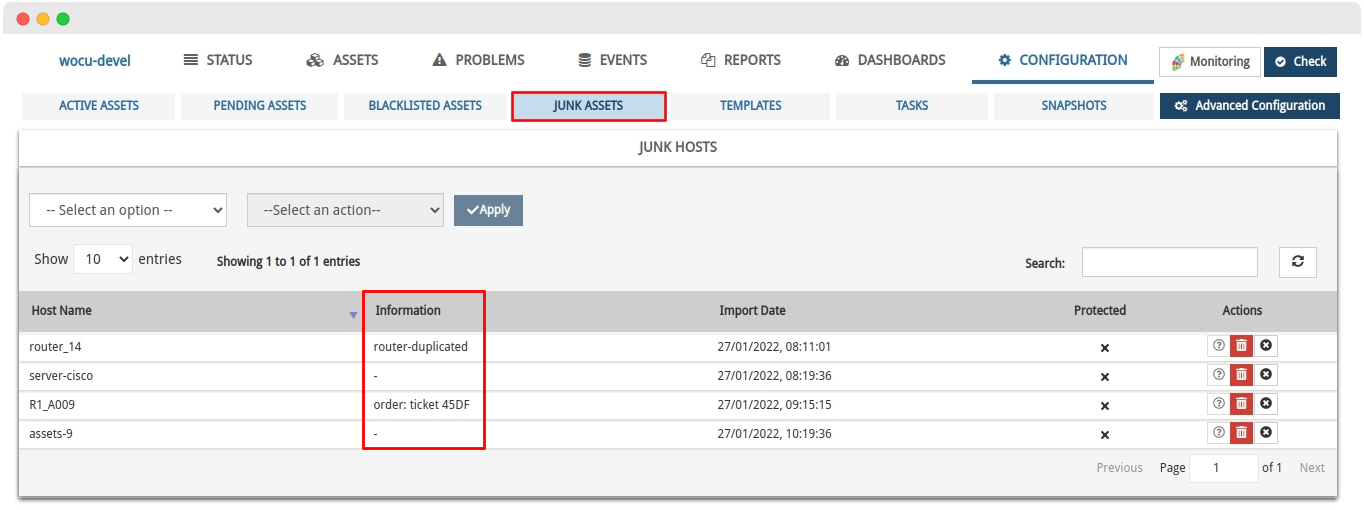
New Information column with data exported from CSV_Delete:
With the recent addition of the CSV_Delete task to our import module, mass asset deletion processes have been significantly streamlined. In order to further increase its usefulness and scope, this version now supports the new Information field (to be included in the CSV file), to write down any relevant data about the asset to be deleted that the operator considers appropriate to share with the rest of the users (Example: reason for deleting the asset).
Example of csv:

    host_name;information
    dummy_123;asset_duplicated
This data will also be reflected in the new Information column added in the Junk Assets table, the space where the assets to be deleted are received and temporarily housed, in order to assess their definitive removal from the monitoring plant.
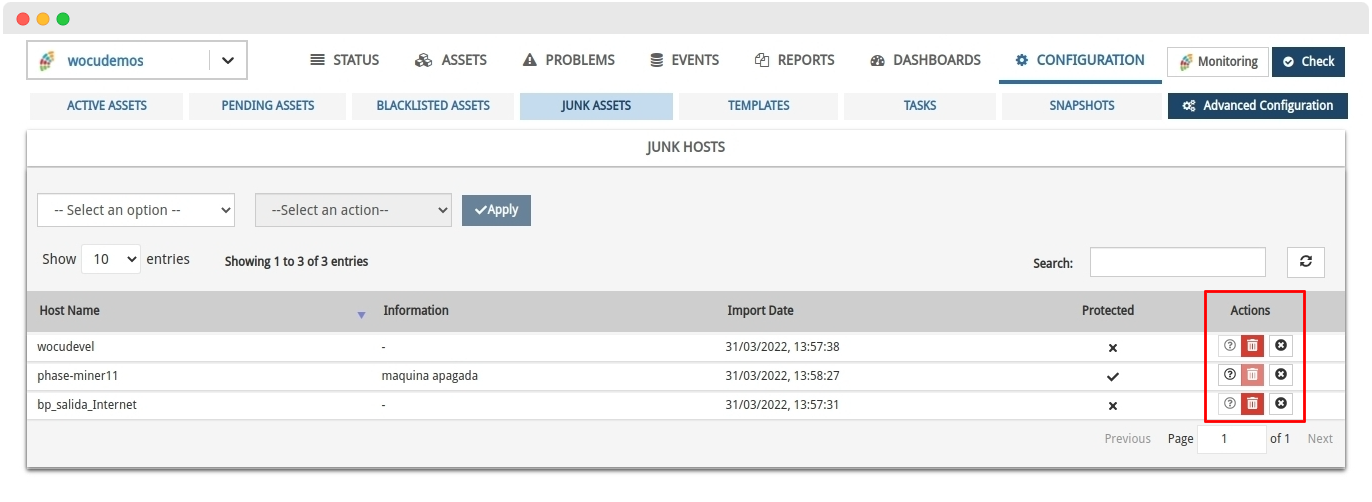
Information button on the status and reason for Host protection:
In order for the operator to get a complete overview of the current status of each waste Host, a new information option on the possible dependencies of the Host to be discarded is included.
Pressing the button identified with the ? icon, positioned in the table actions, will display the Host Dependencies information window, which indicates the Host Business Processes or Service Business Processes of which a Host in question is a part.
It is essential to understand this correlation as it is the cause of the Protected status of the Host and, consequently, of the blocking of the erasure action. This condition interferes with the natural operation of asset management.
The following data are displayed in a tabular format:
Business Process Name: name of the Business Process (logical entity) with which the Host is associated.
Dependency type: typology of the referenced logical entity. The possible options are:
Host Business Processes
Service Business Processes
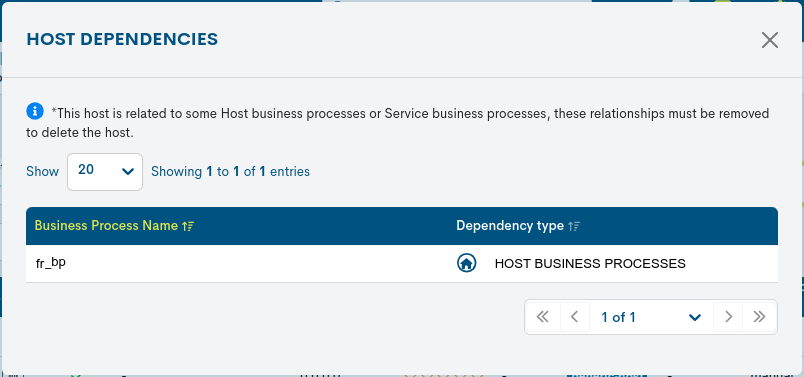
This option shall be enabled exclusively in protected Hosts, so that the user shall be able to know what causes this blocking situation. Until the user unlinks the Host from the Business Process, it will not be possible to remove it from the system or from the table, as appropriate.
This new restrictive measure mitigates the proliferation of internal bugs in the tool.
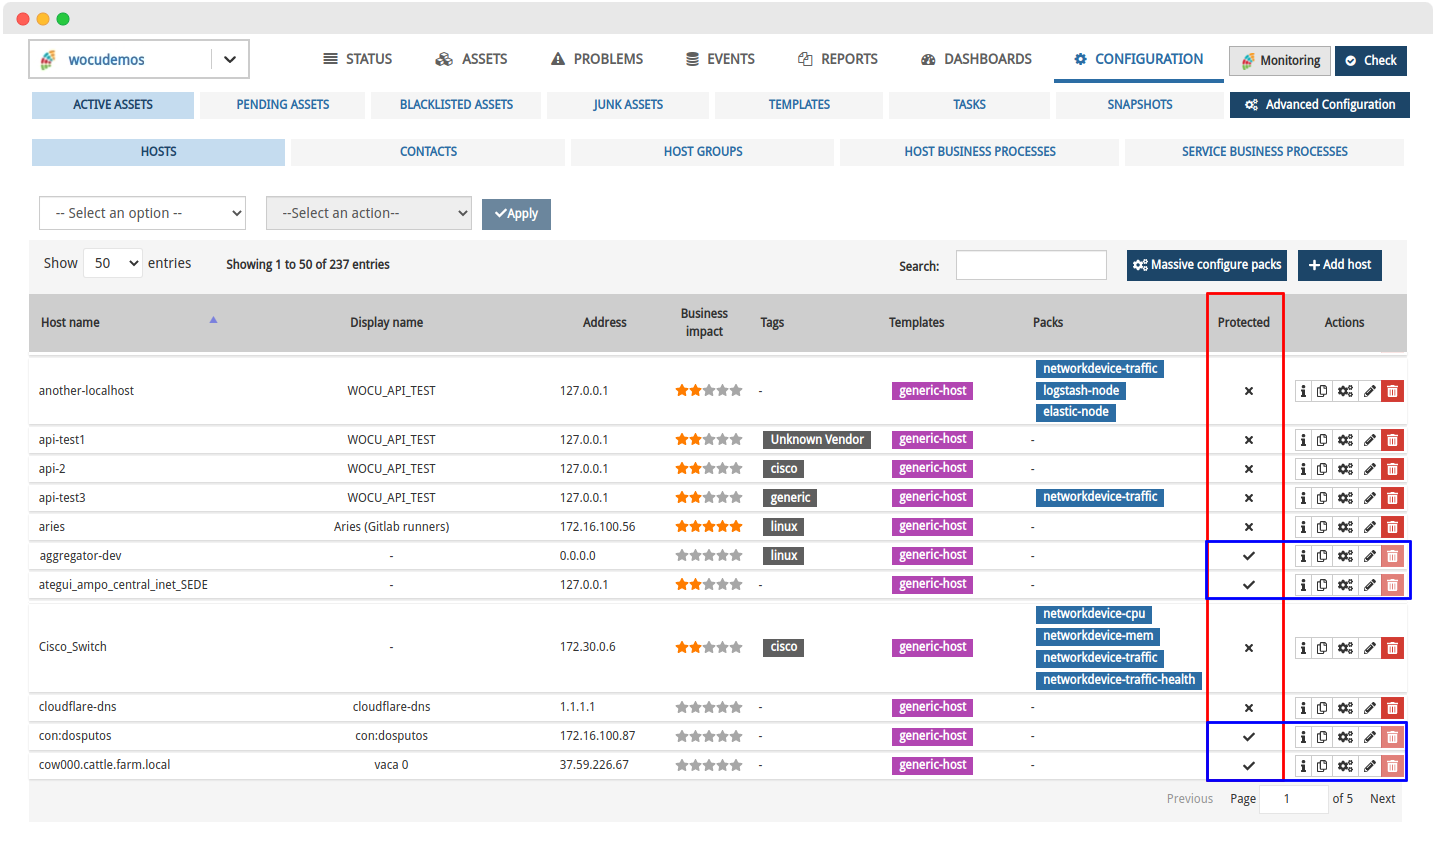
7. Blocking the wiping of Hosts associated to Business Processes
In the global listing of Hosts, a new restriction on the Delete action of Hosts integrated in Business Processes is included. Thus, any element linked to a Host Business Processes or Service Business Processes will be blocked by the system, since the deletion of Hosts must not leave other orphan elements in any case.
This situation will be indicated through the new Protected column, where each Host will be able to experience two possible states:
Protected: identified by the icon ✓. Indicates that the Host is locked, preventing its removal from the infrastructure by means of the deletion action (will be greyed out). This process shall be removed or unlinked from the Host.
Unprotected: identified by the x icon. Indicates that the Host is not locked and can therefore be erased from the system as there is no limitation.
For an efficient and stable use of the tool, constant maintenance and debugging of the monitored network is recommended in order to curb possible synchronisation errors in the system.
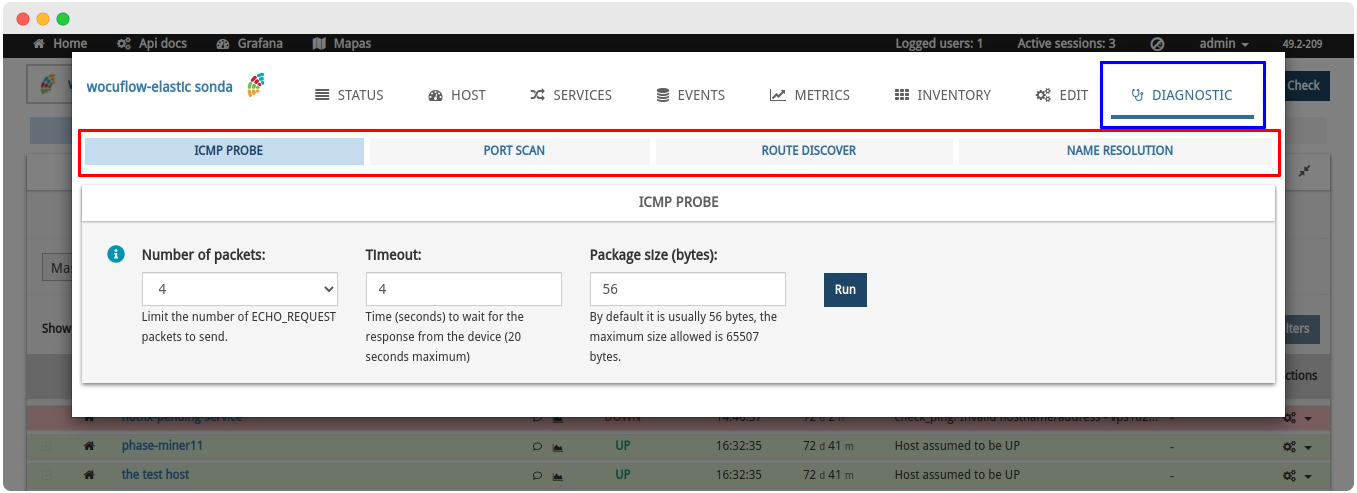
8. New Timeout and Package Size parameters in ICMP Probe function
Last version 48 we introduced the new Network Health Diagnostic Tool, for in-depth analysis of the functional and operational status of a network Host.
Since then, we have focused on further enhancing and extending its scope. That is why the ICMP Probe thread now includes two new configuration parameters in addition to the already present Number of packets, these are:
✓ Timeout: time (measured in seconds) to wait for response from the monitored Host. Limited to a maximum of
20seconds.✓ Package size (Bytes): size (measured in bytes) of the packet sent through the ICMP protocol. Limited to a maximum of
65507bytes.
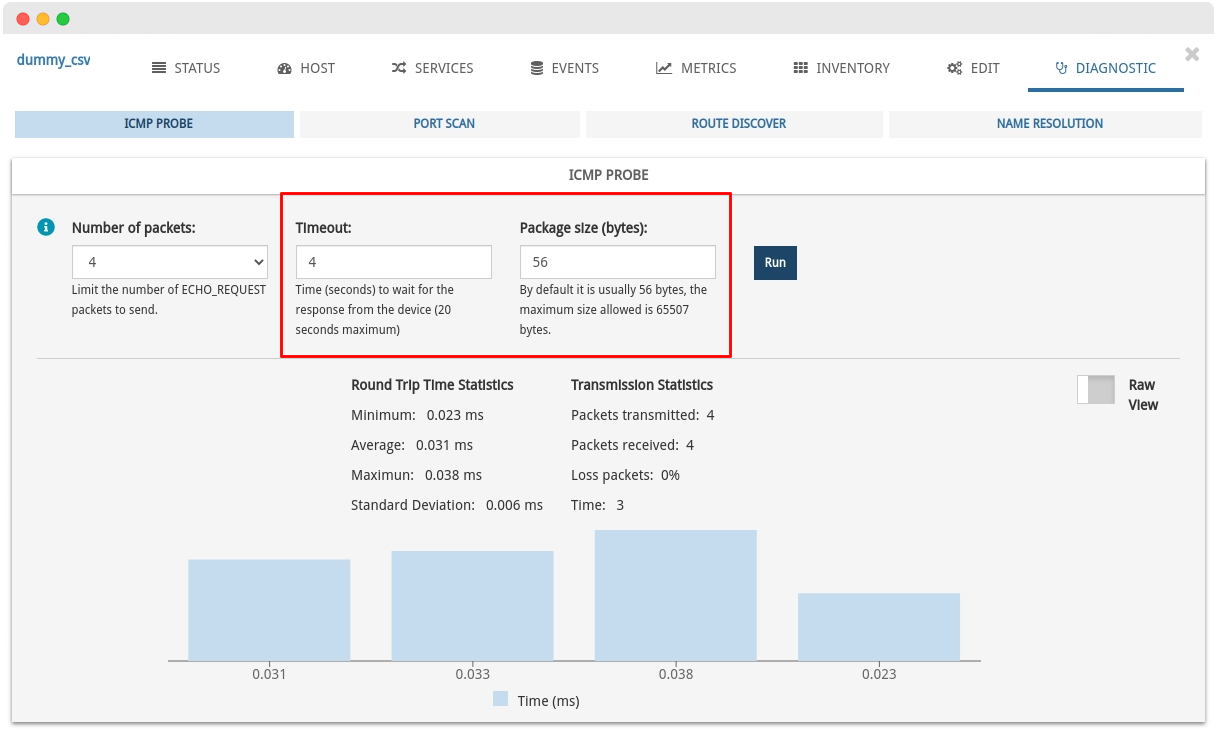
With this extension, the query is refined to drill down into the network level communication (based on PING sweeps) of the monitored hosts in the system. Thanks to this tool, troubleshooting of traffic, speed and quality of IP connections is facilitated.
9. Different refactorings of the frontend
✓ The technology and manufacturer identification icons located in the header of the Host-Modal and in the Packs Inventory, are now shown in colour as a visual enhancement and link to the same branding
✓ In addition, the database of icons linked to monitoring services has been updated with the addition of new entities:
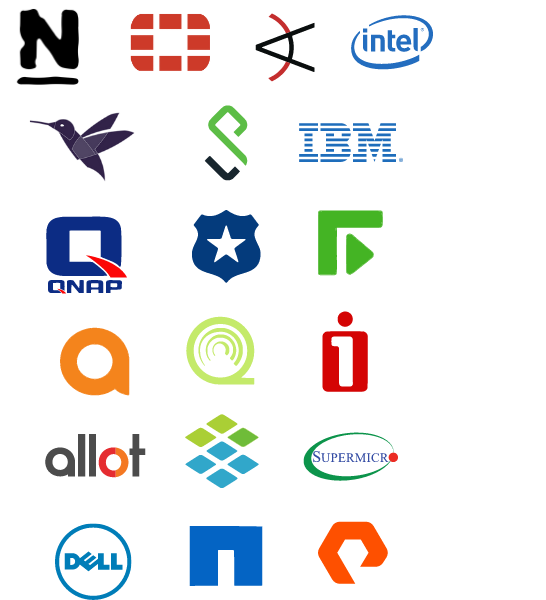
Teldat
Nagios
Fortigate
Aruba
Allot
Infoblox
Intel
Dell
Wmware
Supermicro
IBM
QNAP
Iomega.
PureStorage
NetApp
PulseSecure
ArcSight
Blue Coat
Check Point
Qradar
ForcePoint
✓ Refactoring of the Edit section of the Host Modal to REACT 7 and JsonSchemas technology. This change will result in better debugging of load times, improved maintainability and performance and responsive visualisation.
10. Viewing permissions via ACLs in subsections
By way of introduction, UI-ACL (Access Control List) is an extra APP of WOCU-Monitoring useful to limit the scope of user viewing by means of ACLS rules, i.e. it allows to grant or deny access at all levels (either by sections, modules, widgets, etc.).
The solution already manages permissions and access privileges via ACL, however, in this latest release support for custom configuration of dependent subsections has been added in:
With the add-on module UI-ACL you can simplify user management in complex environments, promote separation of privileges and gain fine-grained control of the infrastructure.
Remember
The UI-ACL module is not distributed by default in WOCU-Monitoring, it is included in the Enterprise PLATINUM version.
For more information contact us and we will answer all your questions.
Monitoring packs
See our catalogue of Monitoring Packs in the following link.
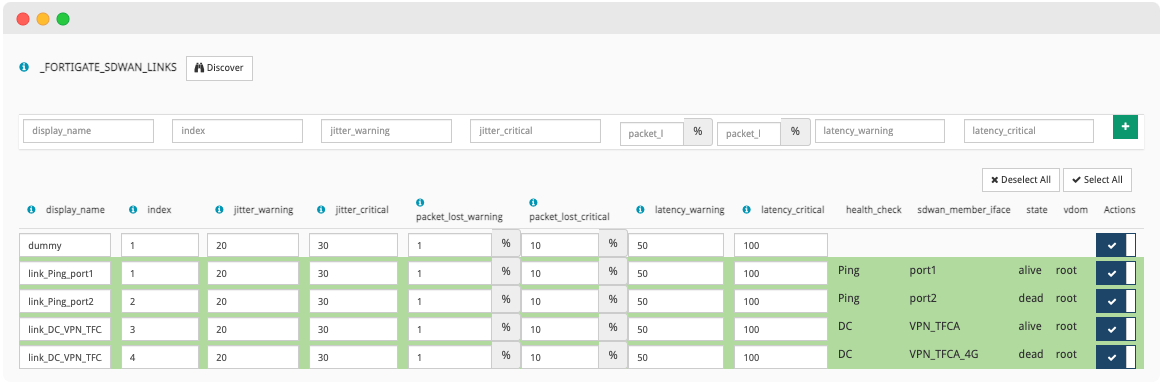
New pack Fortigate-sdwan-health

The new pack Fortigate-sdwan-health is added to the catalogue, with the function of monitoring the health of Fortigate SD-WAN health check links. This is a service similar to a IPSLA of SD-WAN links.
The metrics obtained are:
Link status (alive or dead)
Jitter
Latency
Packet lost percent

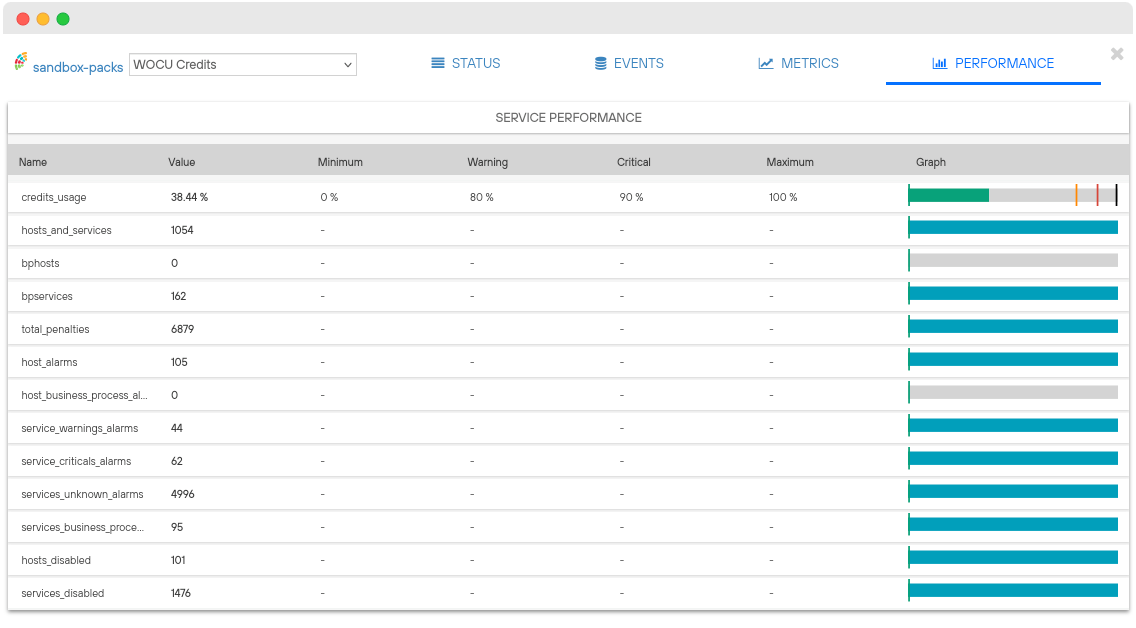
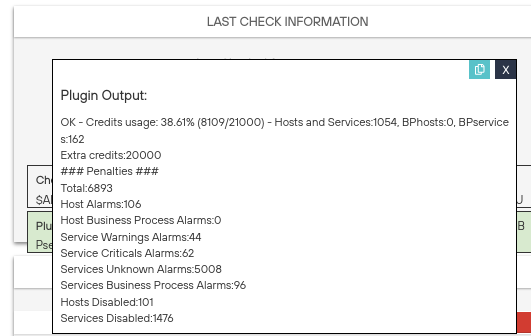
New pack WOCU-credits
The Application of Credits is based on the allocation of points or credits on monitored assets, depending on the weight or load of their execution in the system (computational cost) and thus being able to control the excess load and performance of the system. In addition, certain operational restrictions will be implemented if the established limit is exceeded.
The new pack WOCU-credits has been developed to monitor the usage of the mentioned Credits application of a WOCU-Monitoring Realm. In addition to alerting when the percentage of usage exceeds the configured thresholds, all the metrics provided by this module are added to the outpupt of the service. In this way, graphs will be created automatically showing the evolution of each of the metrics.
Other improvements and fixes
Every new version is full of small changes, fixes and optimisations that should be briefly highlighted. We list the most notable ones in this release:
In the Host Modal the spacing between the name of a Realm and the monitor-pack identifier icons has been extended to prevent future overlapping problems
New position of the refresh button and update of the data recorded in the tables of Contacts and all subsections of Pending Assets.
Attributes or parameters of type password shall be hidden in the interface. The registered value shall be made unreadable by a fixed-length string of asterisks. This change is implemented in:
Host Information (ℹ) button in Monitored Assets and Pending Assets.
Removed incorrect text visible in the legend of the Services Status banded graphic in the Host Modal
Fixed a bug in Other Log Events (Logs) where it was not possible to filter by equal
keyswhose value was different.Modified the default sort function implemented in the Task Status table giving priority to the most current records.
Added
Placeholdertags (help information on what to log) to the optional configuration parameters (not required) of complex macros accompanying a Monitoring Pack.Optimisation of the Search filter (Search…) of Realms in the Home, switching to executing exact searches and consequently retrieving only Realms containing the added characters.
The Snapshots tab has been resized to match the other tabs in the main menu of the configuration module. This results in a more balanced and harmonised view.
Fixed a display error in Other Log Events (Logs) when the content of a trace exceeded the available table space.
The Geomap tab has been moved into the Assets block, occupying a new space after the Packs Inventory. The geographic map representation is one of the possible ways of visualisation (and state synchronisation) of Assets and therefore, it is more coherent to be part of this section and not as a separate section. Also, thanks to this change, we save space in the main navigation menu.
Refactorización de la paginación de las tablas de
React v7eliminando código duplicado.From this release onwards, the representative Host nodes that constitute the nested tree of the Business Process Debugging Modal, will be identified by the value of the
Display nameattribute instead of theHost nameas was previously the case.Addition of a new search field within the
User Configurationmodel of the Advanced Aggregator Configuration environment.Comprehensive refactoring of the Show Downtimes action present in the operational actions package of the Problems, Hosts Inventory and Massive Actions tables
The Recipients selector of the Report Schedule Creation Form, shows all user emails (and possible recipients) that are associated to the Realm (Realm and CMDB_realm).
Corregido un error de superposición de etiquetas que obstaculizaban la lectura de la Top HG.
New validation in Macros with numeric type inputs to not support alphabetic characters.
Fixed an alarm map rendering error, caused by after changing the Status tab to a different one.
Update of chapter Import Tasks (Tasks) of the WOCU-Monitoring technical documentation.
Omisión de la contraseña de
MySQLdurante la edición de la Tarea de MySQL Database Import (MySQL_Import).Support for special characters in the Display Name of Reinos. In addition, meaningless characters will be removed, considering that it must also contain at least one alphanumeric character (which will be respected).
Fix the summation of the
Show entriescomponent of the table in section Hostgroup Hosts in Multireinos.Unification of Actions column styles in Complex macros.
The name of the Realm (followed by WOCU-Monitoring) has been prefixed to the title of the browser tab for easy identification and accessibility.
The output of the Check Command shown in the Widget Last checksinformation is displayed correctly again, after solving a bug related to the nomenclature implemented in complex macros.
In the event that the diagnostic operations and its binaries return an error code, the system shall display a specific message informing of the anomaly.
The main endpoint that fetches the list of all monitoring Realms has been improved. Now, this endpoint only returns those Realms associated to the user making the request. Thanks to this extra security measure, external applications that implement this endpoint will in no case be able to view Realms to which they cannot have access by permissions.
Upgraded software
In addition to the new functionalities described in the previous chapters, this new version of WOCU-Monitoring brings a multitude of changes to its base system.
On the one hand, it is the first time that a version of Shinken (our monitoring engine) ported to Python 3 is used by default. Both the code base and its core modules have been ported and are now managed in their own repositories. With this change, there is no longer any piece of software running on Python2 in the whole WOCU-Monitoring ecosystem.
In terms of operating systems, support for Debian 10 and Ubuntu 20.04 is included. Support for Debian 8 and Ubuntu 14 has been removed in this release. Those operating systems are no longer supported. While support for Debian 9 is maintained in this release, it will be removed in the next release (v51), so we recommend upgrading to any of the currently supported distributions as soon as possible: Debian 10, Ubuntu 20 and Redhat 7. Support for Debian 11, Ubuntu 22.04 and Redhat 8 are on the way
As always, other pieces of software have been incorporated and updated in this new version of WOCU-Monitoring:
Software |
Previous version |
Current version |
Remarks |
|---|---|---|---|
Django |
3.2.5 |
3.2.12 |
|
LMD |
2.0.4 |
2.0.7 |
|
bison |
3.0.4 |
3.3.1 |
https://lists.gnu.org/archive/html/info-gnu/2019-01/msg00017.html |
collectd |
5.10.0 |
5.12.0 |
|
fontconfig |
2.11.1 |
2.13.91 |
https://www.freedesktop.org/software/fontconfig/release/ChangeLog-2.13.91 |
freetype |
2.4.12 |
2.10.4 |
https://sourceforge.net/projects/freetype/files/freetype2/2.10.4/ |
icu |
4.8.2 |
62.1 |
|
phantomjs |
2.0.0 |
2.1.1 |
|
php |
5.5.16 |
7.4.14 |
|
thruk-libs |
2.16-2 |
2.40 |
|
uwsgi |
2.0.13 |
2.0.19.1 |
https://uwsgi-docs.readthedocs.io/en/latest/Changelog-2.0.19.1.html |
webpack |
4.43.0 |
5.43.0 |
|
google-chrome |
68 |
99 |
https://chromereleases.googleblog.com/2022/03/stable-channel-update-for-desktop.htm |
mongodb |
3.6.23 |
4.0.28 |
https://www.mongodb.com/community/forums/t/mongodb-4-0-28-rc0-is-released/14042 |
About WOCU-Monitoring
WOCU-Monitoring is a monitoring tool that integrates the latest Open Source technologies for monitoring, visualisation, metrics graphing and log management, providing a wide visibility on the status and availability of network elements, servers, databases and workstations (among others) using customised Monitoring Packs.
In addition, the Enterprise version of WOCU-Monitoring called Enterprise allows deployments of thousands of IP hosts, in a distributed environment, with customisations tailored to each customer’s infrastructure.