Release Notes 0.44
Publication Date: 01/02/2021.
The new version WOCU 0.44 comes loaded with new features and improvements in response to the requests and suggestions of our users and the current market needs. And always, working on a unified and homogeneous monitoring line.
One of the main purposes of WOCU has been, and still is, to guarantee the integrity, access and use of the information recorded and stored in the tool. In view of this and being aware of the existence of clients with certain security needs (which entails a certain level of risk), in this version we have worked continuously on the design and creation of a powerful Security Module, in accordance with the most current standards of protection and prevention, in order to mitigate any risk of intrusion or malicious activity that may fracture the accessibility and stability of the tool.
The Scheduling view, the epicentre of all current report schedules, has also been updated, incorporating the creation date of each schedule, as well as new elements for efficient navigation and reading of the displayed data.
To further facilitate the analysis, identification and handling of incidents, the Events listings will now record and display the exact date and time that a device or service went down.
In terms of asset aggregation, the scope and capability of one of the most widely used import mechanisms in the tool has been extended. WOCU is now able to auto-discovery assets using version 3 of the SNMP protocol. Similarly, this release brings with it a new task for auto-discovery of MultiReigns based on a given hostgroup, by automatically executing a new internal task.
If in previous versions the possibility of programming different valid notification periods was added in this version, a new filter has been added to the list of Problems, to be able to discriminate by assets that are outside their configured notification period.
And we keep updating our Monitoring Packs Catalogue with new monitoring packs and services. As well as the refactoring of numerous WOCU components to REACT technology.
But there’s more, read on for a complete list of new features and more information in the User Manual if needed.
1. New WOCU Security Add-on Module
Given the growing trend of security threats and attacks, it is of vital importance to act and apply preventive protective measures against intrusive and unauthorised actions, security breaches or other vulnerabilities that put at risk and affect our customers’ business.
For this reason, in this version we have worked on the design and creation of a complete and powerful additional Security Module (not distributed by default in WOCU), aimed at customers who meet certain security needs and conditions and choose to protect themselves, with guarantees, from possible malicious movements.
Overall, this service combines a set of effective measures, which together with good user education, strong built-in authentication and a strict blocking policy, mitigates any risk of intrusion and malicious activity.

The measures and services that make up the Security Module are listed below:
We set out to create a technology adapted to the client and as a result of the work accomplished by our team, we present this new additional service that protects the tool from diversified attacks, which are unfortunately very common nowadays.
Additional module and how to contract it
The Security Module is not distributed by default in WOCU, it is included in the platinum version.
It is intended for customers with specific security needs. If this is your case, contact our Sales Team at sales@a3sec.com and they will answer all your questions.
2. Date and exact time of Asset crashes in the Event tables.
One of the basic concepts in the monitoring and operation of networks and systems is the recording, collection and analysis of Events, since they are used as an additional element in the calculation of the Asset status. That said, all available information on the event produced will facilitate the analysis of the causes or circumstances of this occurrence.
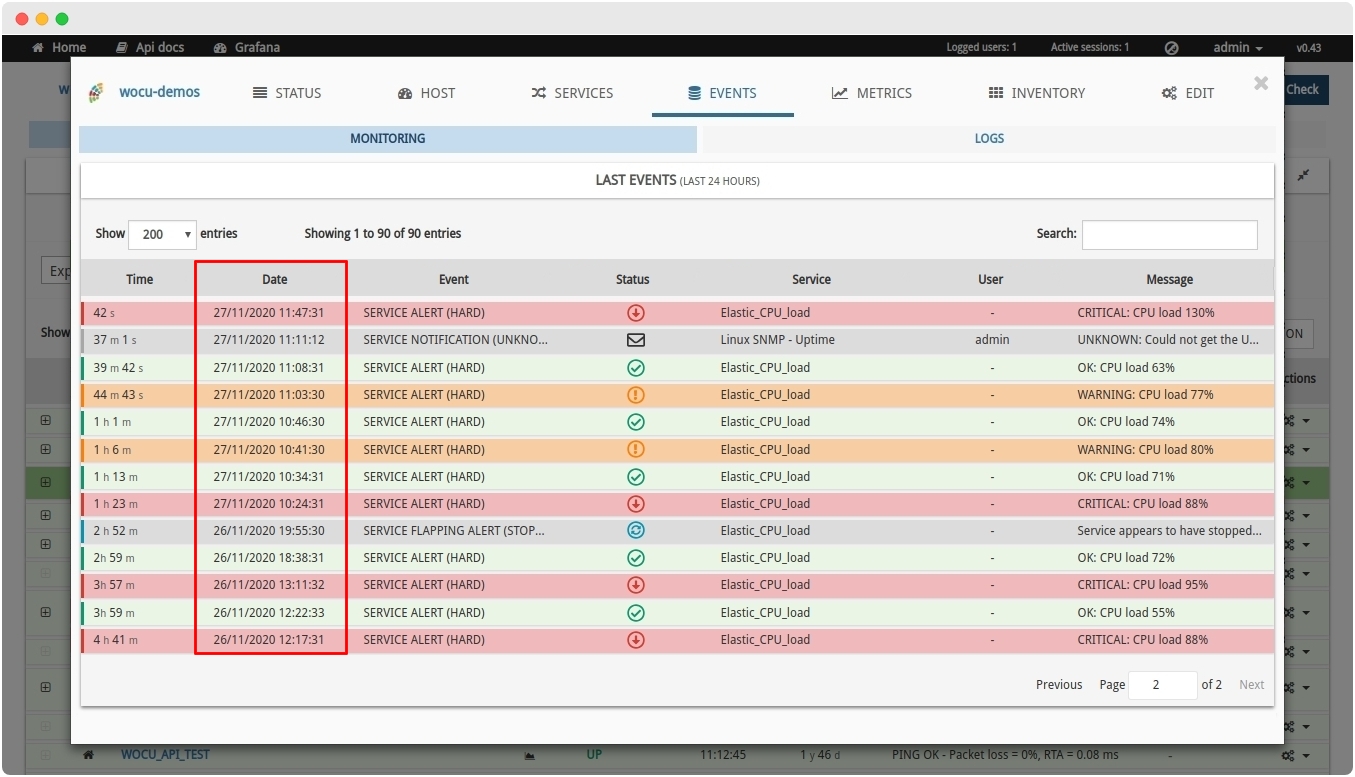
For this reason, this version includes the new Date column, which details the exact date and time of the crash of a device or service. Following an operational logic, this new column is located after the Time column, which indicates how long ago the event was received (days, hours and minutes since it occurred).
This new column is added in:
✓ Monitoring Events (Monitoring) of the Events tab of a Realm.
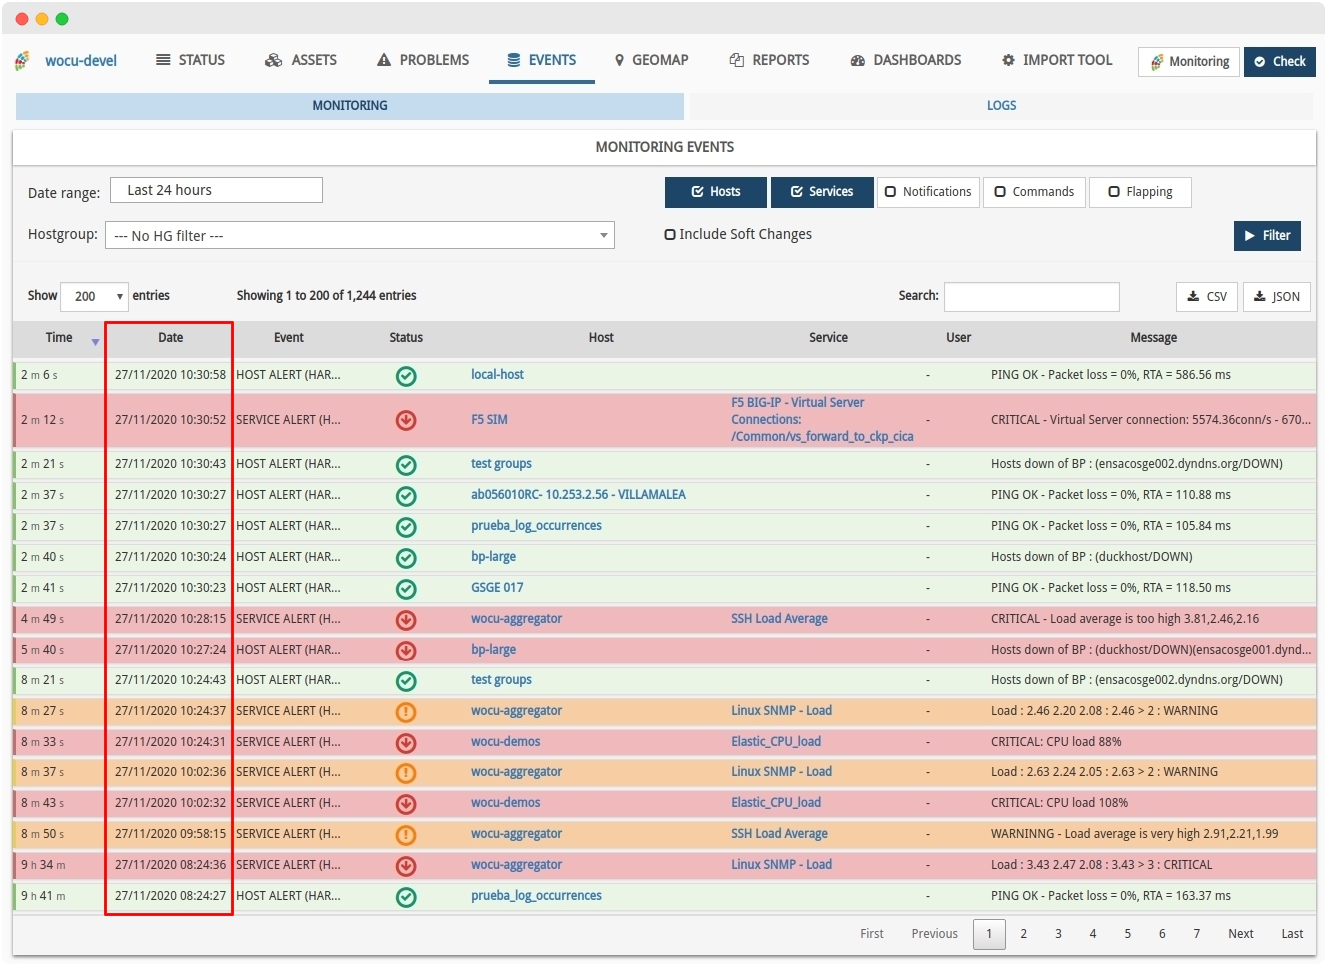
✓ In the table in section Events.
3. Functional and operational improvements to the Scheduled Reports table.
As you may already know, in order to automate reporting operations, it is possible to schedule the launching of a report at a certain date, time and frequency (at the operator’s discretion).
On this occasion, work has been done on the Scheduling view, the epicentre of all current schedules (both running and not enabled) in the system. Specifically, the following changes have been addressed:
✓ New creation date column Create At: indicates the exact date and time when the report schedule was created. In addition, the different entries in the table (existing schedules) will now be sorted by default from this data, i.e. from the most recent to the oldest creation time.
✓ Inclusion of a search bar 🔍: for greater convenience and agility when locating a specific programme. It is of great help in those cases where the listings become extensive and are distributed over different pages.
✓ Inclusion of the number of total entries in the list: very useful to know if the list is filtered, thanks to the informative text indicating the number of results shown for a given search, plus the number of total entries: Showing x results of N (Show x results of 1).
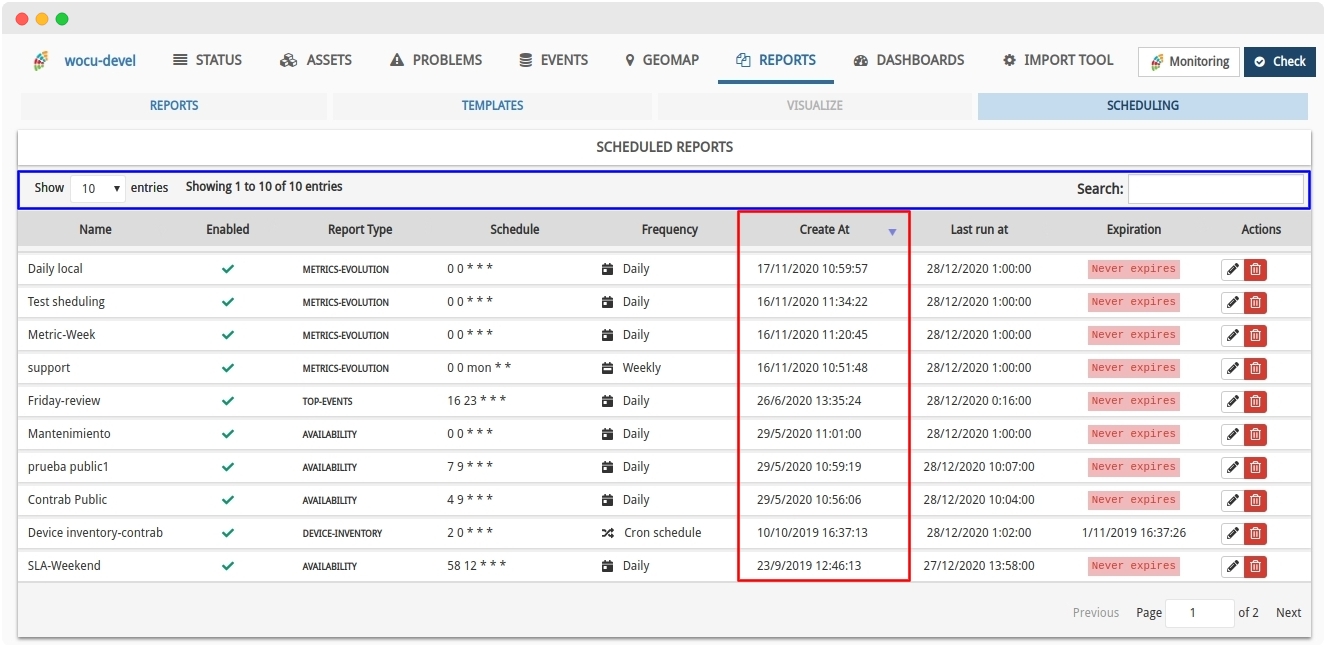
The aim of these integrations is both to expand the relevant information offered to the operator and to facilitate the navigation and reading of the data displayed.
Note
More information can be found at: Scheduling.
4. Inclusion of Downtimes Periods in Availability reports
The operational design of WOCU is geared towards the simple and efficient monitoring and operation of network systems: the usual workflow in this type of environment means that every alarm and event must be examined and dealt with by the operator. Therefore, it is always a good practice to perform an acknowledgement of the incidents handled, alternatively disable active checks (in certain circumstances), or apply scheduled downtimes, ideal in maintenance activities or scheduled interventions.
This situation generates irrelevant events that may influence the final result of Availability Reports. To this effect, in this version we have worked to give the option to choose the inclusion of these Downtime Periods (Downtime Periods), and that the alternation of statuses occurred and registered in this period, do not interfere or affect the resulting report.
The new Include Down Times needs to be ticked during the report configuration. Once the report is generated, clicking on any record in the devices table will pop up the following window
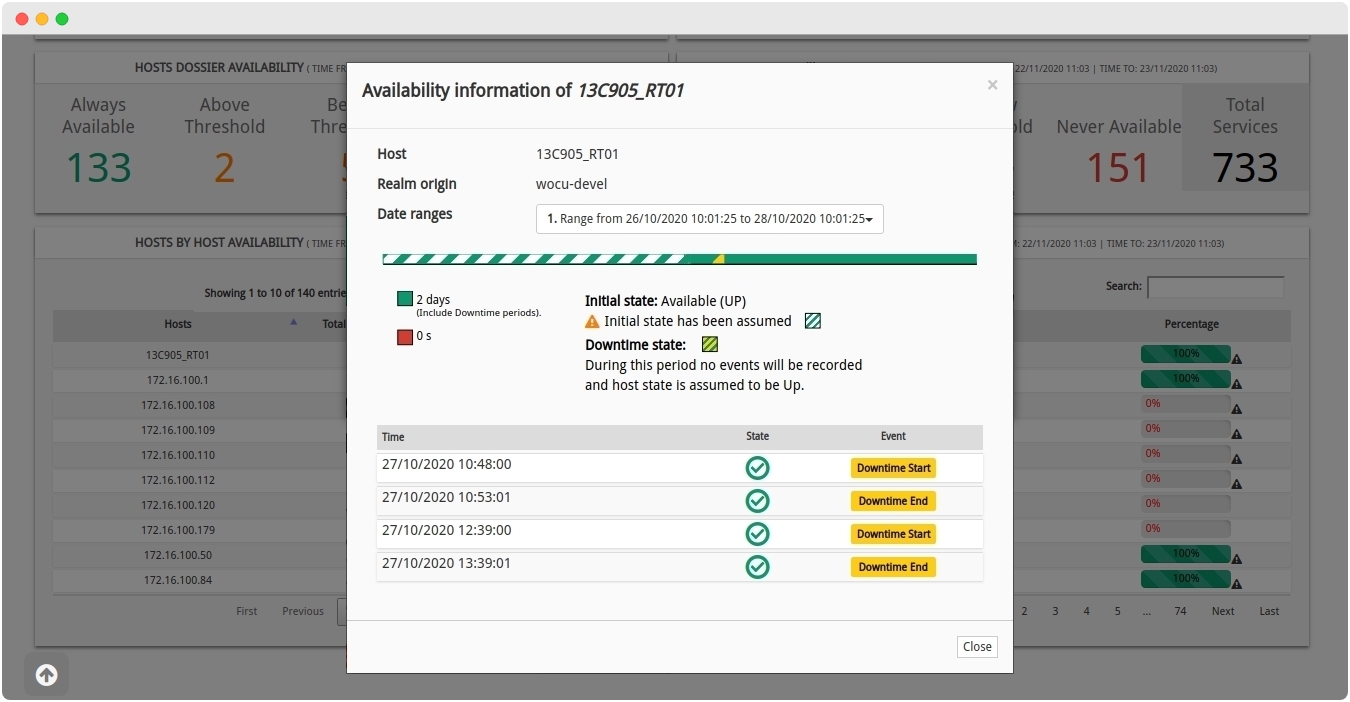
The period(s) of scheduled downtime between one date and another are recorded and represented in the time bar. In order to identify this situation, the legend includes a new entry indicating the colour code associated with this state, together with the following explanatory text: During this period no events will be recorded and host state is assumed to be UP >> During this period no events will be recorded and host state is assumed to be UP..
Important
Downtimes (Dowtimes Periods) are included in the availability band (UP).

In addition, in the Event History Table where the status alternation is recorded, the set of scheduled downtime periods occurring during the defined time range shall be listed.

Each entry in the table shall contain the following information:
Time Column: date and time at which the start or end of the downtime period, and therefore of the event, was recorded. Thanks to the labels shown in the Event Column, we can identify whether the period starts (
Downtime Start) or ends (Downtime End).State column: indicates the optimum availability status of the device (✔️ in green). Remember that the down times are included in the total availability range (UP) of the device.
Note
More information can be found at: Hosts by host Availability.
5. SNMP version 3 support for import and inventory tasks.
One of the ways to import assets into WOCU is through SNMP discovery. A protocol that allows the management and retrieval of data and information from different elements connected to a network.
To extend the scope and capability of one of the most widely used import mechanisms in the tool, support for auto-discovering assets using version 3 of the SNMP protocol (in addition to versions 1 and 2c already supported) has been included in this new version.
Since version 3 of the protocol establishes different security mechanisms in both SNMP_Import task and SNMP_Inventory Task, new configuration arguments have been integrated. These are:
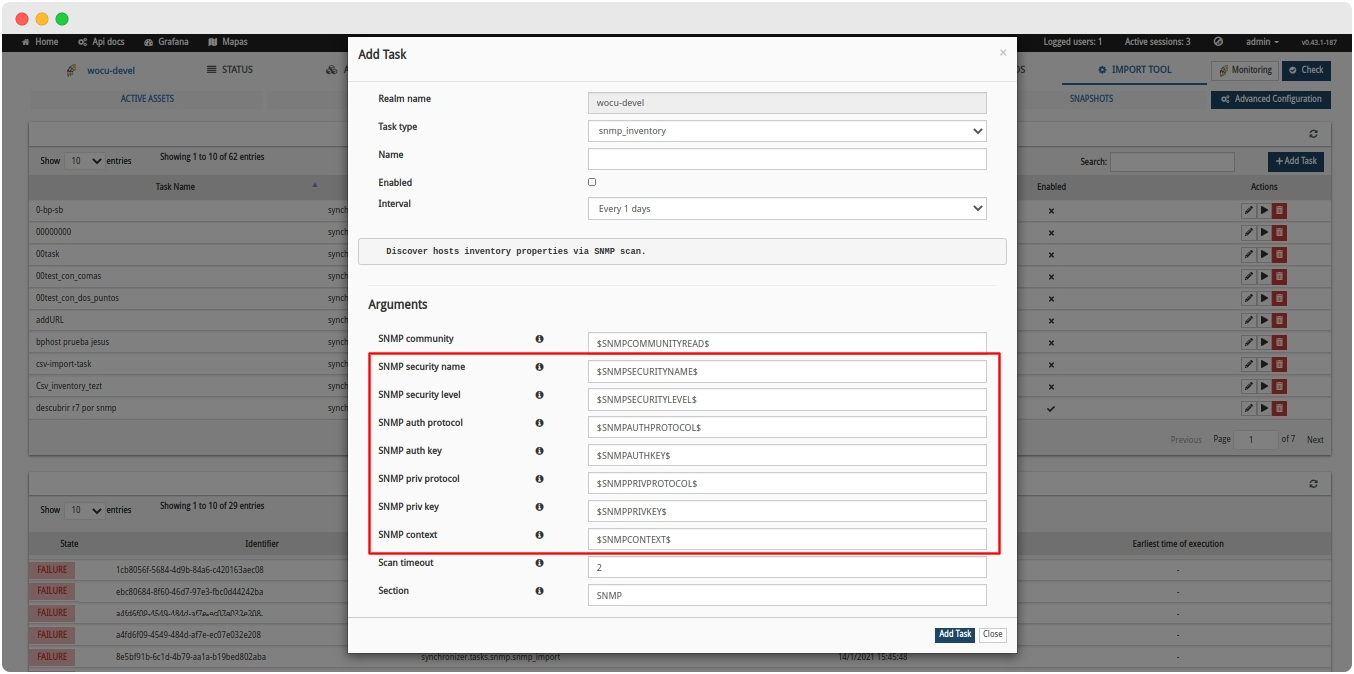
SNMP Security_name: security or user name.
SNMP Auth_protocol: Authentication type. Can be MD5 or SHAv3.
SNMP Auth_key: key for authentication.
SNMP Priv_protocol: Authorisation type. Can be AES or DESv3.
SNMP Priv_key: authorisation key.
SNMP Security_level: security level. You can use neither authentication nor authorisation (noAuthNoPriv); only authentication (authNoPriv) or authentication and authorisation (authPriv).
SNMP Context: SNMP context name.
In addition, the following Monitoring Packs have also received support for SNMP version 3:
Note
Depending on the protocol version, the Community varibale or the previous SNMP v3 own authentication variables will be used.
6. Migration of several widgets to REACT technology
The non-visible part of several widgets has been simplified by migrating them to REACT technology. These are:
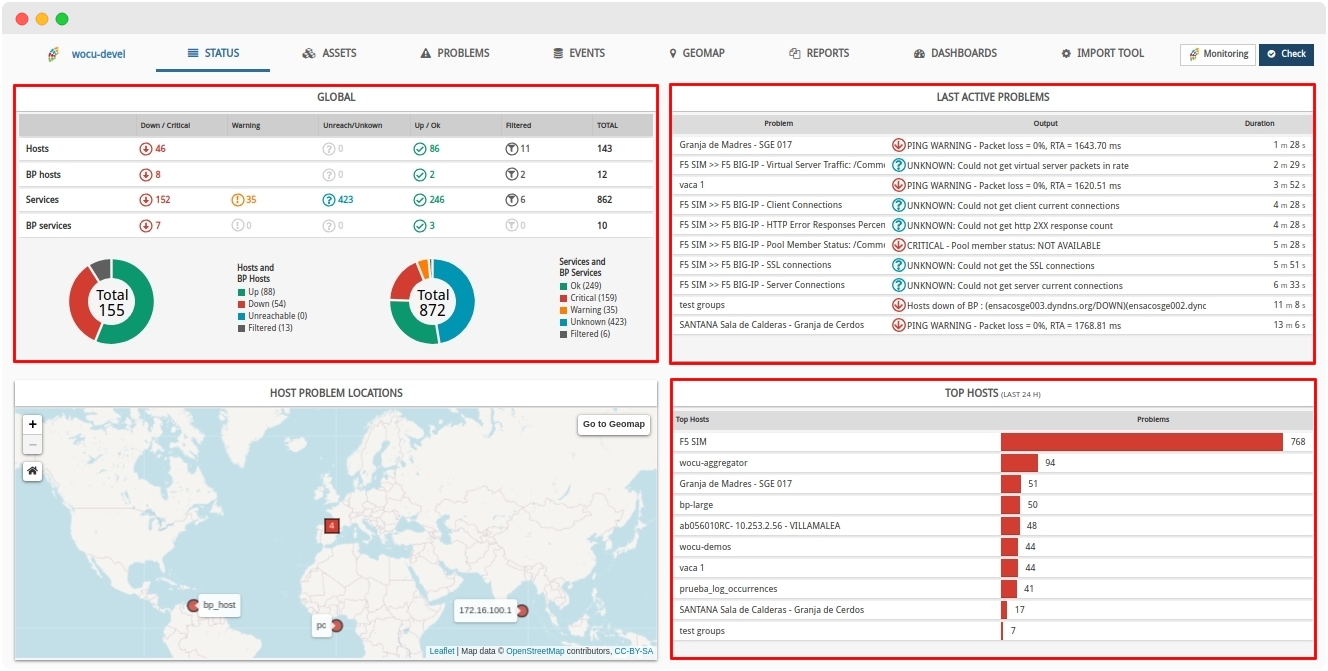
✓ Global Dashboard, and Last Active Problems Dashboard, Top Hosts (Last 24h) Dashboard of the Status tab of a Realm
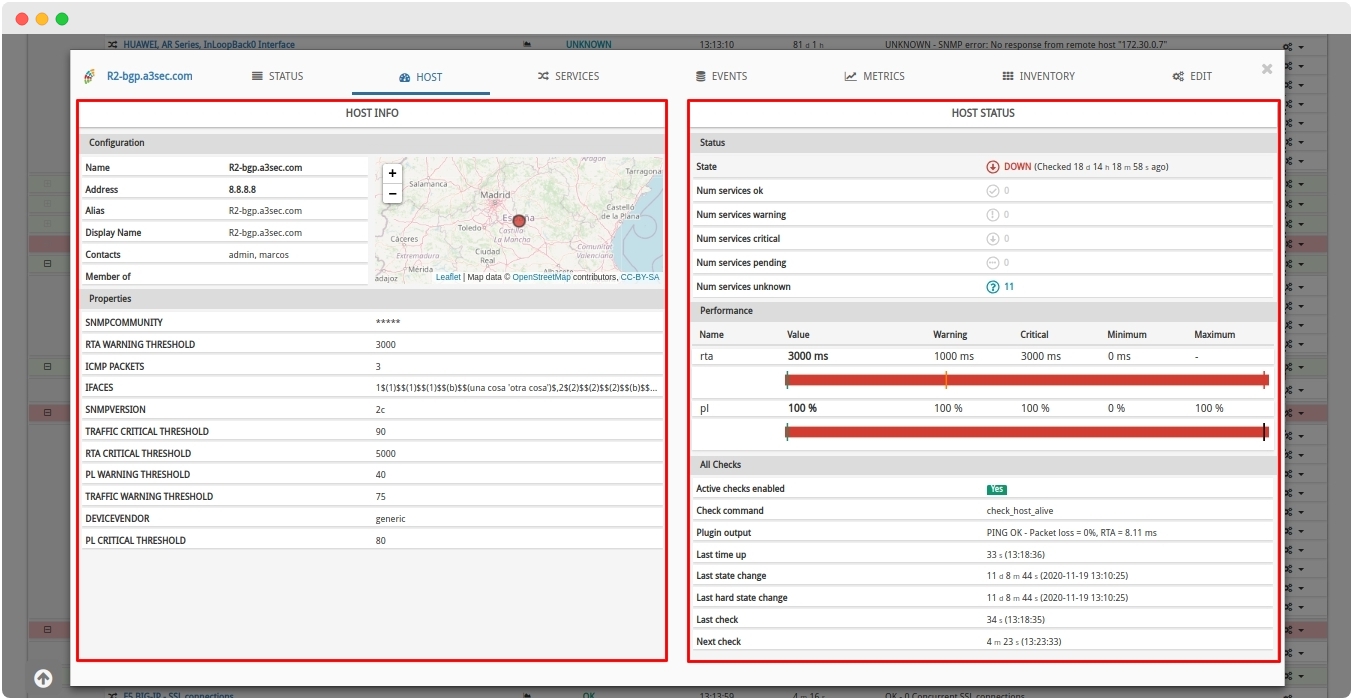
✓ Host Info Panel Tables and Host Status Panel Tables from the Device Modal Host tab
✓ Table Logged Users accessible from the Global Options toolbar.
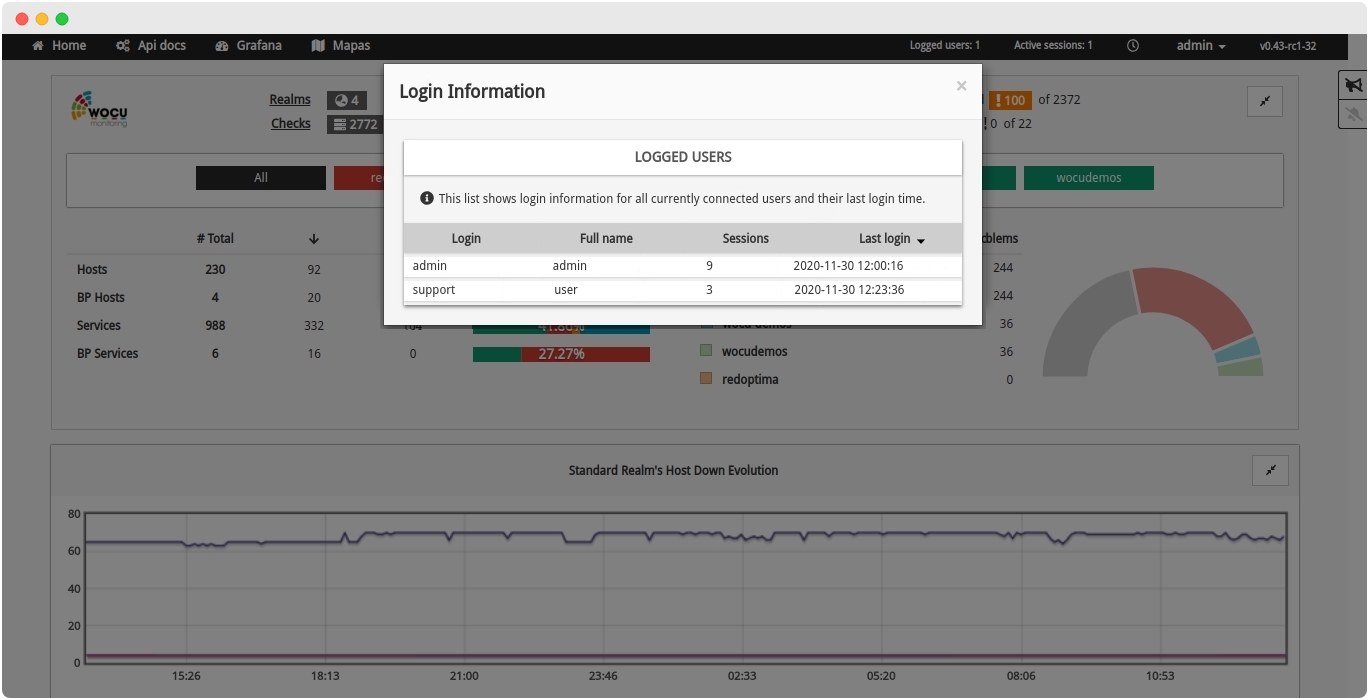
✓ Events Tab Table of the Host Modal
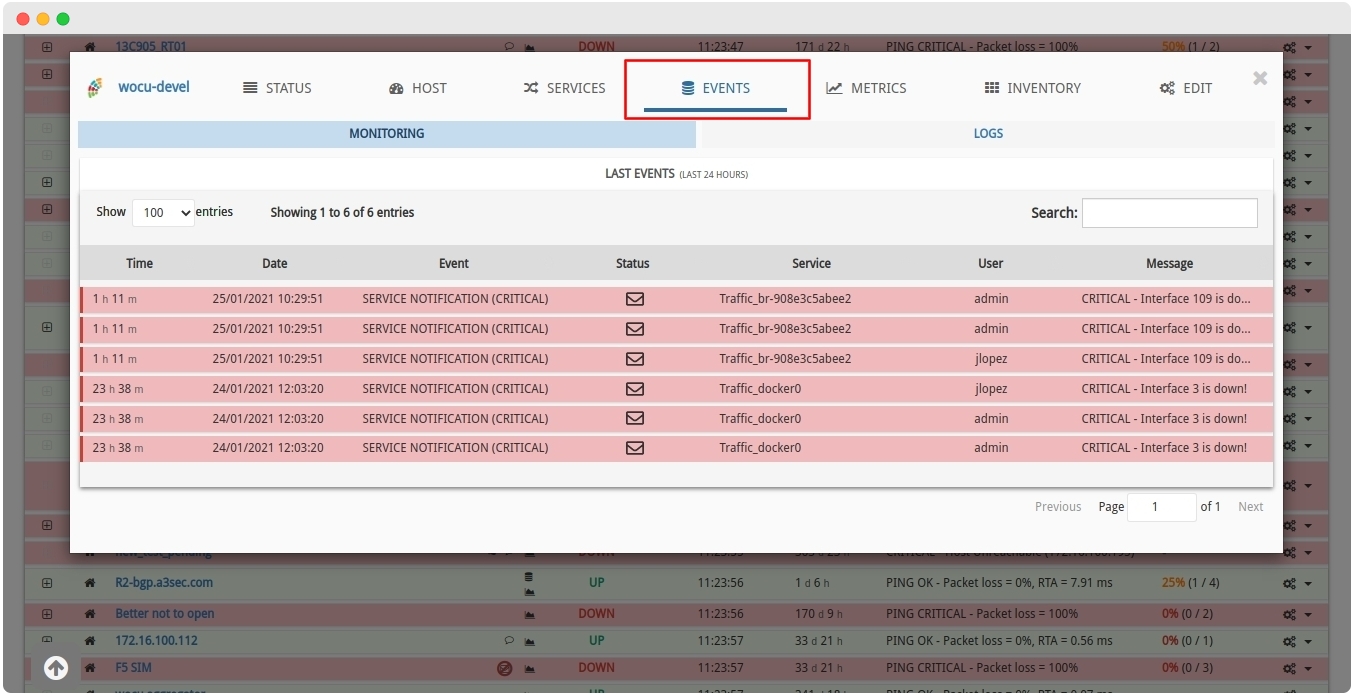
These changes will result in better data visualisation, improved maintainability and responsive visualisation. A homogenisation of styles has also been carried out, as a correction of minor variations in appearance.
7. New auto-discovery task for MultiReigns based on a given hostgroup
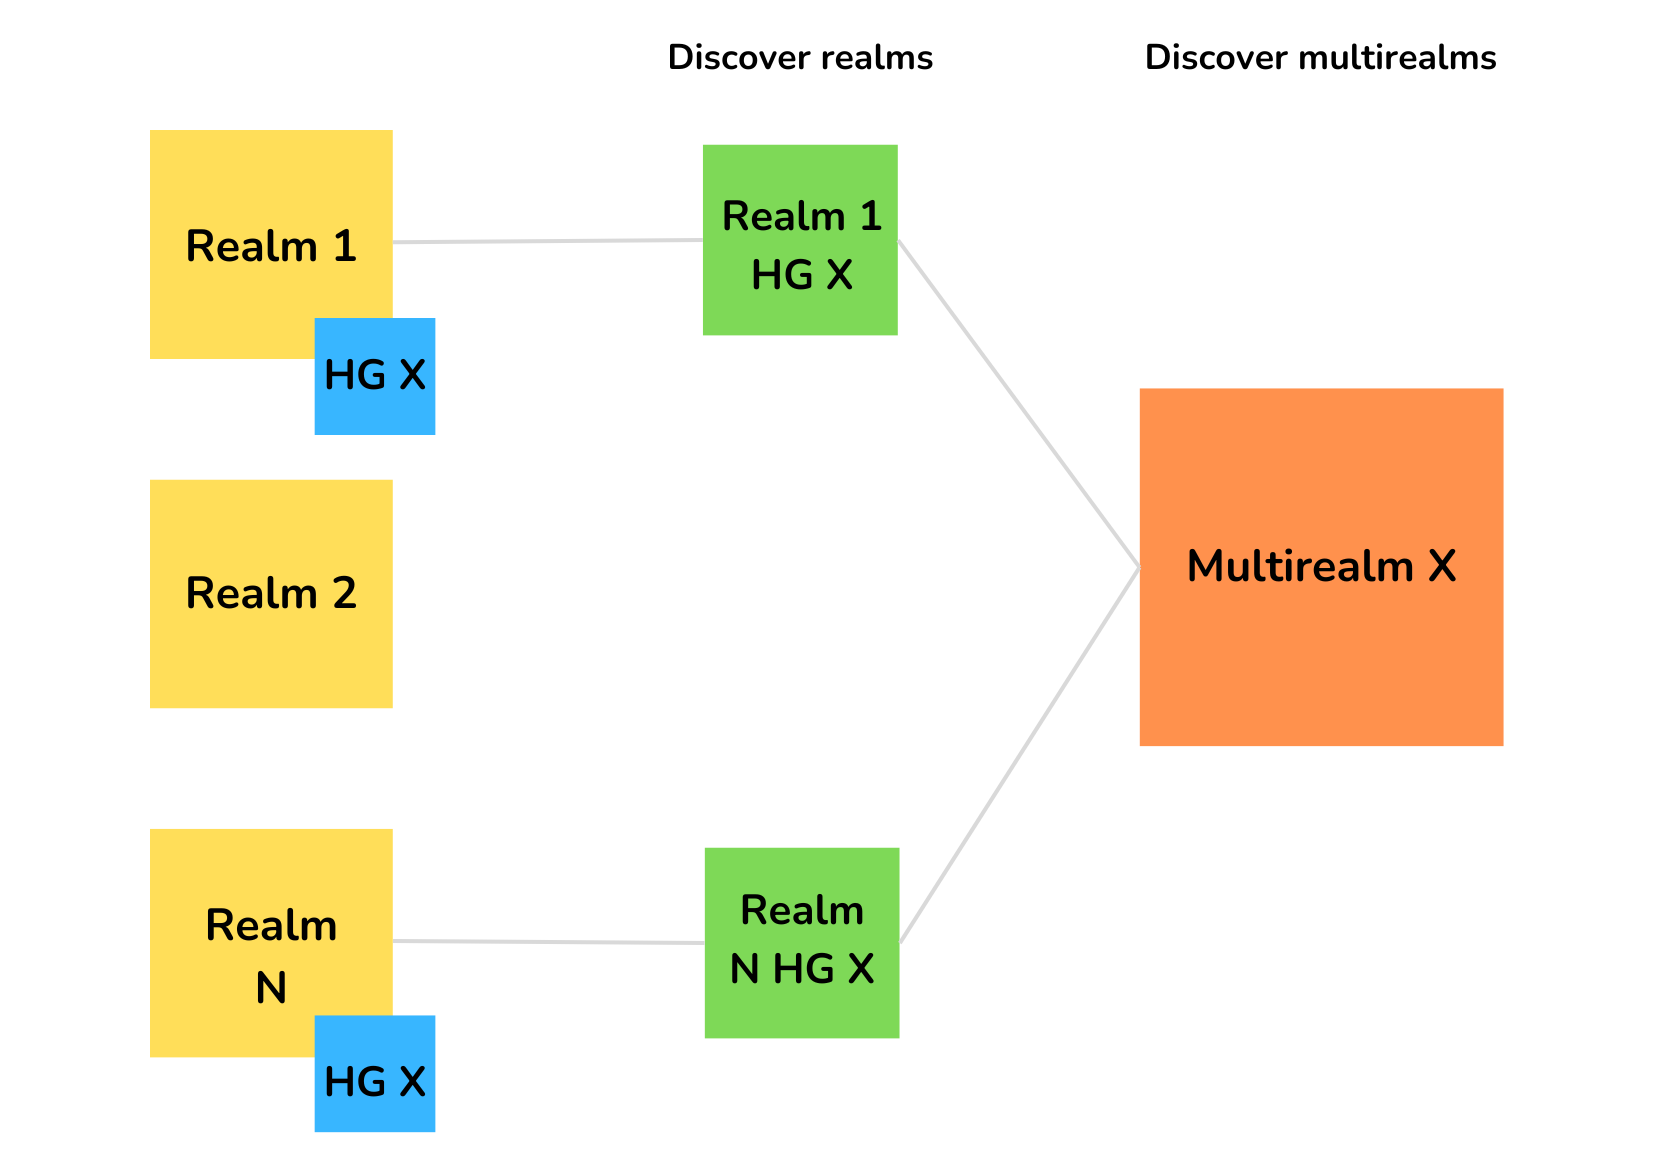
In addition to the discovery of Network Devices, WOCU is now able to auto-discover Realm based on Hostgroups (Device Groups). Specifically, the ability to auto-discover MultiReigns based on a particular Hostgroup has been added for this release, by automatically running a new internal task
We can illustrate this new functionality with an example:
If certain Realms have a hostgroup called
Linux, this new automatic process is able to create a new Linux Multi-Realm that brings together all the assets present in theLinuxgroups of each of the available Realms.
8. Filtering of Alarms according to their Notification Periods
WOCU has a notification system that is fully configurable and adaptable to operational needs. It is possible to specify notification periods, while still carrying out the relevant checks on the asset network. In short, the operator will receive only the most important notifications and in the stipulated time slots.
To get even more out of this functionality and facilitate the management and treatment of Problems, a new filter called Notification-Period has been incorporated, which will hide from the total list, the Alarms of Devices and Services that are out of their enabled notification period. That is, unchecking this option will clear the list showing only the Devices and Services that, at that moment, are in a notification period.

Note
Learn how to configure and schedule Notification Periods on Devices and associated Services, with the following Use Case
9. New button for immediate update of the status of a Device
Each of the assets monitored in WOCU always has an associated Status that defines its situation, from the point of view of availability and operability, over time. In other words, the status of an asset is dynamic.
WOCU uses its various checks to evaluate the current situation of each device in order to calculate its status. As it is a basic concept, it is essential to be able to know in real time the status of any device that is part of the monitored infrastructure.
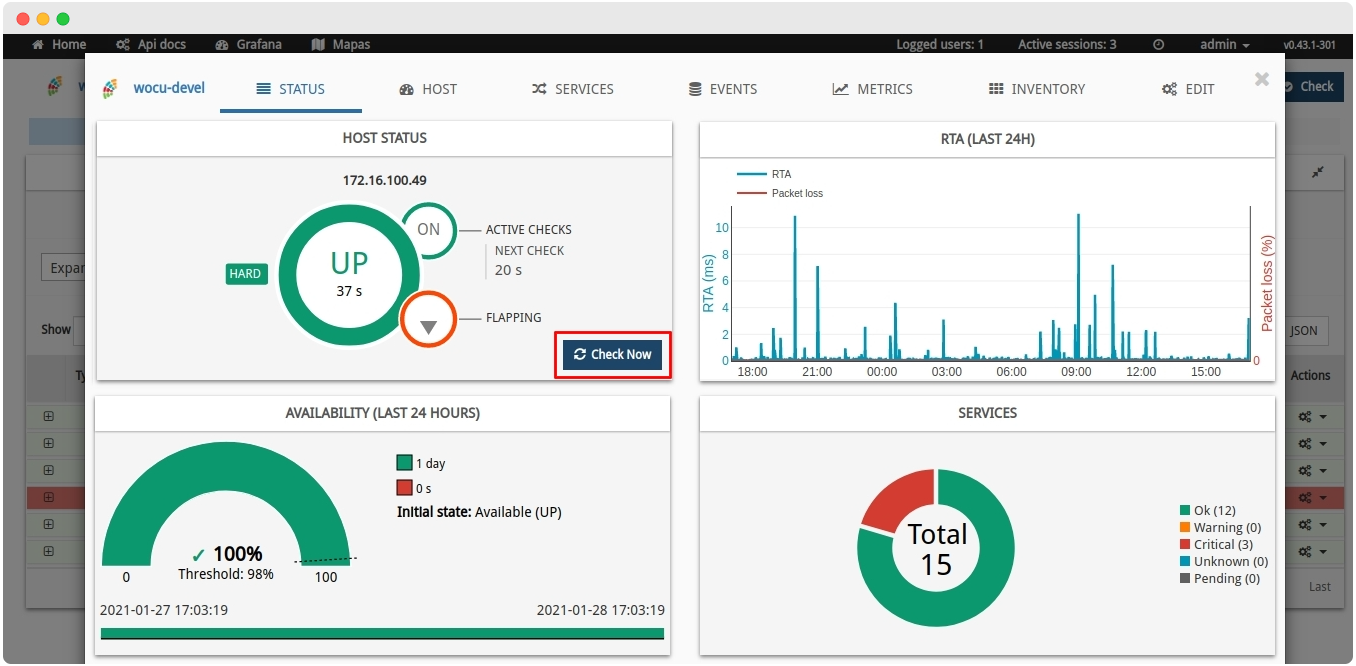
That said, a new button has been included for refreshing and updating the data displayed in the Device Modal Host Status, giving a real-time view of the logged status. Clicking it will automatically force an immediate refresh without waiting for the scheduled refresh in the User preferences.
10. New option for displaying Check_Command from User Preferences
Through the Last check information panel present in the Detail view of Services and Business Processes, it is possible to know information related to the last check that has been performed on the service, without explicitly including the command executed by which data such as: time elapsed since the last check, status result of the check, duration, etc. has been recorded.
This is why, in this version, the possibility of enabling the visualisation of the Check Command that is being executed as a measure to verify the status and operability of the service has been integrated.
This implies that the operator can enable the view of the executed Check_Command from the Show full check command option available in the User preferences.
Attention
Due to the sensitive data this command may display, the parameter will be disabled by default in the User preferences.
Remember
Check Command is an asset definition argument. It is an internally executed operation to check the status of a specific parameter you want to know about an asset (CPU, hard disk space, RAM used, etc.).

11. Filtering of services and metrics by regular expressions in Metrics Evolution Reports.
As we already know, WOCU records, processes and manages a wide number of metrics resulting from the operability checks that the service launches on a particular device.
The Metrics Evolution Report draws on these metrics, to compile and display a detailed view on the evolution of performance data, availability, storage, etc.
Due to the complexity and variety of metrics, the ability to filter certain metrics and services by defining regular expressions has been included in the generation of Metrics Evolution reports, providing greater flexibility and customisation on filtering. This is possible by enabling the new Toggle Regex option.
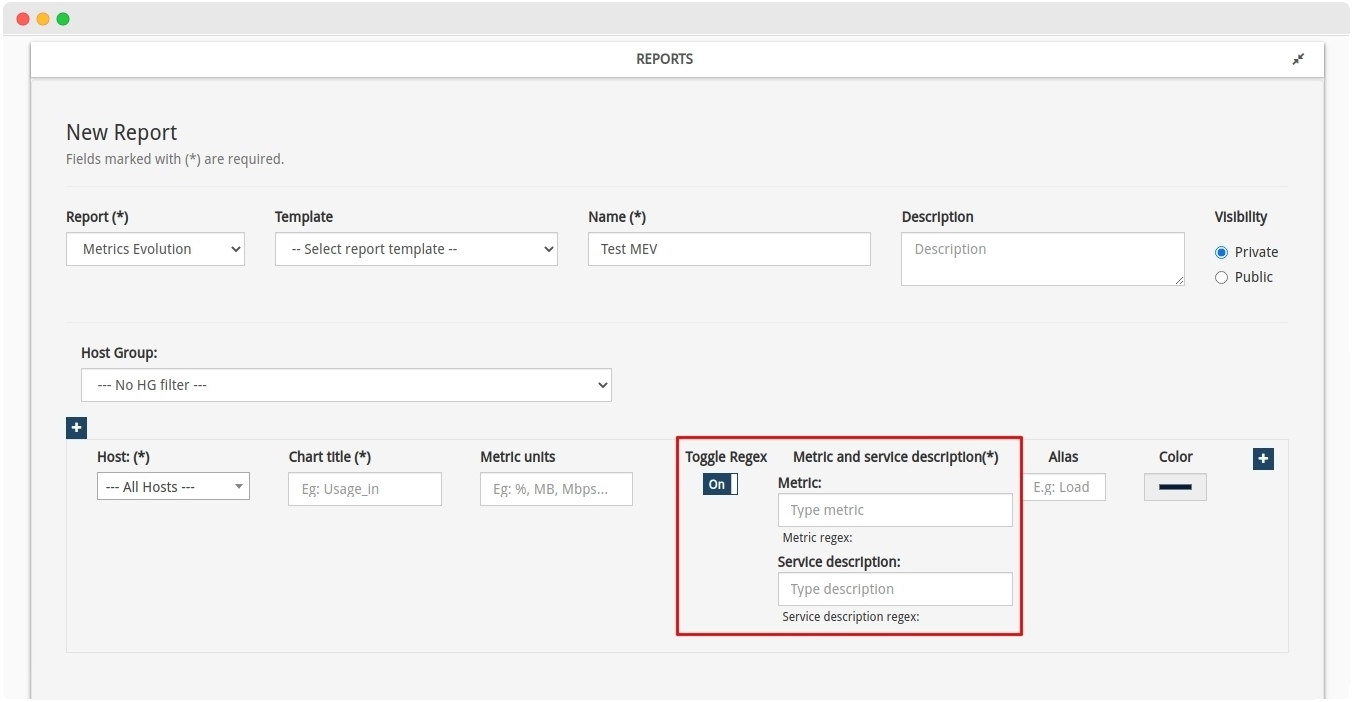
The operation of the Metric and Service Description fields is very simple. You will need to enter a search pattern that will act as a regular expression. For example, when you enter the term “traffic” in the Metric field, the system constructs the regular expression /.*traffic.*/. These wildcards replace any character before or after the term entered. The report will then capture all metrics whose name contains the characters “traffic”, i.e. all those metrics related in some way to traffic in and out of the monitored assets.
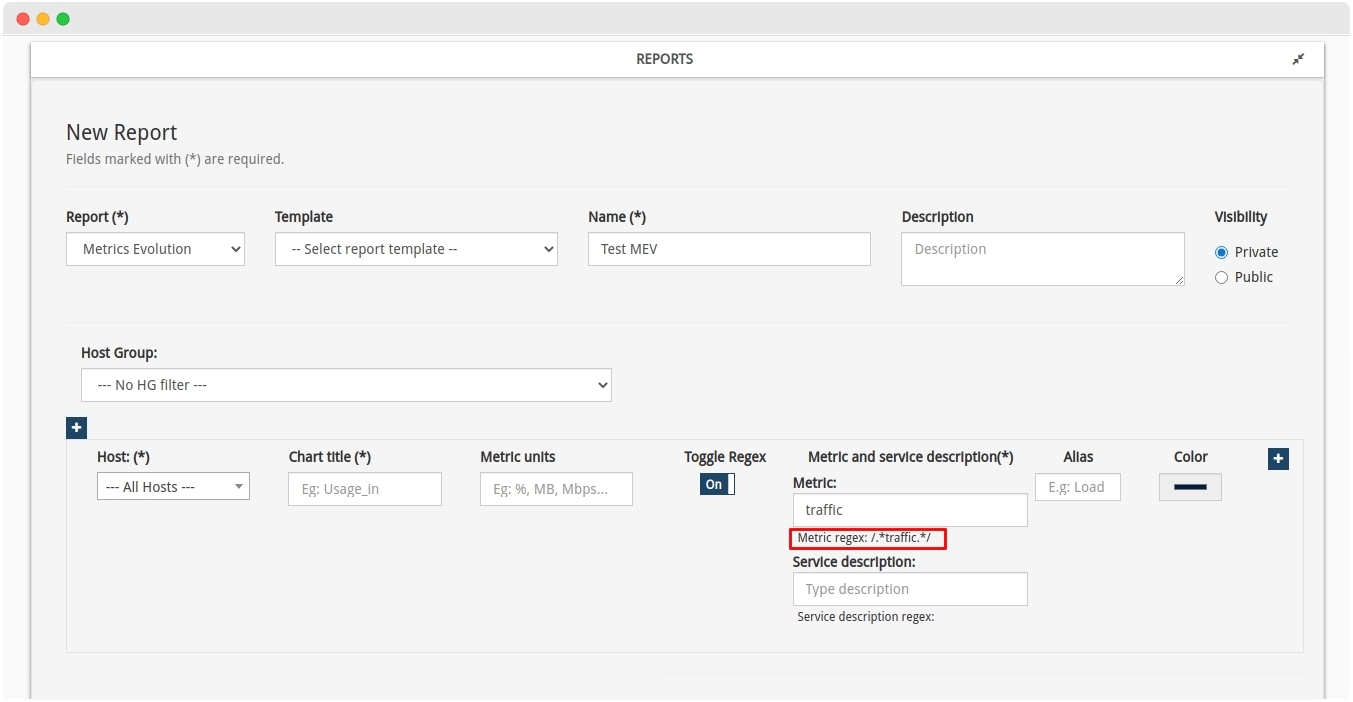
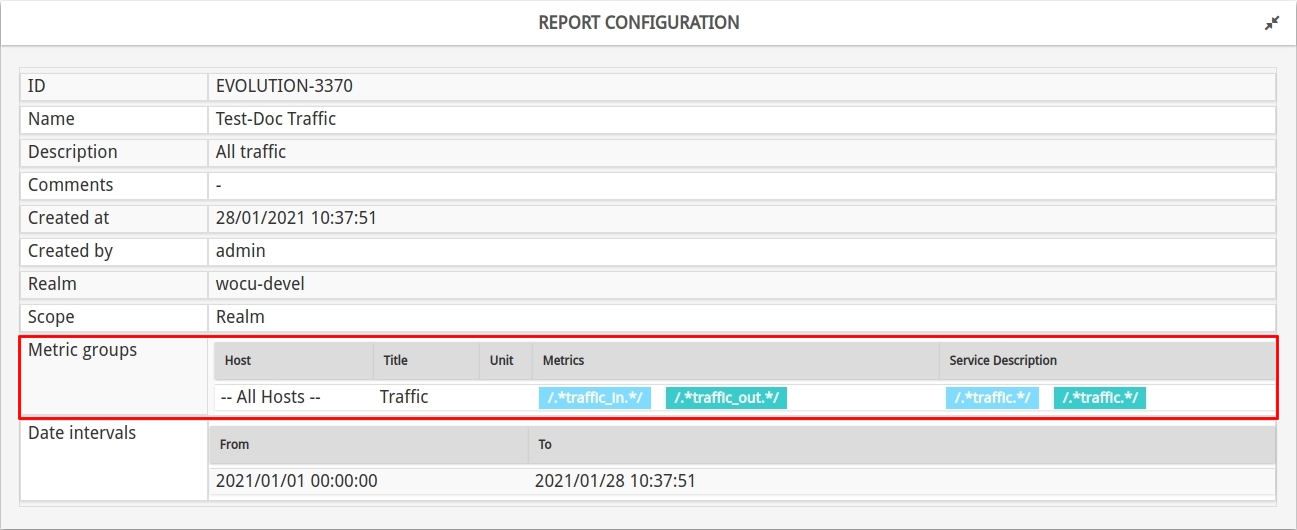
Ultimately, reports will be generated taking into account only those metrics and/or services whose name/description includes the defined text string as search pattern. In addition to this, other filters can be applied and complex and very specific time frames can be selected, which ensures a completely tailor-made report generation.
Note
Both in the visualisation of the final report and in PDF format, the regular expression defined and applied for the filtering of metrics and services is indicated.
Other improvements and fixes
Every new version of WOCU is full of small changes, fixes and optimisations that should be briefly highlighted. We list the most notable ones in this version:
Refactoring of the different files that allow the application data to be obtained. In particular, duplicate or similar files have been unified to eliminate repeated code.
Hereafter, when there is no data to display or an error has occurred in the Evolution Host and Evolution Services graphs, the Evolution Services of the Status view, an informative text will be displayed specifying what happened. These messages will be accompanied by a faded background graphic, keeping the same display style as the other widgets
Removed from the Host Info Panel of the Host tab of the Device Modal, the entry
Member ofwhen the Device in question does not belong to any hostgroup. Therefore, the field will no longer be blank, leaving more space for the rest of the data in this information table.It may happen that the text displayed in the
Plugin outputandCheck commandentries of the Host Info Panel from the Device Modal Host Info tab exceeds the space available on your monitor. In this case, an ellipsis (…) has been included to indicate that the text continues but has been cut off, and the full text can be consulted by placing the cursor over the textThe
Display_namefield has been enriched for those Events that do not contain it as source (e.g. syslog or traps events). This way, all events will display this data, whether or not they bring it with them.A new entry has been added to WOCU’s internal configuration to allow anonymous access in Grafana. While the default option is to have it disabled for security reasons, enabling it can greatly facilitate integrations with the additional module Dashboards provided by WOCU.
Refactored the code that is responsible for resetting and updating the data in the widgets that are part of the Devices and Services, in order to rule out loading errors
Fixed an overlapping bug of the Showing XX Entries info box in different tables of the application
Fixed a display error in the legend of the ring chart present in the Device Modal Status tab, improving data readability
The number of API calls has been refactored, significantly reducing the number of requests originating from refreshing the data in the graphs Evolution of Host & BP Hosts and Evolution of Services & BP Services and in the metrics calls of the Evolution of Metrics Report
Fixed a bug related to the
Metrics Groupselector in the Metrics Evolution Report, which affected the display of the report, showing metrics that were not associated to the marked service.The algorithm used for the calculation of Service Level Agreements (SLAs) used in Devices and Services has been homogenised.
Added data loading spinners to the Evolution Host and Evolution Services from the Status and in the Device Modal Metrics section. Additionally, the different styles of localised spinners have been unified, maintaining a single global style
Fixed a bug in the location of monitored Devices in the geolocation map of the Device Modal Status tab. With this reset, the accuracy of each point is increased, as is the case in the rest of the application’s geomaps
The icon library used in the application has been changed, as in the latest version of
Firefox (84.0.2), some icons were not displayed correctly. This has been corrected with the use of the Font Awesome library.The system is already able to generate and display the associated metrics graphs in the download of Metrics Evolution Reports in PDF format.
New ability to import relational fields via the import-tasks-per-CSV-file as data source.
Upgraded software
Numerous pieces of software integrated into WOCU have been incorporated and updated:
Software |
Previous version |
Current version |
Remarks |
|---|---|---|---|
MongoDB |
3.4.18 |
3.6.21 |
|
LMD |
1.9.1 |
1.9.4 |
Monitoring packs
See our catalogue of WOCU Monitoring Packs in the following link.
Pulse Secure
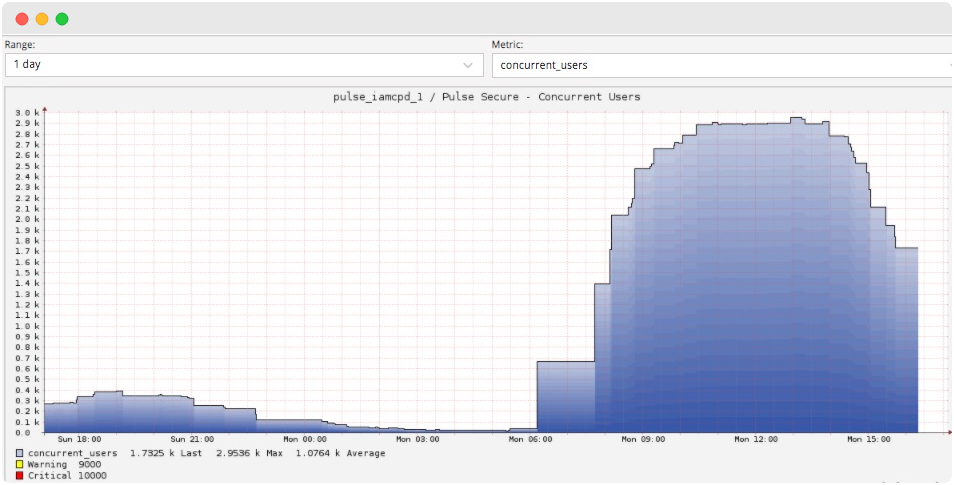
A pack for Pulse Secure devices has been added. This pack includes two services to monitor the number of concurrent users and the capacity of the concurrent user licence. Alerts will be generated both if the thresholds of connected users have been exceeded and if the licence is below the set threshold.

McAfee-ATD
A pack has been created for Mcafee Advanced Thread Defense devices. The pack includes the following services:
CPU usage
RAM usage
Use of data disc
Use of system disk
Temperature
Health status (Good, Bad)
Licence Status (Valid, Invalid, Expired)
Interface traffic

PureStorage
The following services have been added to the pack:
Info: provides information about the FlashArray being queried.
Load: queries the system load from the
Pure1API. This system load metric is calculated taking into account several parameters that are not accessible from the FlashArray API itself, so it must be obtained from thePure1API.
Bgp
The multi-fabric pack that queries the status of the peers BGP has been improved. It is now possible to discover the state of the peers and configure the state that each of them should have.
In this way, the check launched by the pack can check if the current state matches the configured state. If the state is as configured, the service will return OK, otherwise it will return CRITICAL.