Release Notes 48
Publication Date: 02/11/2021
The new version 48 is loaded with new features and improvements in response to the requests and suggestions of our users and the current market needs.
If there is one thing that makes this version stand out, it is the variety of added functionalities that make it possible to simplify, distill and transform complex operations, guaranteeing the quality of the processes and workflows in WOCU-Monitoring.
With the new Diagnostic Tool, it is possible to perform an in-depth analysis of the functional and operational status of applications, in order to detect any anomalous situation and determine the nature and reason for failure.
From now on, any operator can register new Realms from the aggregation interface, without having to go to the administration module where this action was previously performed.
Also, all the Monitoring Packs applied to the assets of a Realm have been concentrated in a new independent view. In relation to this, it is now possible to filter assets by pack type assigned in the global asset inventory, being able to locate elements according to different technologies, manufacturers, etc.
Another of the protagonists of this version have been the Host Groups as basic monitoring elements. Specifically, a new modal has been designed that brings together detailed and updated information on the group, in order to know and go deeper into the situation in which it is found. Similarly, the Status view incorporates a new graph in Top 10 format with the largest groups of the Realm in question.
And many more new features that add value, distinction, stability and robustness to an all in one ecosystem such as WOCU-Monitoring.
Read on for a full list of new features and improvements and read the User Manual for more information if needed.
1. New Host and Network Health Diagnostics Functionality
Fault prevention, early detection and immediate action are inherent functions within network control, management and monitoring with WOCU-Monitoring.
Alerting of an error must always be accompanied by its root cause. Ignorance of the root cause can lead to concatenated failures that can compromise the stability of the infrastructure or even block internal business processes.
This is why the new Diagnostic Tool included in this version of WOCU-Monitoring is so important. Integrated by several actions, this tool executes an in-depth analysis of the current functional and operational situation of a network Host, in order to detect any anomalous situation occurred and to identify its nature and reason of failure.
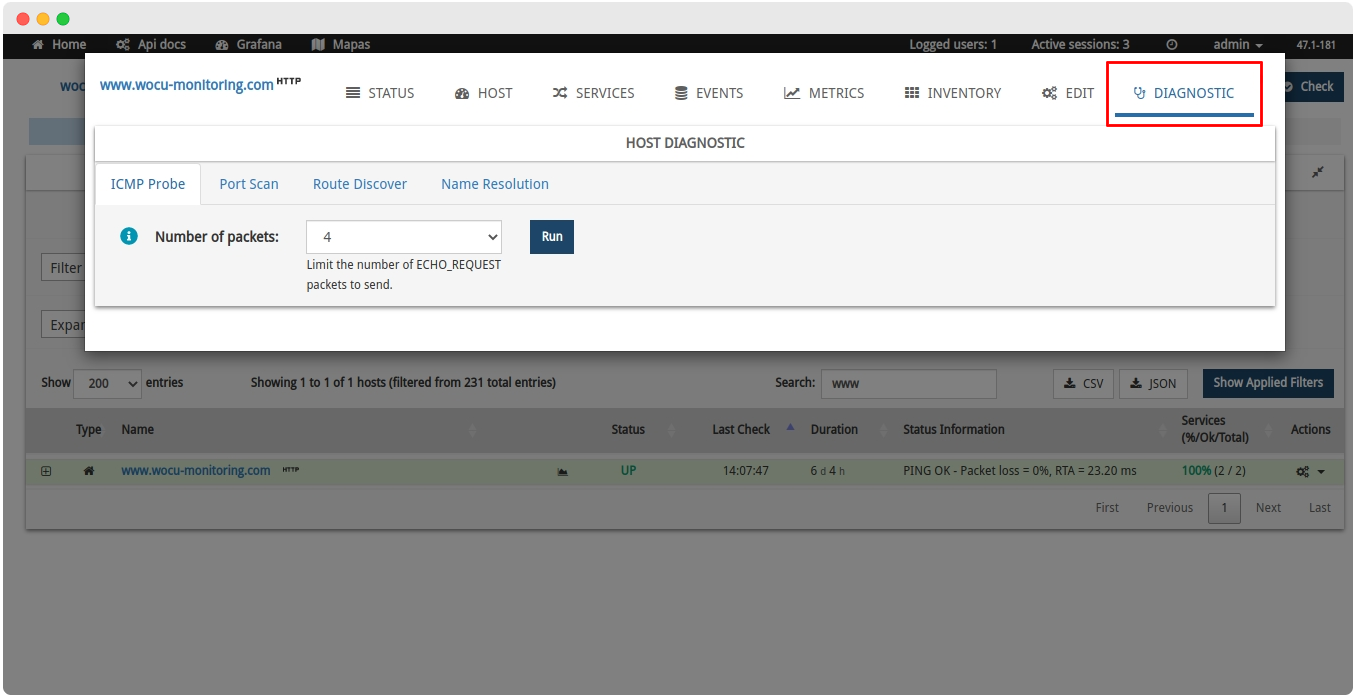
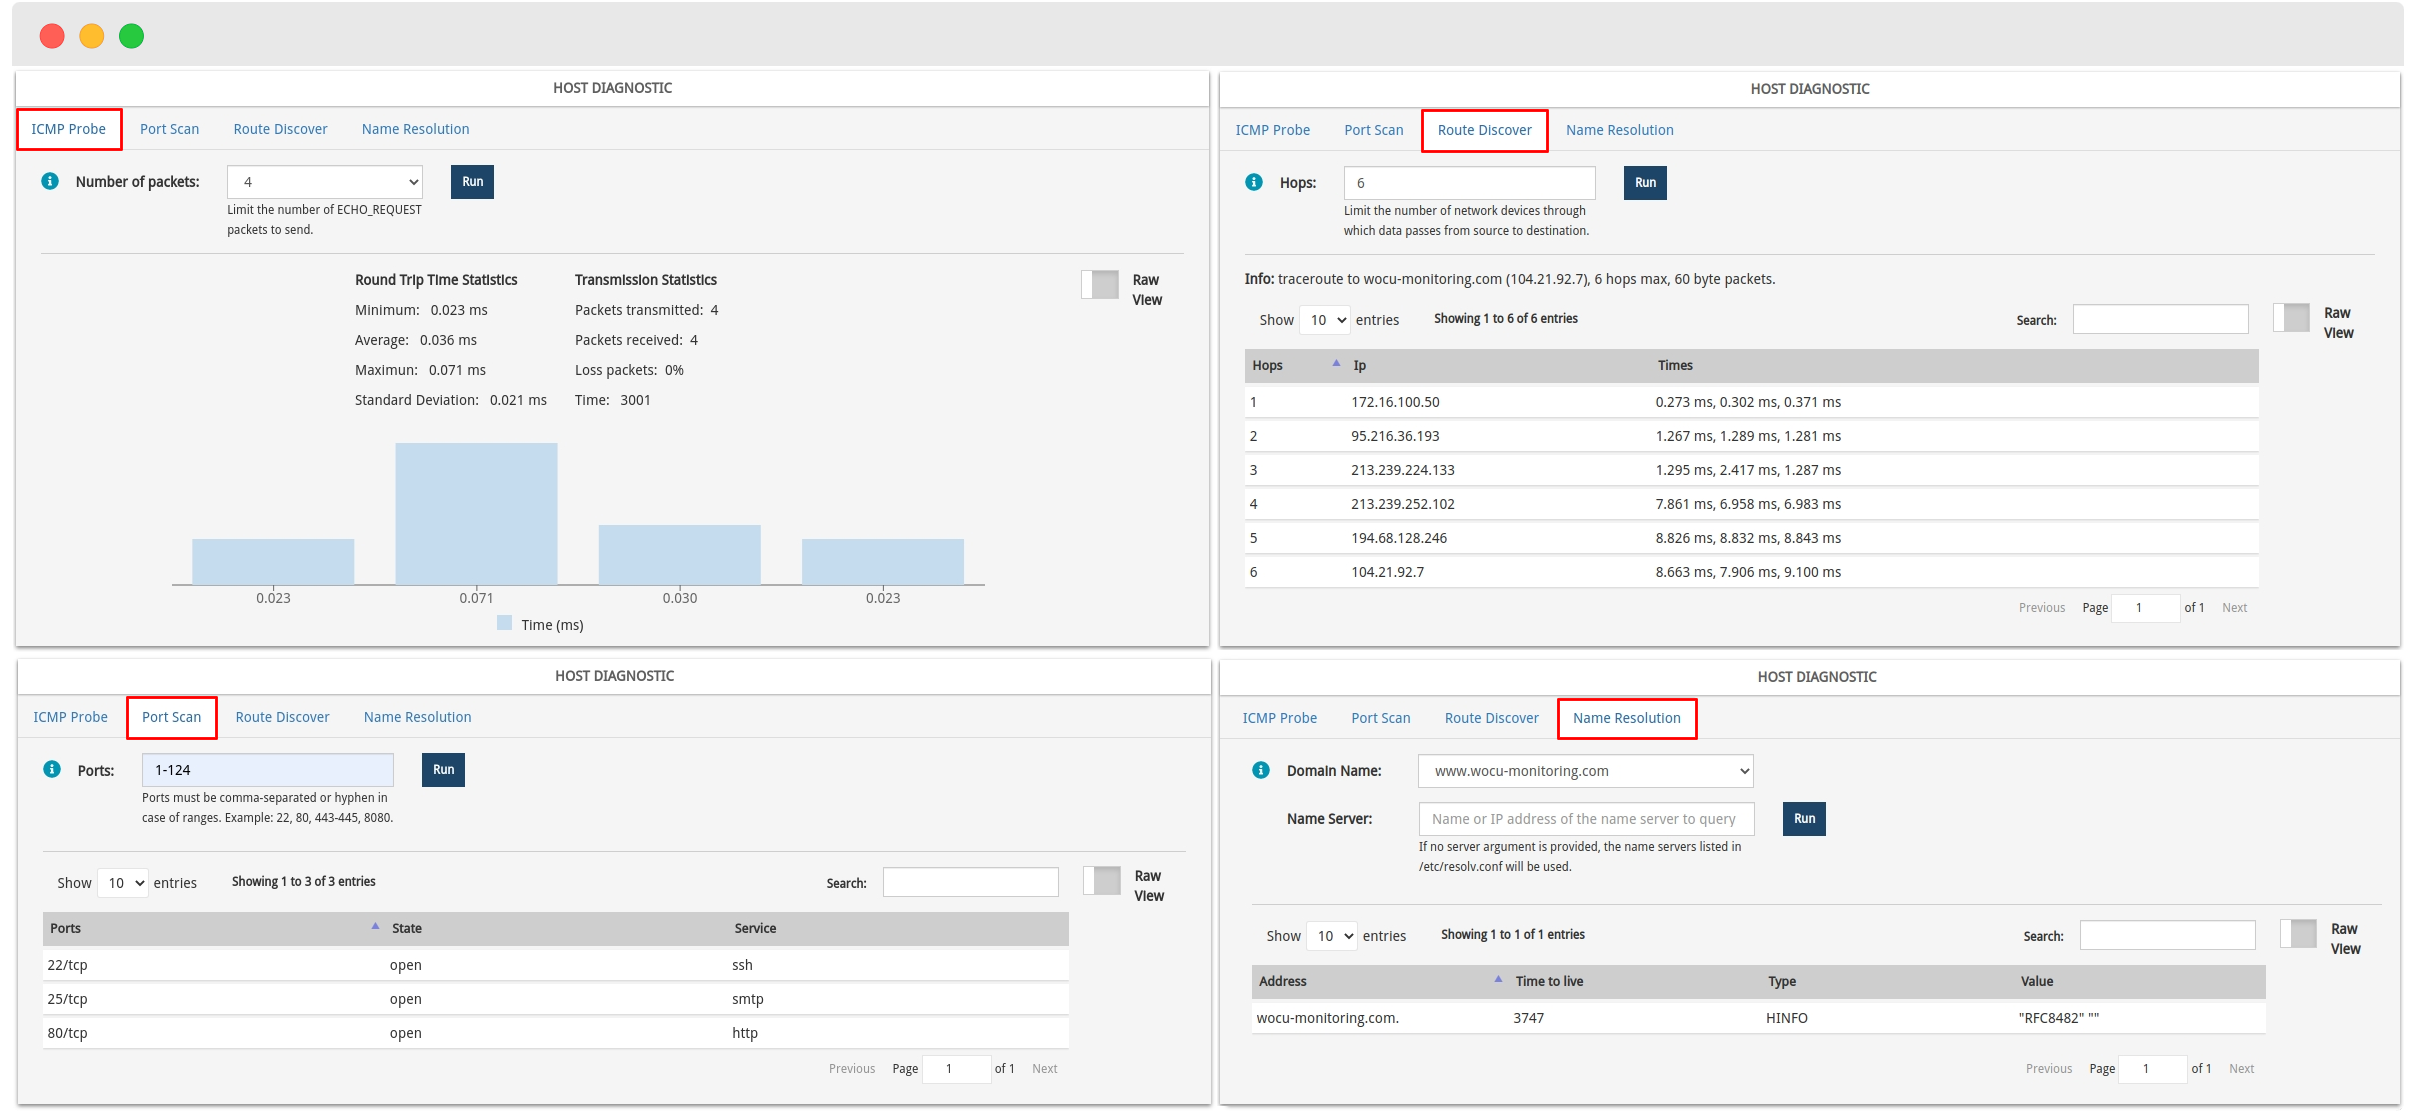
The technical analysis will consist of the following stocks:
✓ ICMP Probe: determines the status and connectivity of a Host by dropping packets that will diagnose the speed, status and quality of communication. The request will show as a result a graph built from the response times of each of the packets.
✓ Port Scan: performs a port scan to locate live hosts on a given network. Once the port or range of ports is entered, the system will display a table where for each port detected, its status and the service it is running is recorded.
✓ Route Discover: details the route that a packet takes to reach its destination, i.e. how it is routed to the machine where the Host under diagnosis is hosted. Once the number of hops is specified, the system will display a table where for each hop the IP where the packet is at that moment and the sending times are recorded.
✓ Name Resolution: extracts information identifying the machine (address, email, manufacturer, etc.), by means of queries to DNS servers. Once the Host Name or Display Name of the Host and the server object of the query have been selected, the system will display a table with information about: address, TTL times, type of output and information retrieved.
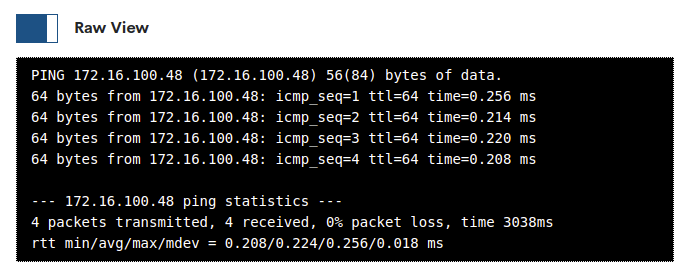
In addition, every response is accompanied by the raw output of the actual command issued, which WOCU-Monitoring displays in a table, graph or other element formatted for easy reading and understanding. By default, this component is hidden, leaving more space for the rest of the data.
Note
More information can be found at: Diagnostic.
2. New page on Monitoring Packs per Realm
As an inherent part of the tool, our catalogue of Monitoring Packs has been extended to new locations in the application, thus exploiting its value and usability. For version 48 of WOCU-Monitoring, a new stand-alone page called Packs Inventory has been designed within the Assets section.
This new view contains the complete listing of the Monitoring Packs that are being applied to the set of assets that are part of a given Realm. It also includes the grouping of assets by type or class of associated packs and by the different operational states they can reach.
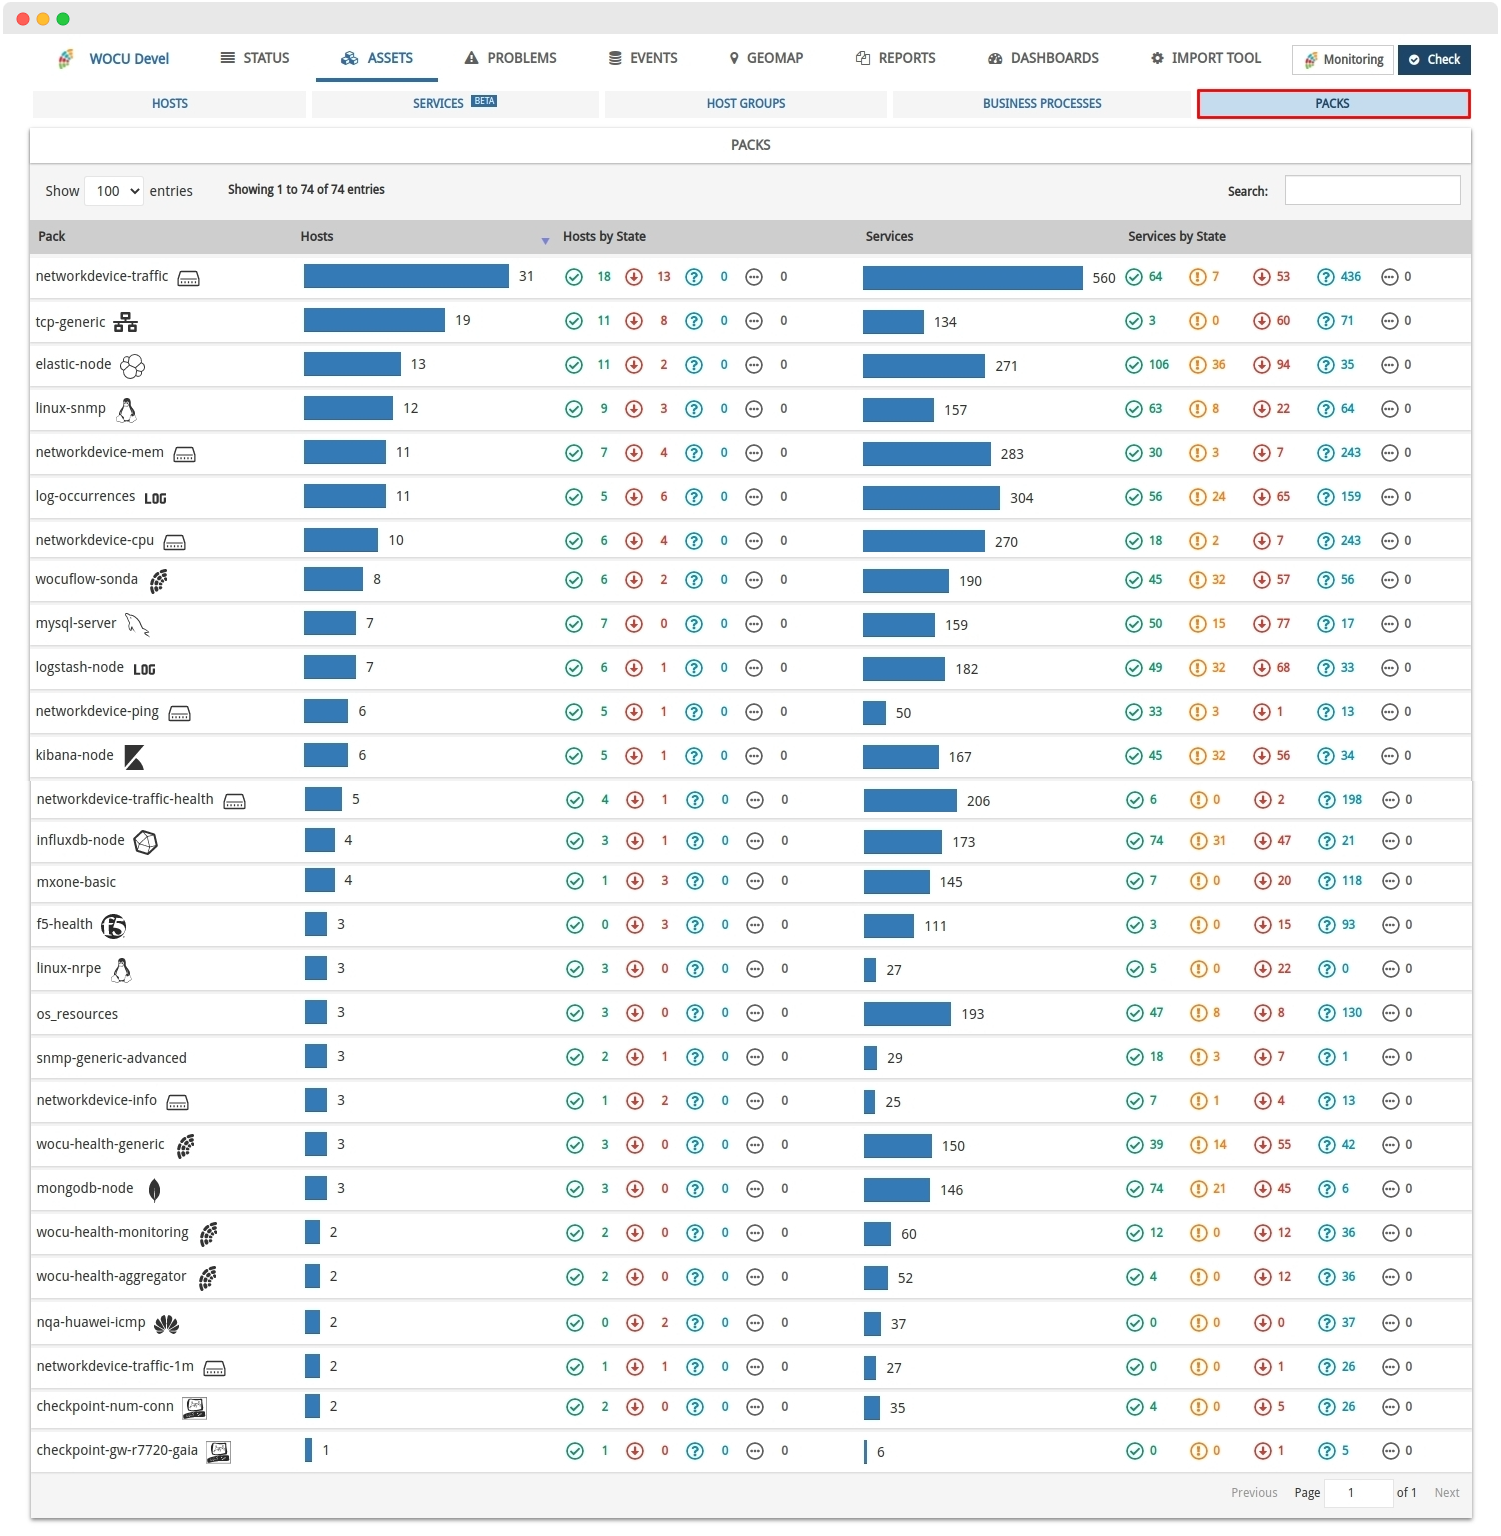
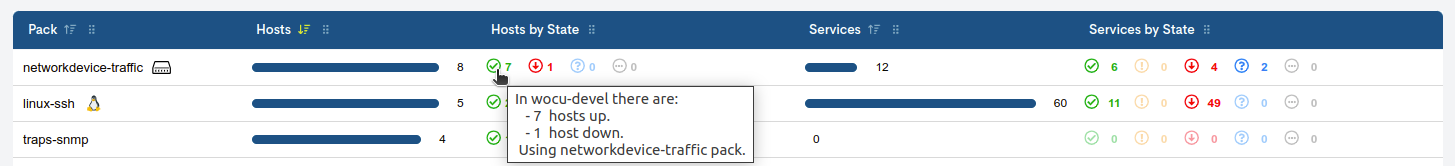
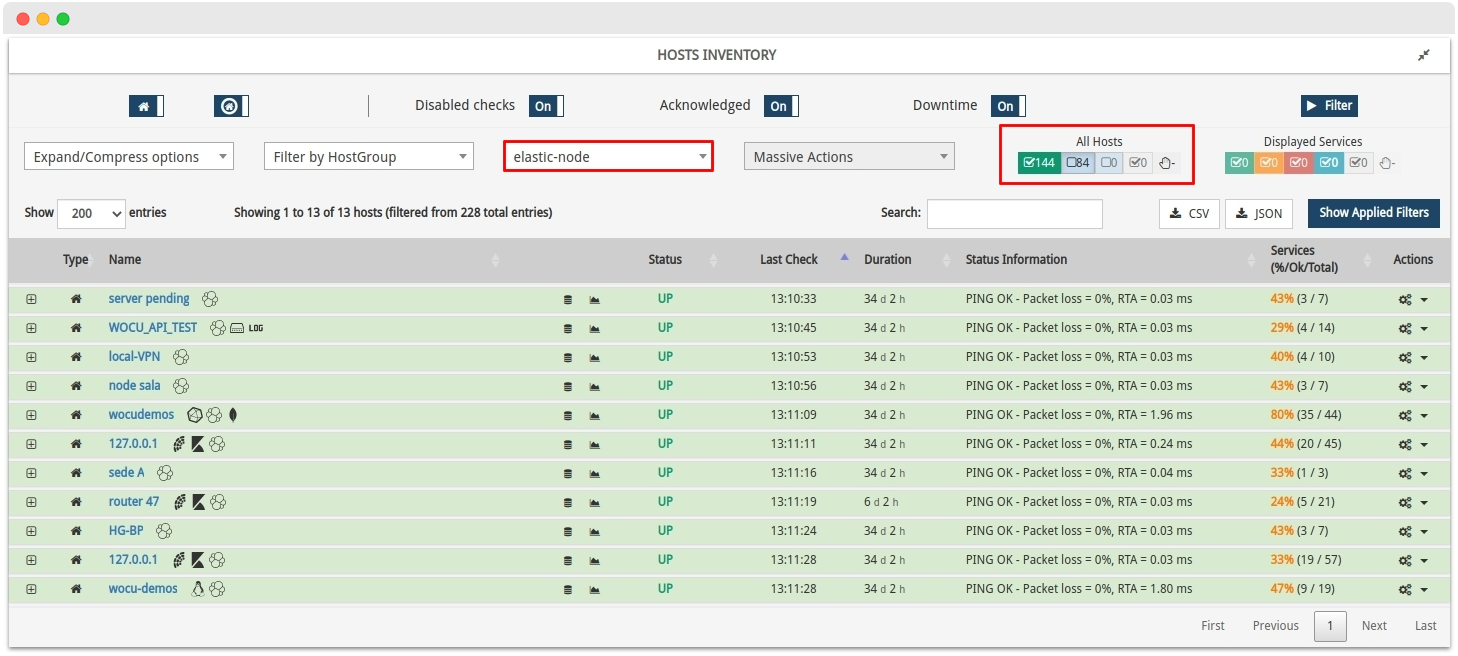
The Hosts Inventory and the Packs Inventory are closely linked. Therefore, each of the entries in the Hosts and Hosts by State columns act as a link, redirecting the user to the Host inventory filtered and updated according to the highlighted entry.
For example, if the UP icon of the Elastic-node pack row is clicked, the Hosts inventory will show only the items relevant to the query, i.e. all hosts in UP status that share that monitoring pack.
Note
More information can be found at: Packs Inventory.
3. Filtering of Hosts by type of Monitoring Packs
The options for managing and filtering items in the Hosts Inventory of the Assets view have been extended again. This time, the ability to filter Hosts by type of associated Monitoring Pack has been added.
The action is performed by means of a selector that lists the Monitoring Packs that are being applied in the Hosts of the Realm where we are. By selecting one of them, the table will be filtered showing only the Hosts that make use of the chosen pack, being able to refine the query with the rest of the available options.
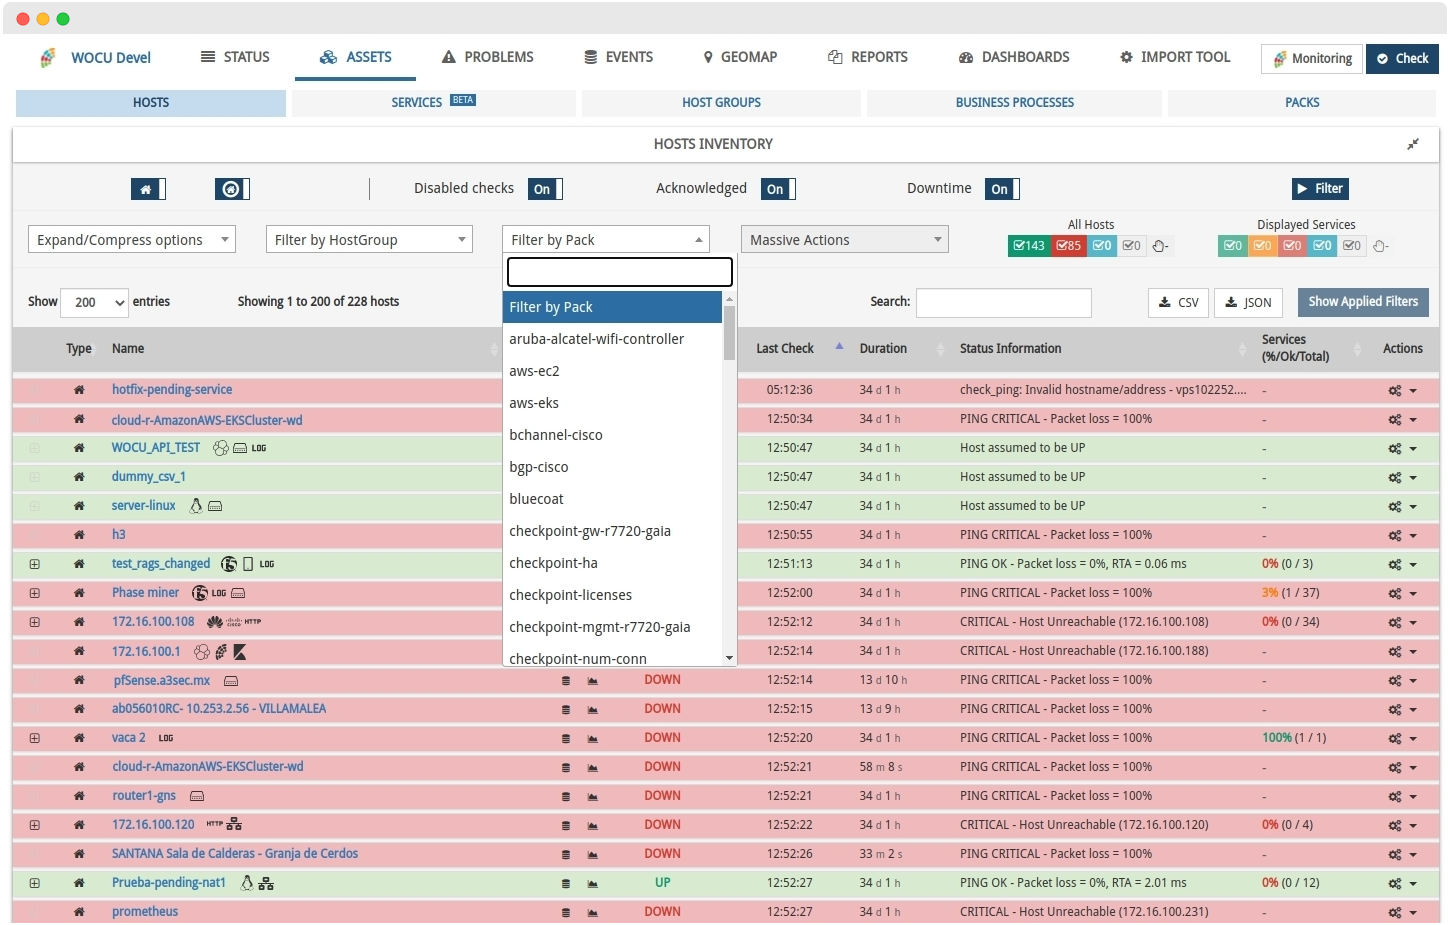
With this integration, it is easier to search and locate specific elements according to different technologies, manufacturers and other associated monitoring details.
Note
More information can be found at: Advanced Filters.
4. New widgets: Top 10 Host Groups and Top 10 Packs by Realm
The Status view incorporates two new widgets that complete and provide new detailed and updated information on the use of Monitoring Packs and the management of Host Groups that make up a given Realm. These are:
Top 10 Host Groups Chart
Provides a ranking of the largest Hosts Groups, i.e. with the largest number of members, in the selected Realm.
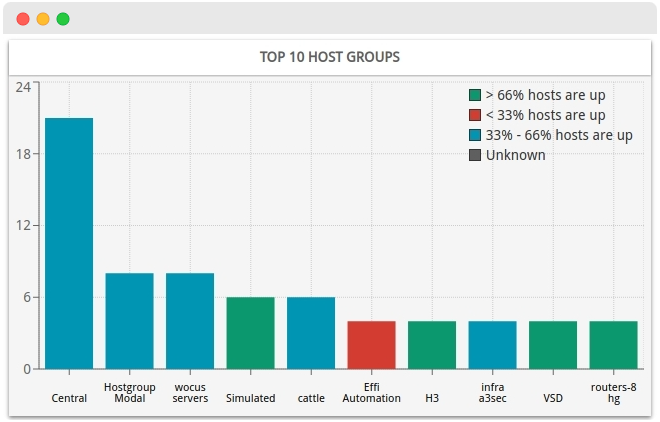
Noteworthy:
✓ Host Groups are ordered from largest to smallest (number of members on vertical axis and Host Group on horizontal axis).
✓ The status of a group (as its own entity) can be known according to the background colour of each of the bars in the graph. Each monitoring status is associated with an identifying colour. More information in: Statements of Assets in WOCU.
✓ By clicking on one of the bars, the user will be directed to its Detailed view of a Host Group, with detailed and up-to-date information on the current functional status of the grouping.
Panel Top 10 Packs
Representation of the most prevalent and most widely used monitoring packs within the Realm in question.
The treemap is divided into rectangles of different dimensions. Each one of them represents a specific pack and its size will vary according to its application in more or less Hosts. This means that the larger the size of the block representing a pack, the greater the number of Hosts associated with and making use of it.
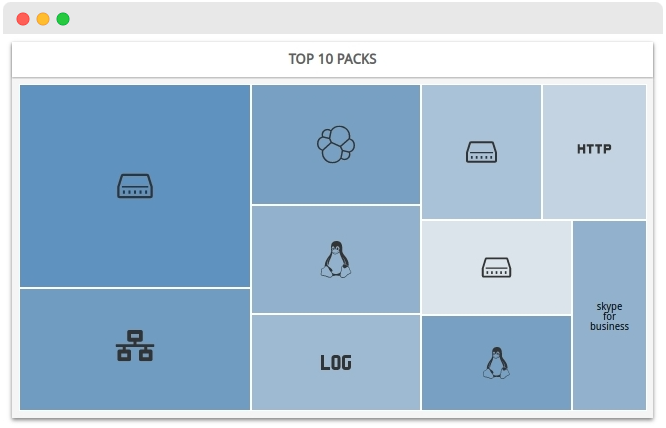
Noteworthy:
✓ Each rectangle on the map includes the icon identifying the pack or its name if it is not available.
✓ Clicking on one of the blocks will take the user to a filtered view of the Hosts Inventory showing only the Hosts that share this monitoring pack.
✓ Where monitoring packs represent less than
1%of the set, they shall be grouped together in a single block identified as Others.
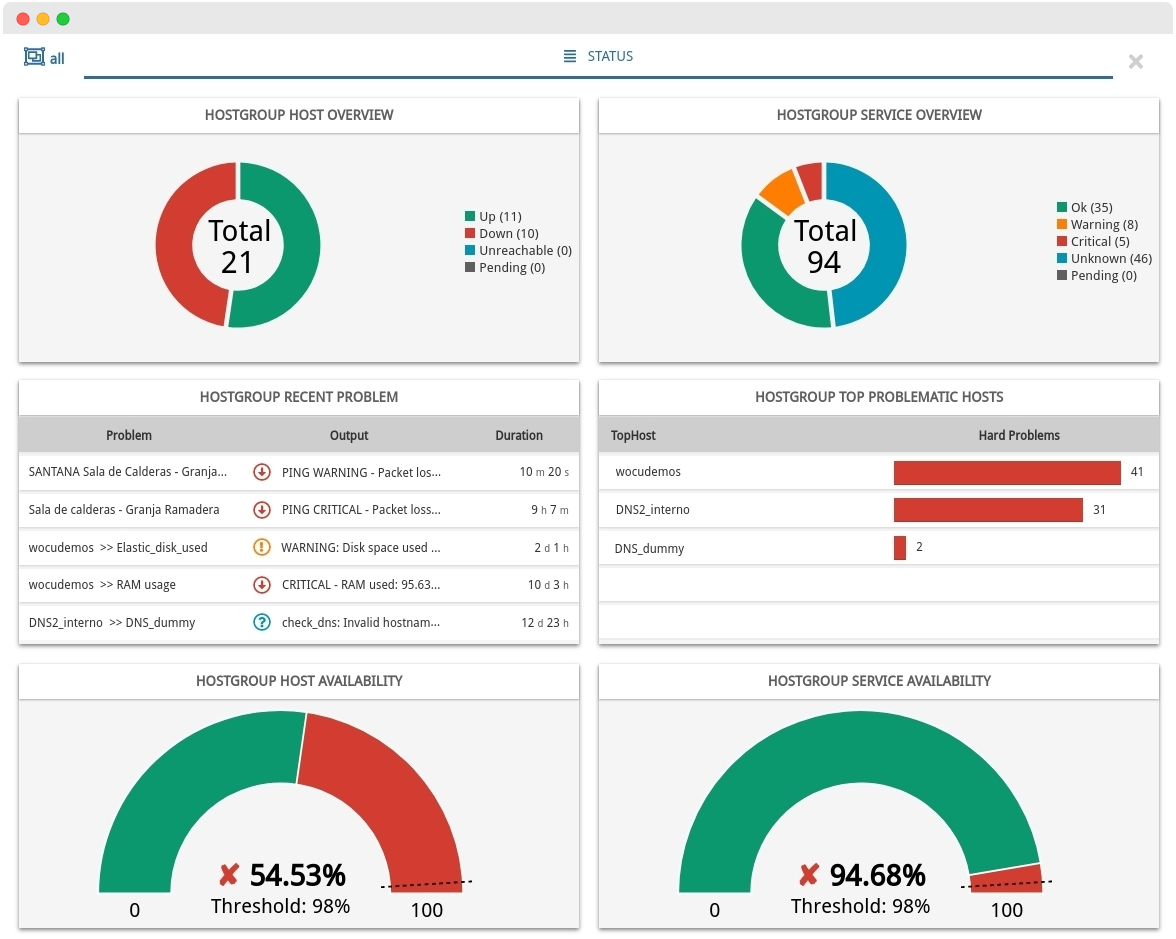
5. New modal specific to Host Groups
The powerful monitoring and management capabilities of WOCU-Monitoring IP infrastructures, enables and favours the logical gathering of certain assets for the extraction of statistics, metrics and a multitude of data in terms of availability, from the whole more easily.
Considering a Host Group as a base element in our monitoring system, a new Detailed view of a Host Group has been designed and included, which offers the user detailed and updated information on each group registered in the application, in order to know and go deeper into the functional situation in which the group is at that moment.
6. Optimising the Inventory of Host Groups in a Realm
The Host Groups Inventory has undergone a complete overhaul in this latest version of WOCU-Monitoring. The content remains the same, but is now displayed in a different way. The current organization is accompanied by new graphical elements that offer a much more refined and attractive view.
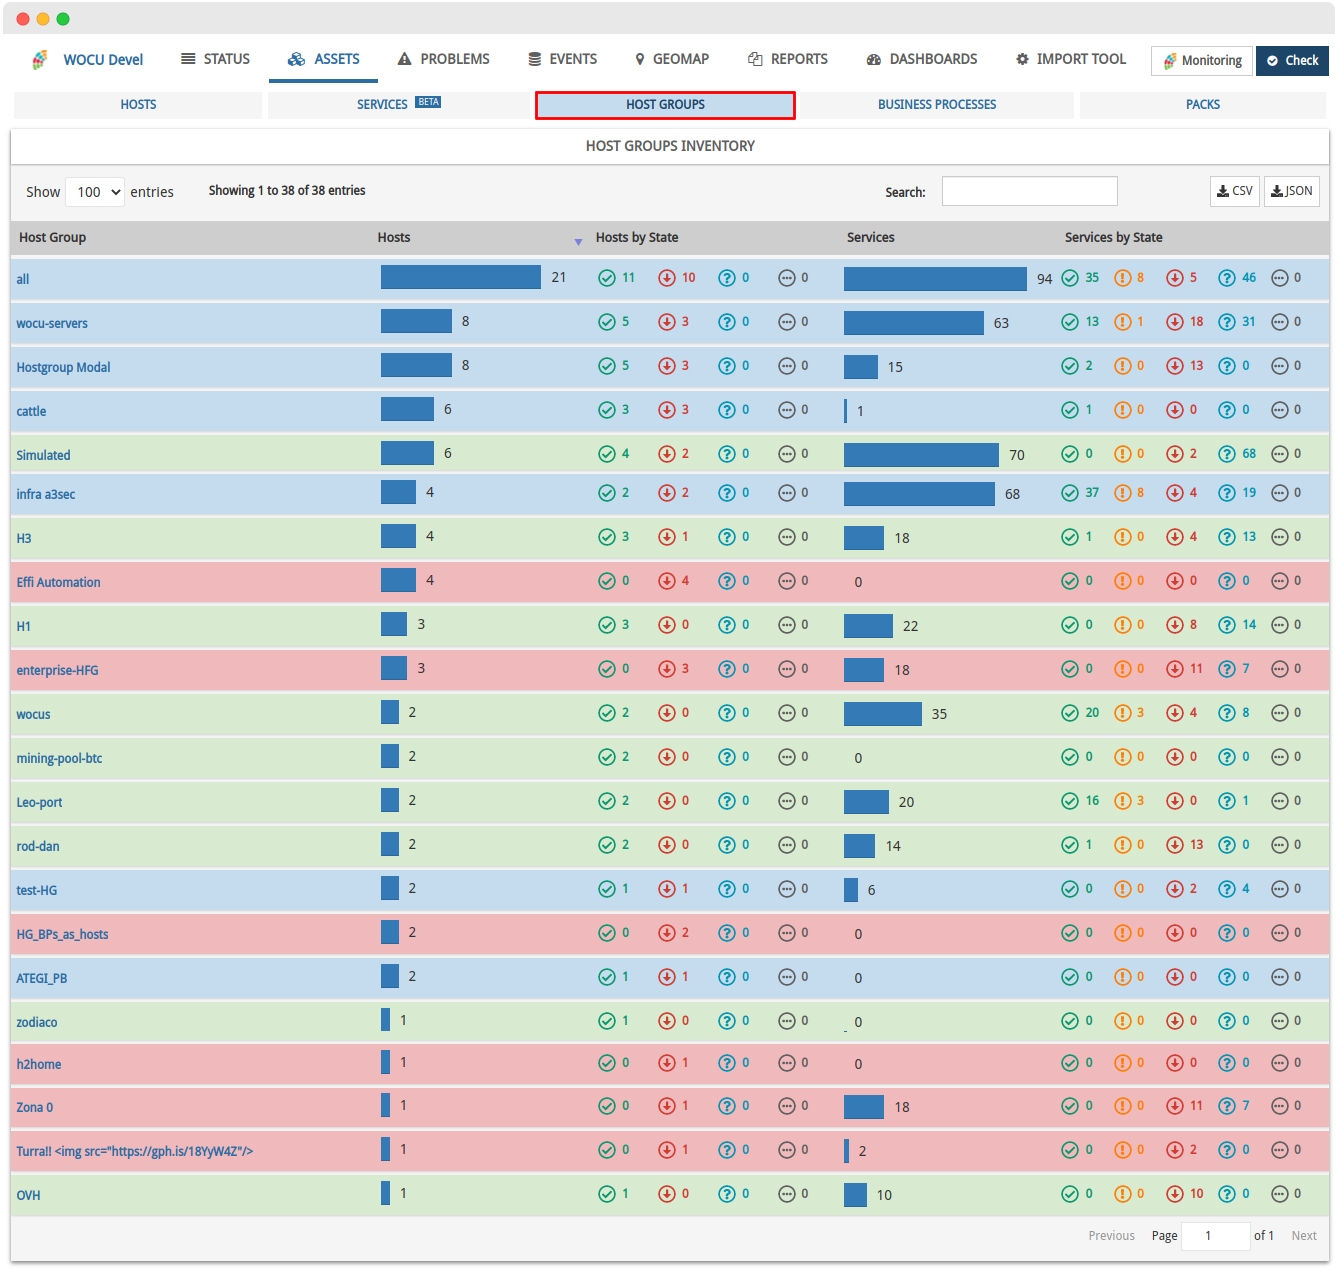
All in all, the sum of all these changes provides an improved user experience, with a smoother and more comfortable reading of data, thanks to links to other complementary inventories and modalities.
7. Ability to create new Realms from the aggregation view.
WOCU-Monitoring concentrates all network monitoring and supervision management in a single solution, bringing together the operations necessary for the implementation and maintenance of the infrastructure in a single configuration environment (and without resorting to third-party applications).
Under this premise, the new version of WOCU-Monitoring brings with it the possibility of registering a new Realm from the aggregator interface, without having to access the Administration Module where this action was previously carried out.
This inclusion in the tool’s Initial (Home) View significantly streamlines the task of creating independent monitoring systems, and is not limited to administration profiles only.
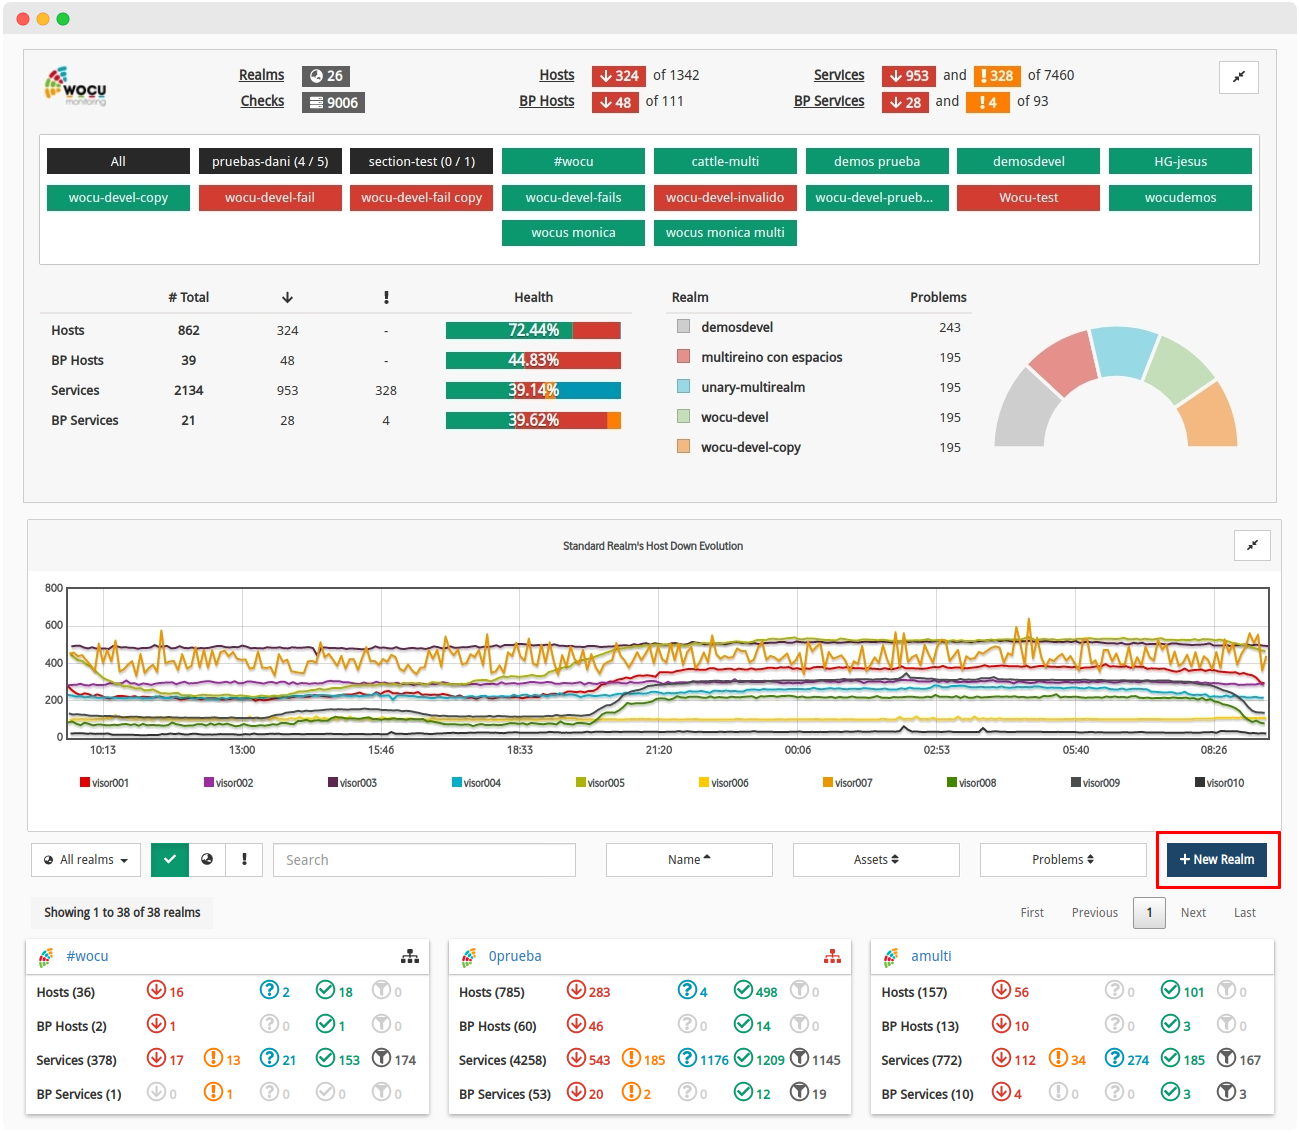
Triggering the action will display a pop-up window with a form whose configuration fields will have to be filled in manually by the user and will vary depending on the type of Realm:
Note
More information can be found at: Add a new Realm (+ New Realm).
8. Blocking crawling and indexing of WOCU-Monitoring instances in search engines
A new function has been added to restrict crawling and indexing of application access portals by search engines.
With the implementation of this new enforcement measure, the various instances of WOCU-Monitoring that are being exposed to the internet and consequently served as search results are prevented from being located and accessed.
Attention
This measure is unique to the Security Module.
9. Different refactorings of the frontend.
✓ The non-visible part of several elements of the tool has been simplified by implementing a new global component in charge of assigning permissions for uploading and displaying widgets, together with the migration of these to REACT technology. The affected elements are:
Widget Evolution of Hosts and BP Hosts de la vista Status
Widget Evolution of Services and BP Services de la vista Status
The code of the Comments component has also been modified, referring to the pop-up window that displays the comment(s) associated to a particular asset and to the table that includes the complete list of comments resulting from the execution of the massive-action. Both elements are available in the inventories Hosts Assets and Hosts Problems
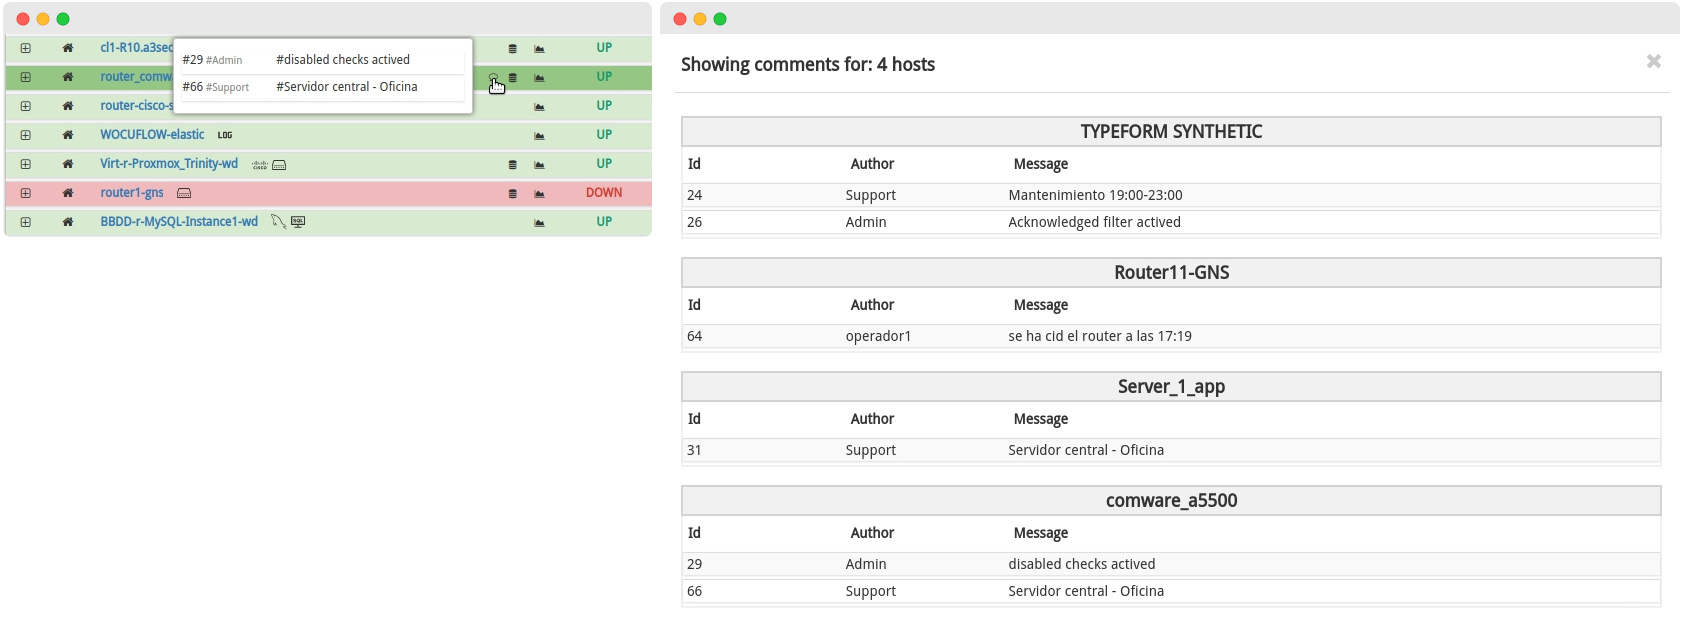
These changes will result in better data visualisation, improved maintainability and responsive visualisation.
Widget Top Hosts view Status
Widget Location view Status
Global Widget of the Status.
Hosts Groups inventory table of the Assets tab.
✓ A new library has been added for the generation and rendering of all types of graphics in the application. This library, besides being much lighter than the replaced one, fits perfectly with our migration to REACT. The following graphics have been refactored:
Evolution of Host & BP Hosts Last 24 h
Evolution of Services & BP Services Last 24 h
RTA of Device Modal.
✓ The database of identifying icons of technologies associated with Monitoring Packs, has been updated with the addition of new icons
TcpUpdate the icon associated with
Networkdevice.
✓ Work continues on the removal of all the Jquery part of the code migrated to REACT.
10. Upgrade to Django 3.2
We continue the process of updating the core components of WOCU-Monitoring. The framework used in our backend applications Django has been updated to the latest stable version 3.2 which offers extended support (LTS).
With this adaptation, the lifecycle and support is extended to the second quarter of 2024, whereas with version 2.2 support was only covered until April 2022. In addition, this update definitively leaves behind the 2 version of Python to optimise all features offered by the 3.8 version (currently used by WOCU-Monitoring). Similarly, support for Python 3.5 and earlier versions is removed permanently.
Some of the changes and functionalities that accompany this release and can now be used in the development of WOCU-Monitoring are:
Support for running as an asynchronous application supporting Asynchronous Server Gateway Interface (ASGI). With this new update Django incorporates asynchronism in views, middleware and tests.
Support for JSON including a field for models
models.JSONFieldand aforms.JSONfield, which becomes database agnostic, i.e. can be used in any supported database backend (includingMariaDBfrom this release). Both fields support custom JSON encoders and decoders and the ability to search and filter within the format itself, avoiding dependency on external libraries.The TextChoices, IntegerChoices and Choices custom enumeration types are now available as a way of defining field options in models.
Possibility to customise the type of primary keys created automatically. It is possible to configure which Django field is automatically attached to models without a primary key.
Increased the number of
PBKDF2to260000to increase security for brute force attacks (Password hashing). In addition, the default salt size was increased to128 bits.Easy management of Timezones by supporting non Pytz time zones, such as the new zoneinfo module.
Track migrations applied in the
django_migrationstable, where the name of the migration and when it was applied are indicated.New database functionalities:
Note
More information at: Django 3.2.
Other improvements and fixes
Every new version is full of small changes, fixes and optimisations that should be briefly highlighted. We list the most notable ones in this release:
Added support for Multireinos in the public endpoint which gets the list of Hosts grouped by Monitoring-pack applied. In addition, its counterpart private endpoint has been created to be consumed by the application’s frontend
Previously, to link an Import-Tool during the realms configuration, it was necessary to specify the
IPaddress of the machine where it was hosted. This has been made easier by allowing the Administrator to refer to a specific machine using domain names.The response modalities following the execution of any of the mass-actions available in Pending Assets, now include conclusive information about the requested request, in order to bring it to the user’s attention
From now on, in the Services Inventory, Services that have not yet undergone any previous check, will show the tag Never in the Last Check field and will go to a
Pendingstate waiting to register their current monitoring status.Fixed a bug in the massive selectors of the different tables of the Import-Tool module. It is now possible to apply the same action successively and between different pages of the table.
The action of sending Contacts located in Pending Assets to the Blacklist has been restored. The Contacts in Pending table has also been improved by fixing the header width
Fixed a bug that prevented saving a new configuration in the User preferences.
The names of the Hosts that generate events are re-included in the Monitoring Events (Monitoring), even if they have been deleted or removed from the system. In this case, they will not have the link to their modal view with detailed information.
The Metrics Evolution Report graphs with a 24-hour time frame now include a new time stamp, relating exact date and time for each point on the graph.
The Realm Evolution Chart re-plots and presents its values based on the web browser’s time zone.
Fixed a bug in the Templates Hosts form, when including non-preset notification contacts.
Variables have been created for visual breakpoints in the application. This allows for greater consistency, avoiding unexpected changes in design and layout.
Fixed a bug that prevented the deletion of metrics during the configuration of Multimetrics Reports.
The realms selection and view function, in particular the
Allselector, is now operational again, facilitating the filtering of all realms summary panels, in the tool’s Home.Reset the error messages displayed in the widgets of the Status view of the modals of Hosts and of Services
Modified the position of the icons identifying Monitoring Packs in the header of Host Modal. Now the icon precedes the name (
Host Name + Icons)The robustness of the endpoints for KPIs has been improved by adding validators for the realm_name and realm_type fields.
Improvements in the management and definition of fields to exclude in Import Tasks (Tasks).
From this version onwards, the Import-Tool tab is renamed Configuration, a more accurate term to represent the set of operations included in this module.
Fixed a bug in the behaviour of the credits functionality that blocked certain actions depending on the load or excess of assets to monitor.
Added the ability to sort entries in ascending and descending order, in the
StatusandTypecolumns of the Services Inventory.Fixed a console error caused by trying to delete a Contact in the Pending Contacts list.
Unification of the style and size of the icons identifying Monitoring Packs present in different views of the tool.
Upgraded software
Numerous pieces of software integrated in WOCU-Monitoring have been incorporated and updated:
Software |
Previous version |
Current version |
Remarks |
|---|---|---|---|
Grafana |
7.5.4 |
7.5.10 |
https://github.com/grafana/grafana/blob/main/CHANGELOG.md#7510-2021-07-15 |
Sphinx |
1.8.5 |
4.2.0 |
|
LMD |
2.0.2 |
2.0.3 |
|
MongoDB |
3.6.21 |
3.6.23 |
https://docs.mongodb.com/manual/release-notes/3.6/#3.6.23—mar-19–2021 |
Gunicorn |
19.4.5 |
19.10.0 |
|
Pillow |
7.0.0 |
8.3.2 |
|
Pycrypto |
2.6.1 |
3.10.4 |
|
Sqlparse |
0.2.4 |
0.4.2 |
Monitoring packs
See our catalogue of Monitoring Packs in the following link.
Packs upgraded to SNMP V3 version
Listed below are the Monitoring Packs of WOCU-Monitoring that have been migrated to the SNMP V3 version.
Important
The core of Monitoring Packs already includes SNMP V3 support. We continue to work on adapting other less frequently used packs.
Improvements to traffic measurement packs
A new version of the monitoring packs that measure the traffic through the interfaces of a Host (Networkhost-traffic, etc.) has been developed to optimise its performance and to provide powerful new functionalities. Some of the modifications made are:
Elimination of the use of temporary files to calculate the difference in
bytestransmitted between one query and the next. This improves performance when checks are executed by several satellites.Blocking of system command calls when making SNMP queries. All queries are now executed from the script itself, written entirely in Python 3, which greatly improves the overall performance of the monitoring engine by avoiding unnecessary invocations to other applications. It should be noted that the use of this check is widespread, as it is used for monitoring network interfaces of most hosts and technologies.
The packs support SNMP V3, so it is not necessary to apply a specific pack to Hosts with this version, just configure the new authentication parameters and select the appropriate SNMP version.
Support for range thresholds with Nagios syntax. For example: 10:80. Link to the guide to threshold syntax at the following link.
Refactoring of the Infoblox Pack
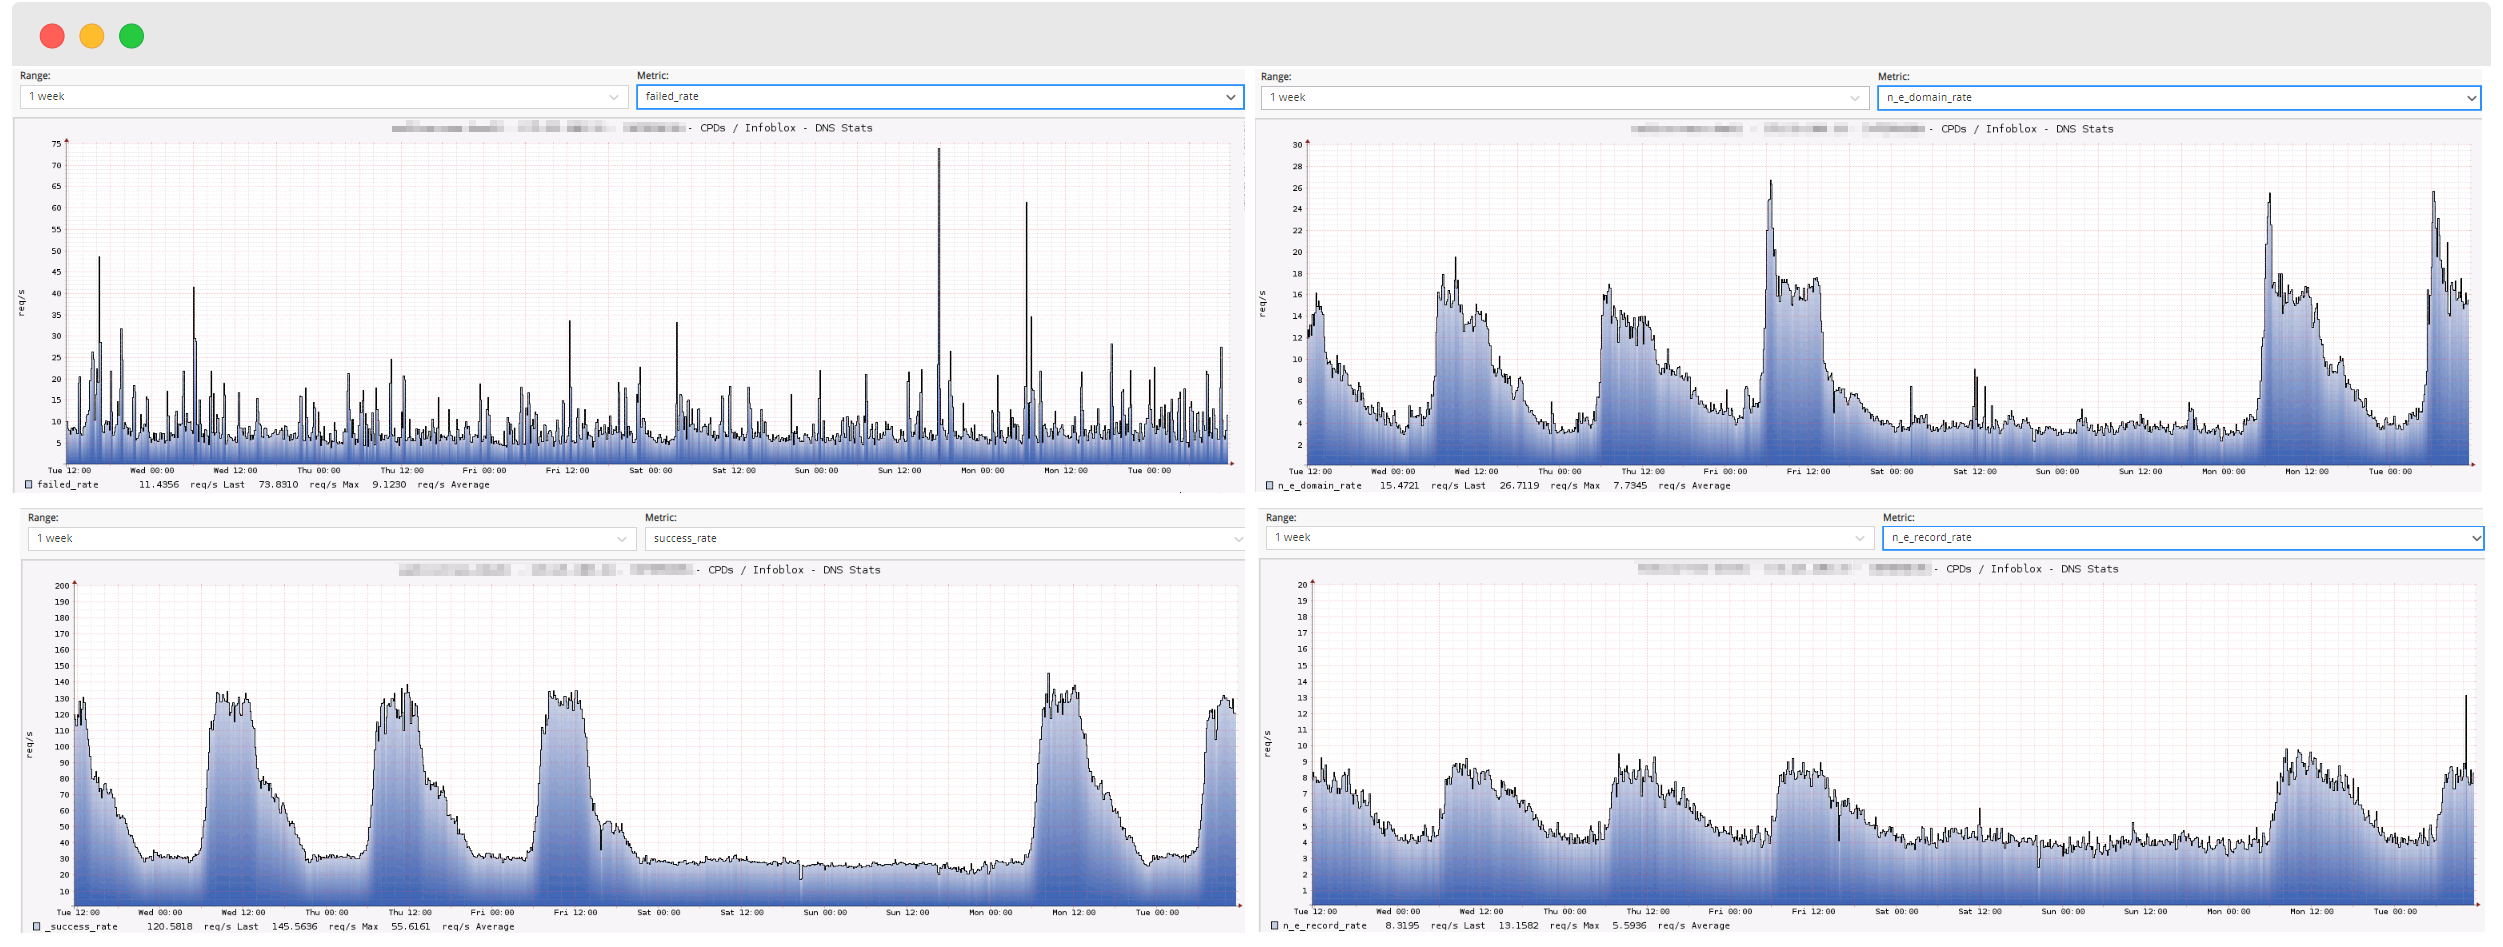
The Infoblox pack, which monitors DNS/DHCP servers of that brand, has been redone to improve existing metrics and include new services and metrics related to service usage statistics. The check script has also been rewritten to Python3.
Notable changes:
DNS statistics are now displayed in values of requests per second, rather than total values:
Success
Referral
No records exist
No exist domain
Recursion
Failed
New
DNS Invalidsservice that returns metrics for requests with invalid ports and transaction signatures.New service to display latency in
DNSresponses.New service to display
DNSstatistics for dynamic updates:Success
Failure
Reject
Prereject
Total
The update has been used to add SNMPv3 support to the pack.
New pack Checkpoint-vpn
The new pack Checkpoint-vpn has been added to the catalogue, with the function of monitoring the status of the VPN tunnels configured in Checkpoint brand hosts. The pack includes a discover script that allows to visualise all the tunnels created in the host during its configuration and to select only the ones you want to monitor. A service will be created for each of the selected tunnels.
Like all new WOCU-Monitoring packs, it comes with SNMPv3 support as standard.
New pack Aruba-oscx-health
The new Aruba-oscx-health pack has been created, intended for hardware monitoring of the Aruba OS-CX core switches. In particular, it checks the status of the power supplies, the speed of the fans and the temperature of the different sensors.
Like all new WOCU-Monitoring packs, it comes with SNMPv3 support as standard.
Changes to the F5-bigip package
The F5-bigip pack has undergone further changes:
Modification of services to obtain CPU and memory usage using F5-specific
mibs, as advised by the manufacturer.Aggregation of new services to obtain metrics associated with the TMM (Traffic Management Microkernel) process:
F5 BIG-IP - TMM Connections: check of client and server connections of the TMM process.
F5 BIG-IP - TMM Traffic Stats: displays traffic statistics associated with the TMM process.
About WOCU-Monitoring
WOCU-Monitoring is a monitoring that integrates the latest Open Source technologiesmonitoring, visualization, graphing of metrics and log management,providing broad visibility into the status and availability ofnetwork elements, servers, databases and workstations(among others) using Monitoring Packs tailored.
With the version of WOCU-Monitoring called Enterprise it is possible to perform deployments of miles of IP devices, in a distributed environment, with adapted customizations to each customer’s infrastructure.