Release Notes 0.45
Publication Date: 07/04/2021
The new version WOCU-Monitoring 0.45 is loaded with new features and improvements in response to the requests and suggestions of our users and the current market needs. Always focused on the user’s comfort and experience, this version brings functionalities that make the operation and handling of the tool even more flexible and fluid.
Among many other improvements, a new section called Templates has been integrated into the Import-Tool module, which allows the design, assignment and management of a range of Host configuration templates. These are nothing more than configuration profiles or prototypes, with a fixed structure of properties and pre-defined parameters. Now, the profiling of multiple assets that share an attribute will be much simpler and more orderly
Similarly, it is now possible to know immediately the operational status of a service in the Services modal, thanks to the new Check Now function, or to know which filters are being applied in the list of registered incidents, Problems, and in the Hosts Inventory, through a new interactive view that allows you to operate on the applied filters
Regarding the Reporting Module, three powerful integrations have been worked on:
1. In the capability of multiple and/or mass deletion of reports from the total list.
2. In the new support for filtering services and metrics by regular expressions in Multimetrics reports, giving greater flexibility and customisation given the infinite combinations that the report can process
3. In the inclusion of metrics units or magnitudes stored in the source DB InfluxDB in Metrics Evolution Reports.
As for other non-visible internal changes, from this version onwards, the system will automatically delete orphaned Business Processes, without the need for user interaction. To this we add the possibility to instrument the software WOCU Aggregator, to be able to monitor the performance of the software, among other things, as a measure of prevention and optimisation of the tool.
And we continue to update our Monitoring Packs Catalogue by adding new monitoring packs and services. As well as continuing to refactor numerous WOCU components to REACT technology.
But there’s more, read on for a complete list of new features and more information in the User Manual if needed.
1. Complete display of Plugin Output and Check_Command message
If the previous version included the option to view the executed Check_Command, in the Last check information panel present in the Services-Modal, this new version brings with it a redesign of the panel’s usable space, with the intention of displaying the full text of the Plugin Output and Check Command elements, which can sometimes be very large and exceed the available space
By clicking on either of the two blocks, a new information box will pop up, providing the full text. The view also includes a copy to clipboard function (📋), which, among other things, facilitates debugging tasks for the operator. This action does not make any changes.
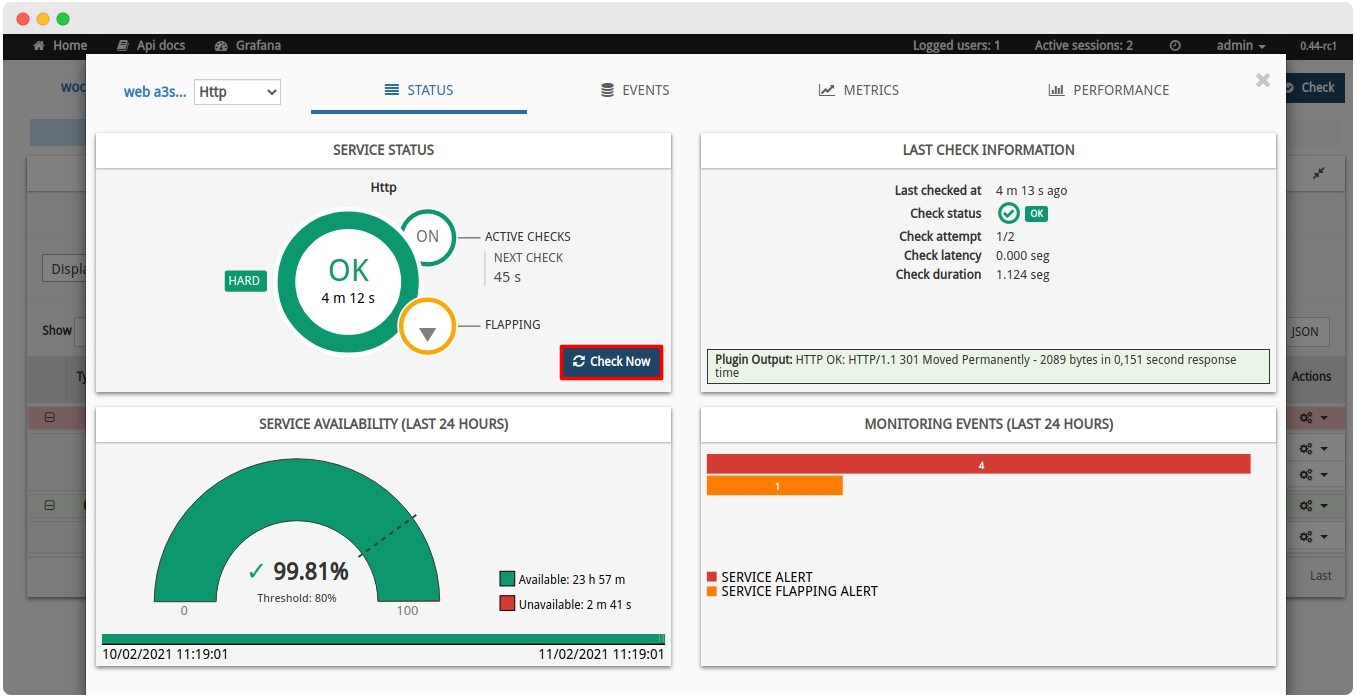
2. New button for immediate status update of a Service
In line with the previous version where the Check Now button was integrated in the Hosts Modal; this time, it has also been included in the counterpart pane of the Services-Modal
Using the Check Now button will automatically force an immediate refresh of the panel, without waiting for the refresh scheduled in the User preferences. After execution, any changes recorded will be reflected.
We continue to work to increase the usefulness and usability of the modals and to provide a detailed overview of asset status and availability in real time.
3. Filtering of services and metrics by regular expressions in Multimetrics Reports
WOCU facilitates the monitoring and evolution of Hosts and Services through performance values collected and stored in metrics, during operational checks and verifications. Through Multimetrics Reports it is possible to obtain unit values on a multitude of specific metrics, through the application of discrete mathematical functions
Given the infinite combinations of metrics and services that the report can process, this version supports the filtering of metrics and services by defining regular expressions, providing greater flexibility and customisation in the report configuration. This is possible by enabling the new option Toggle Regex, located in the report configuration form
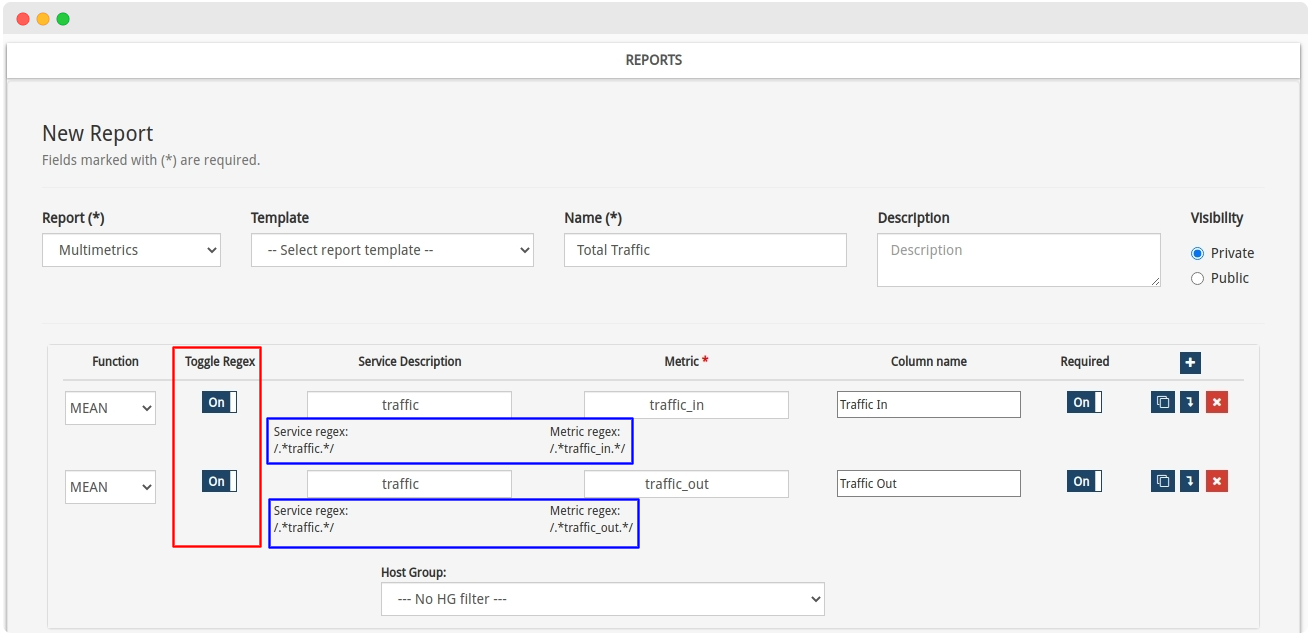
The operation of the Metric and Service Description fields is very simple. You will need to enter a search pattern that will act as a regular expression. For example, when you enter the term “traffic_in” in the Metric field, the system constructs the regular expression /.*traffic_in.*/. These wildcards replace any character before or after the entered term. The report will then capture all metrics whose name contains the characters “traffic”,i.e. all those related in some way to traffic in and out of the monitored assets.
Ultimately, reports will be generated taking into account only those metrics and/or services whose name/description includes the defined text string as search pattern. In addition to this, other filters can be applied and complex and very specific time frames can be selected, which ensures a completely tailor-made report generation.
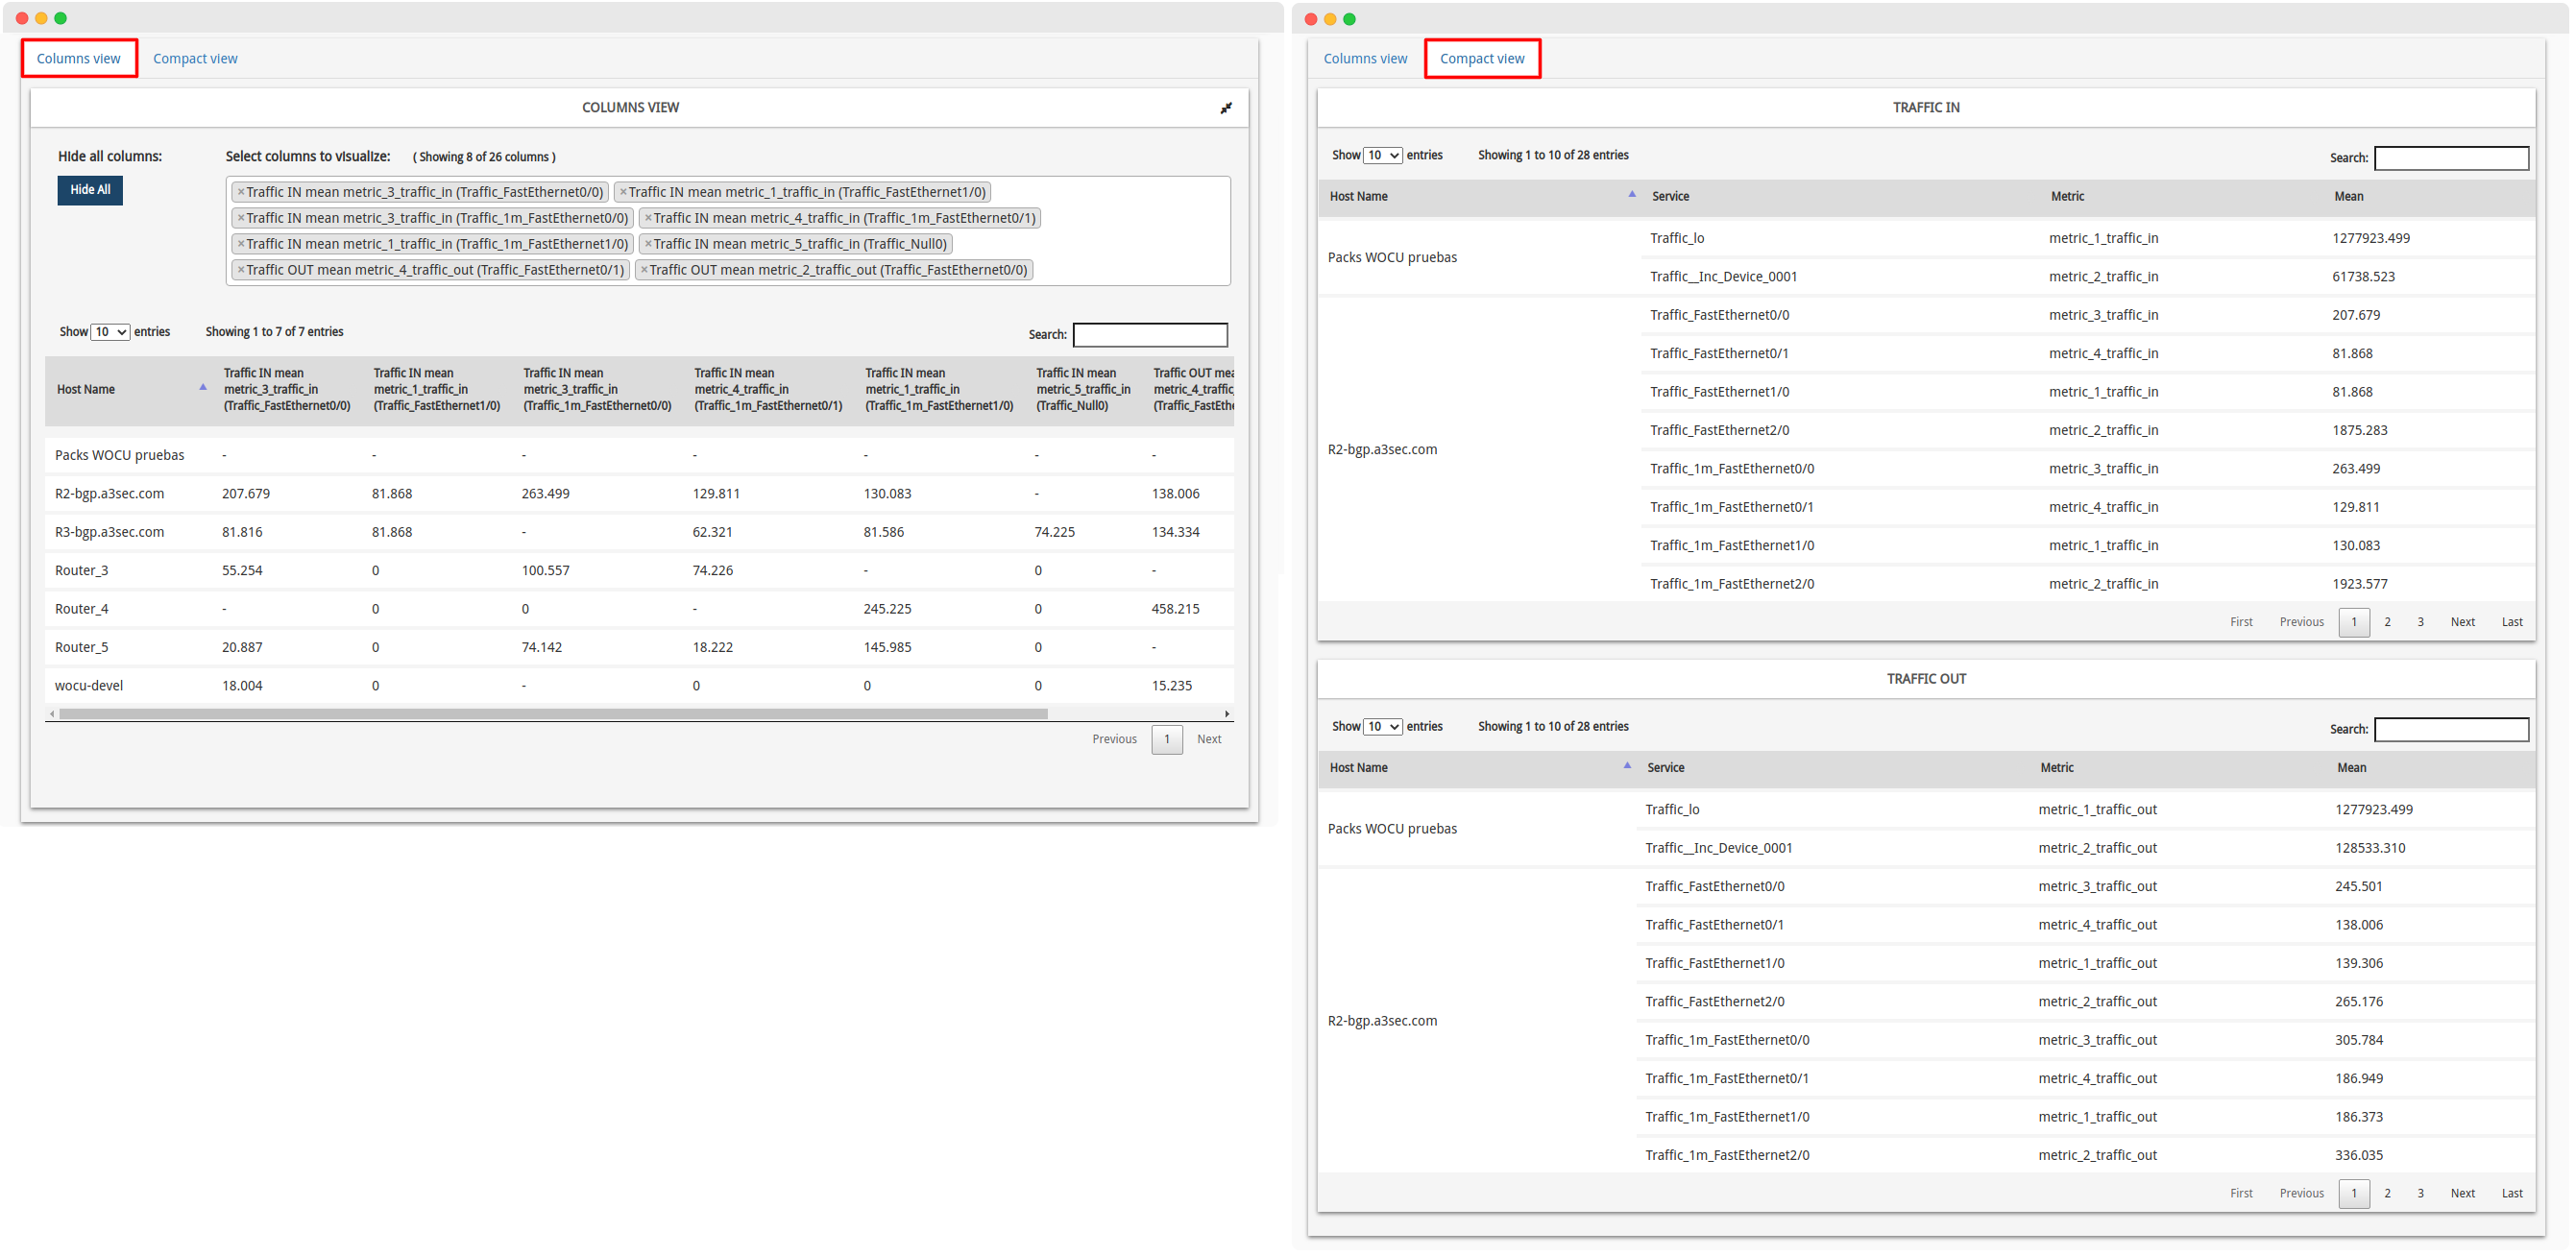
In addition, the presentation and display of data in this type of report has been revamped. Although the tabular format for the organization of the metrics has been retained, two new ways of displaying the data have been included:
✓ Columns view: where all registered metrics are condensed into a single table, together with the Host to which they belong. This view allows you to select which metric to display in the table using the Select columns to visualize selector.
✓ Compact view: where there is for each metric group configured, a specific table that collects all the metric values that the system has collected for each service and associated Host.
4. Inclusion of units stored in Influx in Metrics Evolution Reports
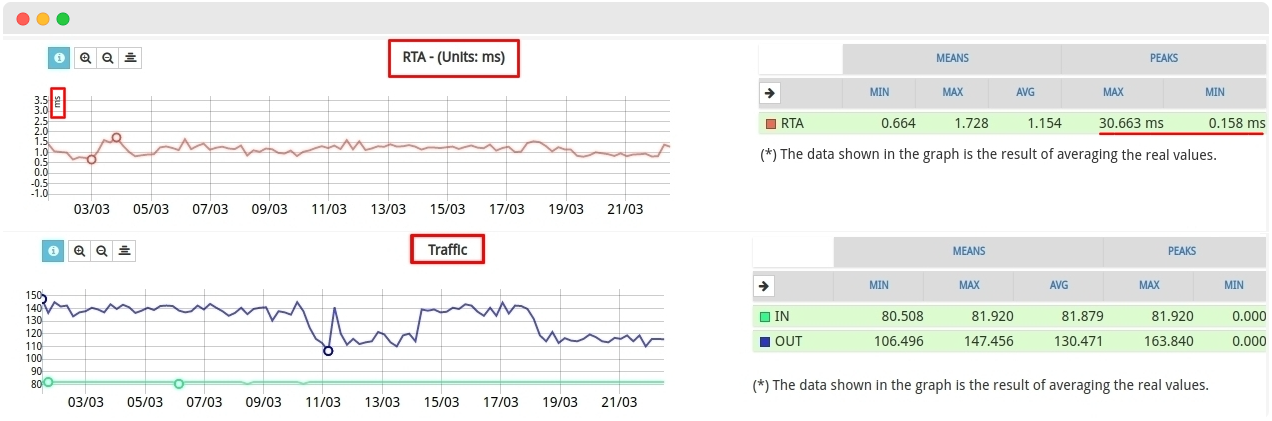
The Metrics Evolution Reports compiles a set of data for a group of selected metrics, representing in an organised way, the statistical correlation between them. WOCU extracts the resulting metrics monitoring data from the InfluxDB database.
To this effect, from version 0.45 onwards, each metric used in this type of reports will be given in the unit that was registered in the source DB. WOCU will display the metrics as they were stored, i.e. the way InfluxDB recorded them.
The unit type (%, ms, KB/s…) shall be indicated on the Y axis of the Metrics Evolution Graph, next to the cell title and inside the cell for the minimum (MIN) and maximum (MAX) value, if and when:
✓ The unit is already specified from the source metric storage DB. Otherwise, the magnitude in which the values are modelled and displayed shall not be shown.
✓ All metrics collected for the report share the same unit. Otherwise, it will not be displayed.
This function avoids possible errors in the configuration of reports, caused by a lack of knowledge of the different units in which the values of each metric can be stored and displayed.
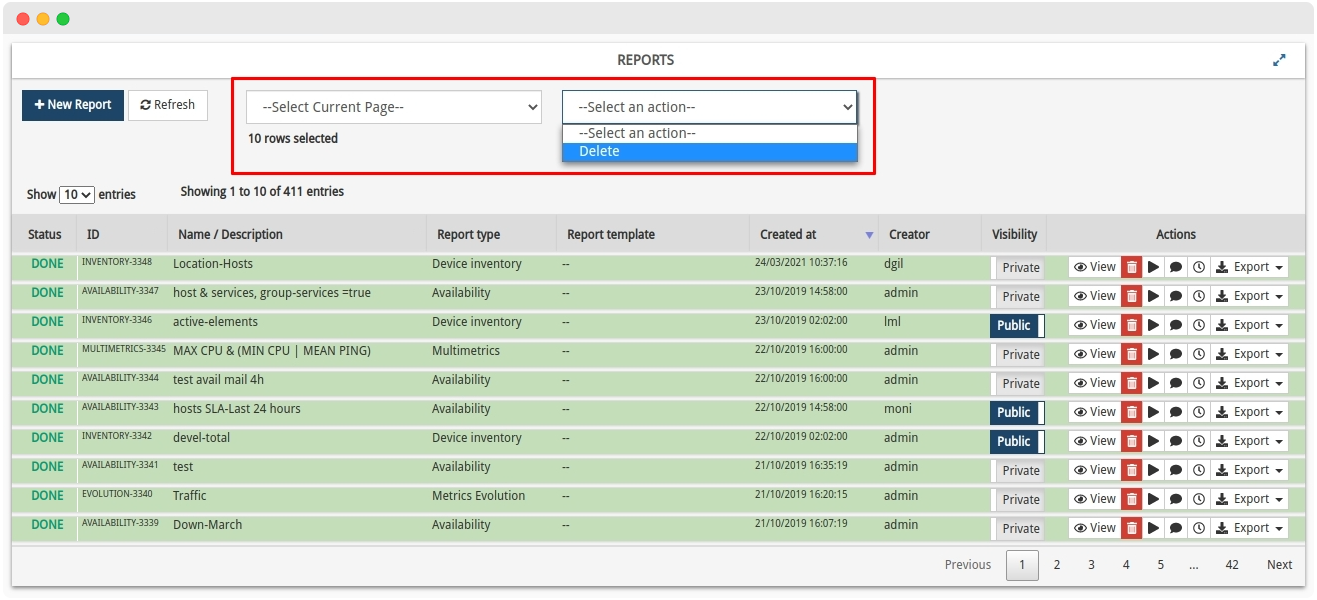
5. Mass deletion of reports option
WOCU’s Reporting Module supports advanced reporting on metrics collected, availability levels, events detected, KPIs that ensure the quality of business processes, and more. All collected value can be captured in a customised report, for internal use or sharing with third parties.
This powerful capability makes reporting a regular task in WOCU operations, which can sometimes lead to extensive reporting lists for each independent monitoring system (Realm).
To this end, a new, very useful and intuitive action has been added, which allows the mass deletion of selected reports from the total list. This functionality, together with the various filtering and search options available, further streamlines the administration and management of reports (downloading and exporting, scheduling, launching, etc.).
Note
More information can be found at: Mass Deletion of Reports.
6. Design and assignment of Host configuration Templates.
WOCU is specially designed to monitor large IP infrastructures, so importing and adding assets is an automated and fully scalable process. Each Host can be imported with certain properties and configuration parameters, or its profile can be enriched or modified to fit the expected monitoring function.
Considering the number of Hosts supported by WOCU and the infinite possible configuration and modelling combinations, a new functionality has been added for the creation, application and management of Host configuration Templates.
Based on the fact that a Template shares the same structure (parameters and attributes) as a Host, when there are elements that will share the same values (e.g.: sixty Hosts with a Check_period: 24x7), instead of the manual and individual configuration of each one of them, you can design a template with the common values and assign it to as many Hosts as you want. This, apart from giving more flexibility to a rather arduous task, facilitates the configuration process by having to edit only in one place.
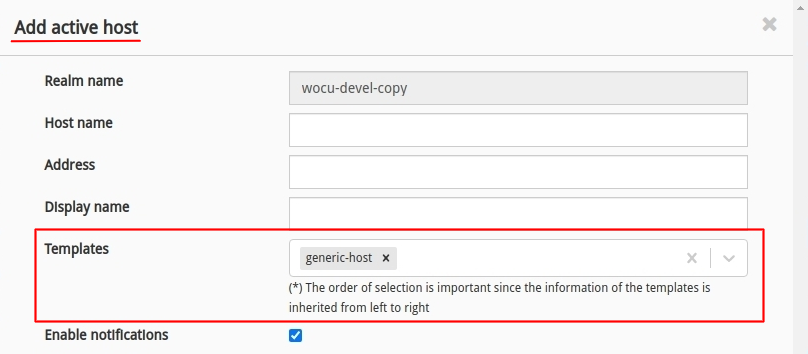
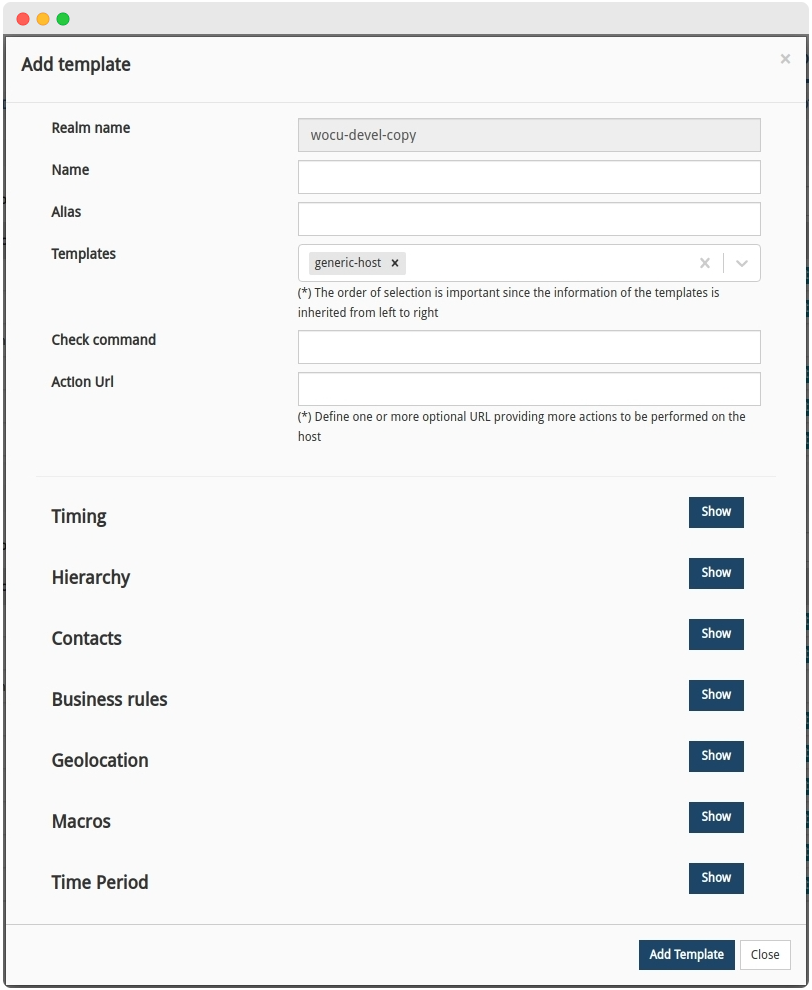
Img. Template selector in the Host registration form.
It is possible to assign one or more Templates to a Host, which will inherit its attributes and configuration parameters (as long as they are not already defined), serving as a basis for the initial modelling of the element and being able to add additional settings if appropriate.
This aggregation involves the creation of a new section Templates in the Import-Tool, as the epicentre for managing and adding new Templates.
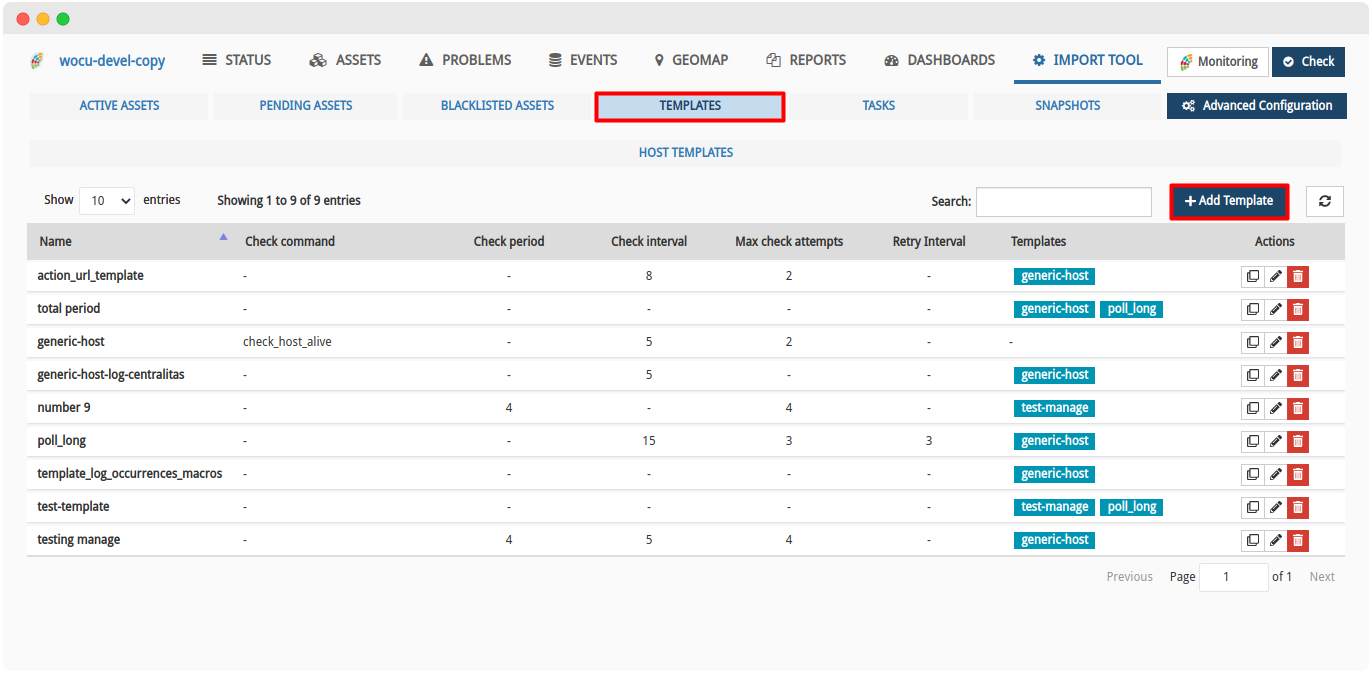
As indicated above, the Templates follow the same format as the add, edit and duplicate a Host form, so their design and construction is very similar.
Important
✓ A Template can inherit attributes from other Templates, in fact, it is recommended that all new models inherit from the default designed Template called generic-host.
✓ The order of selection of multiple Templates is very important, as the attributes of each Template will be inherited in a sequential order from left to right.
✓ Template assignment and aggregation never overwrites any values, it only fills in any parameters that are empty.
7. New button on filters applied in the Assets and Problems listings.
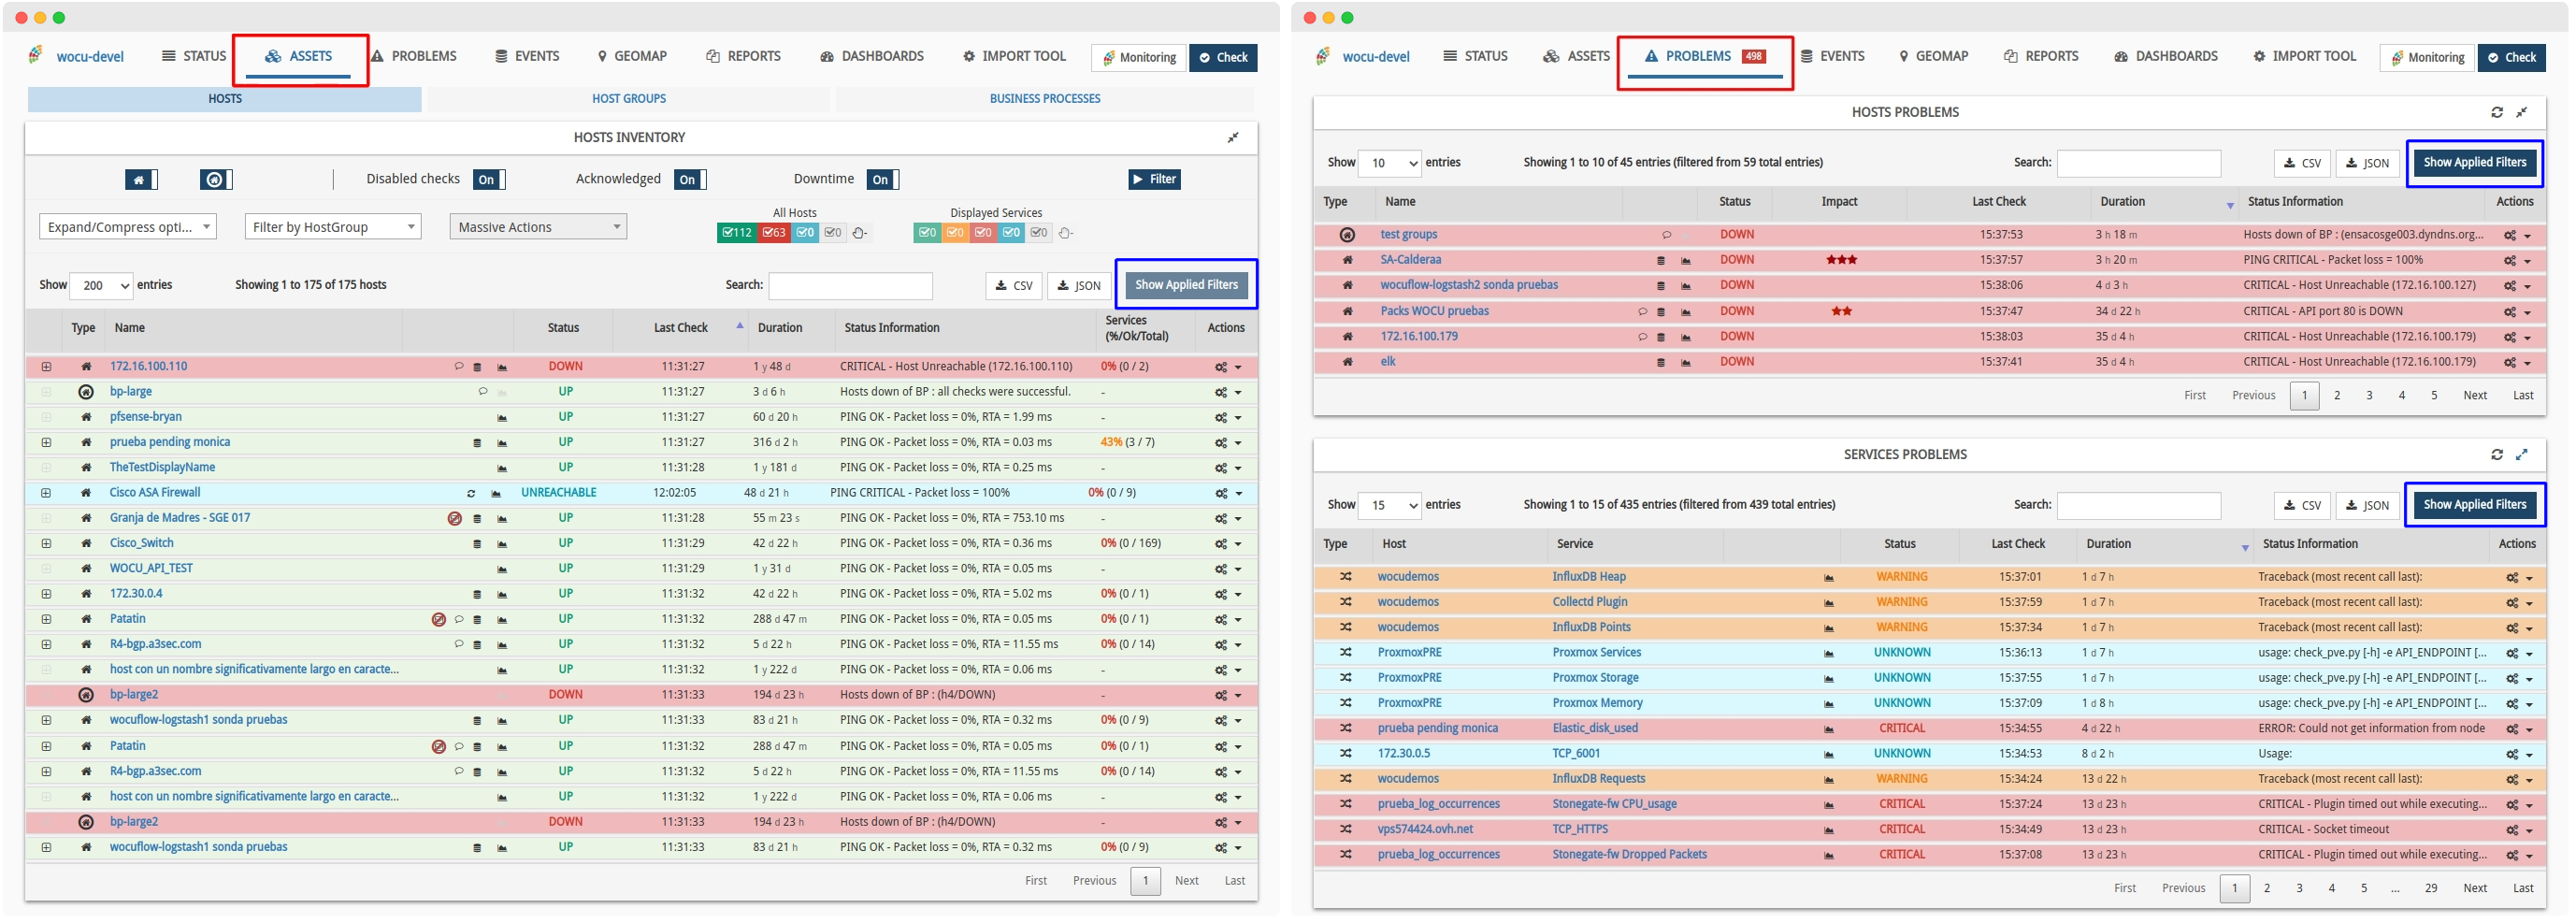
Both the Hosts Inventory (assets monitored by WOCU) and the inventories in the Problems view (logged incidents) can generate extensive datasets that, thanks to the different filters available, make the tasks of searching, locating and processing items much more agile and less tedious.
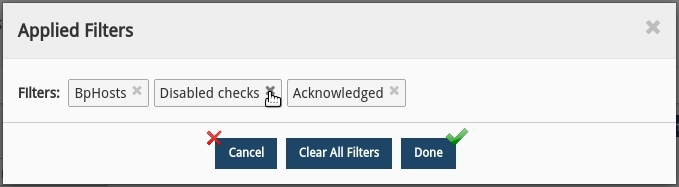
To further refine the search and filtering strategy, the Show Applied Filters button has been included, which will open a new window showing the user which filters are currently active.
But this window is not merely informative, it also allows you to interact with the implemented filters.
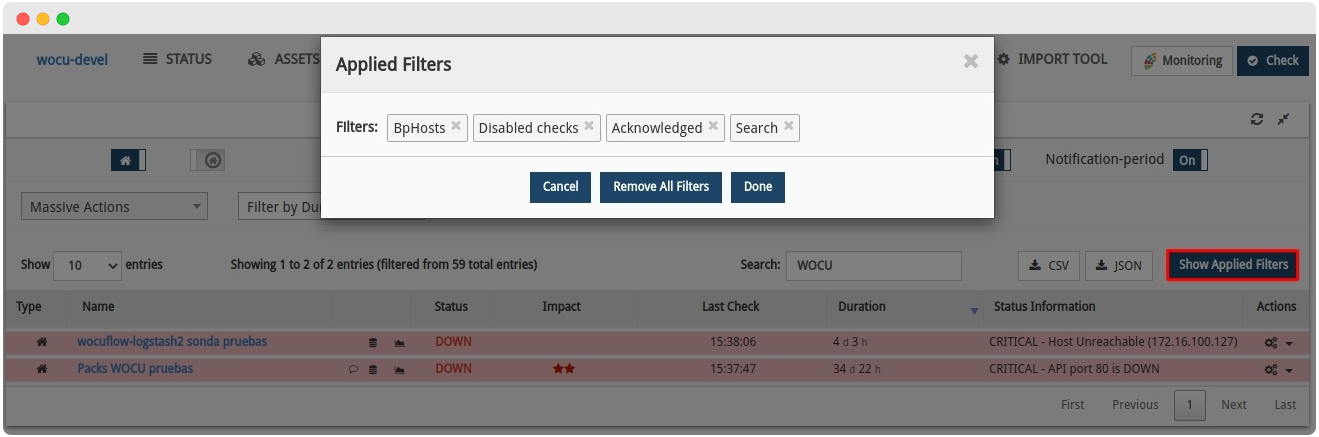
Possible actions are:
✓ Delete filters individually: by clicking on the
Xof each label. The change will be reflected by confirming the action with the Done button. On the other hand, to decline the action so that it is not carried out, click on the Cancel button.✓ Remove all filters applied simultaneously: via the Remove All Filters button.
Due to the powerful monitoring capabilities of thousands of applications in WOCU, it is our priority to optimise and simplify filtered navigation in inventories that collect large volumes of data, both to mitigate the negative effect caused by information overload and to increase the user experience for our users.
Note
For more information, please visit
8. Automatic elimination of orphaned Service Business Processes
The registration and deregistration of applications is part of the daily operations of an operator in WOCU. Any monitoring plant is a dynamic and flexible environment that accepts and excludes devices, based on new technical and functional needs that may arise in the organization.
A task as simple as removing a Host from the monitored infrastructure can cause errors when reloading the global configuration. Therefore, starting with this release, when removing a given Host from the WOCU configuration, all Service Business Processes associated with that Host shall also be automatically deleted without the need for operator interaction
With this automation and synchronisation of inventories, it prevents this type of action from leading to or causing new incidents that could hinder the operator’s agile, optimal and efficient workflow.
9. Export of metrics from WOCU Aggregator.
One of the main components of WOCU is its monitoring console called Aggregator, because it is able to aggregate information obtained from several independent monitoring engines. It is developed with Django, a web framework written in Python.
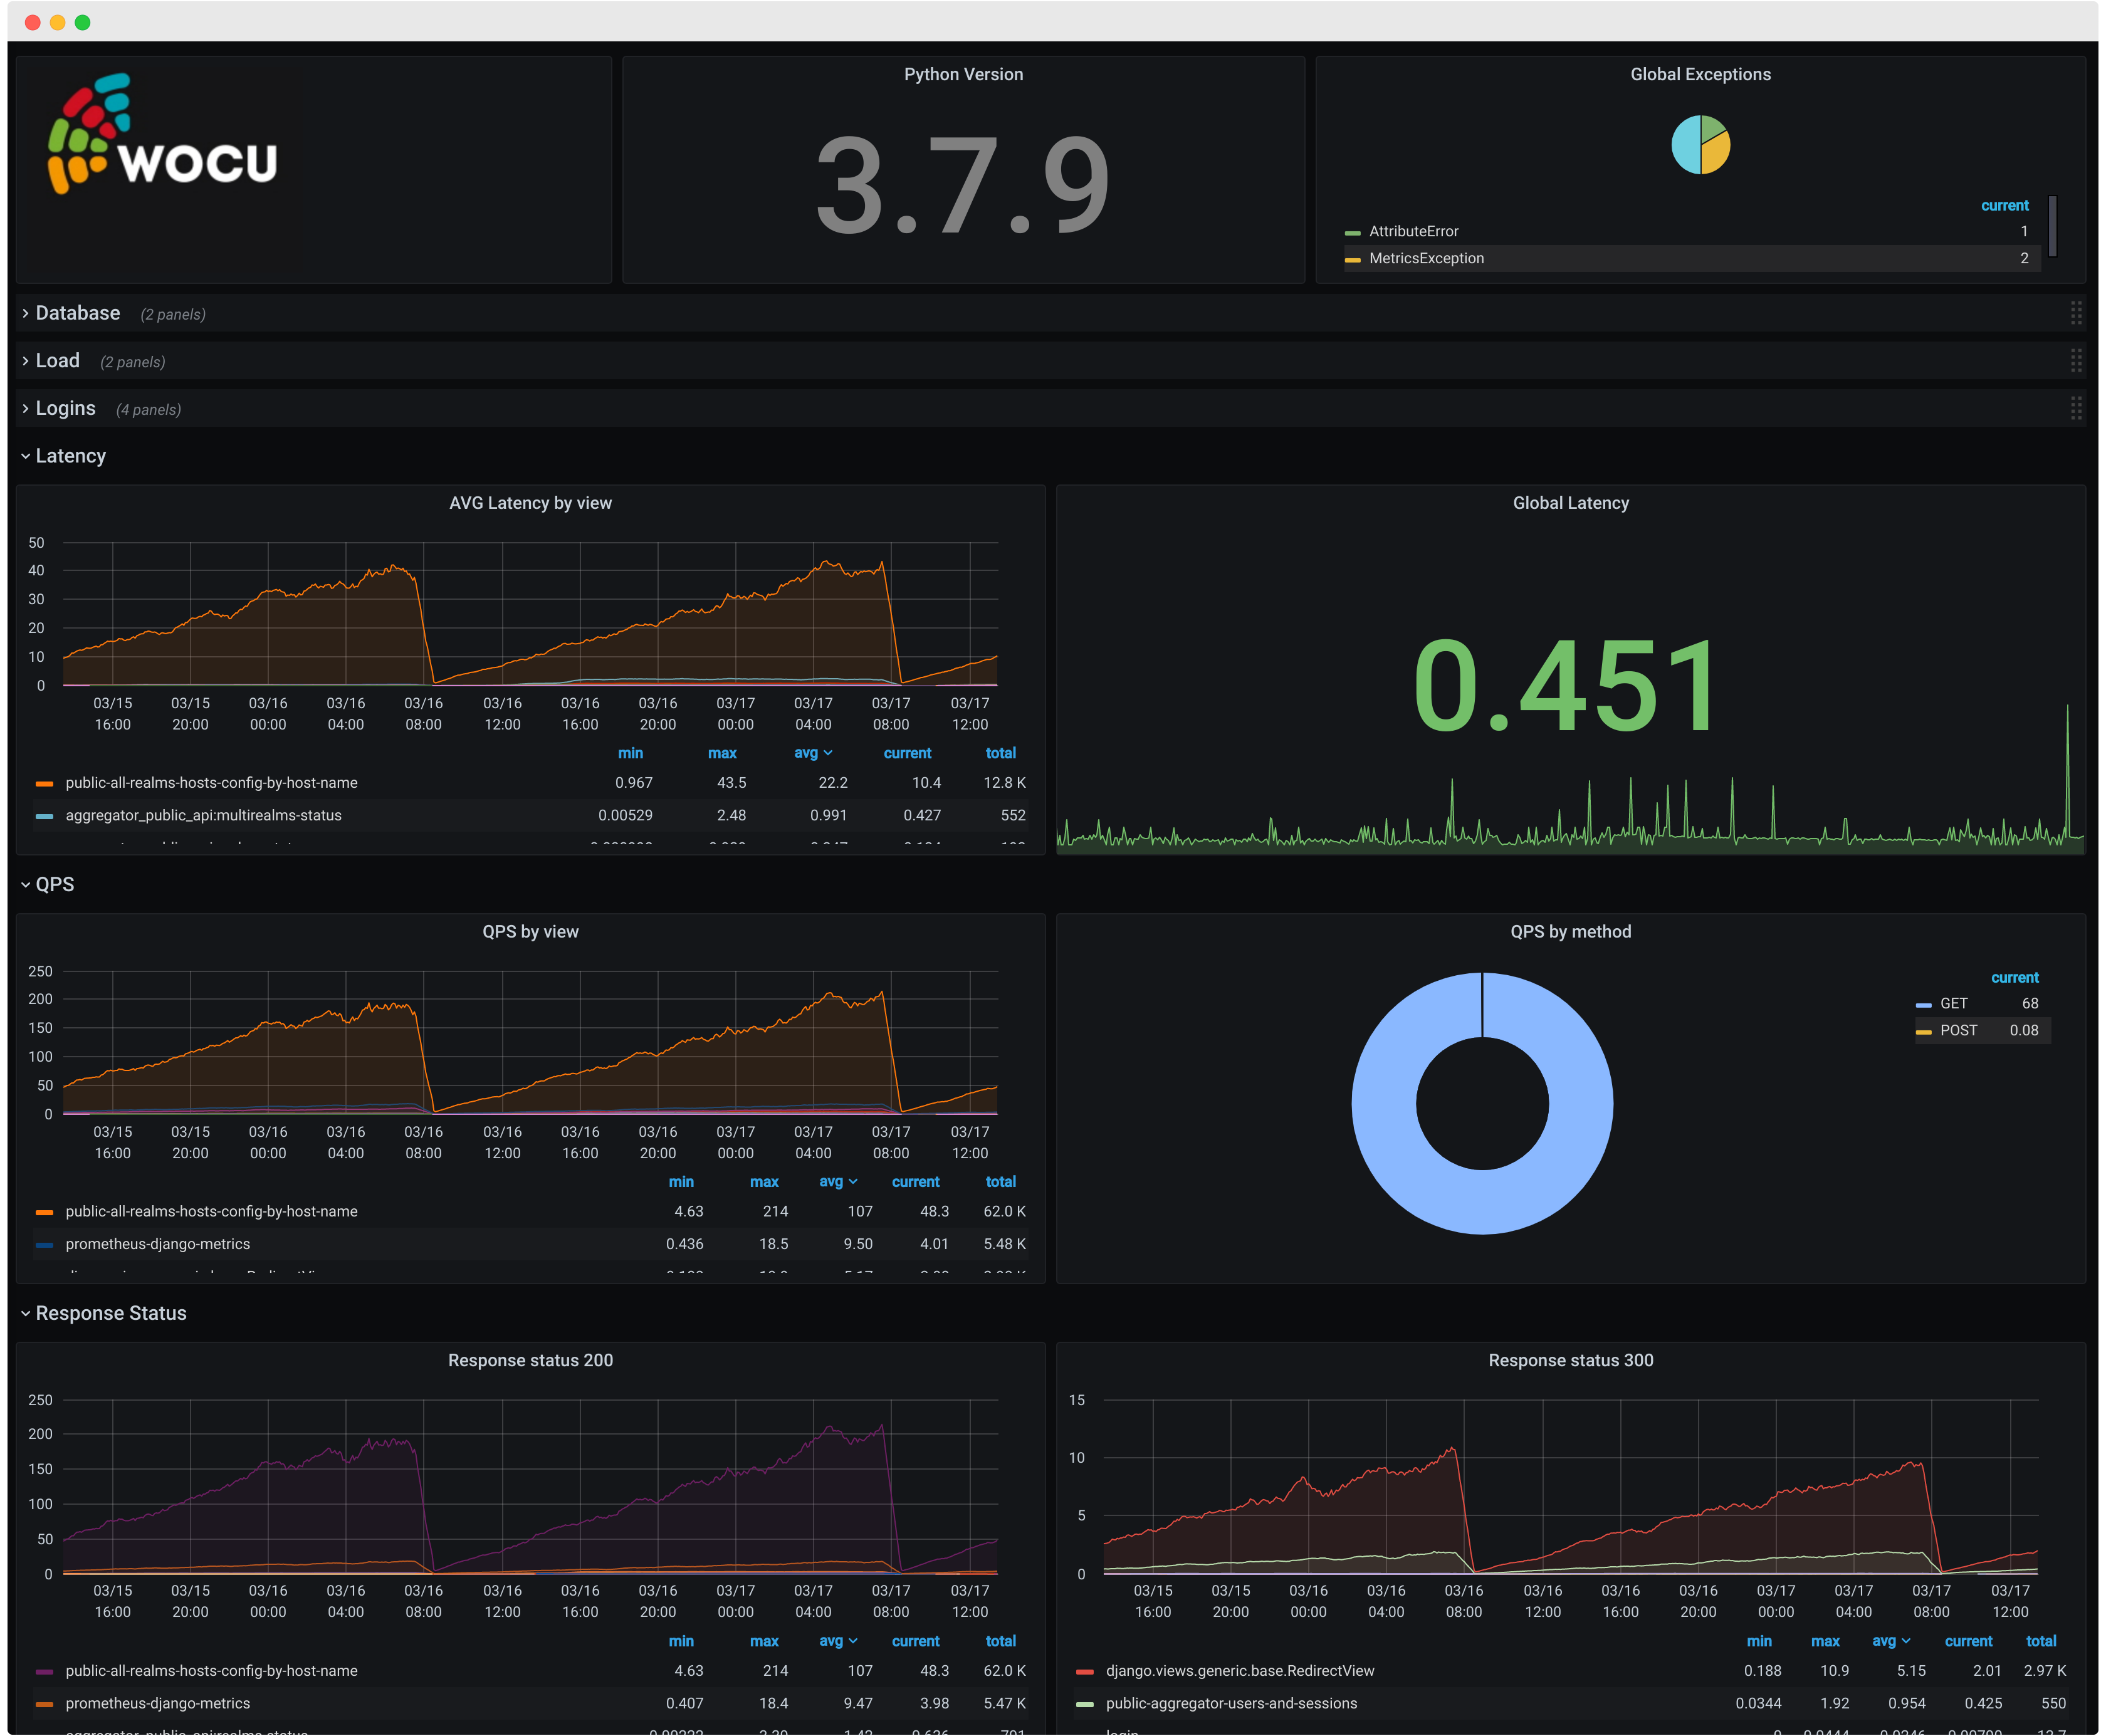
In this new version, the possibility of “instrumenting” the WOCU Aggregator software has been added, i.e. obtaining monitoring metrics on certain operations such as requests and responses, database access and its internal cache. Prometheus is used for such instrumentation.
Since WOCU is capable of serving hundreds of users concurrently and managing thousands of monitoring Realms simultaneously, it is vital to be able to monitor the performance of the software, evaluating certain metrics that help in optimisation and early detection of bottlenecks or failures in the system.
Our customers can decide whether they want to send these metrics to our Centre for Digital Surveillance (CSVD) to help us improve the user experience using WOCU on the one hand, and to proactively monitor their monitoring infrastructure and significantly assist in the resolution of any reported problems in our support systems on the other hand.
10. Support for notifications using authenticated SMTP servers.
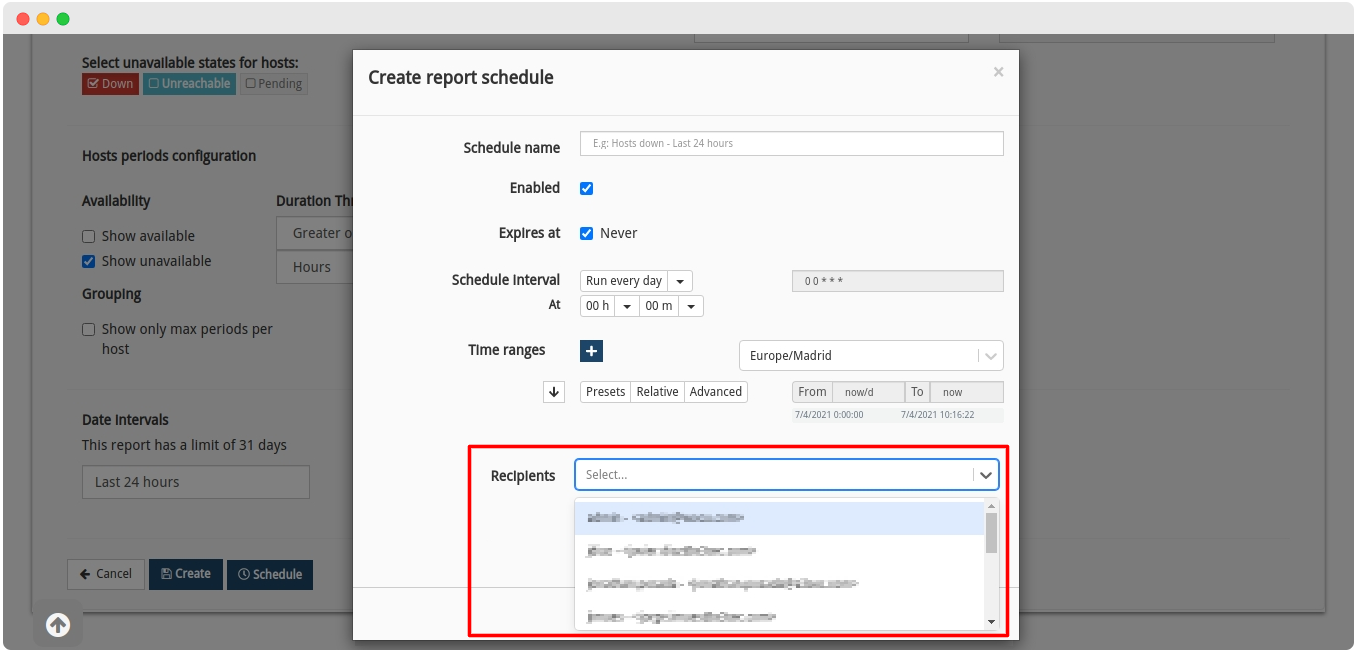
This latest version includes support in the Reports module, for sending email notifications using authenticated SMTP (Simple Mail Transfer Protocol) servers. This implies that all e-mail will be transacted in accordance with the strict regulations of this protocol, ensuring that only authorised users can receive and send e-mails.
This functionality also includes support for TLS (Transport Layer Security) connections as an encryption protocol.
11. Optimisation of the loading times of the Realm page.
The Realm page has been optimised to load much faster, mainly by eliminating redundant backend requests. Pre-loading of style resources has also been carried out to lighten the browser load
Slow loading has a negative impact on the user experience. These internal changes are intended to mitigate slow loading times and provide a smooth experience without unnecessary interruptions.
12. Migration of several widgets to REACT technology
The non-visible part of several widgets has been simplified by migrating them to REACT technology. These are:
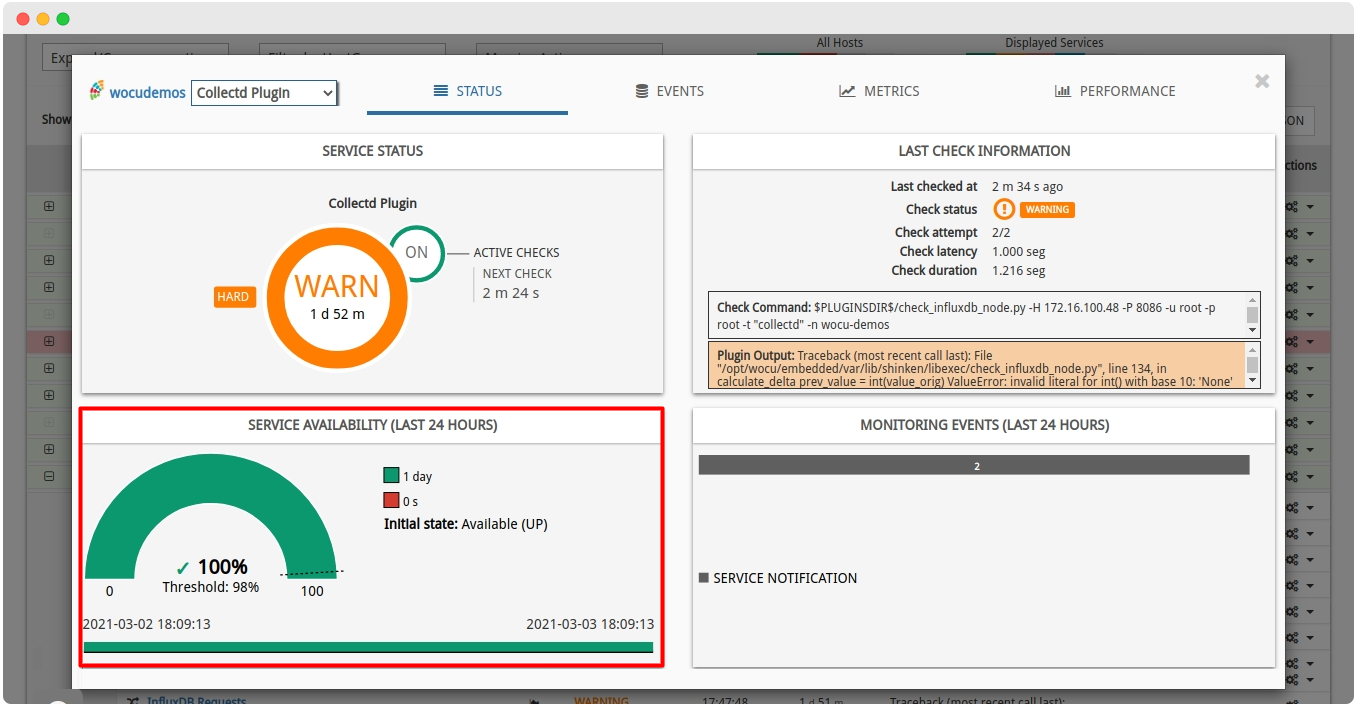
✓ Panel Service Availability (Last 24 hours) of the Services-Modal
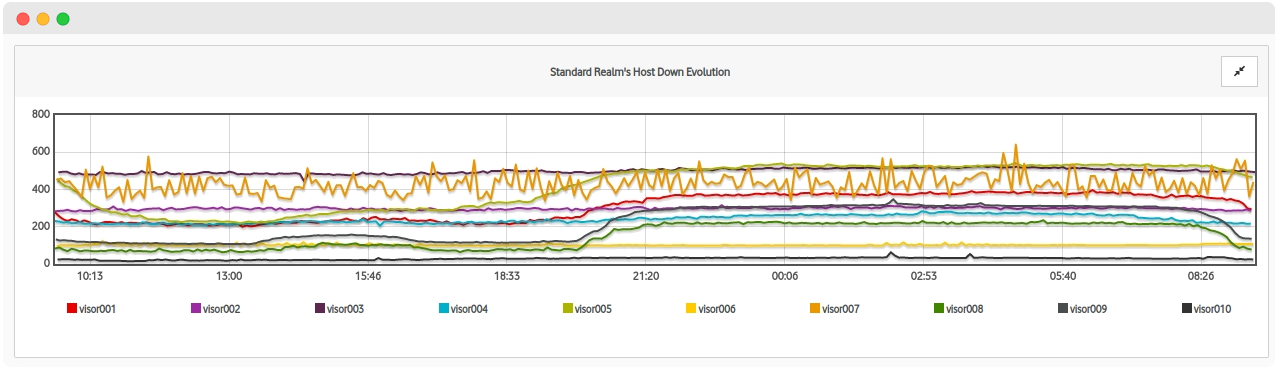
✓ Chart of evolution of most problematic standard realms from Home
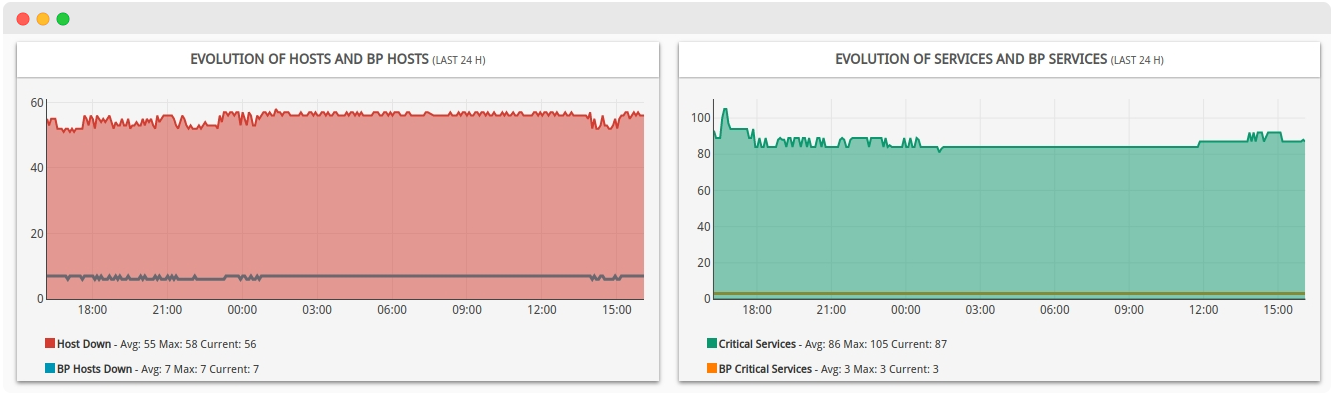
✓ Hosts and Hosts Business Processes evolution panel and Services and Services Business Processes evolution panel of the Status view of a Realm.
These changes will result in better data visualisation, improved maintainability and responsive visualisation. A homogenisation of styles has also been carried out, as a correction of minor variations in appearance.
Other improvements and fixes
Every new version of WOCU is full of small changes, fixes and optimisations that should be briefly highlighted. We list the most notable ones in this version:
It may happen that the data displayed in the Availability by State Dossier of the Availability Reports, exceeds the available space. In this case, an ellipsis (…) has been included to indicate that the text continues, but has been cut off, and the full text can be consulted by placing the cursor over it. This change corrects an error in the distribution of the panel elements
Inclusion of the informative filtering functionality Showing XX Entries in tables and inventories that did not contain it a priori or that were hidden in their migration to REACT
The code for handling
APIrequests has been improved and is now easier to handle. In general terms, several duplicate or similar functions have been unified for the elimination of duplicate code.In the edition of Complex Macros of type
IntegerandFloat, only digits (positive and negative) shall be allowed to avoid validation problems.Improvements to Hosts Groups migrations by preventing active (monitored) Hosts Groups pointing to Hosts located in the Pending listing.
Aggregator
.jsfiles whose code is no longer useful or redundant have been removed, largely due to refactorings of a multitude of elements and blocks in the module. With this expurgation, the software is optimised in the long term and maintenance costs that may arise are avoided.After detecting certain global variables containing different
URLslinked in the aggregation page, all these have been grouped together in the following address:AggregatorUrls.Fixed a validation error located in the Metrics field of the Metrics Evolution Reports creation and configuration form.
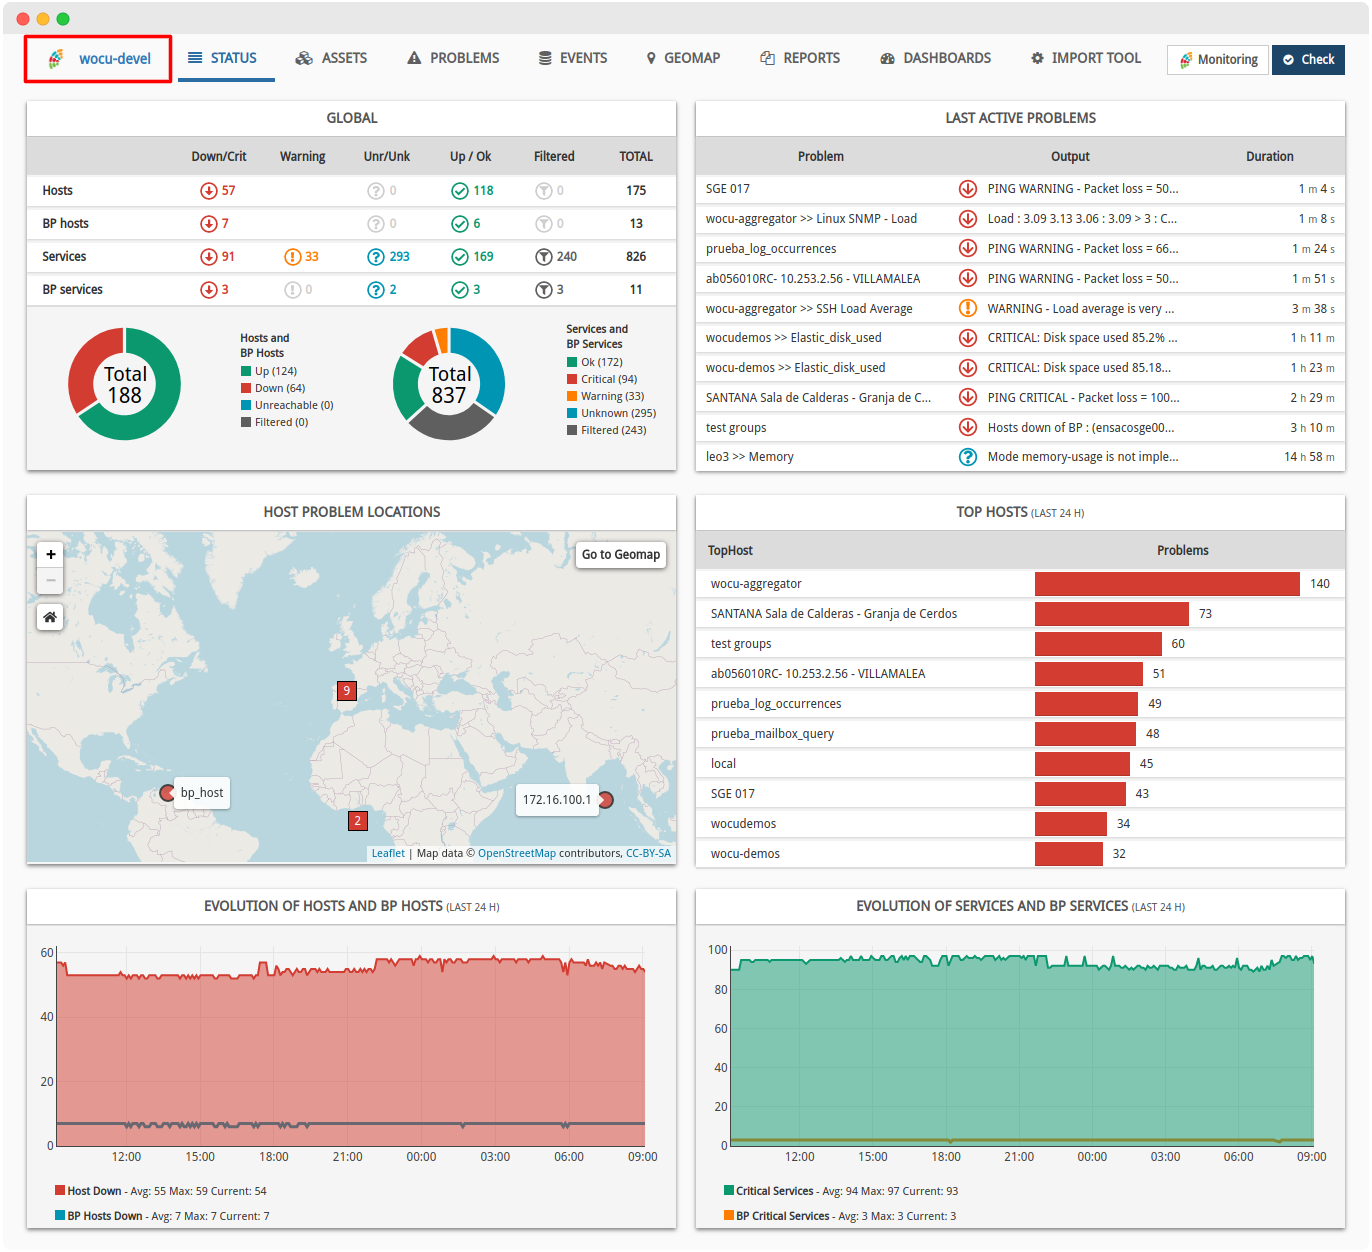
Hereafter, when there is no data to display or an error has occurred in the Last Active Problems and Top Hosts (Last 24 Hours) of the Status view, an informative text will be displayed specifying what happened. These messages will be accompanied by a faded background table or chart, keeping the same display style as the other widgets in the view
In the configuration of
Import-toolsassociated with Realms, it is now possible to reference suchImport-toolsby name (FQDN) in addition to IP address.Previously, when the Hosts by host Availability of Availability Reports did not present any data, a continuous error was generated and visible in the browser console. This situation has been corrected, maintaining the correct functioning of the panel.
Display errors have been fixed in various tables of the application, which hindered the reading of data.
The
CSSfiles in the Maps section have been cleaned up, removing duplicate or obsolete code largely due to the migration to REACT.The button to show or hide the different search filters in the Report Management and Report Template Management views, will become hidden when any other activity than managing and locating list items is performed, for example, in the creation or editing of Reports or Templates.
Fixed a bug in the selection of entries in the Active Assets Hosts table, where clicking on any available action of a given Host would also select the row.
It is allowed by configuration to disable the graphical interface of the old
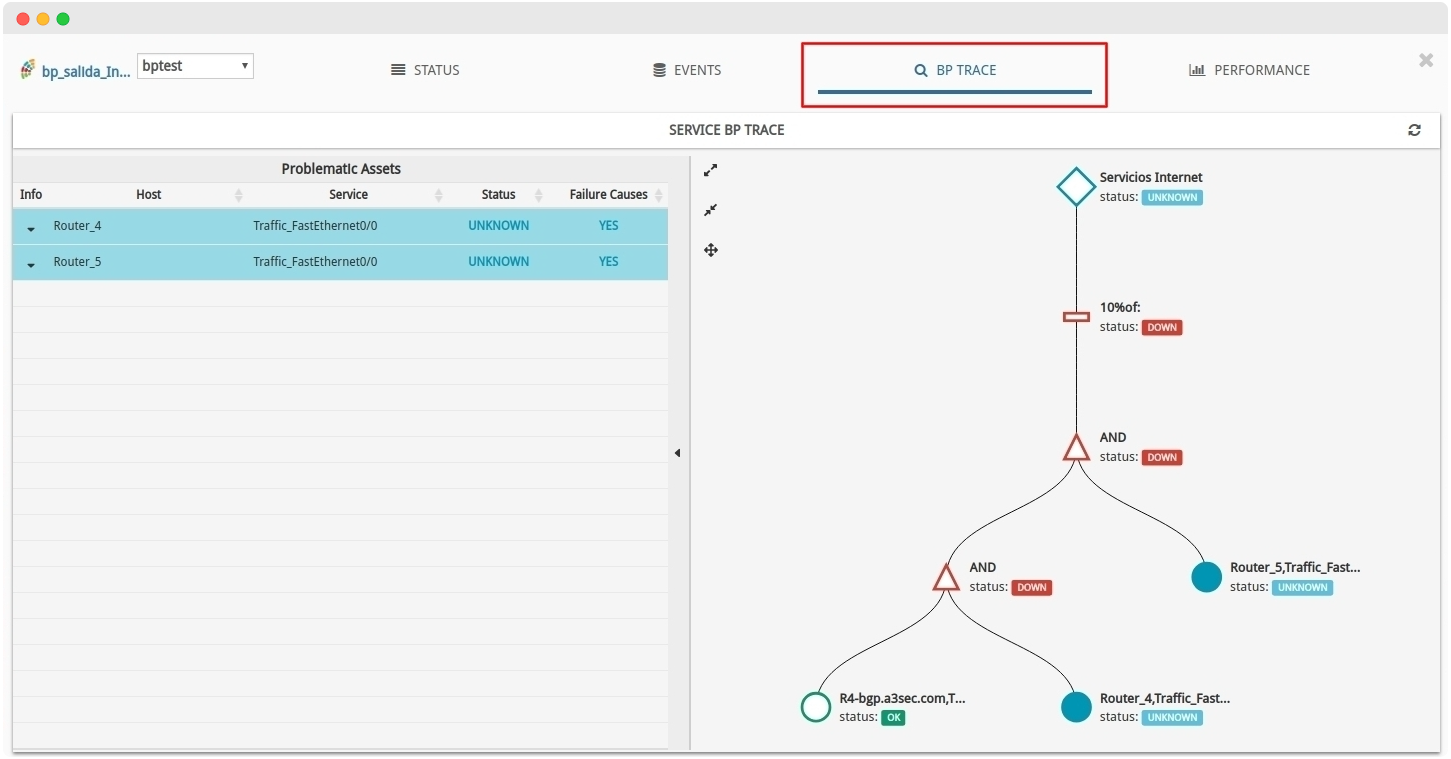
Import-Toolbecause the integration in theAggregatoris more than sufficient. By default, this option is disabled, but may be changed in future versions. This change does not affect either the administration interface or the API.Fixed a malfunction of sorting icons in the Problematic Assets table in the BP Trace section
In reduced views, the GO button in the Logs section of the Event tab was out of position. This display bug has been fixed by fixing its position independently of the view dimension. In addition, the layout of the different inputs in this section has been updated.
Fixed a bug in the operation of the Section selector of the Host Inventory Reports creation and configuration form. It has also been solved in the design of Templates of this same report typology.
The bug detected in the
PDF,JSONandHTMLexport of (Un)availability periods reports has been fixed. This function is now operational again in the already generated own-report and in the actions of the Centralized Report ManagementThe Search component (search bar) has been unified to a generic and homogeneous style in the following views:
Scheduling de Informes.
Upgraded software
Numerous pieces of software integrated into WOCU have been incorporated and updated:
Software |
Previous version |
Current version |
Remarks |
|---|---|---|---|
Nagios Plugins |
2.2.1 |
2.3.3 |
|
django-password-policies-iplweb |
0.8.0 |
0.8.2 |
|
cypress |
6.1.0 |
6.8.0 |
|
plotly.js |
1.49.0 |
1.58.4 |
|
react-plotly.js |
2.3.0 |
2.5.1 |
https://github.com/plotly/react-plotly.js/releases/tag/2.5.1 |
react-addons-update |
15.6.2 |
15.6.3 |
Part of React package, updated to remove vulnerabilities |
node-fetch |
|
2.6.1 |
https://github.com/node-fetch/node-fetch/blob/master/docs/CHANGELOG.md#v261 |
Monitoring packs
See our catalogue of WOCU Monitoring Packs in the following link.
Skype-for-business
A new pack has been created to monitor Skype for Business machines. The pack uses the Nagios NRPE protocol to run the checks on the machines, so it is necessary to install the NSCLIENT agent on the servers to be monitored.
The services included in the package are the following:
CPU: Monitor CPU usage
MEM: Monitor memory usage
Drivesize: Monitors disk usage
Service: Monitors the status of the processes on the server
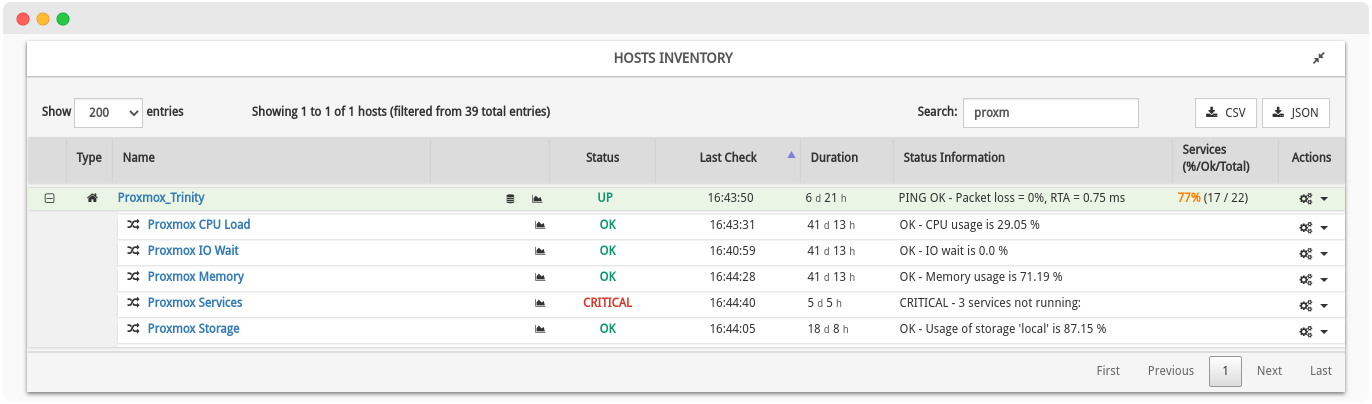
Proxmox
A new pack for monitoring open source virtualisation platforms Proxmox has been created.
The services included in the package are the following:
guilabel:CPU Load: Monitor CPU usage.
IO Wait: Monitors the I/O timeout.
Memory: Monitors memory usage.
Services: Monitor critical services.
Storage: Monitor storage space usage.
New monitoring packs for WOCU Flow.
WOCU is developing a specific module for netflow monitoring, which will be released over the next year. This module will be able to capture Netflow (versions 5, 9, ipfix) and Sflow data streams, store them and display them in the WOCU interface.
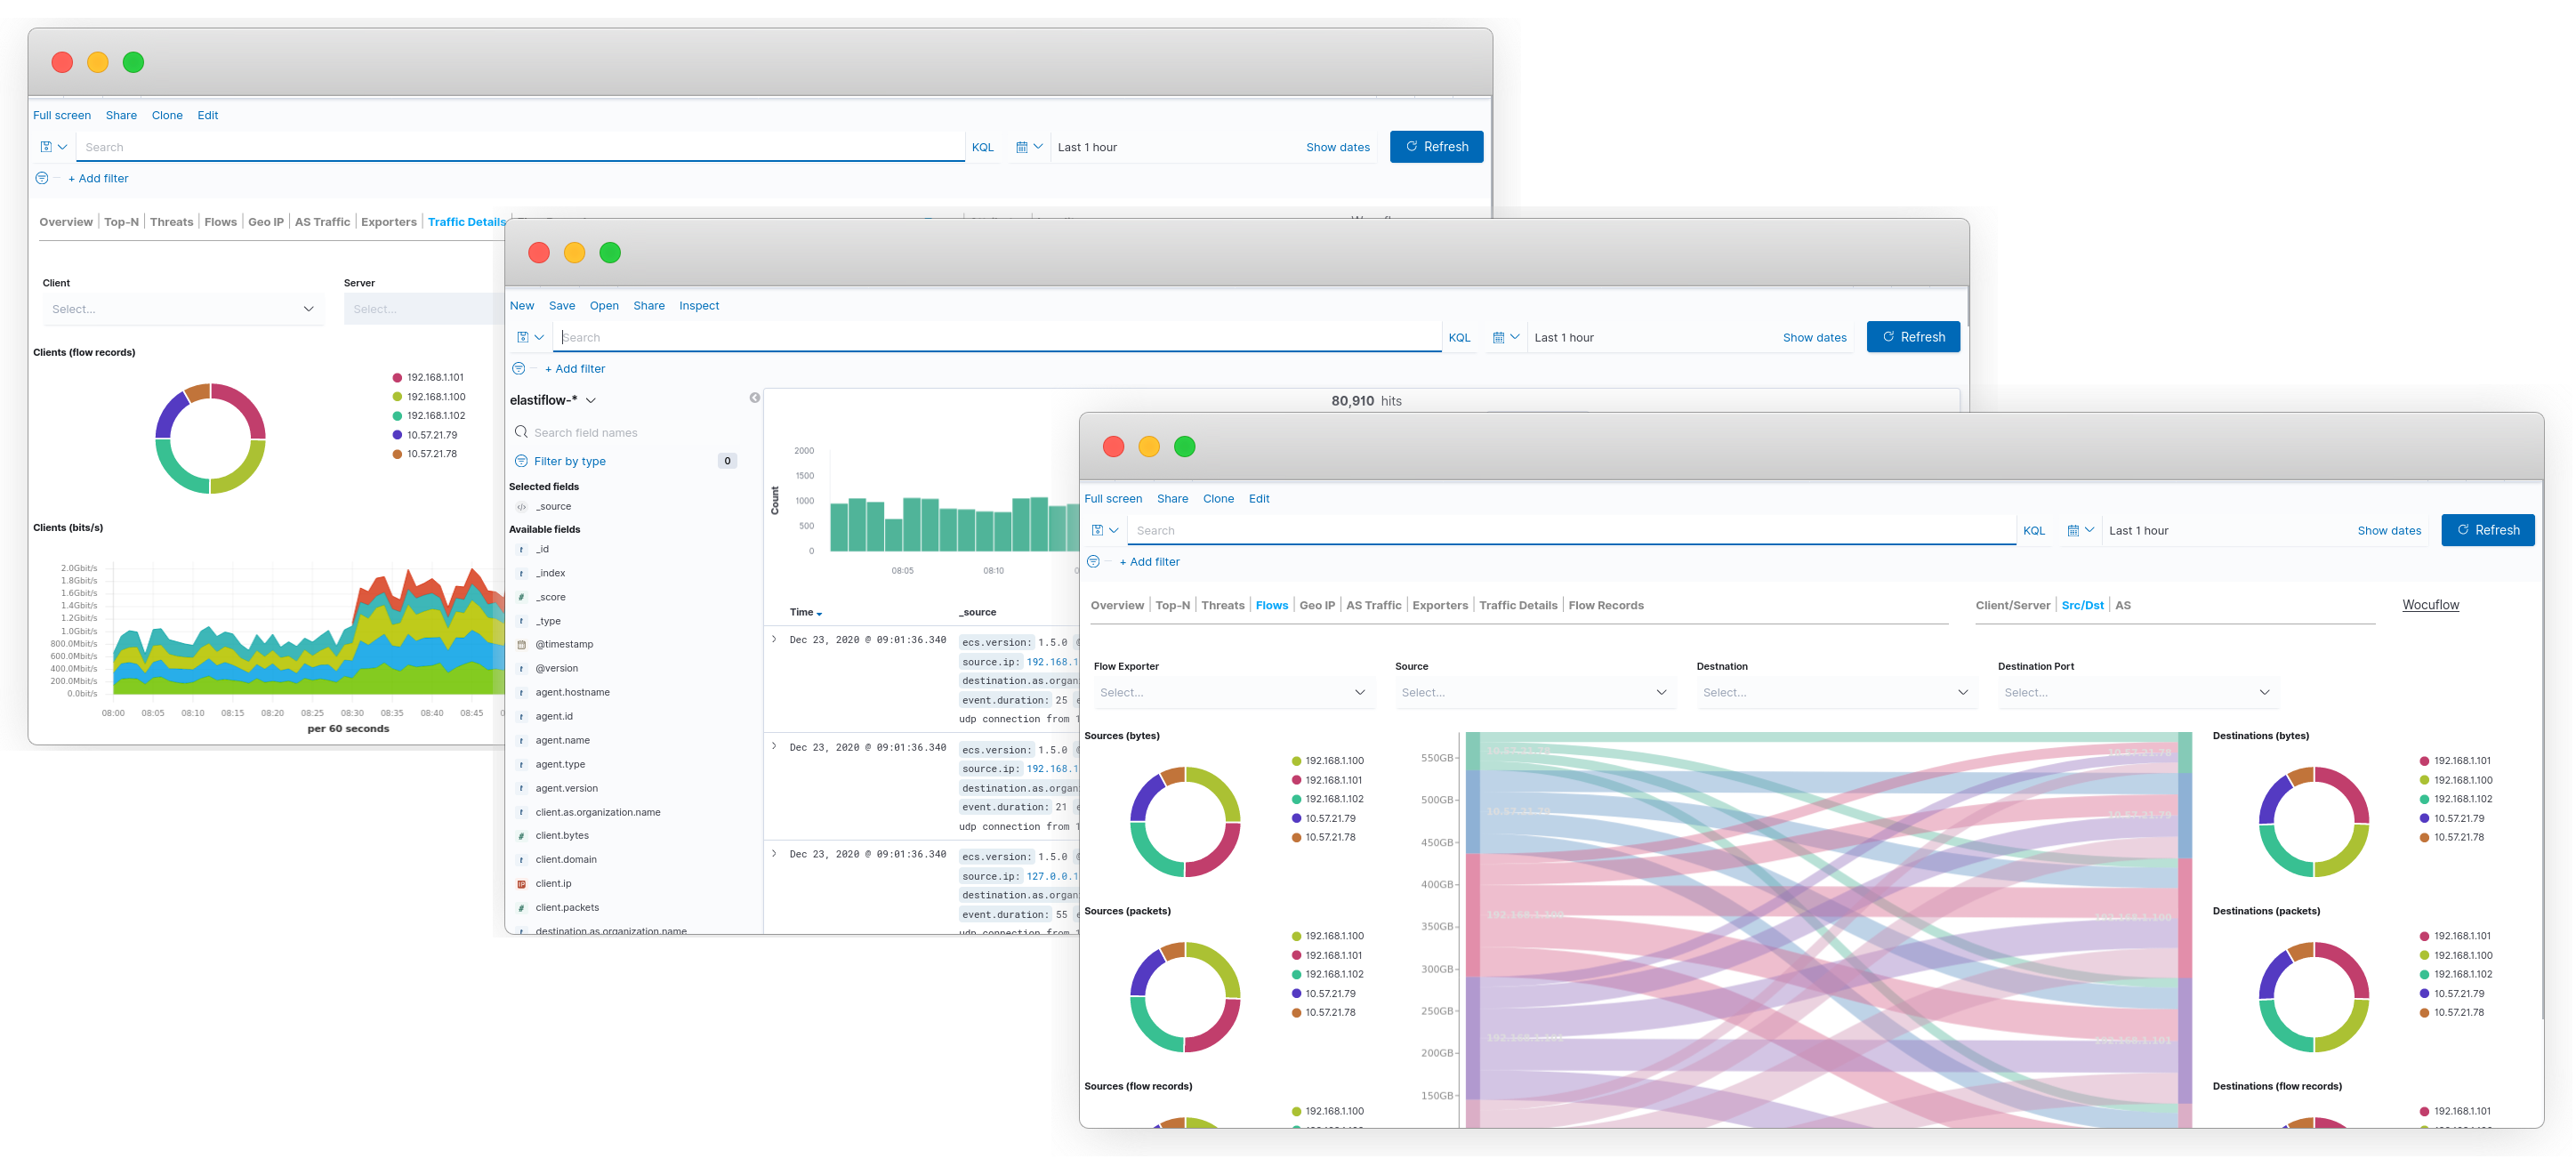
In this release, a set of packs have been created to monitor some of the services associated with WOCU Flow. The packs use the API of each service to extract different performance and operational metrics.
The packs developed are as follows:
Note
These monitoring packs can be used by any user as they are not specific to WOCU Flow.
About WOCU-Monitoring
WOCU-Monitoring is a monitoring tool that integrates the latest Open Source technologies for monitoring, visualisation, metrics graphing and log management, providing a wide visibility on the status and availability of network elements, servers, databases and workstations (among others) using customised Monitoring Packs.
In addition, the Enterprise version of WOCU-Monitoring called Enterprise allows deployments of thousands of IP devices, in a distributed environment, with customisations tailored to each customer’s infrastructure.