Release Notes 49
Publication Date: 01/02/2022
This document deals with the new features, functionalities, improvements and corrections integrated in version 49 of WOCU-Monitoring, responding to the requests and suggestions of our users and the current market needs.
Following in the wake of the previous release, a new page has been added to the Host Groups modal, with a complete list of the group’s member assets, where, in addition to their anatomy, many other particularities are explained.
Similarly, the recent Diagnostic Tool adds UDP (User Datagram Protocol) support to the Port Scan process, enhancing its scope.
Design and usability are allied concepts that prevail in every area of the solution, therefore, new filtering options have been added for:
Geolocated assets by Monitoring Packs
Services by type of Availability Status
Nested objects in the event_viewer.
In addition, the system will also remark the filters applied so that you can see at a glance by which criteria the page is being restricted.
Work has also been done on the design of a new Import Task with a different approach to the existing ones, i.e. to speed up mass asset deletion processes through the reading of a file in CSV format.
Other non-visible internal changes include the development of an endpoint for insertion of asset inventory, the continued expansion of the Monitoring Packs Catalogue and the new capability to trace actions executed in the tool for subsequent audits, among others.
All these changes are aimed at improving the performance, stability and security required to drive the processes and services of the monitored infrastructure. The following is a more detailed list of the latest developments in WOCU-Monitoring.
1. UDP Port Scan in Diagnostic Tool
Last version 48 we introduced the new Network Health Diagnostic Tool, for in-depth analysis of the current functional and operational status of a network Host.
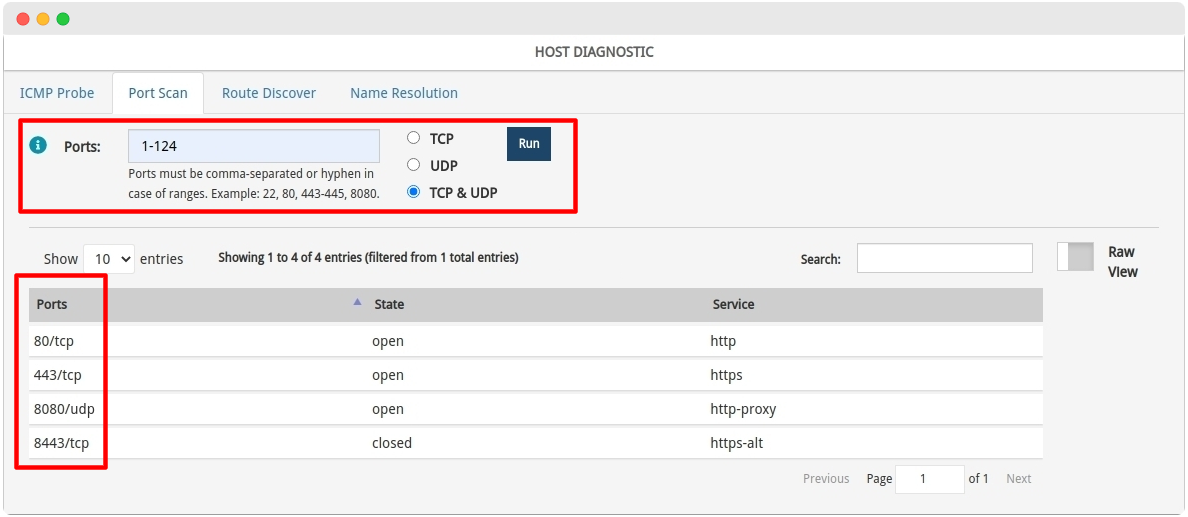
Since then, we have focused on further enhancing and extending its scope. That is why the Port Scan thread now includes UDP (User Datagram Protocol) support for port scanning and mapping, in order to locate externally exposed services, PING sweeps, operating system detection, etc.
The user has the ability to select which protocol to run, the options being possible:
TCP (Transmission Control Protocol): option ticked by default.
UDP (User Datagram Protocol): includes a 100 port limit. Higher requests will be declined.
TCP & UDP: combination of both protocols to optimally exploit each other’s strengths in data transmission.
The output shall show the status of all ports, not only TCP but also those registered via UDP.
2. New field Min Business Impact in the notification settings
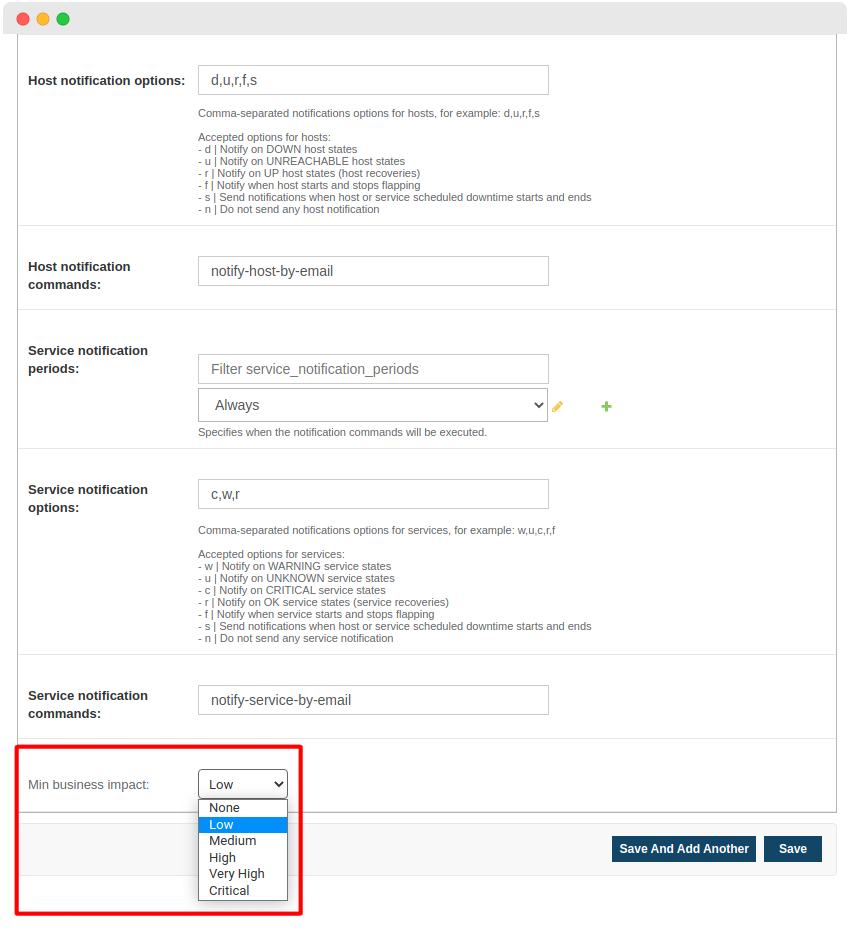
In this version, a new field has been introduced during the Notification Settings, specifically in the Notification Ways section, called Min Business Impact (Min Business Impact). This parameter allows defining the minimum value of the Business Impact that the Hosts must have associated to generate notifications to be sent to the operator.
This new configuration will help to screen the notifications issued, allowing the focus to be placed on those from Hosts that have a greater impact or significance on the monitored technological infrastructure.
3. Action traces (logging) for audits
This version adds the possibility to trace (log) all actions executed within the WOCU-Monitoring interface with the intention of logging, roughly speaking, the following information:
Action taken by the user
Which user performs this action
From which browser and IP address
On which monitoring realm
To give some examples, we are interested in recording actions such as:
Access (login) at the interface
Add or remove a Host
Create or launch Import Tasks (Tasks)
Create or run Reports
A complete trace contains detailed object information about the action executed or changes tracked by the system. Serving data such as:
The request made: HTTP method (GET, POST, etc.), endpoint of the API used and browser
The response obtained: HTTP code (e.g. 200 OK) and headers
User making the request
Details of the entity in respect of which the action is being taken
These events are collected by reading from the log file using the Events ingest collector of WOCU-Monitoring and sent to the Logs backend so that the processed information can be audited later.
We can illustrate this new functionality with the following example:
Any action performed on the host
wocu-demos-docis thoroughly logged to enable a later audit of it.
The following is the event received as evidence of the removal of the host
wocu-demos-doc: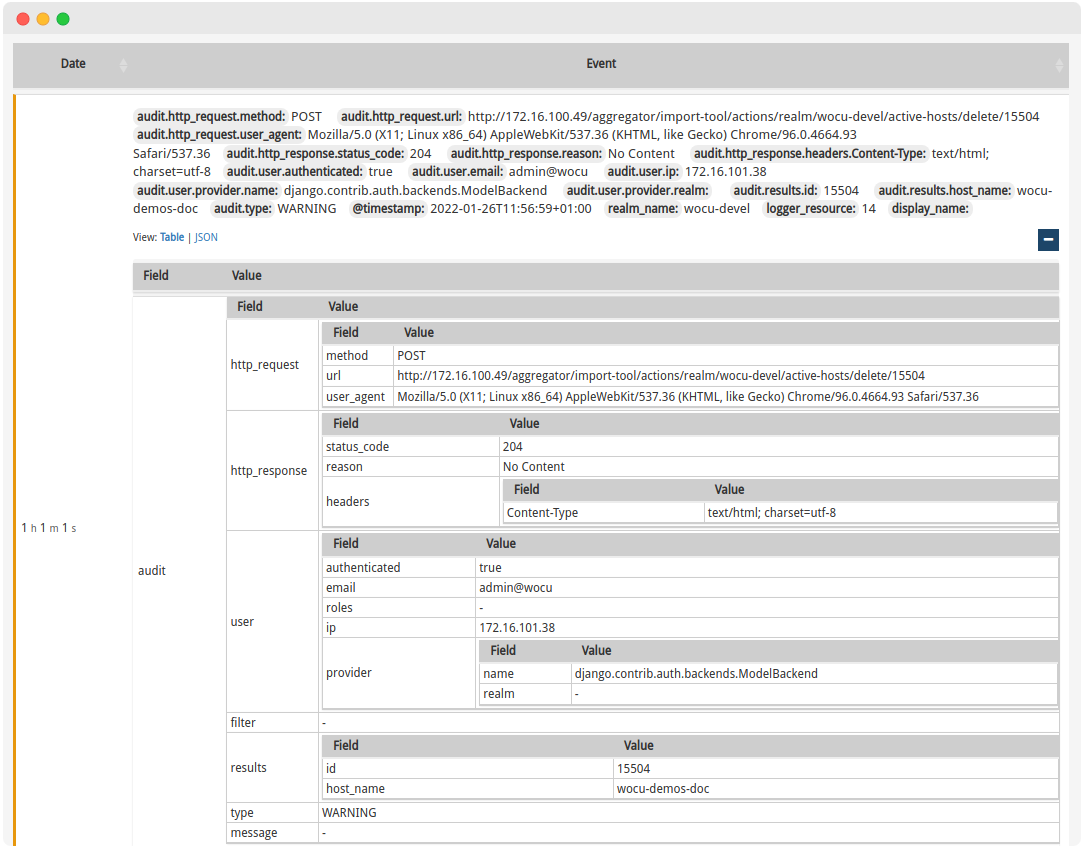
In this way it is possible to trace and recover at any time the perpetrator of the action and the deleted object together with all the information it contained.
4. Support for applying filters on nested objects in the Event viewer.
In this new version, and taking advantage of the addition of Events auditing, support for applying filters on nested objects has been added.
When an event has nested objects it is now possible to filter by all the keys that make up those objects. Let’s illustrate this functionality with an example; given the following event:
{
  "event": {
    "message": "WOCU-Monitoring",
    "request": {
      "method": "GET",
      "url": "https://wocu-monitoring.com"
    }
  }
}
You will now be able to filter by the following keys:
event.messageevent.request.methodevent.request.url
The following is an example that exploits this virtue by filtering by the keys audit.http_request.url, audit.http_request.user_agent and audit.user.ip in the audit events described in the previous functionality.
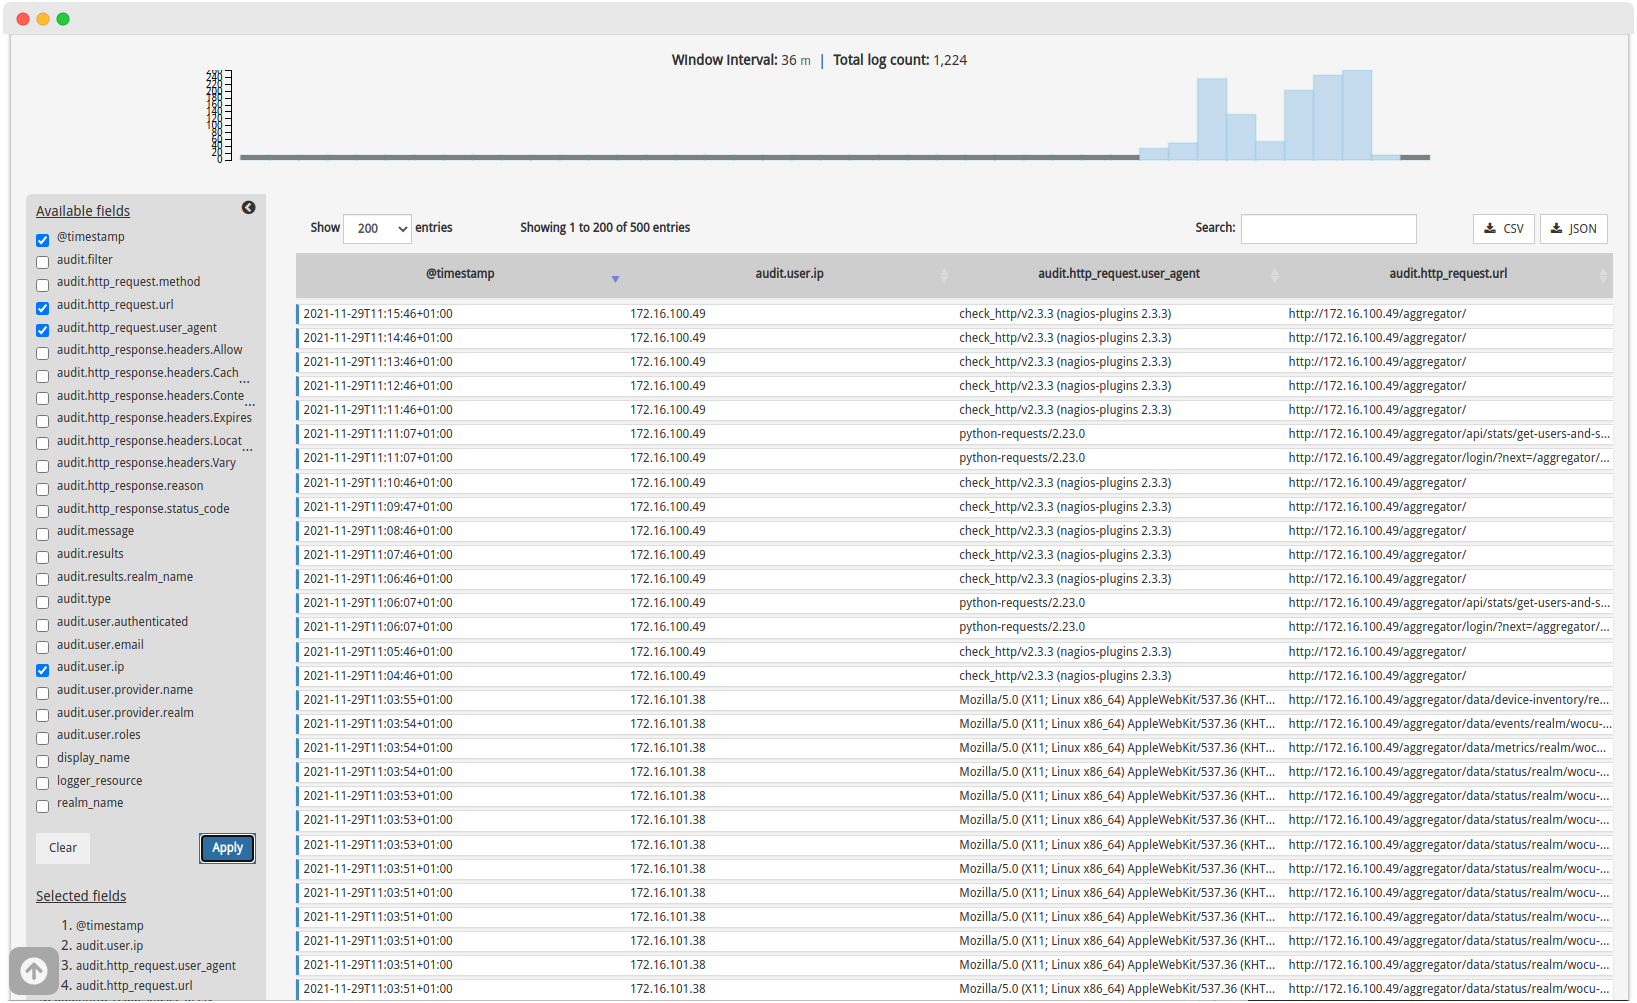
Finally, the readability of events has been considerably optimised by transforming the display of logs in raw JSON format into a flat display grouped by key-value pairs.

Event in JSON format

Event in flat format
5. Different refactorings of the frontend.
✓ The database of identifying icons of technologies associated with Monitoring Packs, has been updated with the addition of new icons
Alien Vault
Amazon Web Service
Google Cloud
Nginx
ProxMox
Skype
Email (generic)
✓ Refactoring of the tables presented in the Import Tasks (Tasks) section to REACT 7 technology. This change will result in better readability of data, control and debugging of loading times, improved maintainability and responsive visualisation.
✓ The following filtering options have been removed from Hosts Inventory:
Drop-down to expand/collapse Services linked to a Host.
Filtering of Services by registered availability status.
With the existence of the Services Inventory where the management of the Monitoring Services of a Realm is centralised, these filters were no longer necessary.
6. Highlighting of applied search filters
During the network monitoring process, WOCU-Monitoring manages a large amount of asset data useful for defining statuses, detecting incidents, generating reports, etc. This results in highly informative views or inventories, which with the help of different filtering options make data localisation, reading and analysis more fluid and coherent.
Therefore, this version includes new styles to highlight and emphasise the search fields or filters that are being applied and to be able to see at a glance by which specific criteria the page is being restricted.
Never again will you not find an asset, Realm or any attribute by having a filter applied.
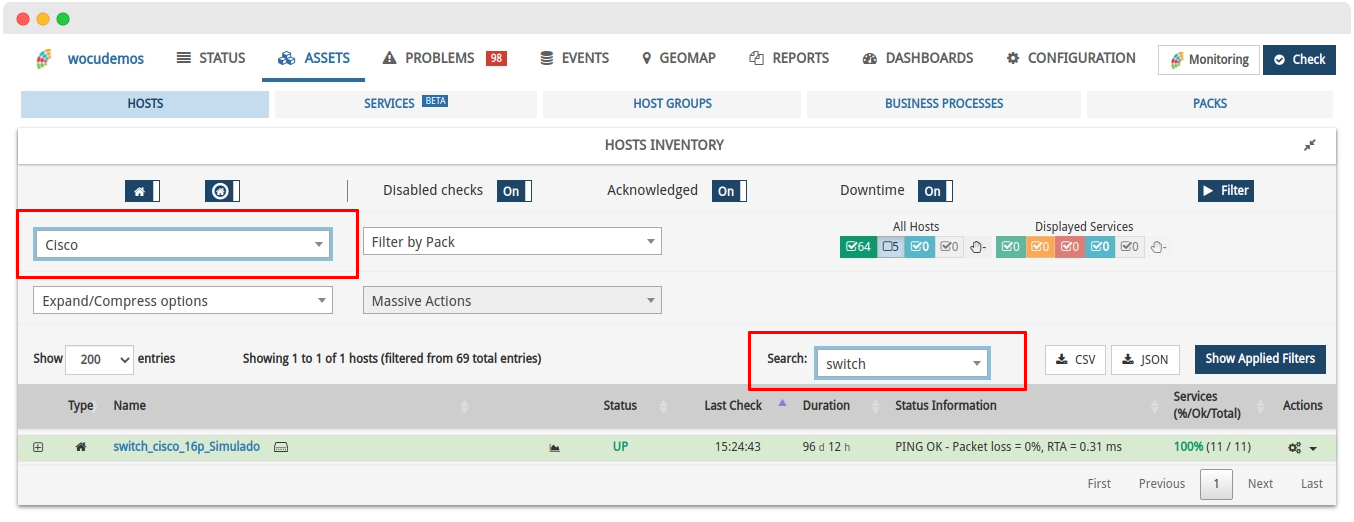
This new feature is implemented in:
Initial Aggregation View, specifically in the Filter-by-Realm-Type.
In the search bar of the views:
7. Centralised management of Contact Groups in a Realm
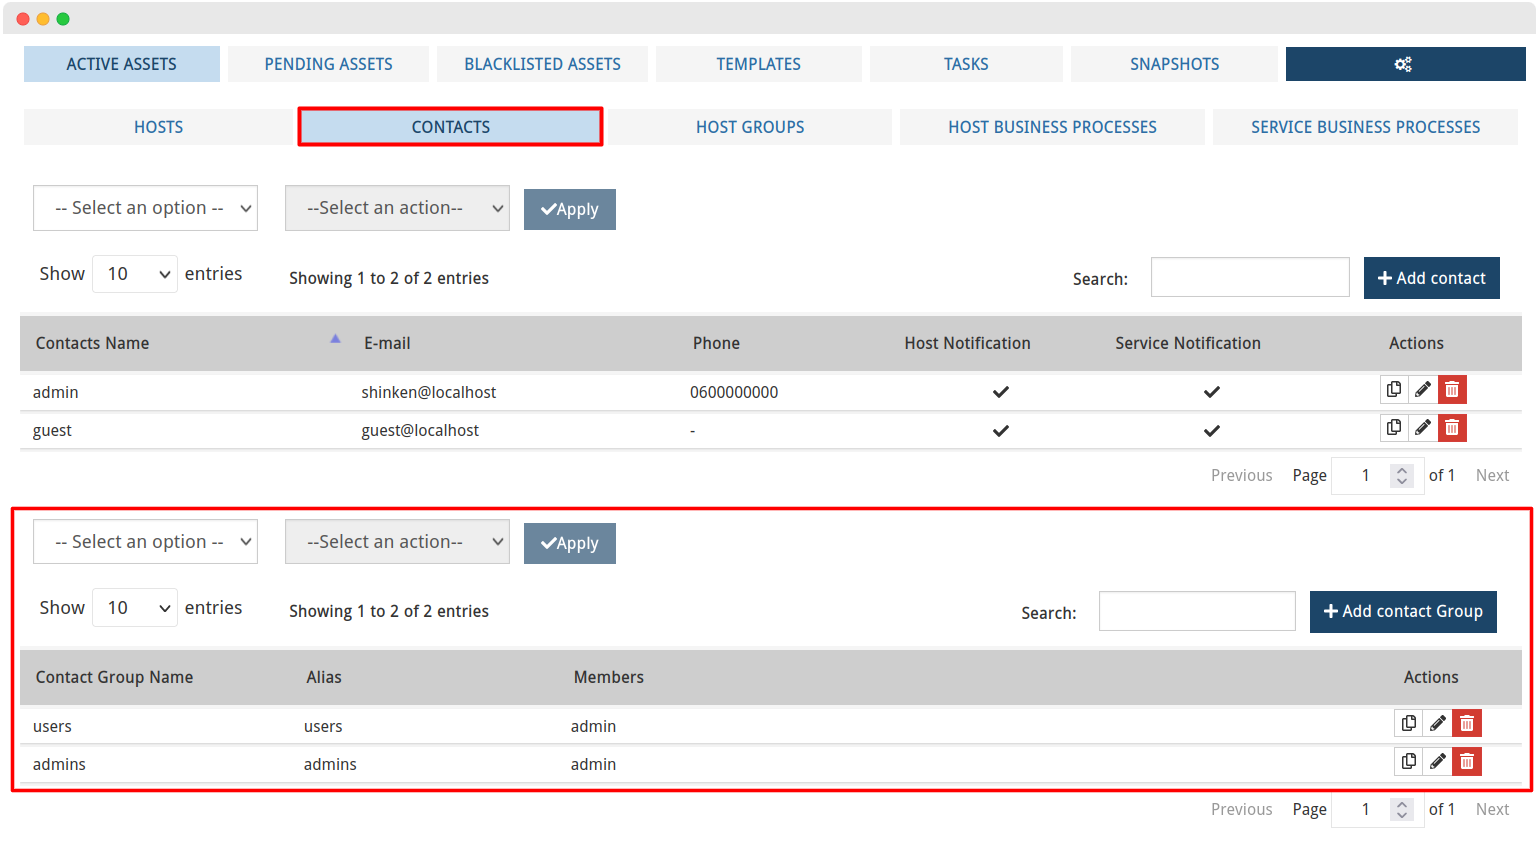
WOCU-Monitoring allows you to gather the contacts that receive notifications into groups, enabling you to easily and conveniently manage the sending of alerts to the users of the relevant department.
Previously, the administration of these groups had to be done from within the configuration application of the Realm in question.
In this version, contact management has been streamlined, allowing you to modify your groups from a single place. To do this, a new table has been added in the Contacts section with all the functionalities and actions necessary to carry out a complete management and administration of your contact groups.
Note
More information can be found at: List of Contact Groups.
8. New page of Hosts in a HostGroup.
The newly added Detailed view of a Host Group has been subject to changes in this latest version, in particular, the information has been redistributed into two new tabs:
STATUS: encapsulates all the panels, graphics and other components that the modal view has been displaying since its design and incorporation in the tool.
HOSTS: new space where the complete list of the elements that make up the main HostGroup (HostGroup) is included. Other complementary data is also provided for each member Host:
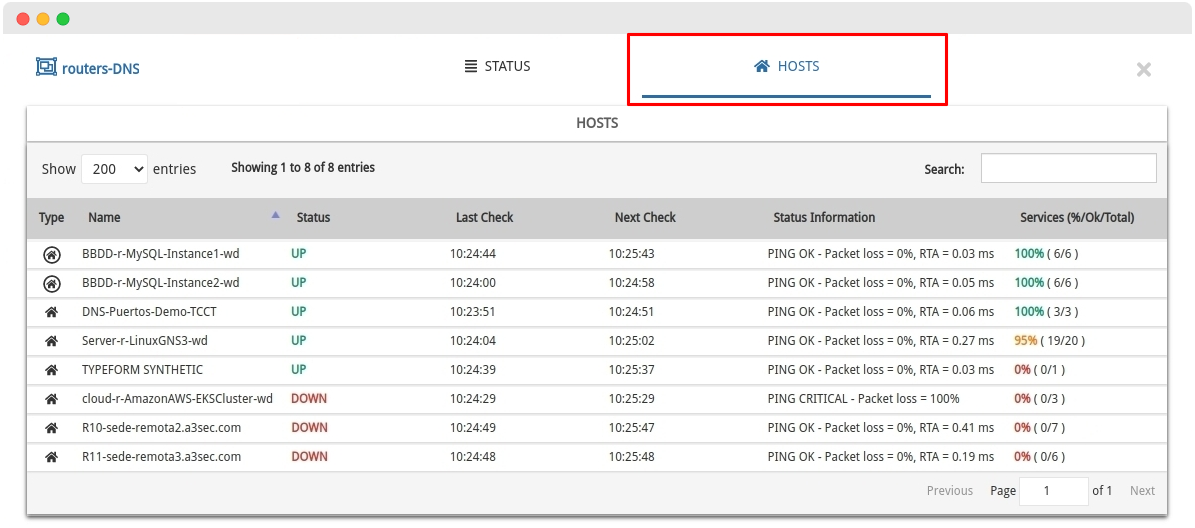
Ultimately, it is now possible to know the anatomy or other particularities of any Host Group registered in the system, without having to resort to other more complex configuration views.
9. Filtering by Monitoring Packs on asset geolocation
WOCU-Monitoring integrates a geolocation module to visualise monitored hosts in real time. Through geographic maps the operator can also know and control the operational status of the infrastructure.
This release adds to the various Geomap filtering options the ability to filter Hosts by type of Monitoring Pack assigned. By selecting a particular pack, the Geomap will be debugged and updated to show only the Hosts that make use of it and hide those that do not.

10. Filtering Services by State Type
One of the purposes of Services Inventory is to facilitate the search over all the monitoring services that are being implemented, being much more agile and comfortable the retrieval of a specific service from the whole group (e.g.: get only the CPU services).
In line with the above, a new function for the Filtering Assets by Status Type (Hosts Status and Services Status) has been included in this version. The user can interact with the table by discriminating or choosing services based on the operational status they are currently registering.

For ease of understanding, the boxes use colours already linked to the different status types. By default, all status boxes are checked, indicating that the inventory is showing all hosts and services, without hiding elements.

Finally, a new button has also been included for refreshing and updating the data displayed, giving a real-time view of the parameters recorded by each monitoring service. Clicking it will force an immediate refresh (without using the cache), independently of the one programmed in the User preferences.
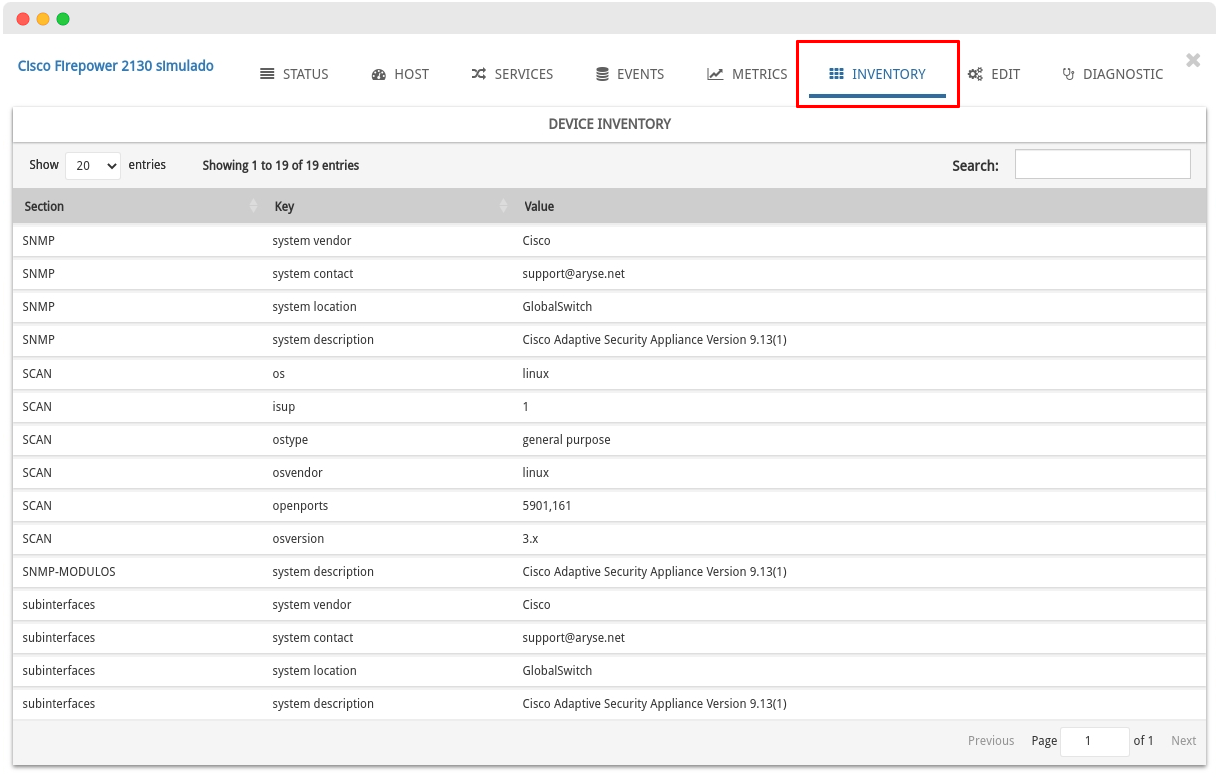
11. New endpoint for asset inventory insertion
The API of the Import-Tool module of the tool has been updated, incorporating a new endpoint for the import and integration of values and attributes in Inventory.
This function makes it possible to assign a rich inventory to a Host, from the administration interface itself (as was previously the case) and now also via the API served.
12. Mass deletion (de-import) of assets using the new Task CSV_Delete
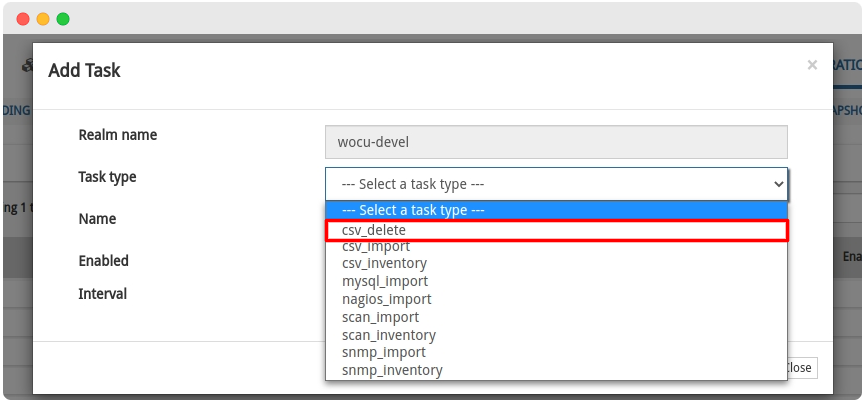
WOCU-Monitoring has powerful and diverse Import Tasks (Tasks) and enrichment of assets and inventories. In this latest version, work has been done to develop a new task but with a different or opposite purpose: to speed up network deletion and cleaning processes.
The new CSV_Delete task allows the operator to execute a mass deletion of Hosts or associated data by reading a file in CSV format.
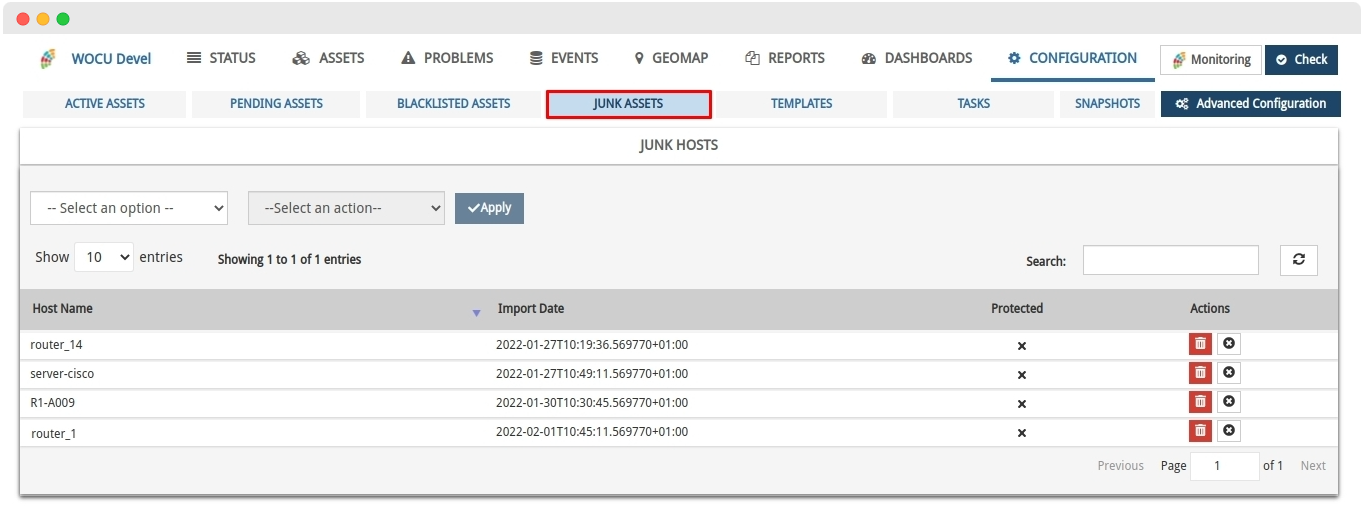
For this purpose, the system will temporarily place these imported elements in the new independent section Junk Assets. At this point, the user can assess and carry out the definitive deletion of assets from the monitoring plant if required.
Attention
The deletion of assets shall in no case leave orphaned elements. Assets linked to a Host Business Process or Service Business Process shall be locked in the table.
This exception does not apply to Host Groups, since the task will directly extract the element without altering any logical meeting (as it does in the case mentioned above).
For an efficient and stable use of the tool, constant maintenance and debugging of the monitored network is recommended to ensure control and supervision of all assets and processes that impact our business.
Monitoring packs
See our catalogue of Monitoring Packs in the following link.
Packs upgraded to SNMP V3 version
Listed below are the Monitoring Packs of WOCU-Monitoring that have been migrated to the SNMP V3 version.
Important
The core of Monitoring Packs already includes SNMP V3 support. We continue to work on adapting other less frequently used packs.
Snmp-diff-inventory
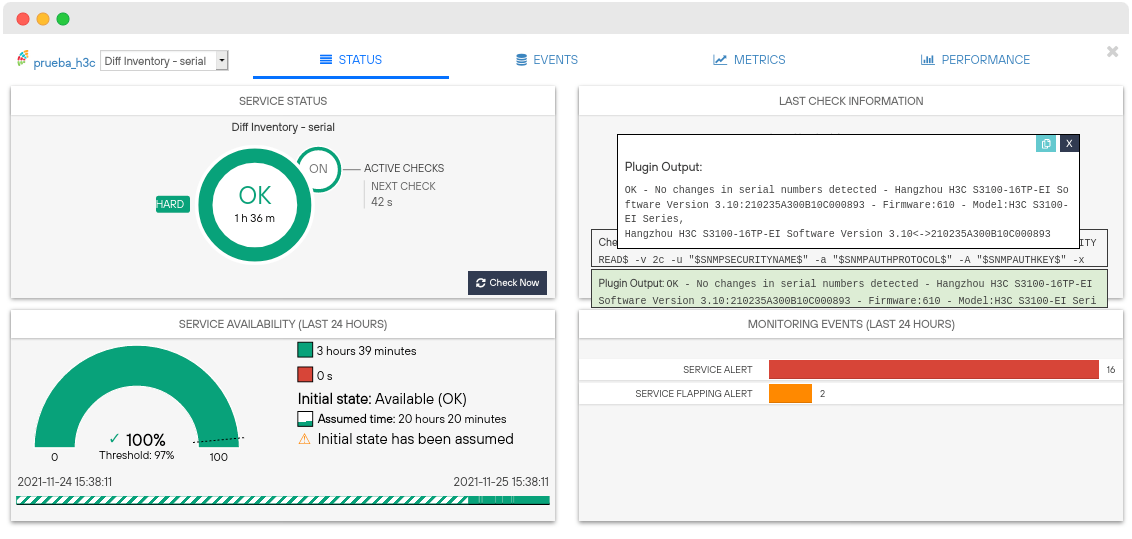
The new monitoring pack Snmp-diff-inventory has been designed and incorporated to detect changes in system information.
This pack includes the following services:
Sysname: detects changes in the sysName of the equipment.
Serial: detects changes in the serial numbers of the equipment’s chassis and backplane type entities.
OIDs: detects changes in the response after querying a configurable OID. You can add as many OIDs as you want and a service will be created for each one of them.
If a change is detected, the services will maintain the alert until the operator executes a submit passive check with result OK.

Fortiswitch

Designed the new Fortiswitch pack, which includes functions to obtain CPU usage and memory usage metrics for Fortinet-fortiswitch equipment.
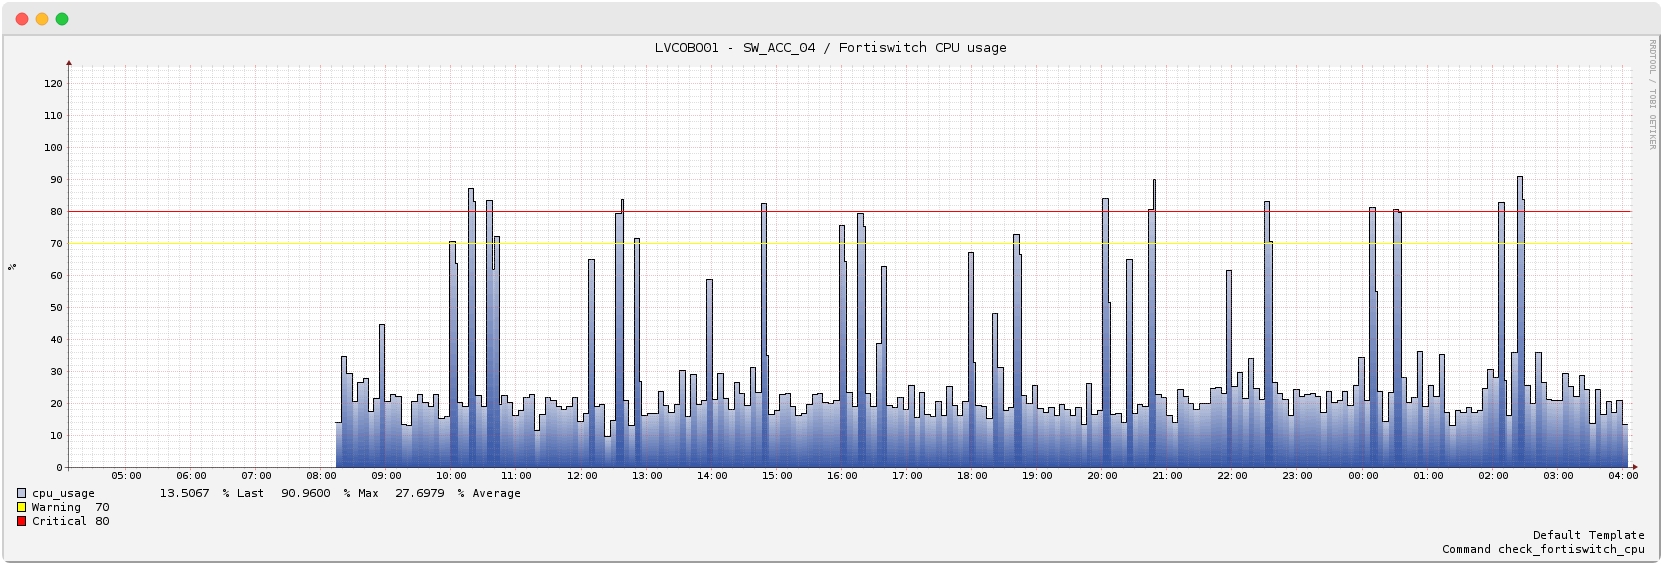
For a more complete monitoring it is recommended to apply generic packs already existing in WOCU-Monitoring to these Hosts and monitor traffic, errors and status of ports and interfaces. Access the complete catalogue here.
Palo-alto-licenses

In this version, the Palo-alto-licenses pack has been developed, which allows you to discover the licenses installed on a Palo Alto machine, select the ones you want to monitor and independently configure the thresholds based on the number of days remaining until expiry.
Hsrp-cisco-ifaces

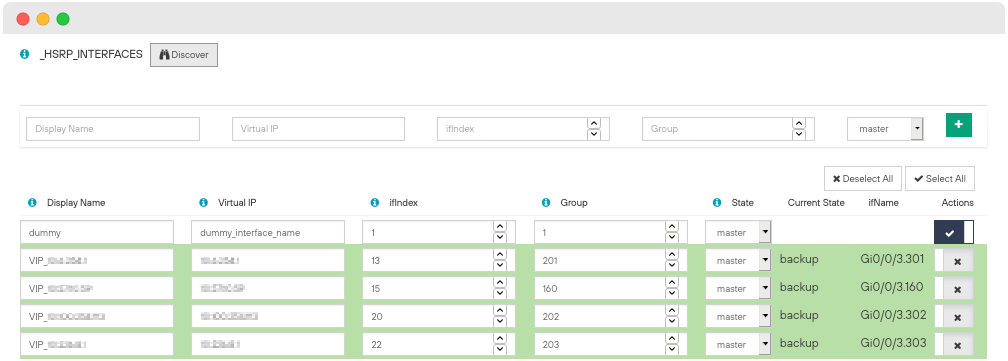
A new pack is added to the catalogue for monitoring the status of HSRP interfaces. It allows to discover and configure the above mentioned interfaces to be monitored, as well as to select the correct status they should have (master/backup).
A service is created for each selected interface and alerts when the status is not as configured.
Note
This pack does not replace the existing Hsrp-cisco, which monitors all HSRP interfaces in a single service and generates alerts if any of them is not in the state configured in the _HSRP_STATE macro.
Other improvements and fixes
Every new version is full of small changes, fixes and optimisations that should be briefly highlighted. We list the most notable ones in this release:
Security improvements have been implemented on the rich text used in Reports comments, filtering all comments in order to remove unauthorised elements.
The RabbitMQ GUI has been enabled by default to facilitate the management of connections and message queues. Recall that RabbitMQ is used as a messaging broker for the Import Tasks (Tasks) of the Import-Tool and the asynchronous execution of Reports of the Aggregator.
Refactoring of the Services Inventory by eliminating duplicate code, which significantly reduces the complexity of the component.
New security measures are included in the Diagnostic-Tool, to check for inappropriate or illegitimate use
The Hostsgroups (HG) present in several Realms already have direct links to their respective Detail views for each associated Realm, i.e. each Realm links to the Detail view of the HG in question. The new function is available in the Host Groups Inventory. See the following example:
HG_1 [Realm_A] [Realm_B], whereRealm_AandRealm_Bboth redirect to the Detail view ofHG_1with the activity and data concerning each Realm.New information field in the Host Modal Host View, where the Contact Groups (Contacts Group) that will be notified in case of an incident in the Host itself are registered. These groups include those contacts assigned in the Template (Template) of the Host
New error exit message during configuration of macros in Monitoring Packs, thus stopping the successive loading of the view.
Unified the styling of the Import-Tool and Aggregator administration modules for greater visual consistency.
The style of informative error messages, displayed in the various Import-Tool actions, has been standardised.
Optimisation in terms of usability of the Diagnostic Tool, preserving the result obtained during navigation between the different diagnostic functions available.
The Pending status is removed from the
Hosts by StateandServices by Statecolumns of the Host Groups and Packs inventories. Objectively Pending is a transitive state, frequent during initial asset loads. Therefore, the likelihood of it occurring in already consolidated plants is minimal, making it unnecessary in both listings.Fixed an internal bug where the backend was not correctly receiving and storing default information for certain parameters.
Fixed a bug that made it difficult to edit and assign Monitoring Packs.
From this version onwards, the Diagnostic-Tool will iterate over the
Livestatusdatabase, instead of theImport-Tooldatabase as before. This change ensures the inspection of assets regardless of their registration in the import module. In addition, support for multi-realm diagnostic processes has been added.New function for updating and refreshing data in the Contacts tables linked to Pending Assets and Monitored Assets.
Fixed a bug in Metrics Evolution Reports exported in PDF, where the units of the metrics represented in graphs were not displayed.
The Top 10 Host Groups Chart will not refer the user to its :ref:`HG-modal`when it does not contain or show any data. Furthermore, it has been carried outa small correction in the display of the names of the HostsGroups represented in the graph.
The tab concerning the Diagnostic Tool has been removed from the Business Processes modal, as this function can only be performed on physical machines (assets) and not on logical pools.
Unified the styles of Host Groups members of Multi-Realm or Realms based Host Groups in the Host Groups Inventory.
Fixed in the API Public the
skip_hostgroup_realmsflag, removing Realms based on Host Groups from a Host’s displayed information when in use.Fixed a bug detected in the operation of the Mass delete (migrated to
REACT), executable on the tables and inventories of the Import-Tool module.New layout of the tabs or categorised sections of the Host Group modal to fit the width of the header and show a more visually balanced view.
Migration to function of the different components that make up the Service Status Filter, as they had become outdated.
The colours linked to availability statuses were displayed inverted in the Global of the Status view. This situation has been revised by restoring consistency in reading data.
Retrieved search function by name from Monitoring Pack in Pending Assets listing.
Fixed a problem in Other Log Events (Logs), where empty numeric data would not display lower level tables (if present). Now all types of data are supported.
A new specific output message is included for unsuccessful diagnostic processes due to ignorance of the Host (object of the analysis).
Fixed a bug caused when editing templates based on Multimetrics Reports that removed the contents of configuration parameters.
From now on, the sidebar on the WOCU-Monitoring documentation page collapses, adapting the content to the screen size and making it easier for the user to read. Other CSS changes are added to this resource.
The Modal of Services of a Host has a selector that provides direct access to the detail view of the chosen service. This selector returns the list in ascending alphabetical order (A-Z).
In Multi Realms and Realms based on Host Groups when the interface is minimised and the section titles in the navigation bar are hidden, the section can be identified by a new pop-up text when hovering over the fixed icons.
Unified the error or missing data messages displayed in the widgets of the Detailed view of a Host Group view.
Fixed a bug when creating a Realm via the API Public, which prevented certain optional fields from being left empty.
Upgraded software
Numerous pieces of software integrated in WOCU-Monitoring have been incorporated and updated:
Software |
Previous version |
Current version |
Remarks |
|---|---|---|---|
Python |
3.8.11 |
3.8.12 |
|
LMD |
2.0.3 |
2.0.4 |
|
Collectd |
5.5.3 |
5.10.0 |
https://github.com/collectd/collectd/blob/collectd-5.10.0/ChangeLog |
Fluentd |
0.12.12 |
0.12.43 |
https://github.com/fluent/fluentd/blob/v0.12.43/CHANGELOG.md |
About WOCU-Monitoring
WOCU-Monitoring is a monitoring tool that integrates the latest Open Source technologies for monitoring, visualisation, metrics graphing and log management, providing a wide visibility on the status and availability of network elements, servers, databases and workstations (among others) using customised Monitoring Packs.
In addition, the Enterprise version of WOCU-Monitoring called Enterprise allows deployments of thousands of IP hosts, in a distributed environment, with customisations tailored to each customer’s infrastructure.