Release Notes 52
Publication Date: 07/09/2022
This document deals with the new features, functionalities, improvements and corrections integrated in version 52 of WOCU-Monitoring, responding to the requests and suggestions of our users and the current market needs.
Each version is important, but on this occasion we are very pleased to be able to present the new image of WOCU-Monitoring. We have managed to capture and synthesise the concepts of stability, control and security that WOCU-Monitoring guarantees during the monitoring of infrastructures in a simple but distinctive design.
Other points we cannot overlook are the variety of changes, integrations and improvements incorporated in the Services Inventory, such as: new options for filtering and selection of items, refinement of the export action, massive management of comments, etc.
Furthermore, from now on, application administrators will be able to see, at a glance, all the components that WOCU-Monitoring has deployed at the time of the query. The new Infrastructure panel offers a complete and correlated overview of the different parts that make up the monitored network infrastructure.
In relation to the Templates for Host profiling, the ability to exclude monitoring services has been added from the configuration model itself. This allowance is intended to facilitate the maintenance of a valid and up-to-date asset network.
And many more new features that add value, distinction, stability and robustness to WOCU-Monitoring. These are detailed in more detail below.
1. Get to know our new corporate image
We are launching our new corporate image.

Challenging.
After a slow fire, meticulous and conceptual process, we have managed to capture and synthesise in a simple but differential design, the idea that “with WOCU-Monitoring everything is fine (OK ✓).
It has been built around that concept, where a monitored infrastructure and involved sub-processes (which directly impact the health of the business), are under control and fully stable thanks to our solution.
It’s not just a facelift
This renewal strategy symbolises the moment of change we have experienced, as WOCU-Monitoring began operating as an independent brand in 2021, continuing to address all the monitoring needs and requirements necessary to oversee the infrastructure that supports the business.
We are very happy with the result, we have gained identity without losing any of the DNA of the previous image. Without further ado, we hope that our customers will endorse us with their trust and support once again.
Note
If you have not yet read our post on the background, vision and reasons for choosing WOCU-Monitoring, you can do so here.
2. Aggregation of various functions in the Service Inventory
Full selection of export fields
In the modalities of Export of Services in JSON or CSV format, the new button Select all is included for the selection of all available fields/boxes for a complete export.
The action can be reversed using the Deselect all button.
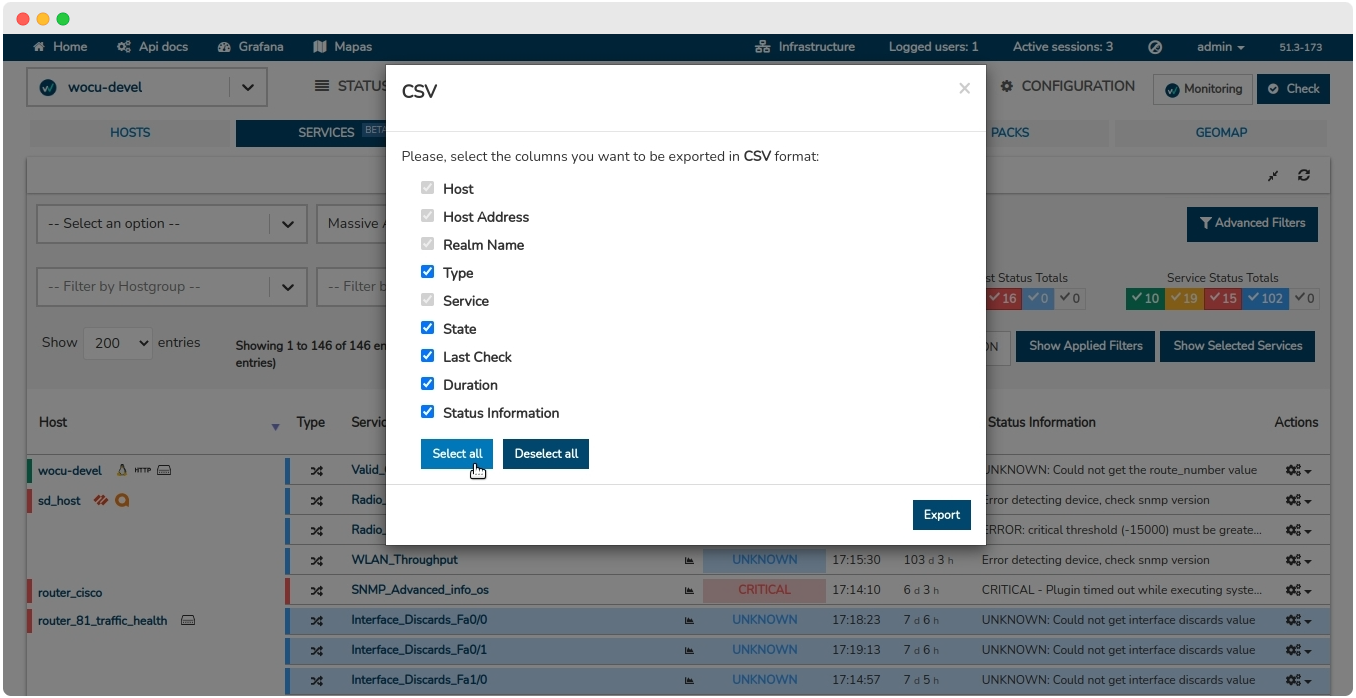
In addition, the following new (mandatory) export fields are included which will provide more information on each asset:
In the Services inventory:
Host addressIn the Host Group Inventory:
Members:Members.
Implementation of new dynamics for the selection of services.
The operation and management of the Services Inventory continues to be optimised.
On this occasion, the automatic selection of all the Services associated to a Host has been added when clicking on one of its cells, specifically, on the plot of the Host column (referring to the name of the Host).
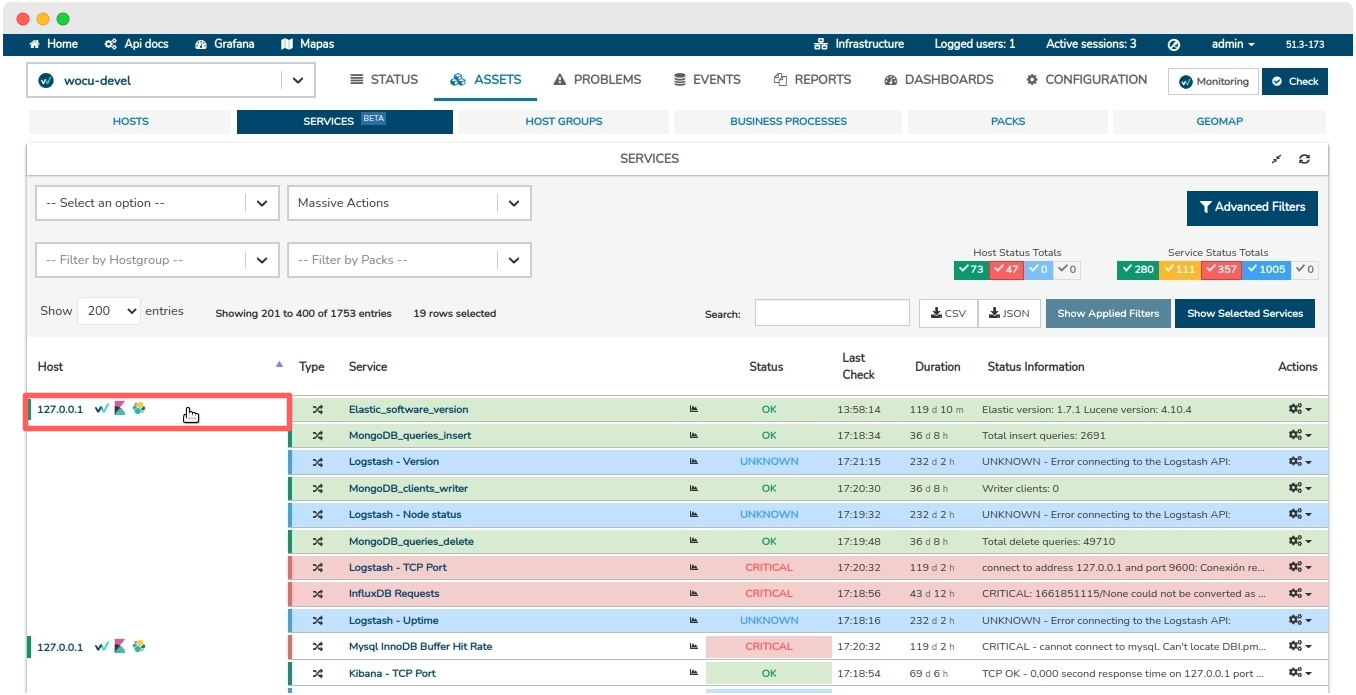
Another option for manual selection has been added, using the following combination of keyboard and mouse: Shift key + left mouse click.
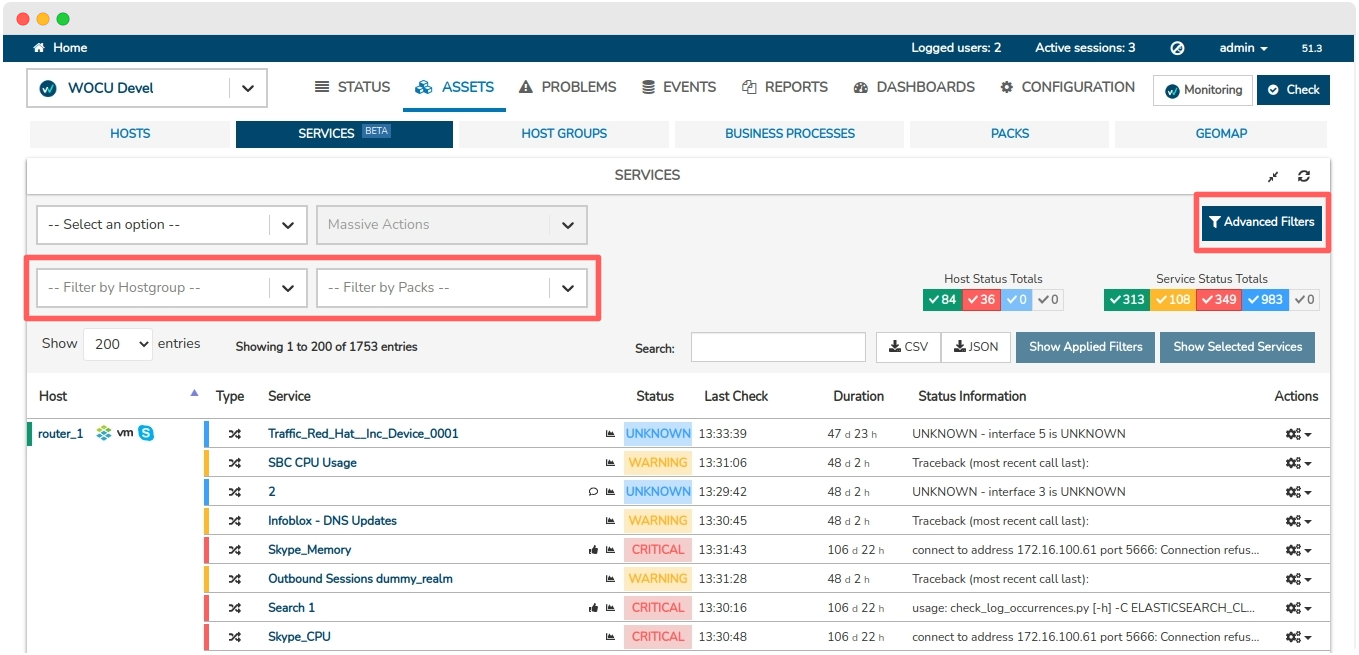
Expansion of Service filtering options
The Services Inventory has been provided with several filters whose operation allows to concatenate conditions and purge the list with items that fall into certain categories or operational situations.
They are detailed below:
Filtered by Host Group: modifies the global inventory display, showing only the Hosts and associated Services belonging to the chosen Host Group.
Filtering by Monitoring Packs: modifies the global inventory display, showing only the Hosts and associated Services that make use of the pack chosen in the drop-down.
Advanced Filters: the application offers an additional advanced filtering system on top of the Inventory Monitoring Services, making it easier to choose and view items that share certain characteristics.
The new options available are:
BP Services: filtering by asset type, specifically Services Business Processes.
Disabled Checks: filtering of assets where the user has applied the action Disable active checks for services.
Acknowledged: filtering of assets where the user has applied the action Apply acknowledged to service.
Downtime: filtering of assets where the user has applied the action Schedule downtime to service.

In short, the concatenation of filters enables a more organised management of large and complex systems.
Mass deletion of comments associated with Services
New support for bulk deletion of comments in the Services Inventory.
Having selected several Services for the simultaneous display of their comments (via the Massive actions on inventoried services selector), the system will present a new Comment management overview which centralises individualised information for each element and the possibility of its deletion:
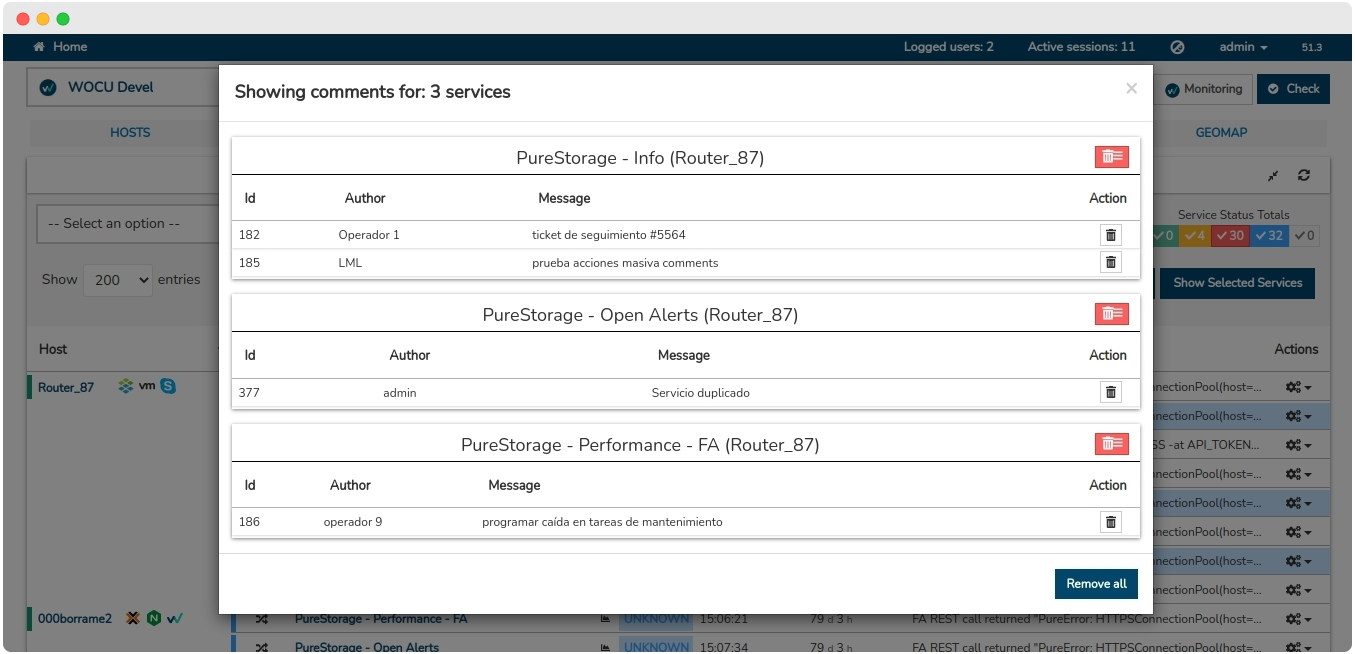
In this space there are different modalities for the definitive deletion of comments in the system:
1. Deletion of an individual comment:.

The comment with Id 377 associated with the PureStorage Service - Open Alerts on Router_87 Host is removed.
2. Deletion of all comments associated with a particular Service:

Comments with Id 182 and 185 associated with PureStorage Service - Router_87 Host Info are removed.
3. Bulk deletion of comments associated with the Services previously selected in the inventory:
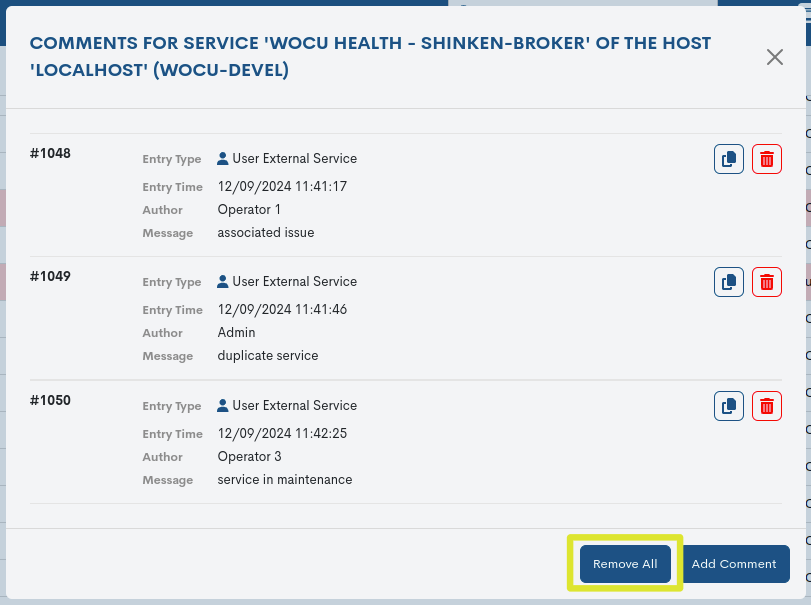
All comments associated with the PureStorage - Info, PureStorage - Open Alerts and PureStorage - Performance - FA Services are removed from Router_87 Host.
Note
This implementation is also included in the Hosts Inventory.
3. Different refactorings of the frontend.
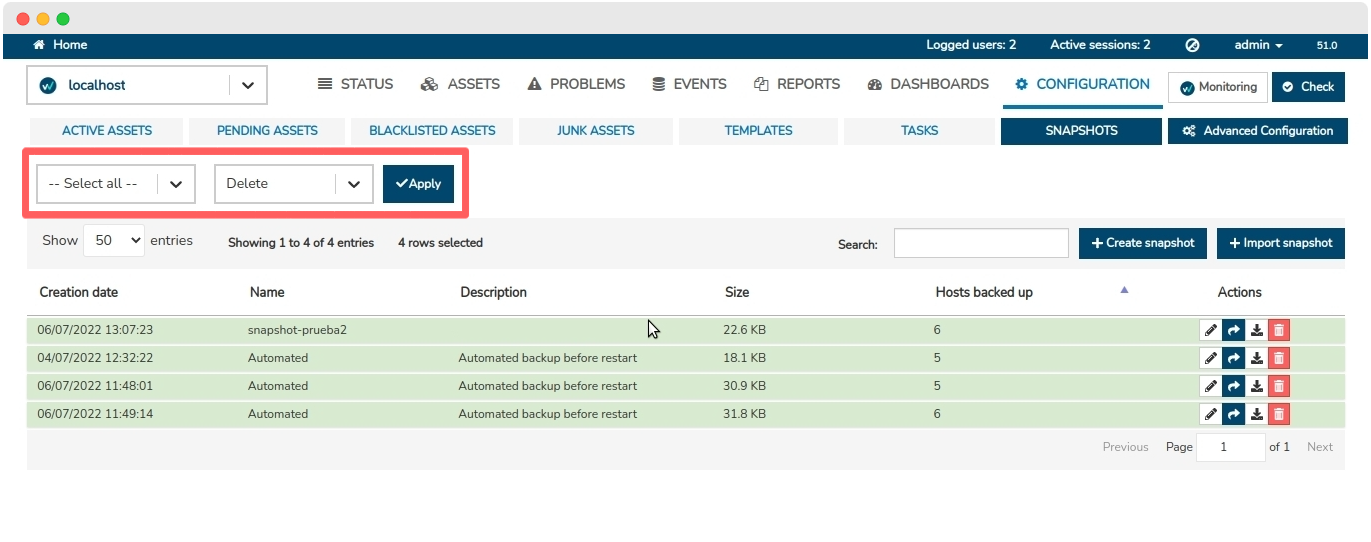
✓ The options for management and operation of elements in the Configuration module of WOCU-Monitoring are extended. The following implementations are added to the existing functions:
Action to massive deletion of items in the following tables:
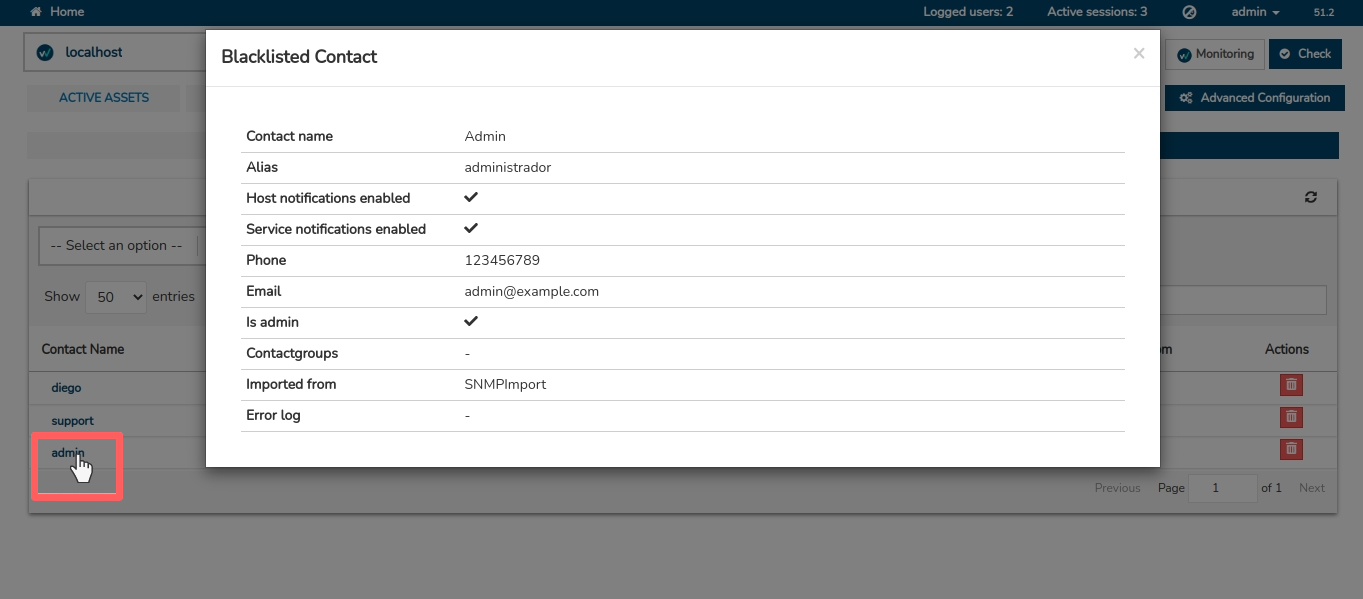
Incorporation of the new Assets Information Modal, accessible from each Name tag. From this version onwards it will be available in the following tables:
Possibility to Edit all elements underlying the Pending Assets section from its own Information Mode.
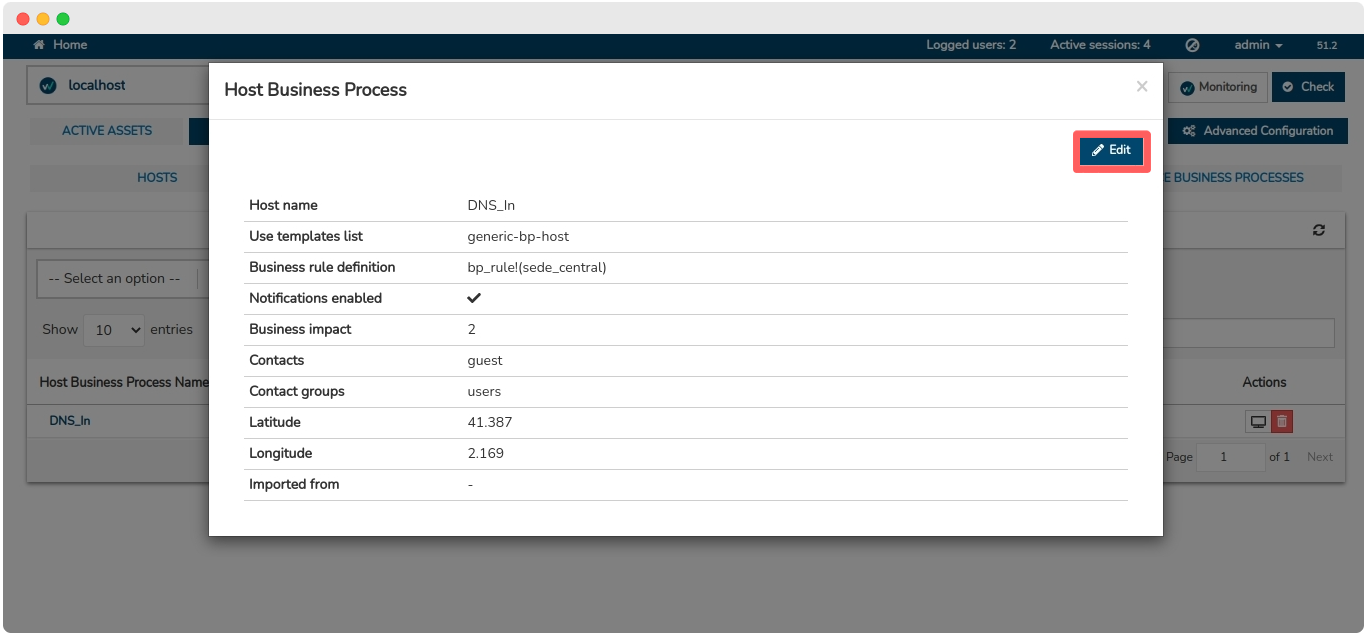
With these updates, the functionalities, organization and styles of the different sections and views of the Basic WOCU configuration of WOCU-Monitoring are equalised.
✓ Removed all Close buttons from modals with REACT 7 technology and unified the styles of the confirmation buttons embedded in the modal actions of Hosts and Services modals.
✓ New functionalities and improvements in the configuration of Complex Macros of Monitoring Packs:
Macro duplicate action, via the Clone Row button. This new option makes it easier to insert similar elements.

During the validation and confirmation of configuration fields, only wrong values detected shall be flagged, facilitating their immediate correction.

Inclusion of default values (extracted from the
templates.cfgfile) in macro configuration parameters. These values can be freely modified.
✓ Refactoring of Snapshots module to REACT 7 and JsonSchemas technology. This change will result in better debugging of load times, improved maintainability and performance and responsive visualisation.
4. New UI-ACL support for Host Group filtering
By way of introduction, UI-ACL (Access Control List) is an extra APP of WOCU-Monitoring useful to limit the scope of user viewing by means of ACLS rules, i.e. it allows to enable or deny access to specific environments or interfaces (either by sections, modules, widgets, etc.).
The application already manages permissions and access privileges using this method, however, in this latest version support for ACL has been incorporated in the Host Groups Filter of the Hosts Inventory. This allows the operator to freely configure accesses discriminating by user type.

With the add-on module UI-ACL you can simplify user management in complex environments, promote separation of privileges and gain fine-grained control of the infrastructure.
Remember
The UI-ACL module is not distributed by default in WOCU-Monitoring, it is included in the Enterprise PLATINUM version.
For more information contact us and we will answer all your questions.
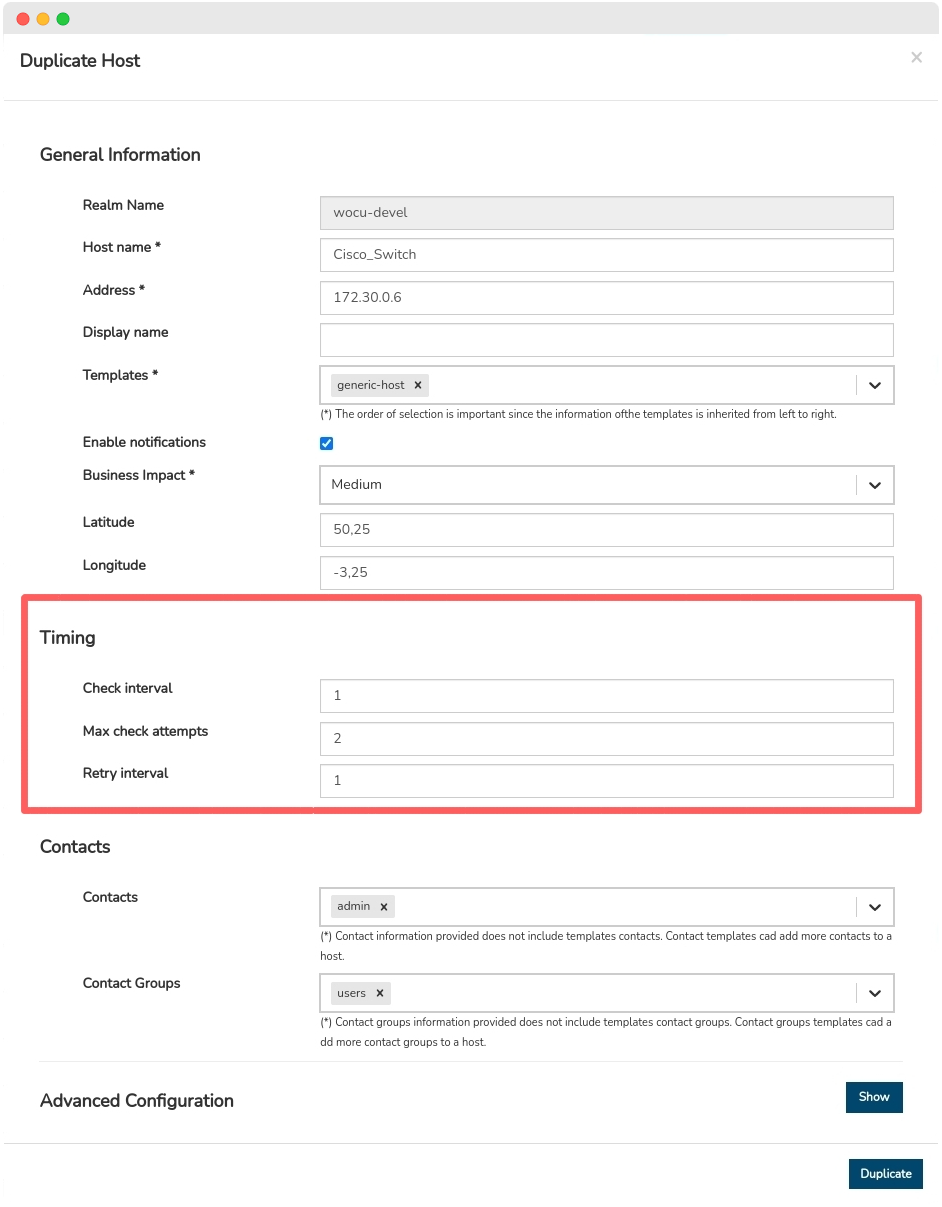
5. New Host and BP Host check synchronisation parameters
WOCU-Monitoring performs checks to assess the operational status of the Monitoring Services associated with the Host. In the course of each run, other data and metrics relevant to other measurements of the tool are collected.
The following new configuration parameters linked to these internal checking and synchronisation processes are added in this release:
Collected in a section called Timing, the parameters will become available in the Host (Hosts) and Host Business Processes (BP Hosts) registration, detailing, editing and duplication forms in the inventories: Pending Assets and Monitored Assets.
6. Improvements to the Realms registration form
The possibility to create and define new variables or entities from the Creating a Realm form itself and insert them immediately into the configuration, without having to access the Administration Module, has been included.
This integration significantly streamlines the task of creating and modelling stand-alone monitoring systems, and is not limited to administration profiles alone.
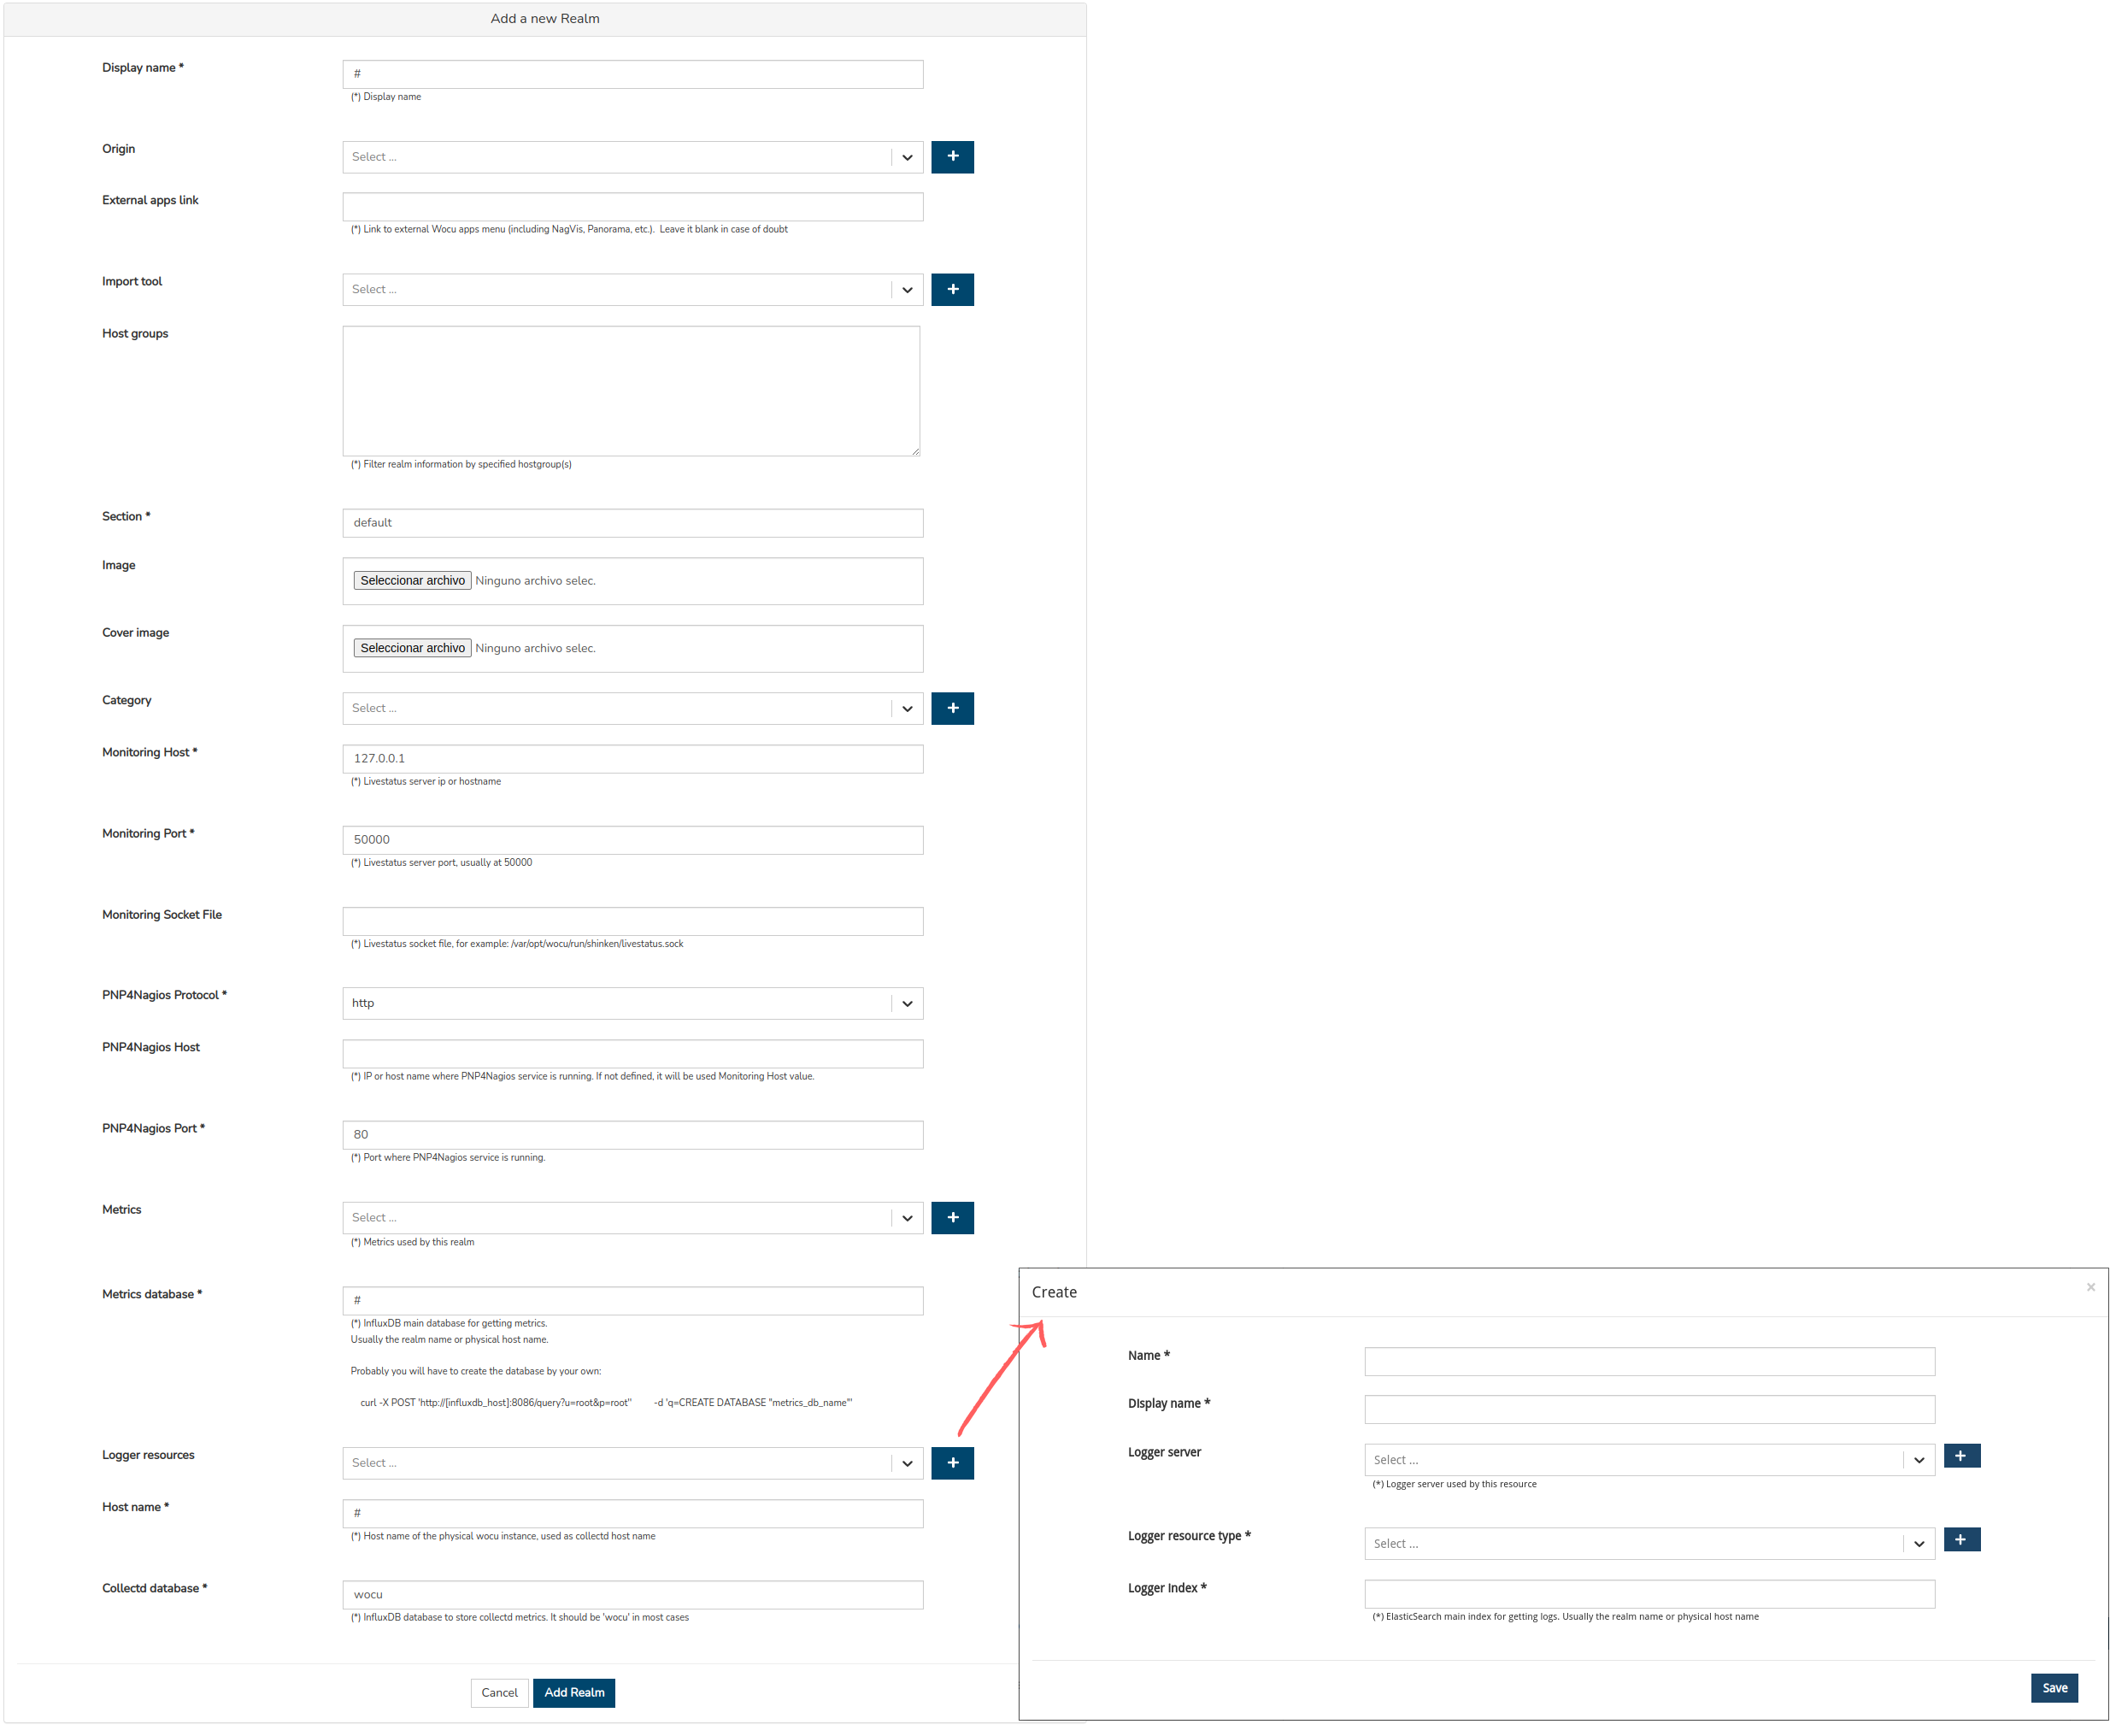
Other changes are no less important:
✓ New configuration parameters in the Creation of Realms discharge form, for PNP4Nagios graphics connection and retrieval.
✓ Presentation of the form on a new page, with slight design changes.
✓ Passwords registered in certain configuration parameters are hidden.
Note
The Realms creation form follows the same format as the add_realms_add and edit form in the Administration Module, so its construction is similar.
7. Ability to exclude Services from Templates
As we already know, WOCU-Monitoring monitors a multitude of applications through the use of Monitoring Packs. A pack is a predefined configuration profile, which executes a certain monitoring function. Each pack includes a set of predefined Services, which perform various checks to facilitate further analysis in terms of availability.
That said, the ability to discriminate monitoring services has been added to the Templates configuration, and will therefore be assumed by the Host making use of that model.
This is achieved by means of the new Exclude services parameter, incorporated in the Templates forms, where the operator can manually modify configuration attributes. It is possible to update the list by adding new services or removing some of the preset ones through the drop-down.
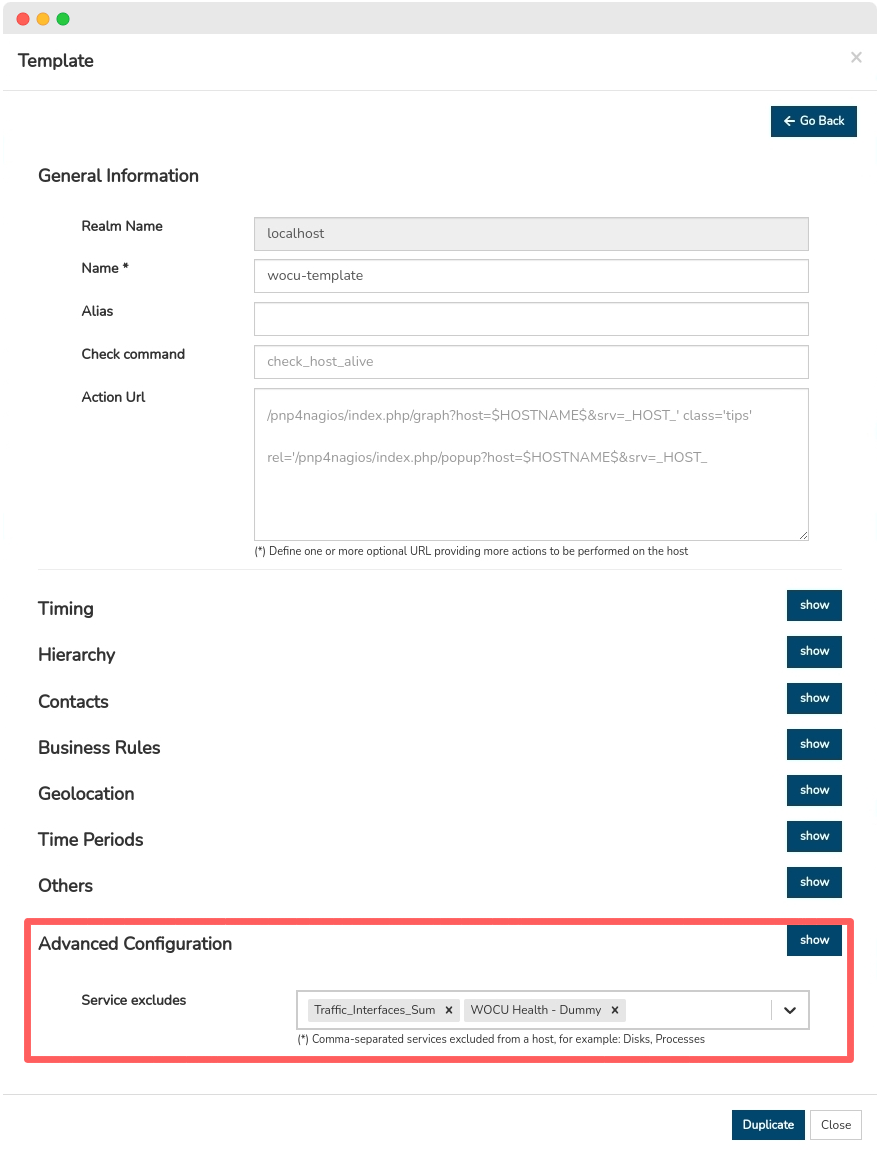
With this new functionality, effective, accurate and tailor-made monitoring is achieved.
8. Mass deletion of reports
Our Reporting Module supports advanced reports on collected metrics, events and incidents or KPIs that ensure the quality of business processes, among others. Any collected value can be captured in a customised Reports for internal use or export.
This powerful capability makes reporting a common task in WOCU-Monitoring operations, which can sometimes lead to extensive listings.
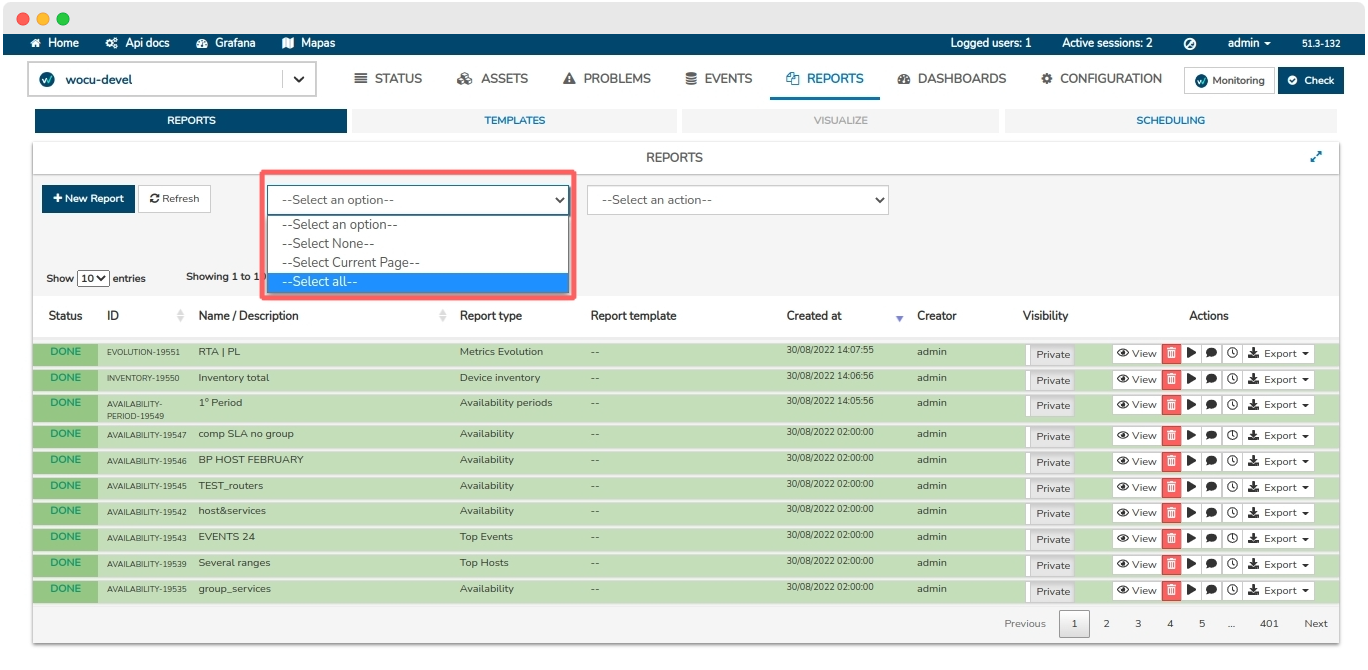
To this end, the Select all option has been added to the Mass Deletion of Reports function, for marking all items in the list in a single iteration.
9. Visualisation of the monitored infrastructure
WOCU-Monitoring is a distributed monitoring solution that can grow according to the needs of a company. For this reason, this version includes a section to know all the elements that WOCU-Monitoring has deployed at any given time.
The new Infrastructure view will be of great help to the administrators of the solution, as it provides a complete and correlated overview of the different parts that make up the monitored network infrastructure.
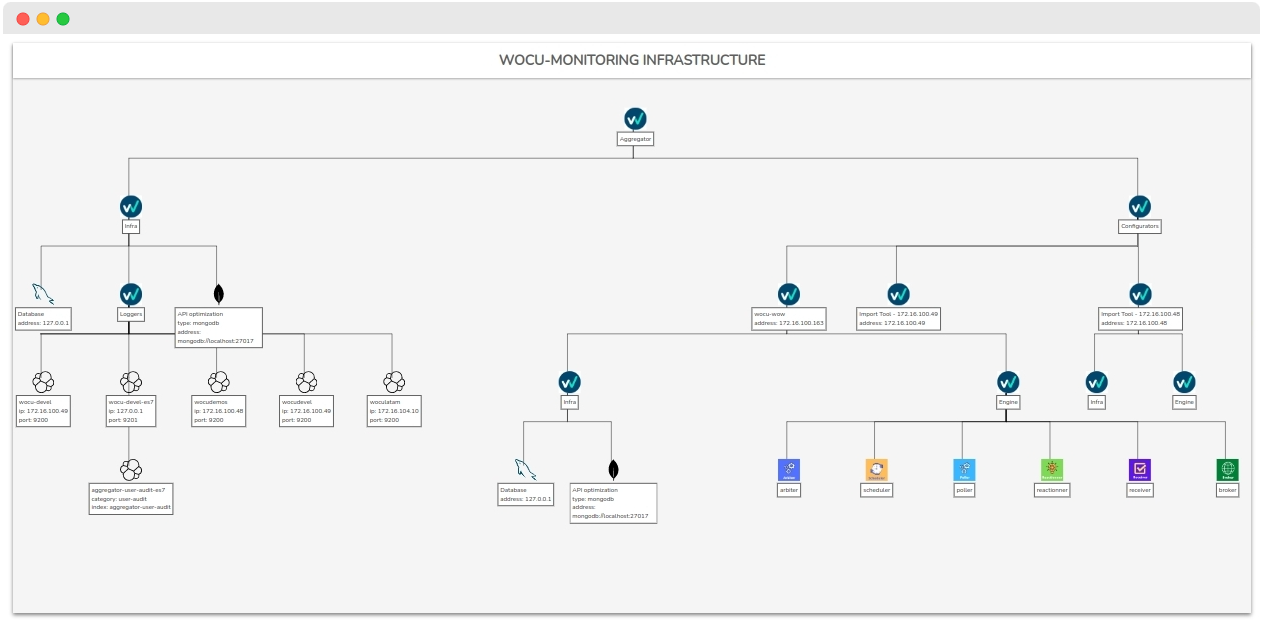
In addition, it is possible to expand and collapse nodes to make navigation through the nested tree more convenient, and thus to trace the different hierarchical levels originated. Simply click on a particular node to collapse or expand the dependent items.
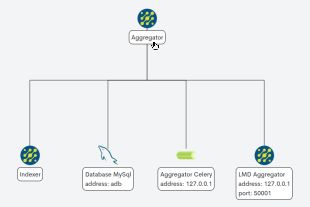
The simplicity of this resource facilitates the understanding and analysis of the current infrastructure situation, regardless of its size and complexity.
Important
This feature is in a preliminary version and will be improved in future versions.
10. Monitoring packs
See our catalogue of Monitoring Packs in the following link.
New Networkdevice Traffic Cumulative pack
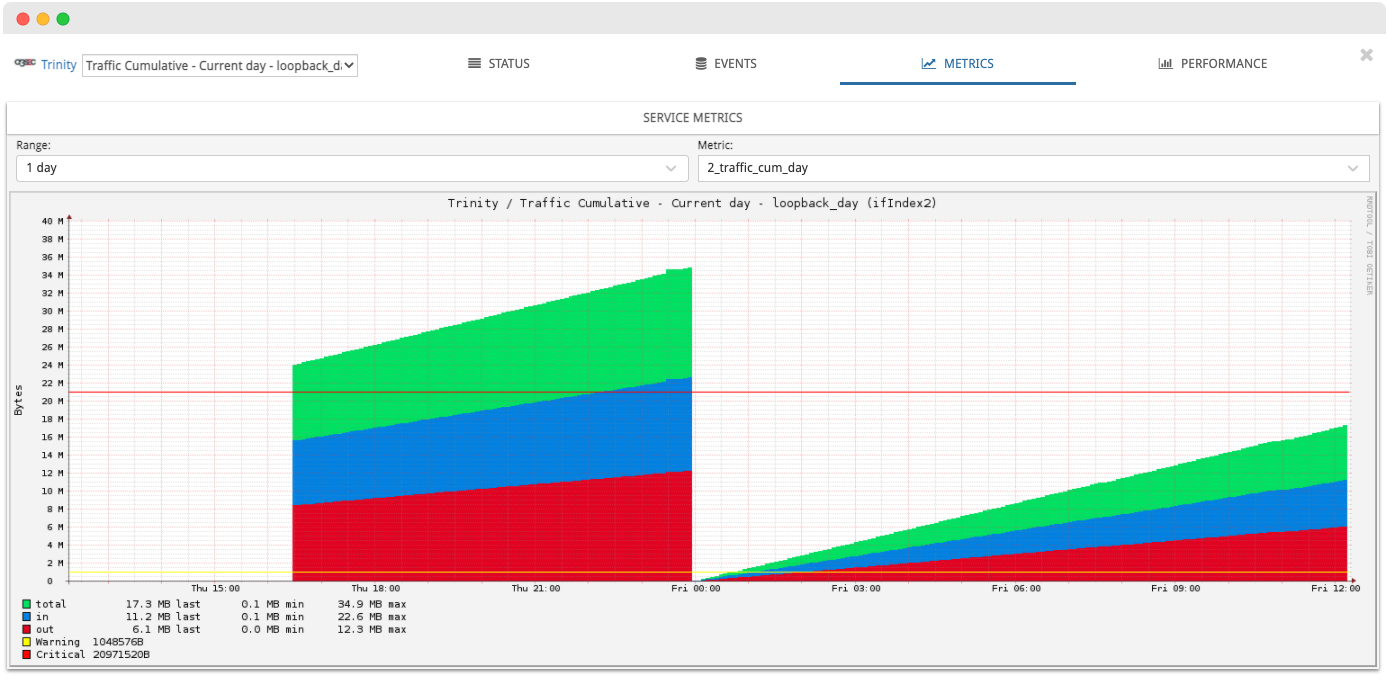
The new Networkdevice Traffic Cumulative pack, based on the metrics generated in WOCU-Monitoring and stored in InfluxDB, has been added to the catalogue.
Specifically, the metrics generated by the Networkdevice-traffic pack are analysed to calculate the traffic through an interface over a configurable period of time (day, week, month or year).
The pack will generate alerts as long as the accumulated traffic exceeds the thresholds defined for the interface.
Apache Tomcat

Development of a new pack for monitoring Apache Tomcat application servers. Metrics are obtained through HTTP requests.
The services included in the package are the following:
Status: Tomcat server status.
Mem: percentage of memory used. An alert shall be given when the defined thresholds are exceeded.
Thread: number of threads (threads) used. It shall be alerted when the defined thresholds are exceeded.
Application: status of the applications served by Tomcat. A service will be created for each Tomcat application monitored.
Google Cloud Instances

The new pack Google Cloud Instances has been added to the catalogue, with the function of monitoring Google Cloud instances. This monitoring pack takes advantage of the provider’s API (Google Cloud Monitoring).
The services included in the package are the following:
CPU: monitors the percentage of CPU usage. The metric obtained by Google Cloud contains a ratio (range 0..1) which is transformed to percentage. This value can be obtained every
240 secondsdue to certain limitations of the Google API.Disk: monitors the number of write and read operations of the disk, over a specific period of time.
Traffic: monitors incoming and outgoing traffic. The data is obtained in
Byteand converted toKilobyte.
Other improvements and fixes
Every new version is full of small changes, fixes and optimisations that should be briefly highlighted. We list the most notable ones in this release:
Fixed error message displayed when validating the complex macros form for single fields (
DescandIndex).Several styling bugs have been fixed, adapting and unifying visually the whole application.
Fixed several errors visible in the browser console about the type of Hosts in the Host-Modal
Fixed a bug where the Business Process icon in the Services of the Host Modal section was not displayed correctly.
Several informative messages returned by the application have been updated and made more specific and clarifying.
Fixed a bug in the execution of Discover on macros, since null values (blank characters) were delivered.
The number of calls originating from comments registered in the Services Inventory has been refactored, significantly reducing the number of requests (by avoiding unnecessary invocations) and consequently the loadability of the Livestatus database.
Fixed a bug in Services Inventory, which was interpreting and displaying the wrong Services statuses, which directly impacted the filtering by availability status types.
Unnecessary fields in the Host tab of the Hosts and BP modal are removed when dealing with a Business Process (Business processes), as there are parameters that do not correspond to that type of asset (but to Hosts) and will therefore always be shown empty
Cleaning of duplicate CSS files and removal of unused components.
Modified the style of several tables in the application, in order to harmonise and structure their presentation, as the content sometimes exceeded the space available.
Fixed an issue with reading and displaying null data and/or
0value displayed in the Edit tab of a Host.Se retira un scroll horizontal mostrado cuando la resolución de pantalla era reducida.
Extra security measures are added when querying the API, adding token authentication in addition to the existing username and password authentication.
Improved the design and usability of the Show/Hide toggle button.
For security reasons, during the configuration of a logger in the aggregator, the password is masked by replacing each character with a dot.
The icons associated with Monitoring Packs are again visible in the Host Modal Metrics view.
Updated several error messages displayed in wipe actions on Protected Hosts.
Fixed a bug that occurred during the validation of Complex macros values, since these were added to the pack configuration even without being confirmed by the user.
Upgraded software
As always, other pieces of software have been incorporated and updated in this new version of WOCU-Monitoring:
Software |
Previous version |
Current version |
Remarks |
|---|---|---|---|
MongoDB |
4.0.28 |
4.2.22 |
https://www.mongodb.com/docs/manual/release-notes/4.2-changelog/#4.2.22-changelo |
LMD |
2.0.7 |
2.1.0 |
|
Net-SNMP |
5.9.1 |
5.9.3 |
https://fossies.org/diffs/net-snmp/5.9.2_vs_5.9.3/CHANGES-diff.html |
Grafana |
7.5.10 |
7.5.16 |
|
Fontawesome |
4.6.3 |
6.1.1 |
https://fontawesome.com/docs/web/setup/upgrade/#what-s-new-about-version-6 |
About WOCU-Monitoring
WOCU-Monitoring is a monitoring tool that integrates the latest Open Source technologies for monitoring, visualisation, metrics graphing and log management, providing a wide visibility on the status and availability of network elements, servers, databases and workstations (among others) using customised Monitoring Packs.
In addition, the Enterprise version of WOCU-Monitoring called Enterprise allows deployments of thousands of IP hosts, in a distributed environment, with customisations tailored to each customer’s infrastructure.
