Release Notes 55
Publication Date: 30/03/2023
This document deals with the new features, functionalities, improvements and corrections integrated in version 55 of WOCU-Monitoring, responding to the requests and suggestions of our users and the current market needs.
This new version is characterised by a significant effort dedicated to stabilisation, debugging and performance improvements, which has a direct impact on the tool’s efficiency and productivity.
In addition to the time invested in optimising WOCU-Monitoring, other interesting new functionalities have been developed and integrated, such as the incorporation of automatic processes in the Audit Module, allowing to filter the global table by this type of method; or the ability to configure passive monitoring services to multiple Hostsgroups and to start listening and receiving SNMP Traps.
The infrastructure panel has also undergone a significant evolution, being able to represent the totality of services that are operating in the environment.
Another notable development has been the integration of ADS into all traffic monitoring packs, which are responsible for monitoring traffic over network interfaces. This is an important milestone scheduled in our Roadmap of 2023.
Without further ado, all the new features of this new version of WOCU-Monitoring are detailed in depth. You can find more information in the User Manual if necessary.
1. Restructuring of the Infrastructure view
The Infrastructure view provides an interactive and correlated overview of the different components that make up the monitored network infrastructure and is a very useful tool for Solution Administrators.
In this version, this view has been evolved to show the different services that make up WOCU-Monitoring in full. To do this, the view has been remodelled in two different sections:
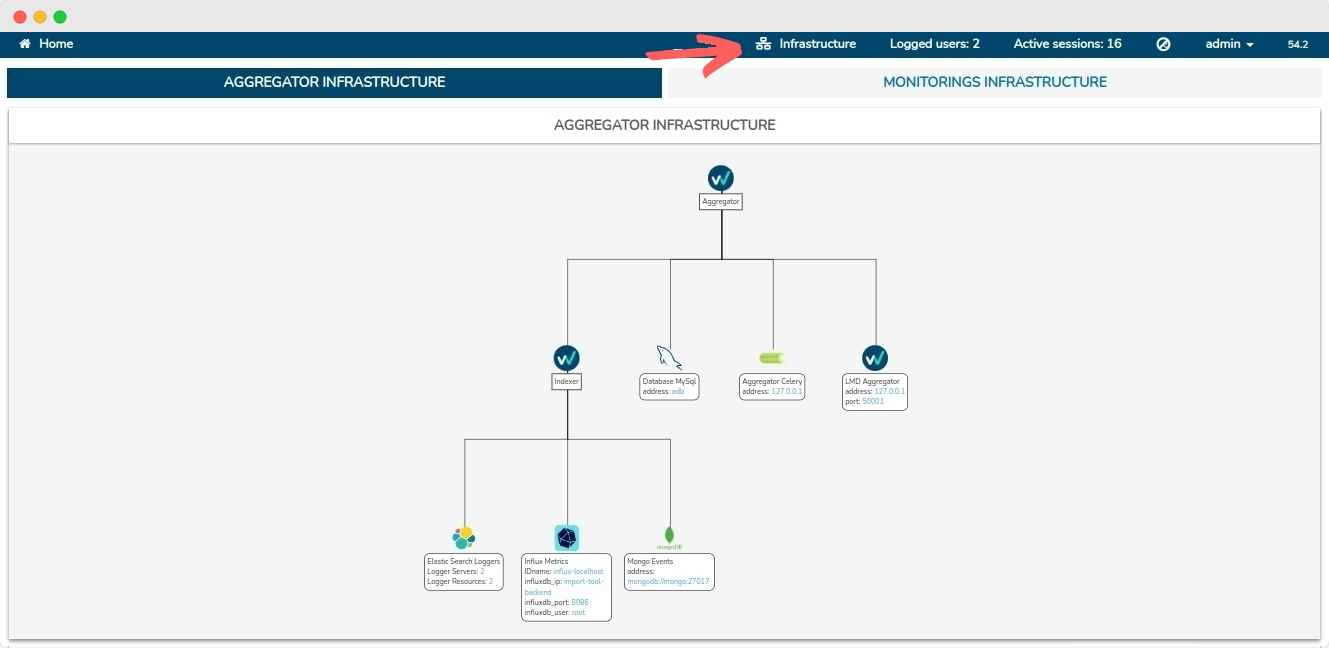
Aggregator Infrastructure: where services related to the aggregation console are mapped.
Monitoring Infrastructure: where services are mapped for each available Monitoring.
In addition, new icons have been updated with logos of implemented technologies, aiming to bring more coherence to the displayed view.
2. Automatic processes registered in the Audit Module
The Audit Module allows the Administrator to have full visibility of the actions executed in the application at the click of a button.
As a new feature in this version, in addition to plotting all the movements carried out in terms of element configuration (adding, editing and deleting) and changes at administration level, the automatic processes executed are added, specifically those corresponding to the programming of Reports (Schedule) and Import Tasks (Tasks).
This new function implies that the Method selector, which indicates the method used according to the origin or nature of the audited action, expands its scope by categorising a new filtering option: Automatic Proccess.
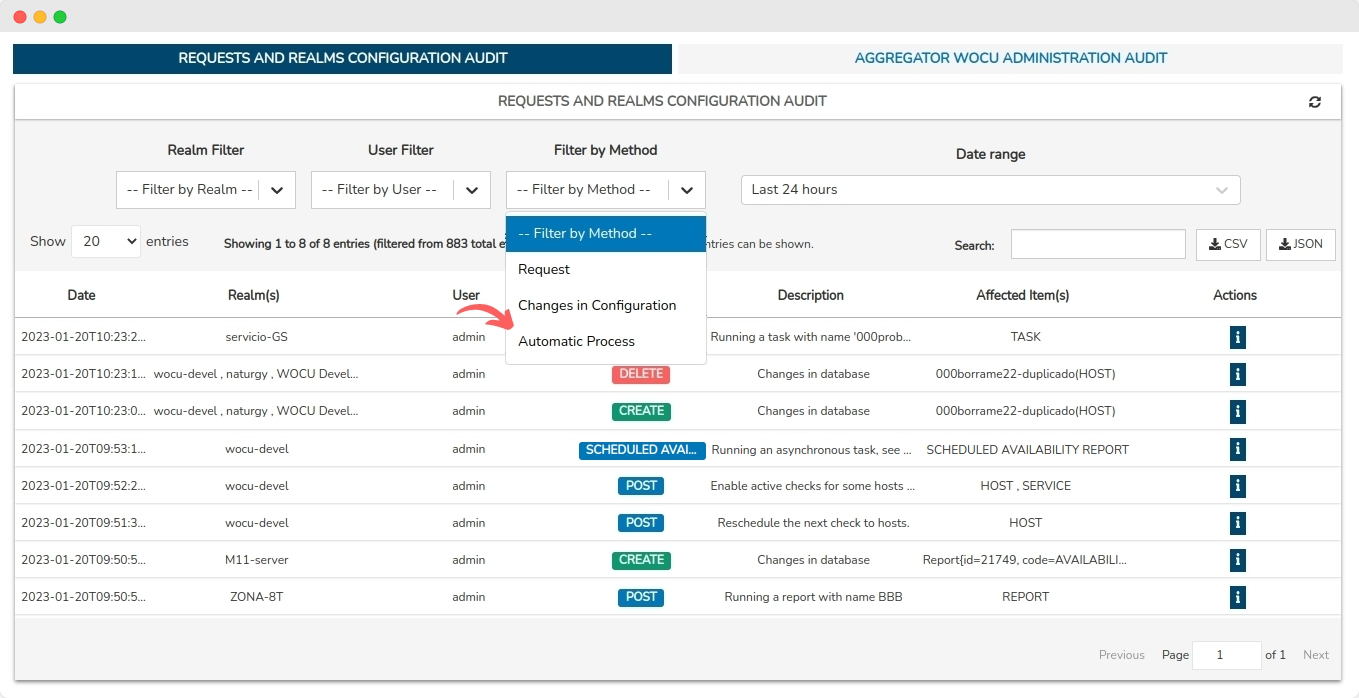
Once selected, the table will be filtered exclusively with the automatic processes registered in WOCU-Monitoring, discriminating the rest of the actions in monitoring.
3. Integration of ADS in traffic packs
Anomaly detection (ADS) functionality has been added to all monitoring packs that monitor traffic over network interfaces (networkdevice-traffic, networkdevice-traffic-all, etc.)
This functionality allows to detect sudden changes in the incoming or outgoing flow rate of one or more interfaces. The service is configured per interface and is disabled for all interfaces by default.

The pack will then calculate the average value of the traffic_in and traffic_out metrics over a configurable time range (ADS time range), and compare it to the current value. If the current value is X times (configurable value in the ADS sensibility field) higher or lower than the average value in the configured time range, this pack shall alert with a WARNING status and add a message to the output of the service indicating the reason for the alert.

The sharp variation will also be visible in the metric graph itself:

Finally, if the interface has ADS functionality enabled, but there are no changes in the metric value that meet the configured conditions, this will also be indicated in the output of the service:

Note
With this development, an important milestone scheduled in our Roadmap of 2023 is reached.
4. Multiple selection of Hostgroups in Active Assets.
New ability to multi-select Hostgroups in the Filter by Hostgroups dropdown located in the Hosts inventory.
This gives the user greater flexibility when searching for items in long lists.

5. Assignment of Passive Services (SNMP Traps) to multiple Hostgroups
As a second iteration of the newly incorporated section SNMP Traps, adds the ability to model and configure Passive monitoring services to multiple Hostsgroups and startlistening and receiving SNMP Traps. Its configuration is possible from:
The Registration of new Services in the section SNMP Traps.
Function/button Trap services, present in the inventories Hosts and Host Group.
In both forms, the new Hostgroups field has been enabled to select one or more groups that will take over the relevant Monitoring Service in its new configuration.
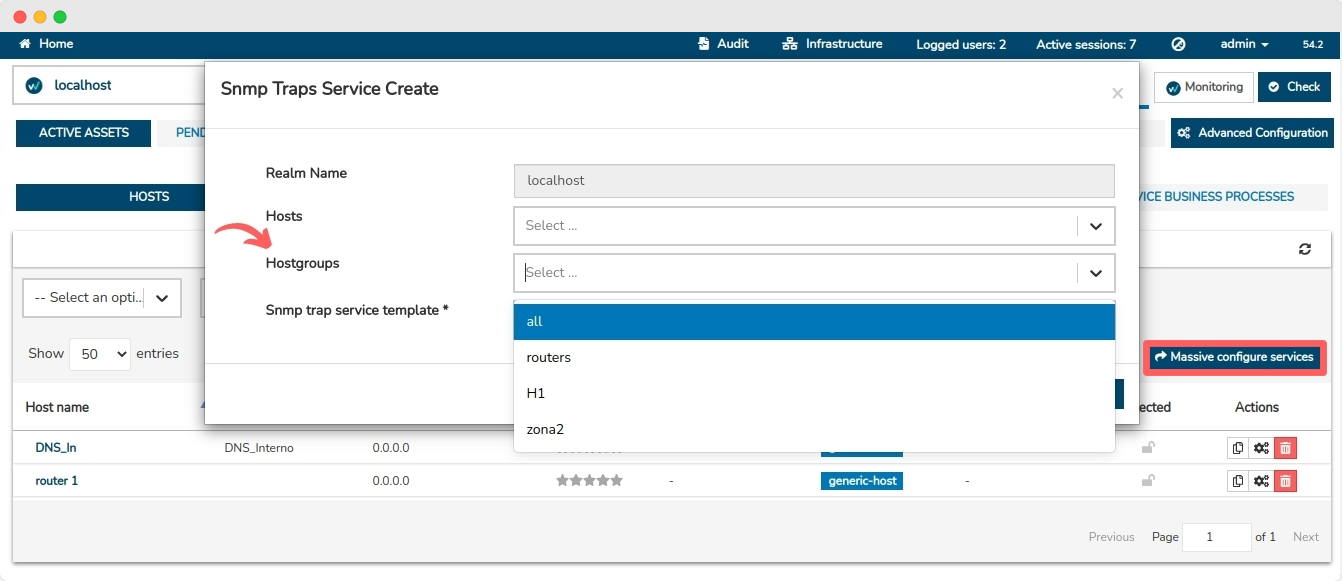
This new configuration dynamic brings with it changes in the presentation of the information from the table Trap Services, whererecord the links between Devices (Hosts), Groups of Devices (HostGroups) and Passive Services already operational in WOCU-Monitoring.
This evolution streamlines the process of assigning Services of passive origin (SNMP Traps) to multiple assets, such as Hosts and groups of them.
6. Confirmation of the filtering action via the new Filter button
The new Filter button is included along with the various selectors and other item filtering options in the Services Inventory.
From this incorporation, it will be necessary to previously execute this button to consolidate the defined configuration and reload the inventory with the new data request.

7. Notifications in Slack
At WOCU-Monitoring we know how important it is not only to detect availability problems in large infrastructures, but also to alert accordingly and appropriately.
For this reason, we have a configurable notification system that notifies the operator of the results of operational checks carried out or incidents that have arisen, in order to act as soon as possible and minimise their impact or occurrence.
In this version, integration with a widely used communication tool such as Slack has been achieved.
See the following example notification:
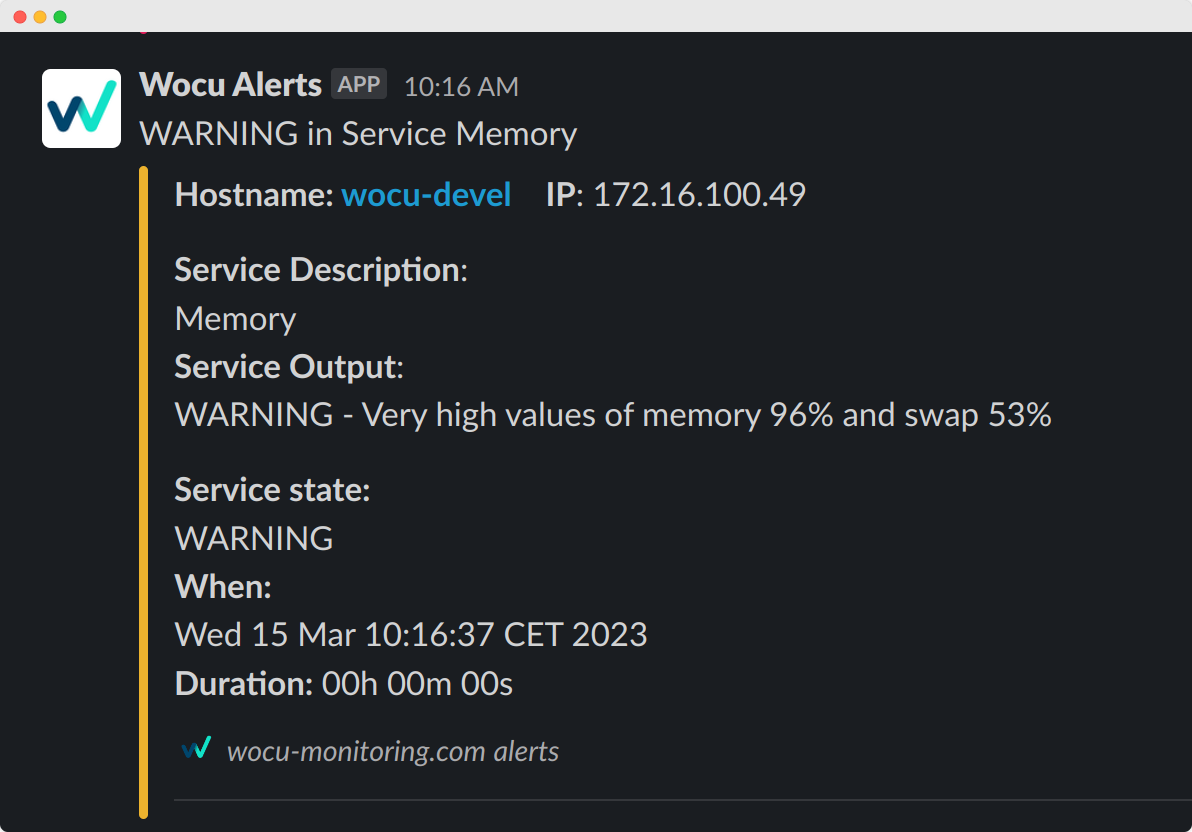
Ultimately, this is one of many methods of integrating WOCU-Monitoring with other notification alerting tools.
8. Business Process Visualisation Enhancements
Improvements have been made to the visualisation of Business Processes within the BP Trace debugging modal, specifically, in the representation of the monitoring states associated with each node that is part of the painted relational tree.
To avoid confusion in reading and understanding the representation, each status label shall be accompanied by the text HARD. This means that only states of type HARD shall be considered to determine the overall state of the node. Therefore, any internal changes of type SOFT shall be rejected and shall not affect the monitoring state calculation.
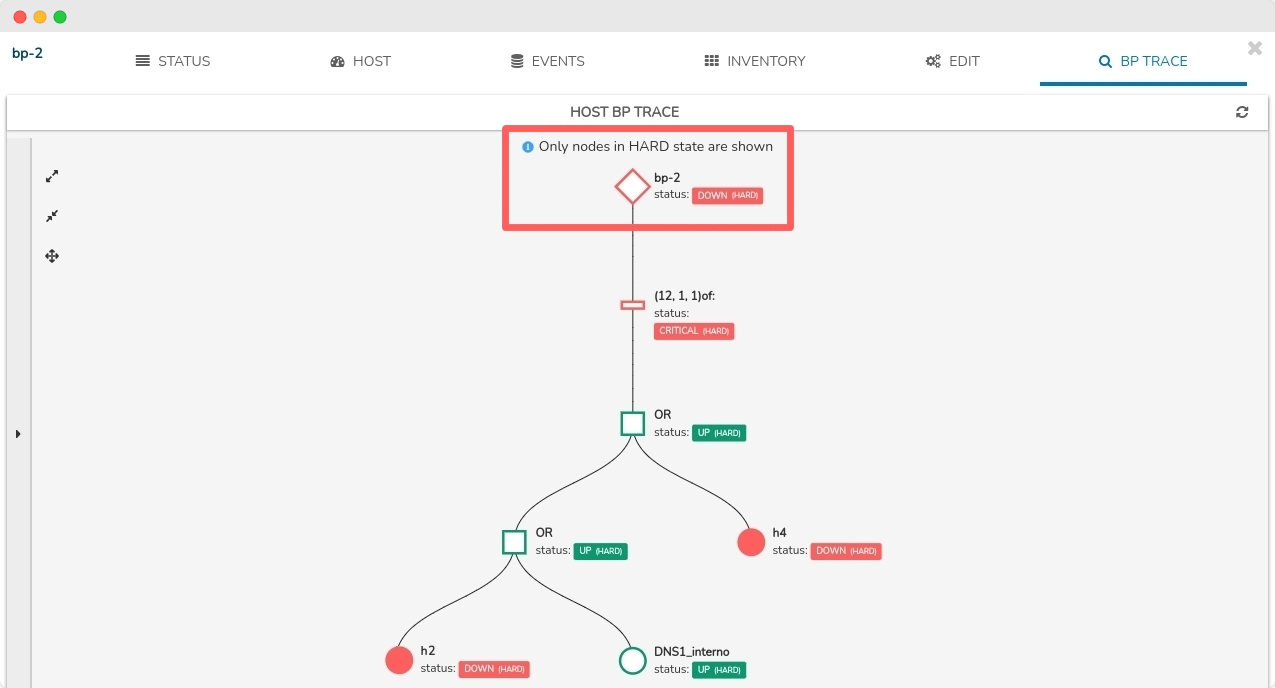
Having knowledge of the (possible) failure and knowing its root cause speeds up the process of prevention, treatment and resolution of incidents in monitored infrastructures. In this version, work has been done in this direction, with the aim of improving and increasing the usefulness of this module.
9. Optimisation of the endpoint for obtaining managed users in the application.
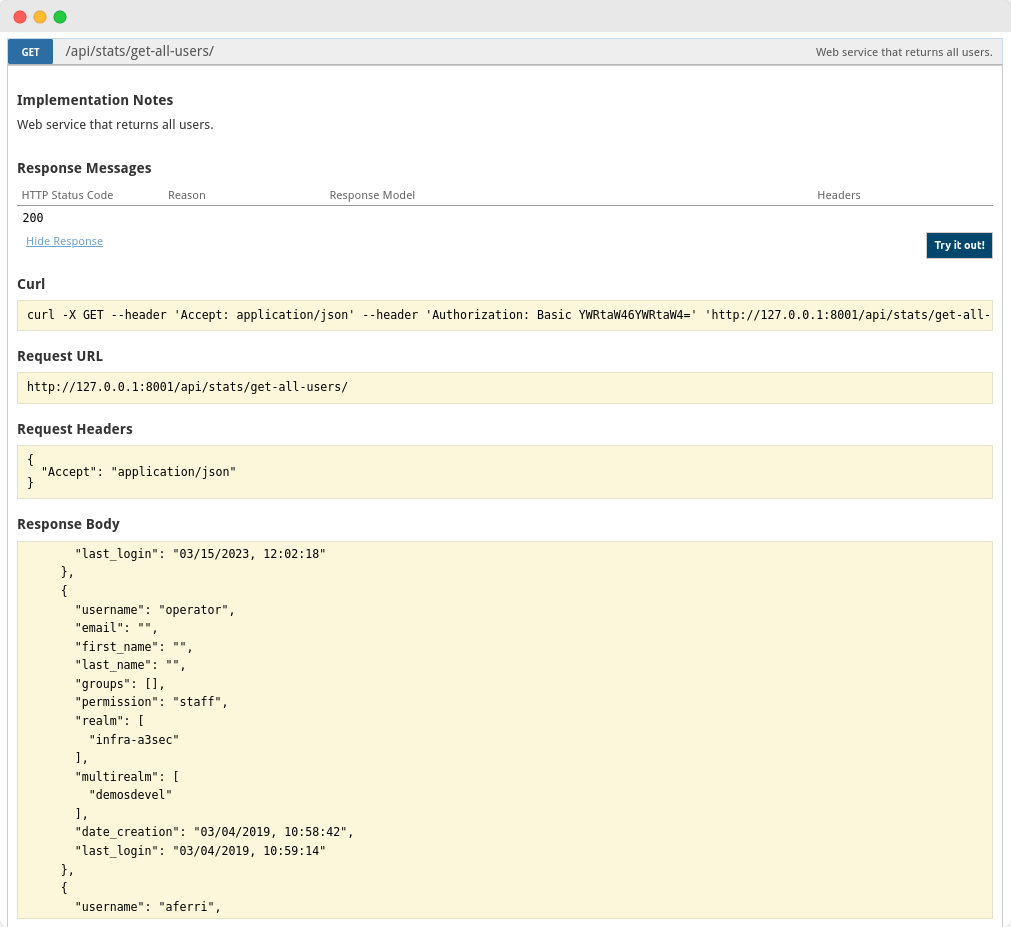
The endpoint for consulting and obtaining the complete list of users registered in the application has been updated.
GET /api/stats/get-all-users/
From now on, the response provided will be much more complete, returning new and valuable attributes for each user in the listing:
Username
First Name, Last Name and e-mail address
Realms to which you have access
User group(s) to which you belong
Permissions assigned to you (Active/Staff, Status/Superuser, Status)
Date of creation of the account in the tool
Date of last login made
The result of consulting this endpoint could be the following:
10. Monitoring packs
See our catalogue of Monitoring Packs in the following link.
New support for Alcatel devices
Support has been added for Alcatel devices with operating system version AOS8, in the following generic CPU and Memory packs, extending its scope and usability:
Other improvements and fixes
Every new version is full of small changes, fixes and optimisations that should be briefly highlighted. We list the most notable ones in this release:
A new Clear Filter button is included in the Services Inventory.
Continued refactoring to REACT 7 technology different components of the application to achieve better debugging of load times, improved maintainability, performance and responsive visualisation. In this version they have been addressed:
Section Dashboards in full.
Table of Logged Users in the application at the time of the query.
The Trap services action is now handled by
UI-ACLpermissions. More information can be found in: Permission control and authorisation of user actions (UI-ACL).Optimised the authentication text of session tokens, present in the Security Module, increasing its readability and comprehensibility.
The Macros configuration attributes are presented in the interface in the order defined in the
.cfgfile of their respective Monitoring Pack.Solventado un error por el que se entorpecía la visualización de los siguientes ítems:
Icons of Monitoring Packs represented in the Top Packs.
Unification of the format and style of error messages displayed during the implementation of Import Tasks (Tasks).
A new spinner for loading and processing data after attribute modification is added to the Edit Host view.
Fixed a bug where the simple Show services events did not redirect the user to the Events tab of the Services modal.
An informative help text has been added to the graphic Log Event Graph.
Fixed a bug where the Services Modal would not open via the metrics icon located in the Problems” table.
Correction of internal warnings accumulated and monitored by the EsLint linter, to speed up and achieve highly efficient error analysis.
Retrieved the ability to access the User preferences view from the Audit or Infrastructure.
New informational messages in the Audit associated with certain errors in the Logger Resource or Logger server configuration.
In order to facilitate and alleviate the computational capacity of queries in the Other Log Events (Logs) and Audit tables, only the first 10000 entries will be displayed. This limitation will be notified through an informative text visible in both spaces.
The margins of some of the visible buttons in the Importing and Configuring Assets Module are adjusted and aligned with the rest of the elements.
When switching services from the selector at the top of the Service Modal, the widget Service Status is correctly updated again, displaying the name of the previously selected service.
Upgraded software
As always, other pieces of software have been incorporated and updated in this new version of WOCU-Monitoring:
Software |
Previous version |
Current version |
Remarks |
|---|---|---|---|
REACT |
16.14.0 |
17.0.2 |
https://github.com/facebook/react/blob/main/CHANGELOG.md#1702-march-22-2021 |
Bootstrap |
3.4.1 |
4.6.0 |
|
React-bootstrap |
0.33.1 |
1.6.6 |
https://github.com/react-bootstrap/react-bootstrap/releases/tag/v1.6.6 |
React-bootstrap-daterangepicker |
4.1.0 |
5.0.0 |
https://www.npmjs.com/package/react-bootstrap-daterangepicker/v/5.0.0 |
LMD |
2.1.2-12 |
2.1.4 |
About WOCU-Monitoring
WOCU-Monitoring is a monitoring tool that integrates the latest Open Source technologies for monitoring, visualisation, metrics graphing and log management, providing a wide visibility on the status and availability of network elements, servers, databases and workstations (among others) using customised Monitoring Packs.
With the WOCU-Monitoring version called Enterprise it is possible to deploy thousands of IP devices, in a distributed environment, with customizations adapted to each client’s infrastructure.
