Release Notes 51
Publication Date: 09/06/2022
This document deals with the new features, functionalities, improvements and corrections integrated in version 51 of WOCU-Monitoring, responding to the requests and suggestions of our users and the current market needs.
One of the focuses of this version has been the Services Inventory, providing it with new and powerful functions, such as the implementation of massive actions or the ability to export data in various formats.
Our Public API is also growing with the development of two new endpoints, useful for querying data from the monitored infrastructure and obtaining the list of Reports generated in a given Realm.
As a remodelling to highlight, the edition of assets can now be carried out from its own information view with configuration and inventory values. Streamlining and providing greater consistency in each of the operator’s movements within the application.
Work also continues on the optimisation of SNMP queries, reaching an important milestone scheduled in our Roadmap to 2022.
This is not all, the polishing of aesthetic and design details continues with the refactoring of various components of the frontend, along with the development of new custom Monitoring Packs.
Without further ado, we will now take a closer look at all the new features of this new version of WOCU-Monitoring.
1. Different refactorings of the frontend.
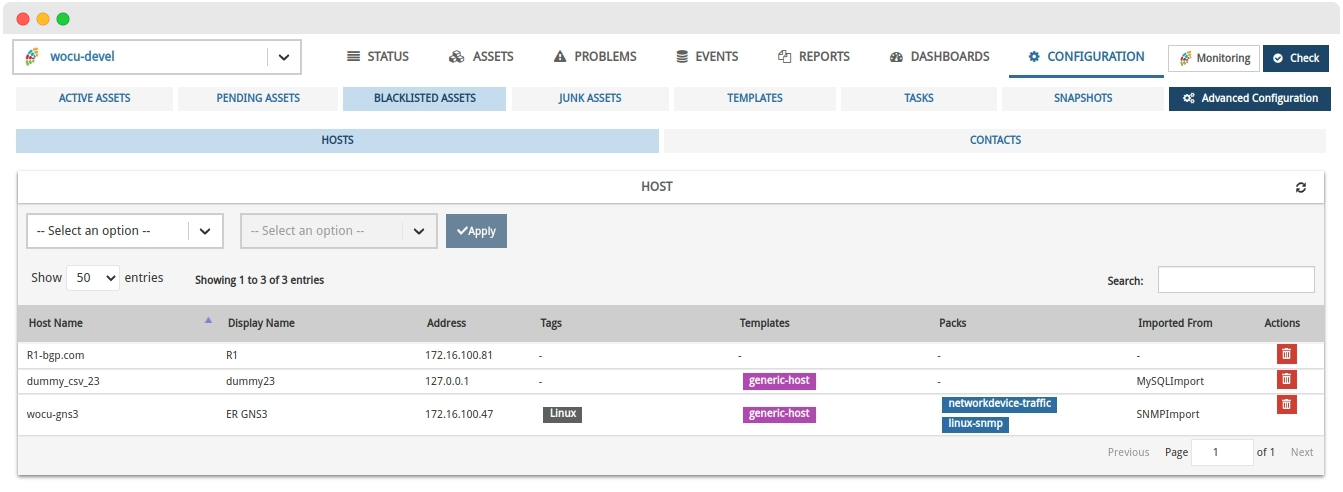
✓ The icons associated with the possible protection states of a Host, in the tables of Hosts and Junk Assets, are renewed.
Closed padlock (🔒): when the Host is protected and therefore cannot be removed.
Open lock (🔓): when the Host is not bound to any dependency, nor subject to any limitation.
✓ Also, by clicking on the Protected icon (🔒) you can access the modal Information on dependencies, which points to the Host Business Processes or Service Business Processes of which the possible Host to be discarded is part of. The same dynamic has been implemented in the Hosts table.
In addition, the Business Process type icon is incorporated in each entry of the table.
✓ Refactoring to REACT 7 technology of the tables integrated in the Templates and Blacklisted Assets sections of the Importing and Configuring Assets module. This change will result in better debugging of load times, improved maintainability and responsive display. A new button for refreshing and updating the table has also been included. Clicking it will force an immediate refresh, independent of the one programmed in the User preferences.
✓ Implementation of a new global component for assigning required permissions, for the upload and display of the following elements:
Widget Host Modal Metrics.
Widget Geomap.
Widgets que integran la vista Host del Modal de Dispositivos.
Table of Host Modal Log Events.
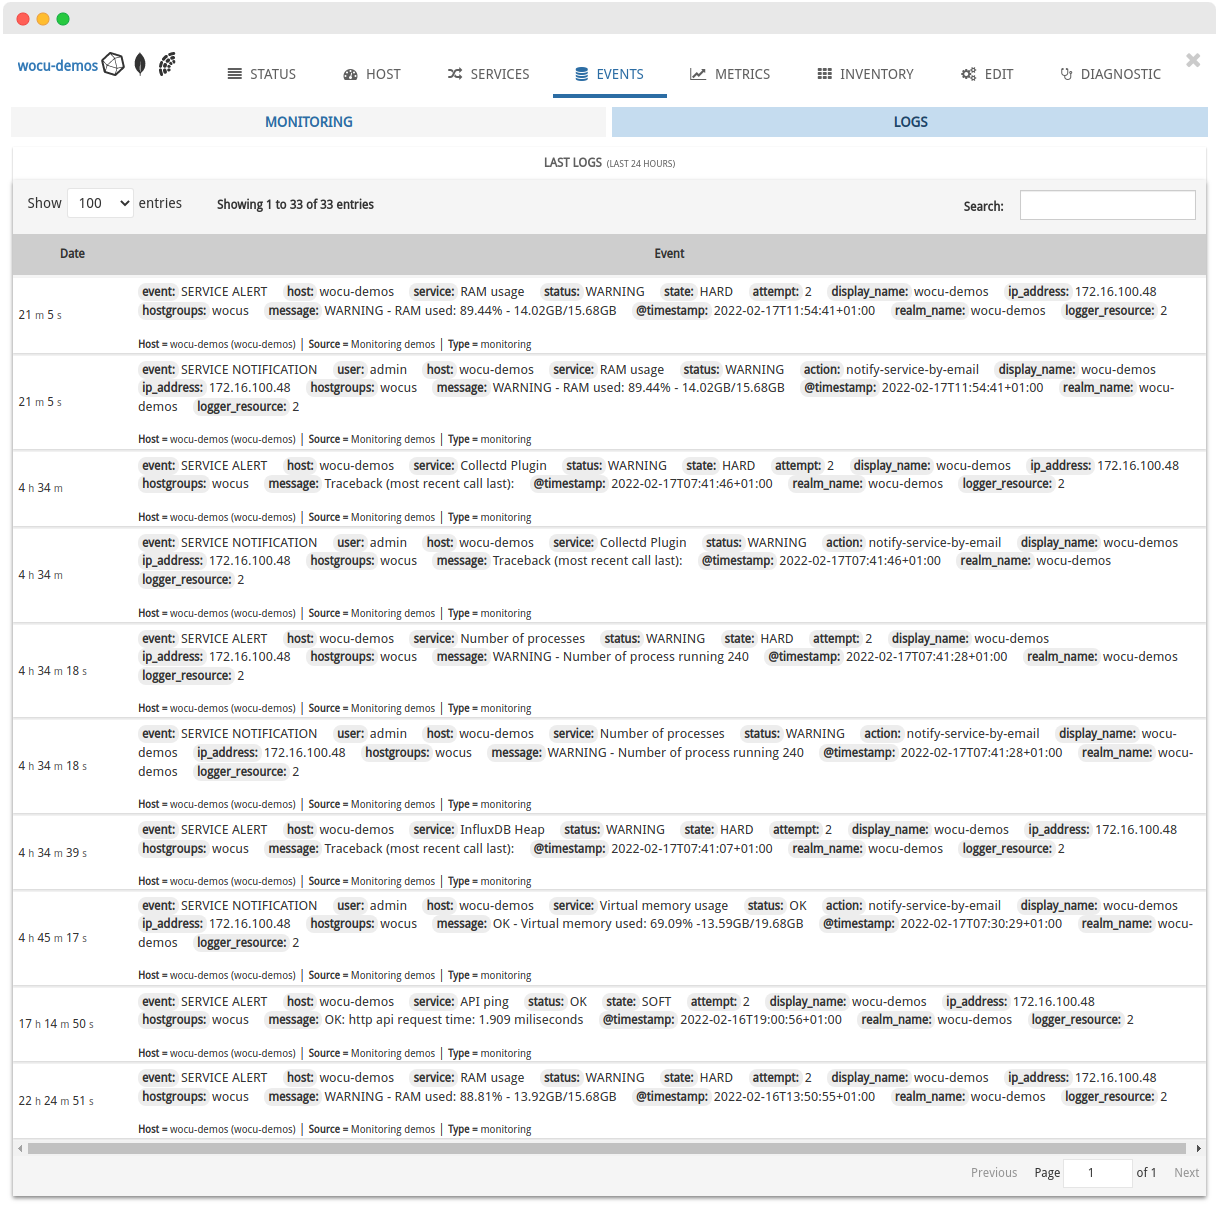
The readability of the Events has also been considerably optimised by transforming the display of the logs in raw JSON format to a flat display grouped in
key-valuepairs.
✓ New responsive setting in certain tables of the application, to avoid content mismatch. These are:
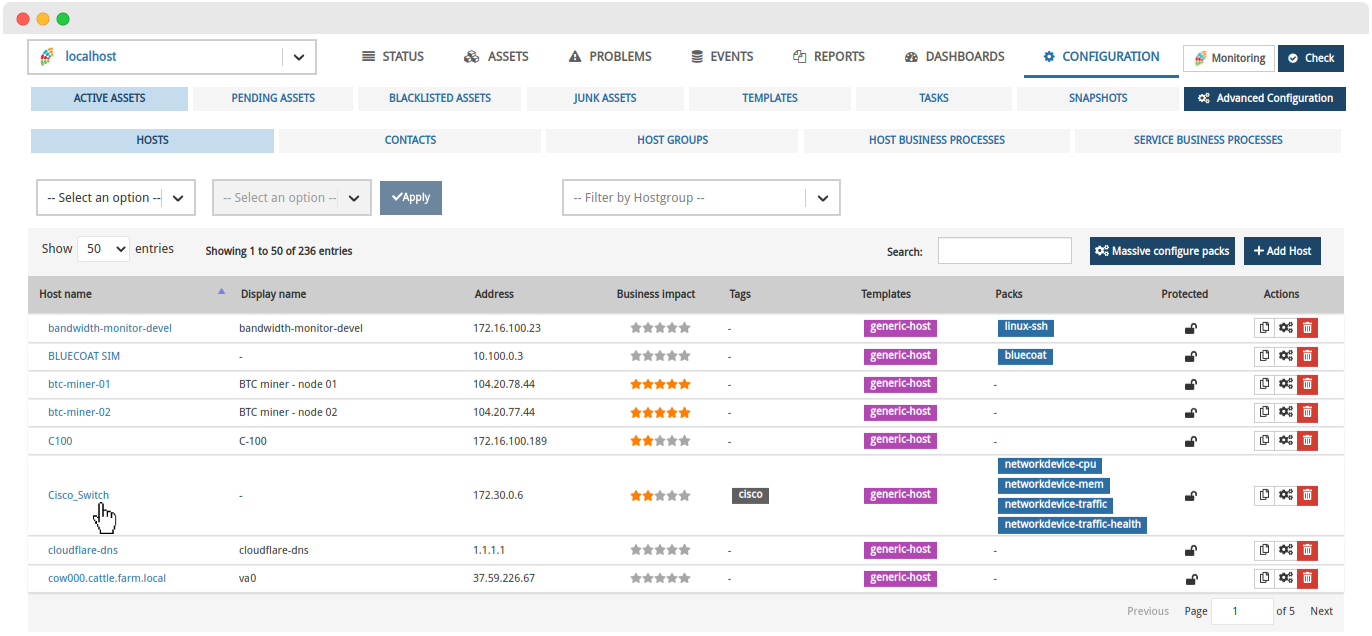
2. New filtering option by Host Groups in Active Hosts.
The management and operation options of elements enabled in the Host Inventory in Active Assets have been extended. Specifically, a new Filter by HostGroups has been added, whose operation aims to narrow down and purify the list, showing only those Hosts (Hosts) belonging to the grouping chosen in the drop-down menu.
The Filter by HostGroup selector includes all Host Groups (HostGroups) managed in the Realm.
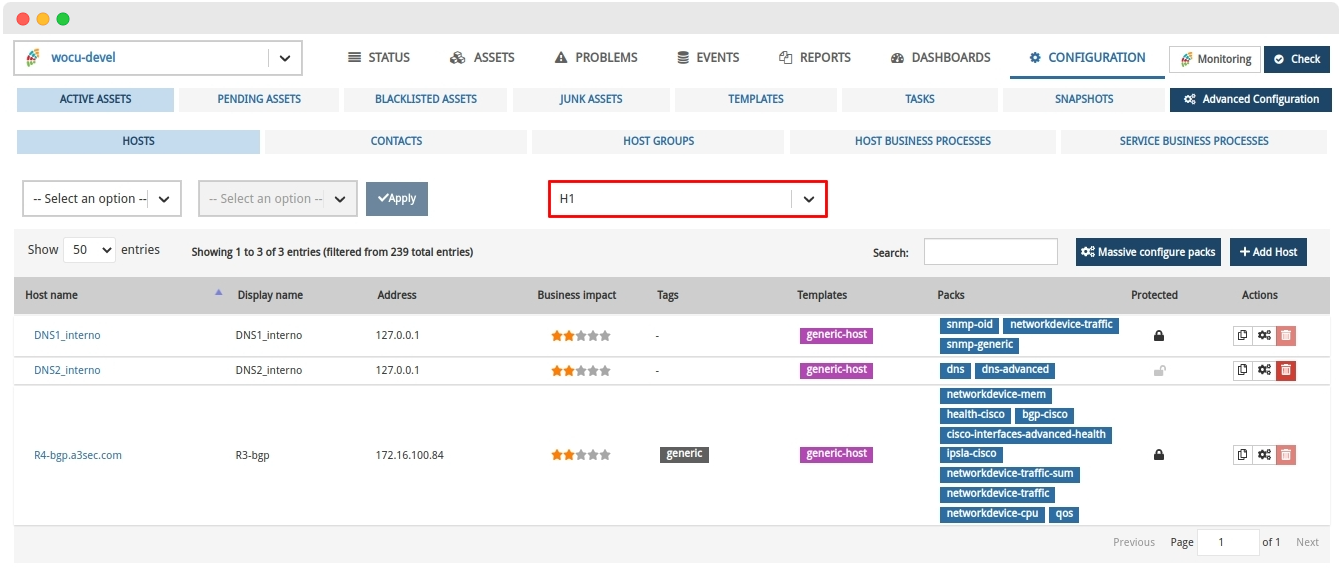
With this new feature, it is possible to perform bulk deletions of members of a Host Group, instead of a much more thorough sweep. This is very useful for large Host Groups.
3. Optimisation in SNMP queries (SNMP Booster)
This new version continues the SNMP query optimisation work started with the improvements introduced in the Traffic pack. In this pack, the net-snmp binaries (these are snmpget, snmpwalk and snmpbulkwalk) are no longer used, but instead Net-SNMP C bindings are used directly, radically improving performance.
The work that has been done in this version is to port the base library for SNMP queries used by all the packs written in Python using the same strategy. It is important to note that the interface has been maintained with respect to the monitoring packs, so it is not necessary to change any of the packs in the wide catalogue available. The performance improvements obtained are more than appreciable, and although it will depend on the type of packs and the queries made in each implementation, in many cases the load on the machines is reduced by more than half.
Reducing the load on the machines means that more hosts can be monitored with the same hardware. But also more agility in running checks, fewer glued jobs and greater overall stability of the monitoring engine.
As an added value, large companies that use WOCU-Monitoring to monitor their infrastructures will see considerable savings in energy costs, thus helping not only to preserve the environment, but also to minimise costs and therefore maximise their profits.
Important
With the development of this functionality, an important milestone scheduled in our Roadmap to 2022 is reached.
4. Integration of new endpoints to the Public API
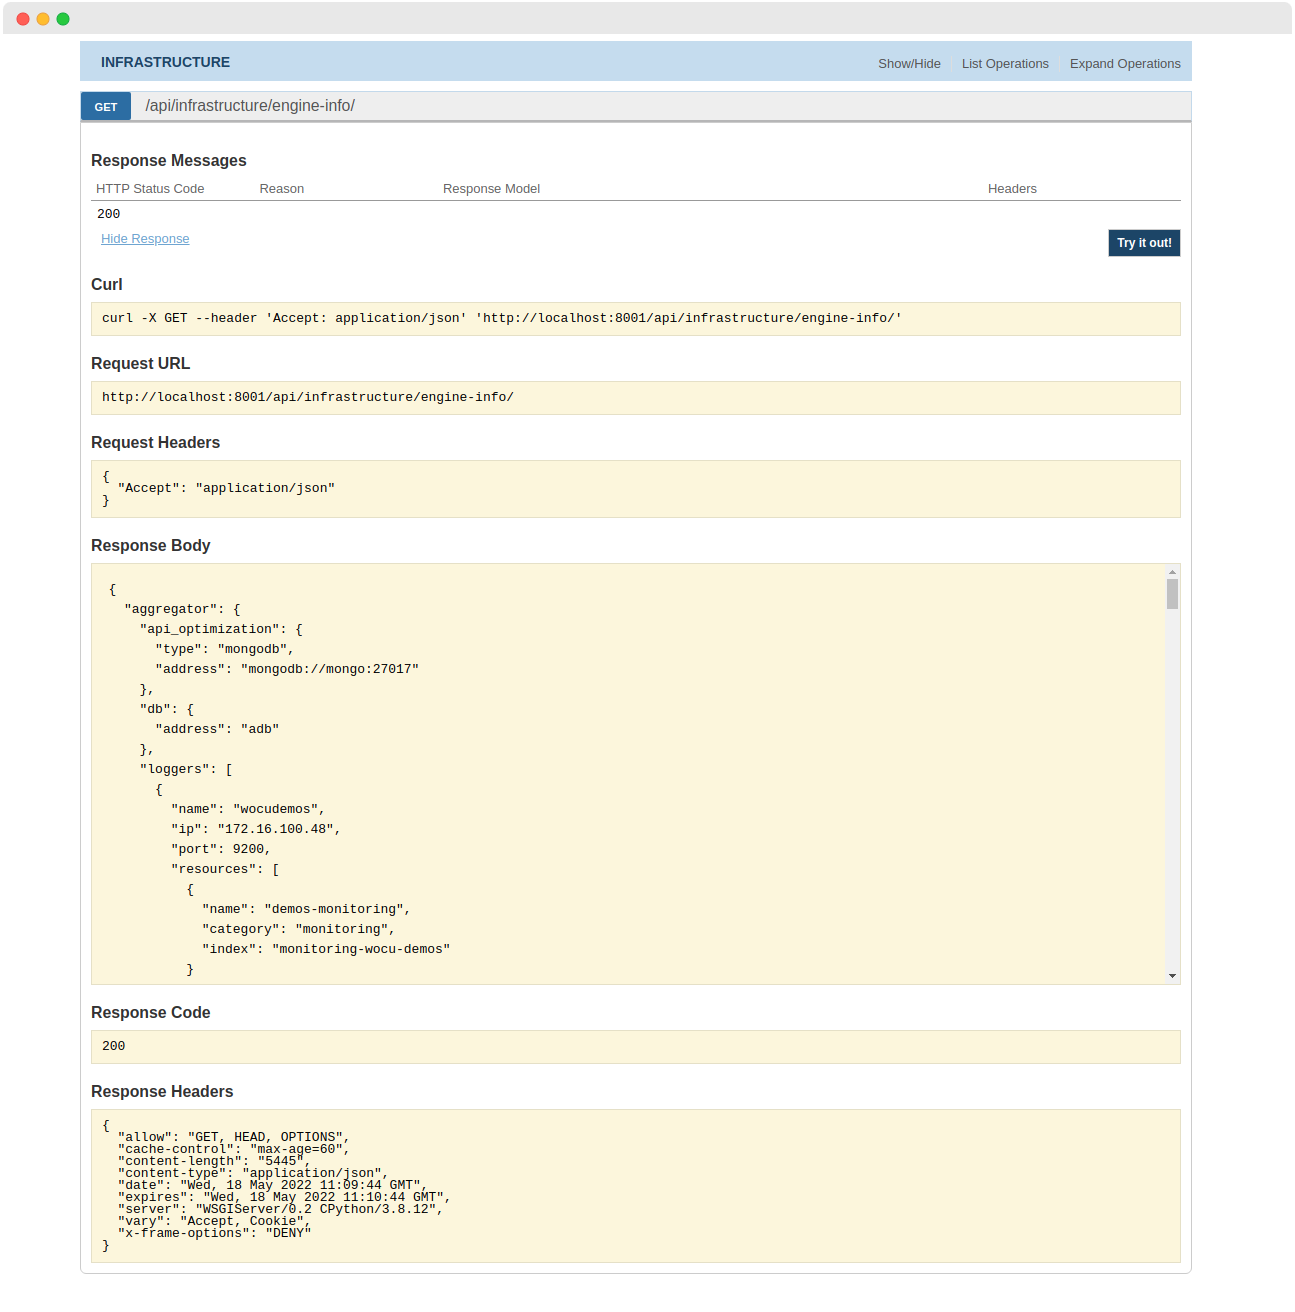
New endpoint for obtaining information from deployed infrastructure
Addition of a new endpoint to our API Public that allows and facilitates to the users administrators of the tool, to have in JSON format all the information about the infrastructure monitored in WOCU-Monitoring.
GET /api/infrastructure/engine-info/
As a result, the components used in each part of the monitoring solution are obtained. Since WOCU-Monitoring scales horizontally, this endpoint extracts detailed information about the infrastructure: nodes that compose it, volume of Realms, services executed, monitoring engines in use, etc.
Important
The development of this specific endpoint is a further step towards reaching one of the milestones scheduled in our Roadmap to 2022.
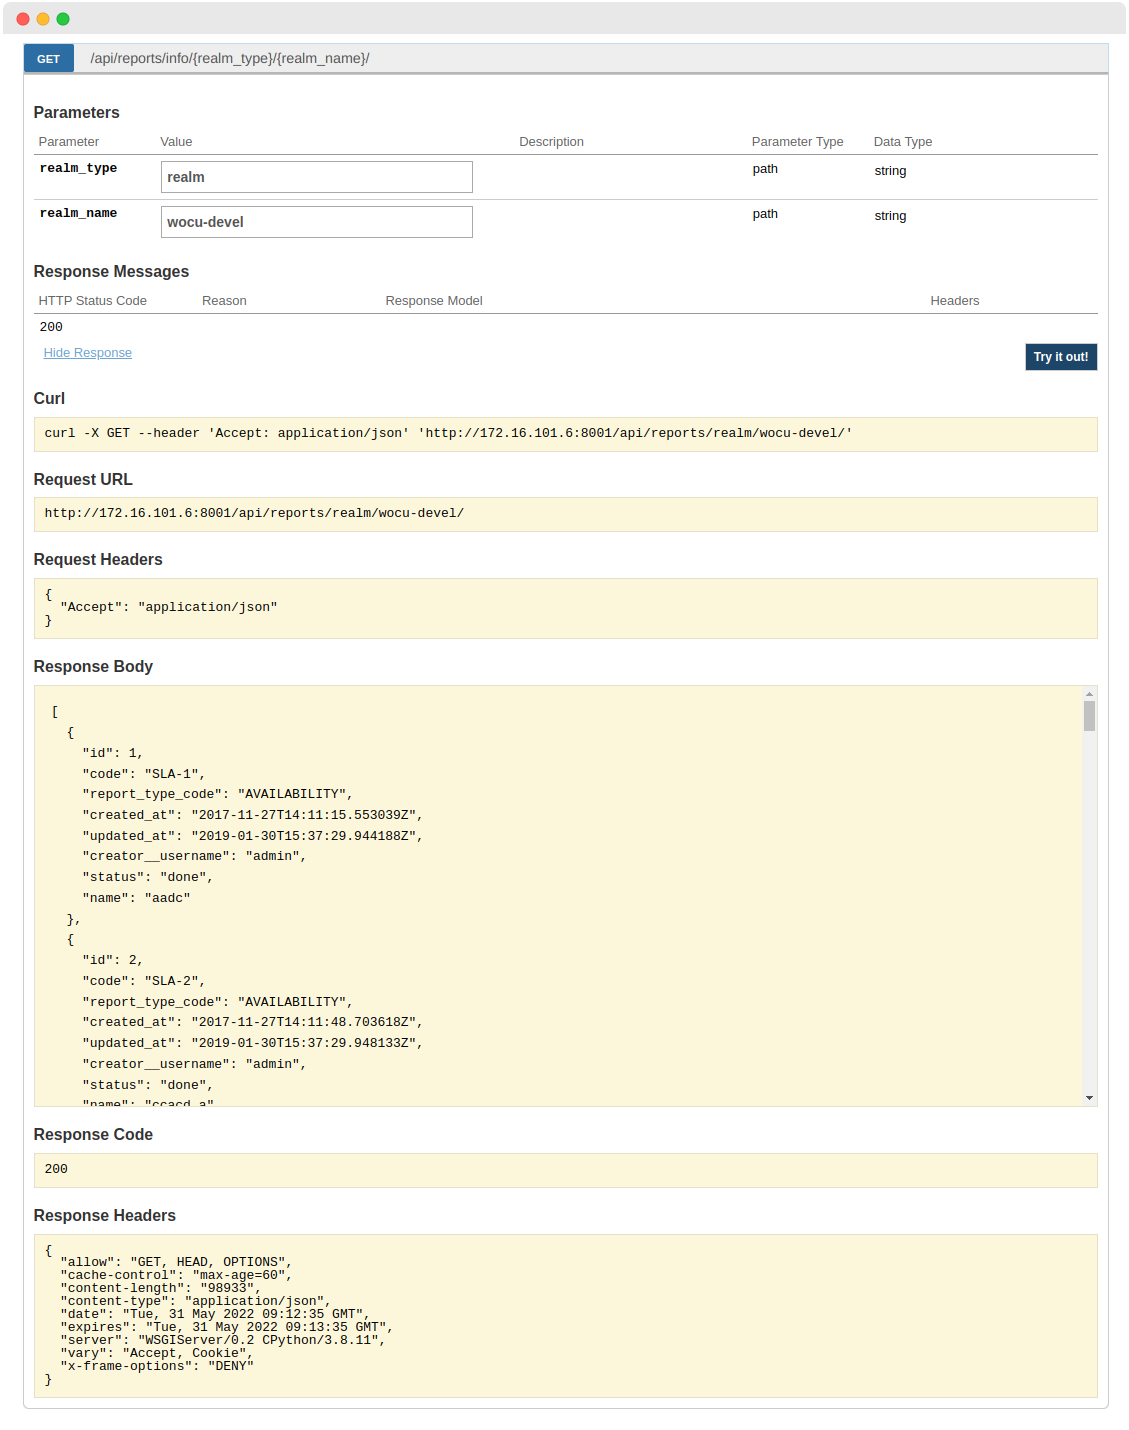
New endpoint to obtain the list of Reports of a given Realm
The API Public of WOCU-Monitoring has been updated by adding a new endpoint designed to query and obtain a detailed listing of Reports managed in a given Realm and which are visible according to the user’s permissions.
GET /api/reports/info/{realm_type}/{realm_name}/
With this endpoint it is possible to quickly and easily consult the group of Reports managed in a specific Realm, which will give us very valuable information about their typology, creator user, creation date, etc., for each of the items returned.
5. Aggregation of various functions in the Service Inventory
Implementation of mass actions
Following the integration of a multitude of operations to be implemented on the elements of the Services Inventory, this version incorporates the ability to apply these same actions on two or more services in a single iteration.
By using the Item selector and Action selector, the operator shall be able to perform the same action on the selected set of items simultaneously.
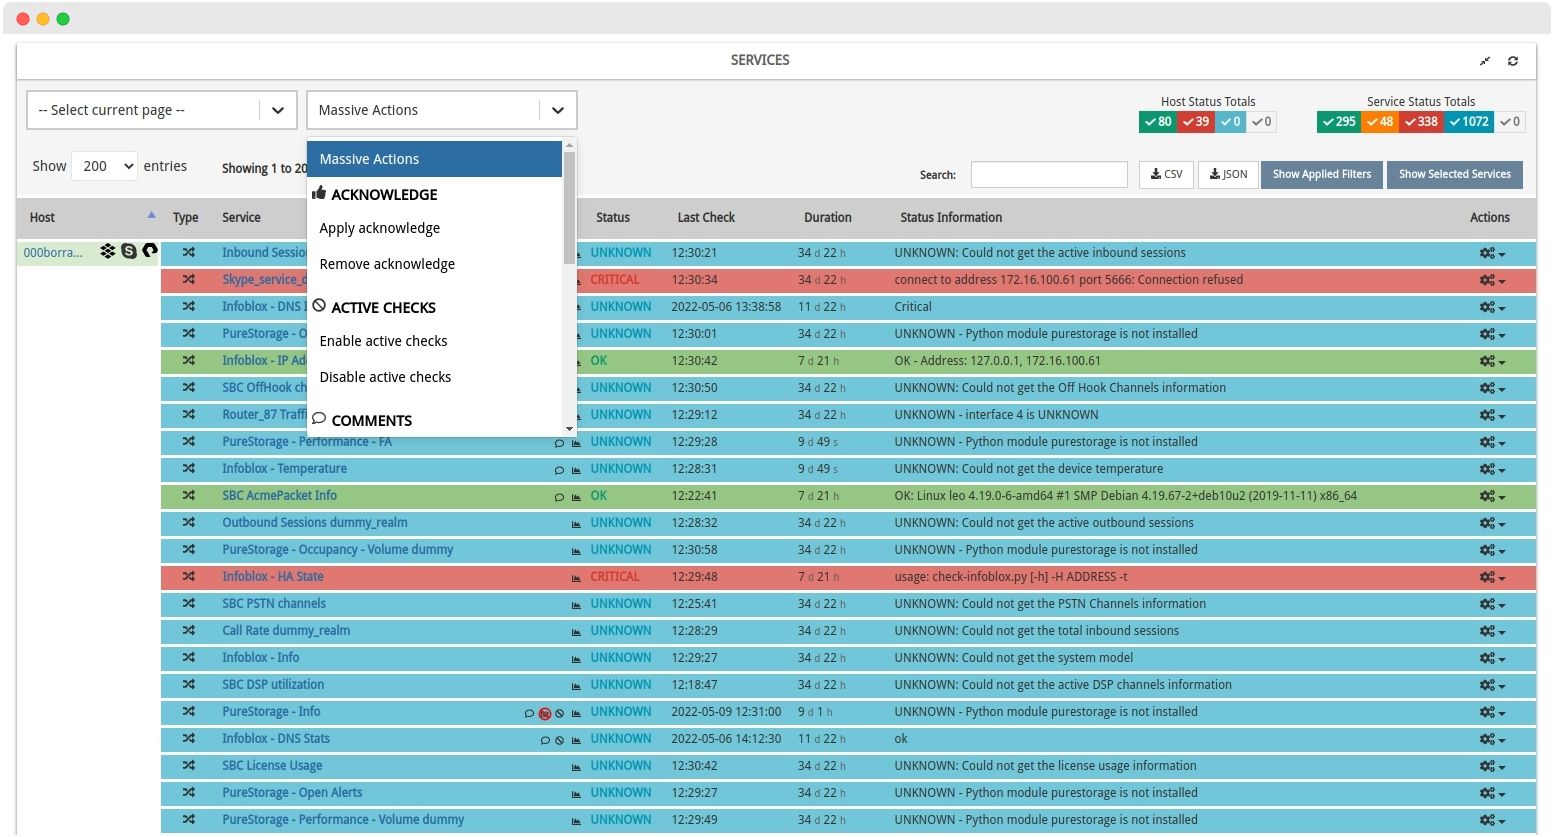
Masives actions allow for more organised management of large amounts of data in large and complex environments.
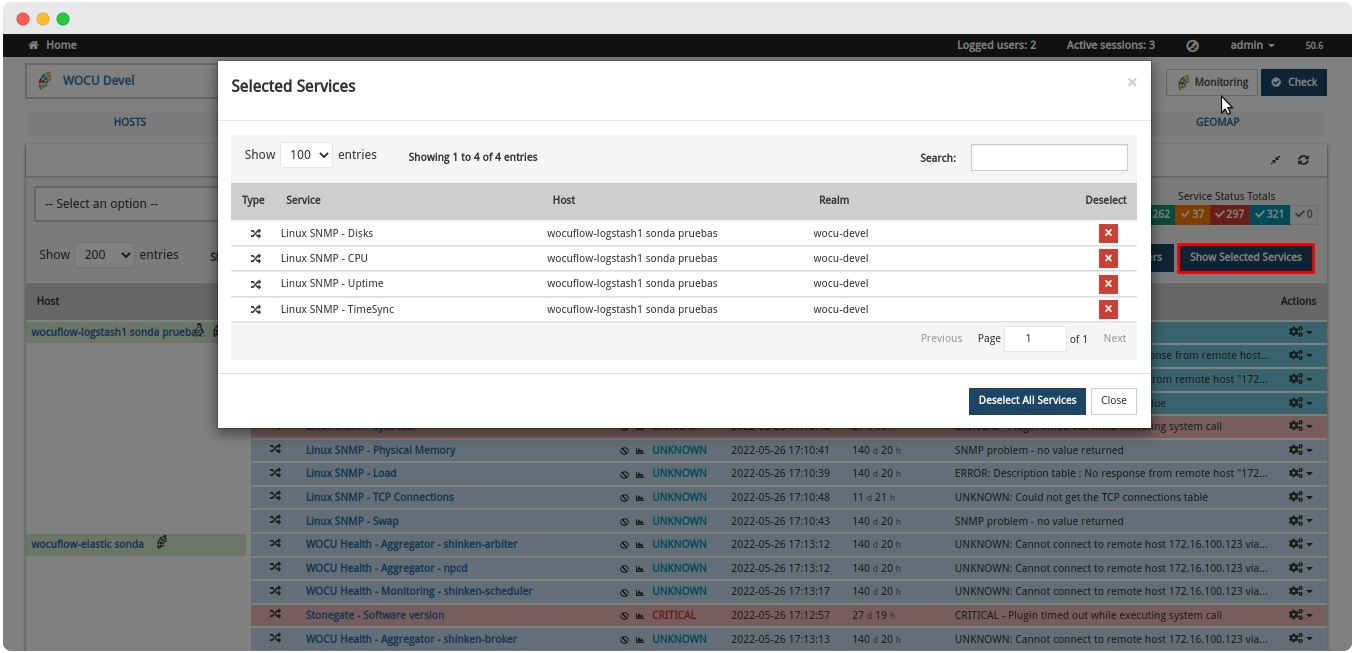
New button for the management of selected services
To support the selection of items for mass action execution or filtering by monitoring status, the Services Inventory has a new Show Selected Services, which acts as a manager of selected services in the list, showing only the items that have been recently chosen and marked by the user.
Ability to export Services and Host Groups
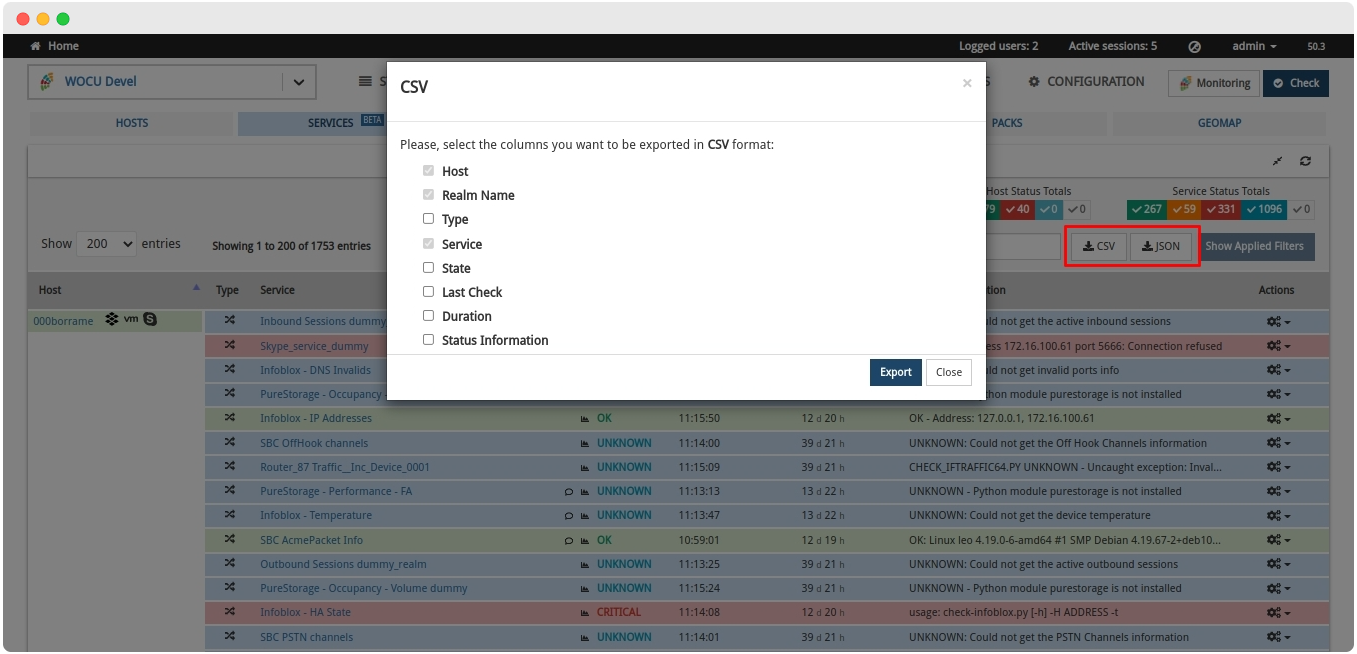
Although WOCU-Monitoring offers a multitude of functions for data management, metrics, graphs, etc., at some point it may be necessary to use other third-party tools to process this information. Therefore, this new version includes the function to export data in CSV or JSON format, which facilitates the download of inventory data for further use and processing.
This new capacity will be available in:
Another new feature is the free choice of data or parameters to be exported. Before downloading the file, a new modal will pop up with a complete list of parameters to be exported in CSV or JSON format.
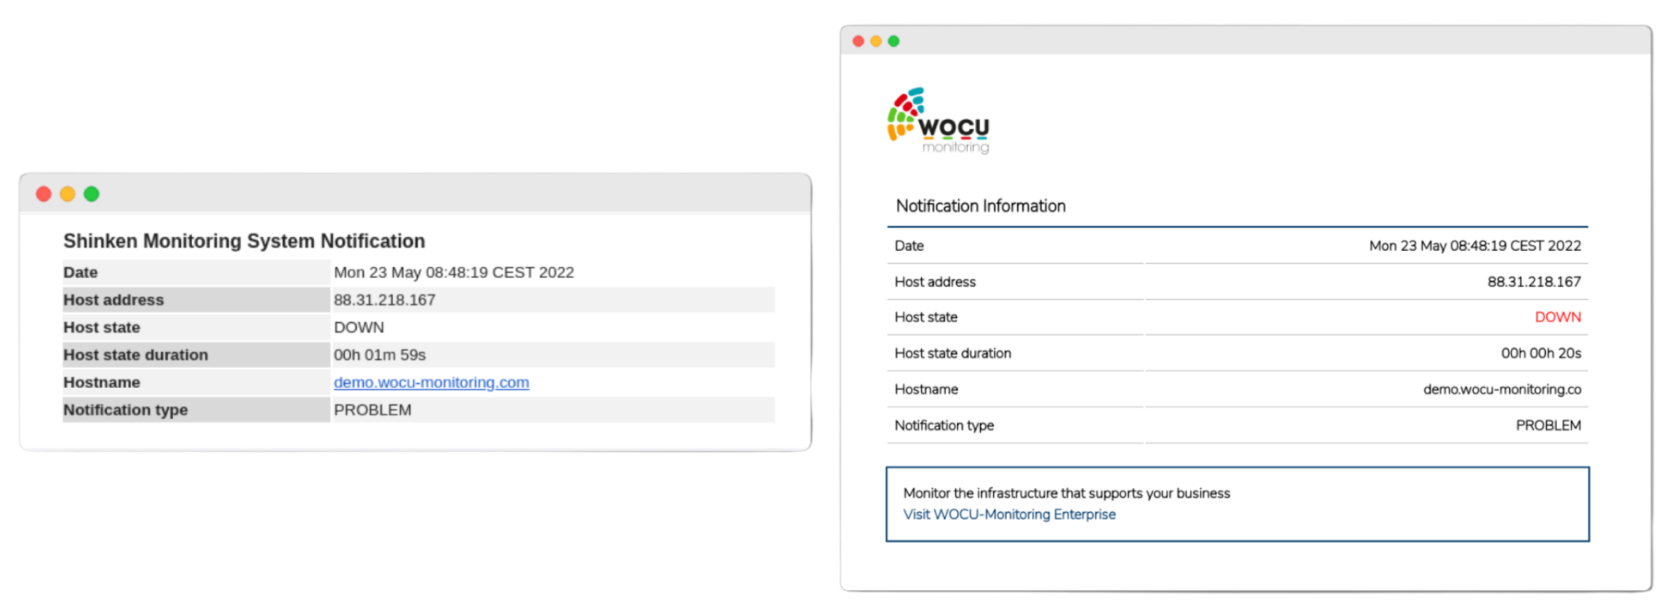
6. Redesign of incoming notifications
The notifications managed in WOCU-Monitoring have been aesthetically redesigned with a more modern, homogeneous look and feel in line with the rest of the application. The previous notifications maintained the style of the Shinken monitoring engine. An engine that we adopted, ported to Python 3 and improved in WOCU-Monitoring.
7. Gconf: Configuration management on network hosts
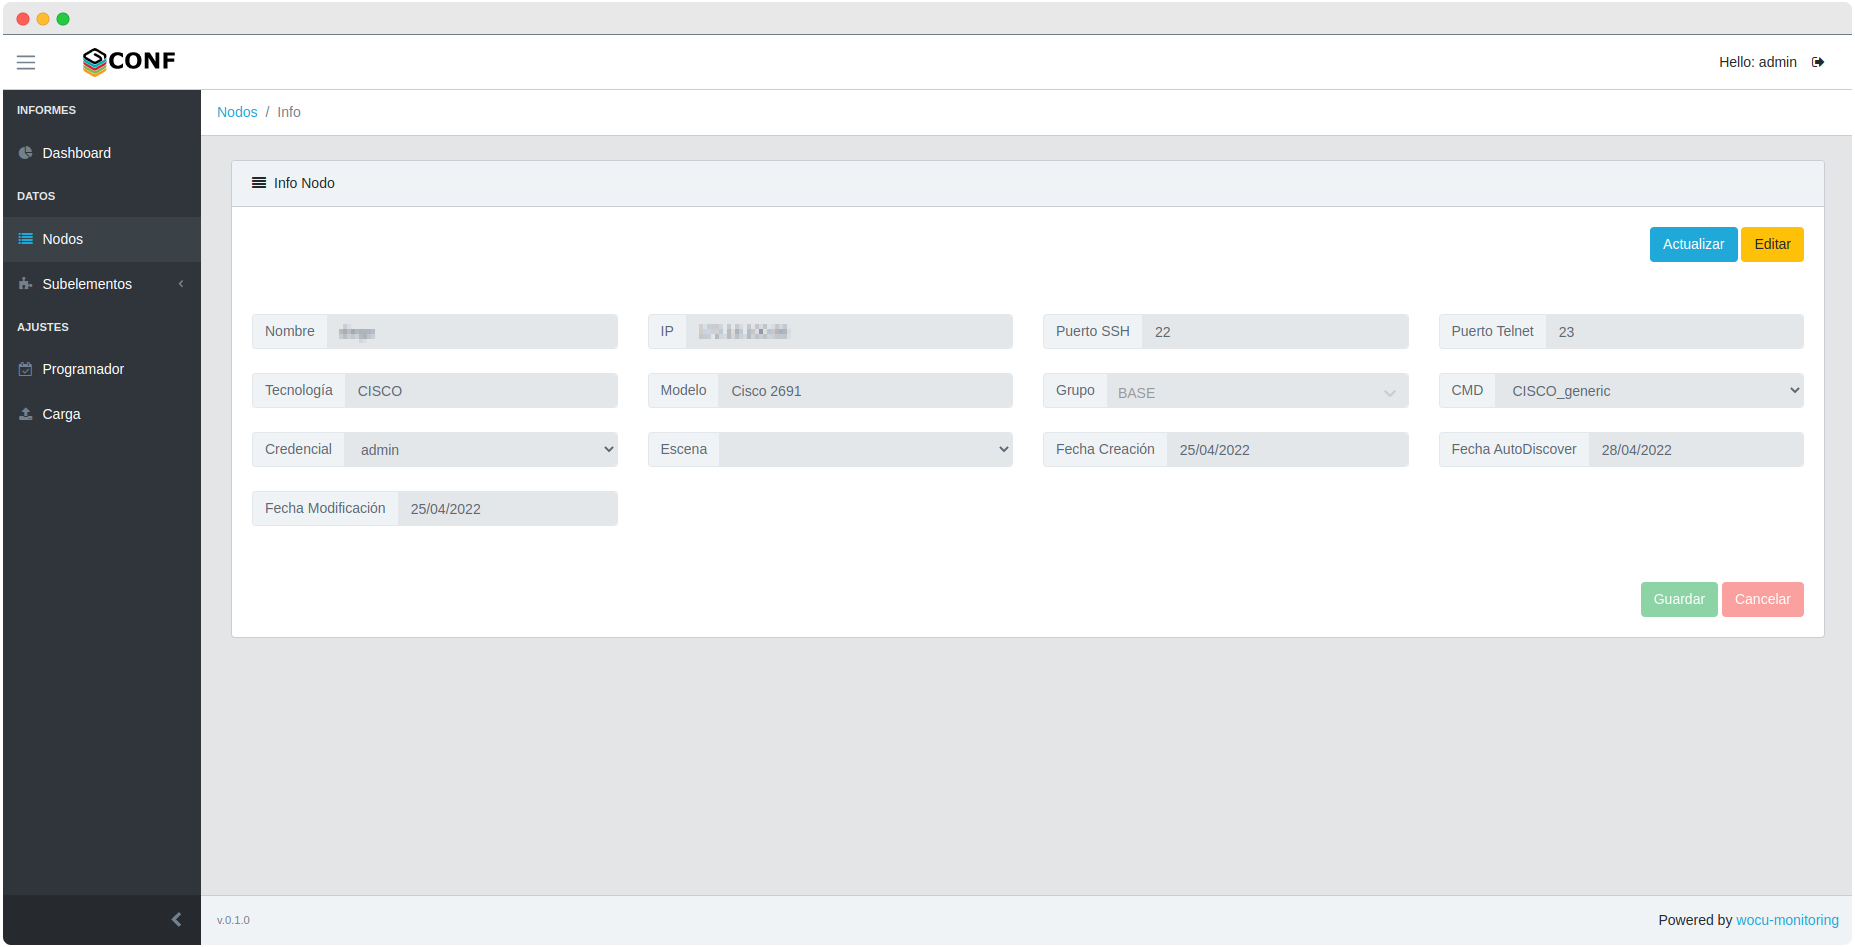
What is Gconf?
Gconf is another of the tools of the WOCU-Monitoring ecosystem, aimed at the comprehensive and unified management of the configurations of the network equipment managed and monitored. Gconf is independent of the main WOCU-Monitoring application, as it has its own management interface that allows all functions to be carried out in isolation.
Improvements and developments
In this version, work has been done to improve certain aspects relating to the security of the application:
The management of credentials in the database has been improved by encrypting all information.
The management of backups has been improved by encrypting the configuration files of managed hosts.
Access to the
APIdocumentation is denied by default. It shall be configurable in case you want to query it for integration from an external application.
8. Editing assets from your own Information Modal
We have focused on restructuring the actions to be performed on different assets, with the intention of gaining agility and coherence in each of the operator’s movements within the application. To do this, we have distinguished between basic actions, such as: viewing and editing the asset configuration; and secondary actions, which will vary according to the nature of the asset, such as: duplicating, monitoring, deleting, assigning monitoring packs, etc.
Accordingly, all elements underlying the Monitored Assets, Pending Assets and Templates sections will have new functionality for viewing and editing an element’s configuration.
From now on, clicking on the name of a specific item will bring up its corresponding detail view with the configuration and inventory attribute values recorded:
In addition, configuration changes can be made from the information modal itself. Through the new Edit button, you can access the editing form to make changes in the different parameters and attributes of the chosen element.
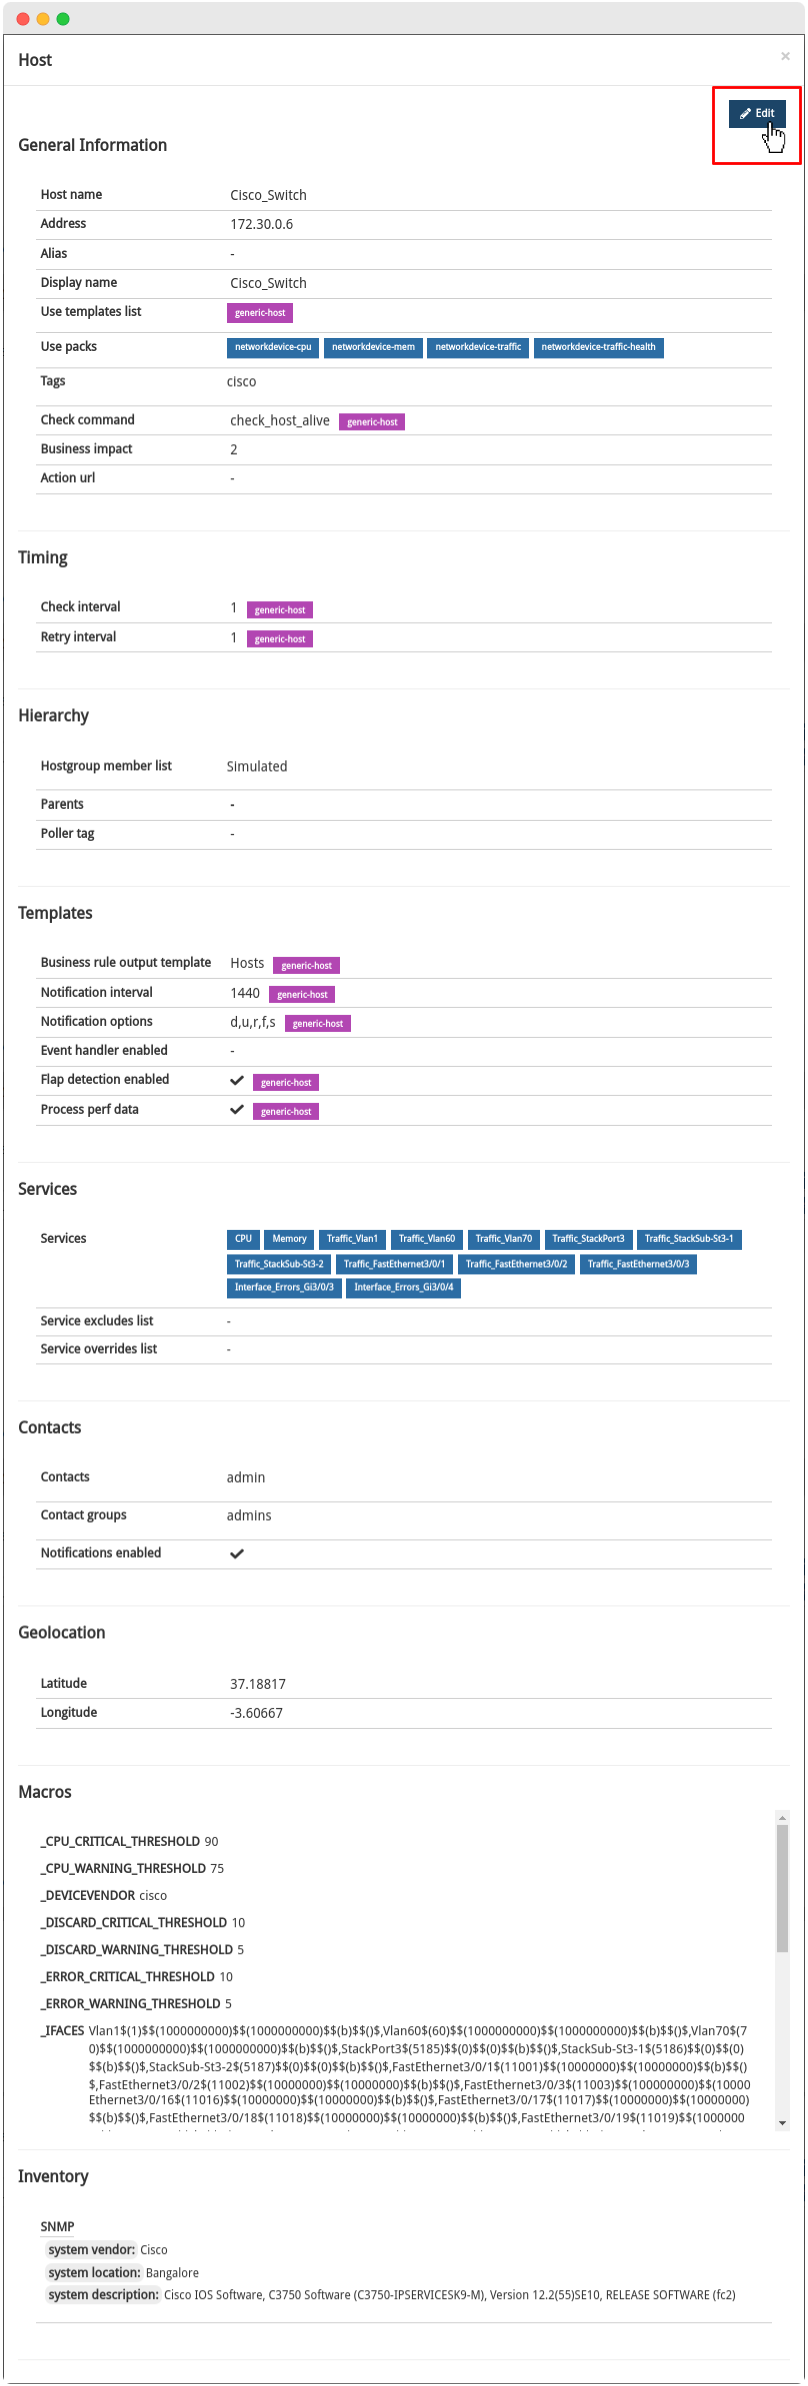
In future versions, this new modality will be extended and standardised for the rest of the assets managed in WOCU-Monitoring.
9. Monitoring packs
See our catalogue of Monitoring Packs in the following link.
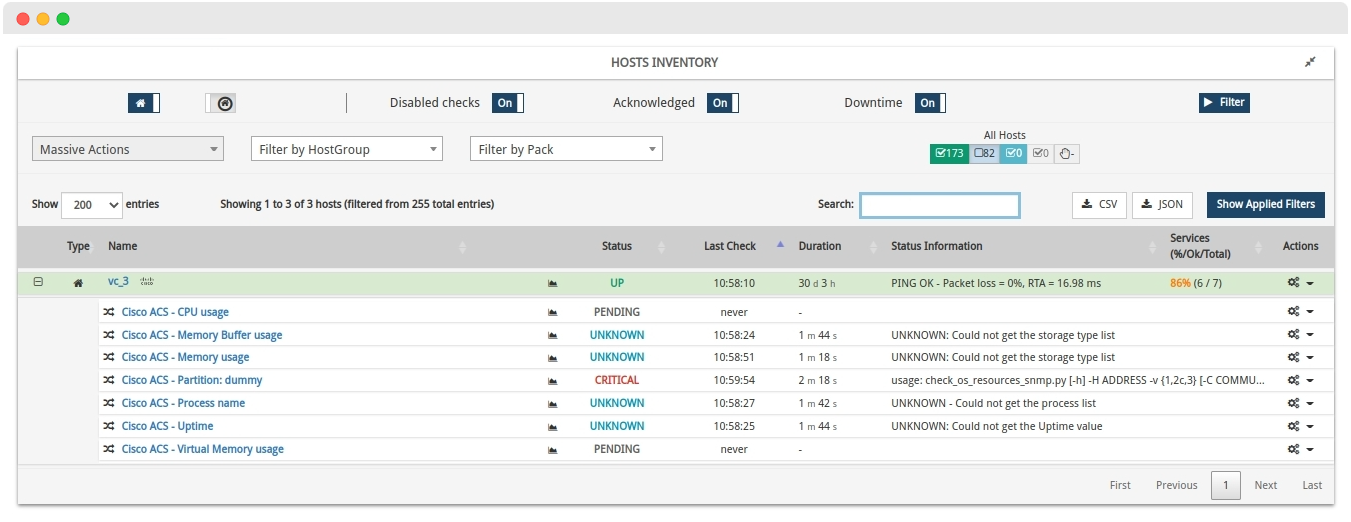
New Cisco-acs pack

The new Cisco-acs pack that monitors the Cisco Access Control Server (ACS) hosts has been added to the catalogue. The services included in this monitoring pack are:
CPU Usage: monitors CPU usage.
Memory Buffer Usage: monitors memory buffer usage.
Memory Usage: monitors physical memory usage.
Partition: monitors disk partition usage. A partition discover is included so you can select the partitions you want to monitor. A service will be created for each monitored partition.
Process: monitors the status of a process. A discover of processes is included to select the ones you are interested in monitoring. A service will be created for each monitored process.
Uptime: shows how long the equipment has been switched on.
Virtual Memory Usage: monitors virtual memory usage.
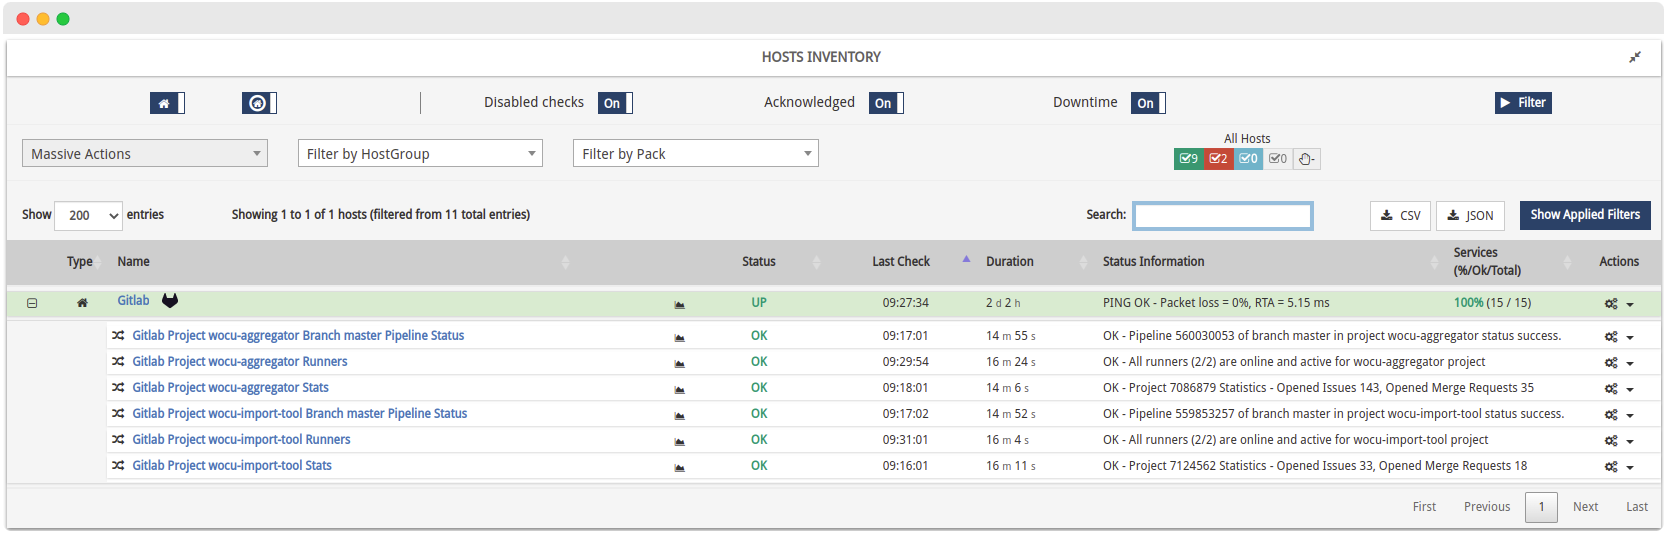
New Gitlab pack

A new pack called Gitlab has been designed and incorporated for the monitoring of various aspects of the projects on this platform. This monitoring pack includes the following services for each of the projects configured by the user:
Project Runners: monitors the status of the runners associated with the project.
Project Pipeline Status: monitors the status of the last pipeline of the main branch of the project.
Project Stats: monitors various project statistics, such as the number of open Issues and Merge Requests.
New support for Enterasys hosts

Support has been added for CPU and Memory monitoring on Enterasys hosts. This extension extends to generic packs whose monitoring services include the measurement of CPU usage and memory consumption.
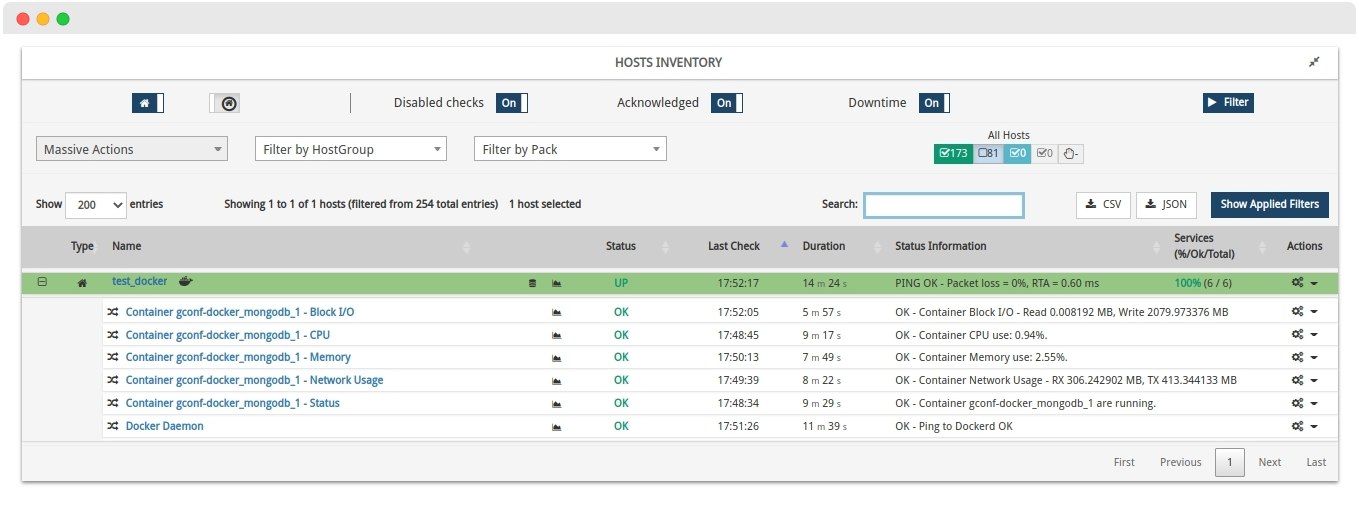
New Docker pack

The new monitoring pack Docker has been designed to monitor the status and statistics of Docker containers. The services included in this pack are the following:
Docker: monitors the state of the persistent process that manages the containers.
Container Status: monitors the status of the container.
Container CPU Usage: monitors the CPU usage of the container.
Container Memory Usage: monitors the memory usage of the container.
Container Network Usage: monitors the network usage of the container.
Container Block I/O Usage: monitors the amount of data read and written by the container.
Important
This development advances one of the commitments defined in our Roadmap to 2022.
New Checkpoint-ipso pack
A new pack has been added to the catalogue for the monitoring of Checkpoint hosts with the IPSO operating system. This addition completes the list of packs applicable to this security product manufacturer.
The pack includes the following services:
Current connections: monitors the total number of concurrent connections and the rate of connections per second.
CPU usage: monitors CPU usage.
Memory Usage: monitors memory usage.
Partition: checks the usage of the different partitions. A discover script is included to select the partitions to monitor.
Process: checks the status of critical processes. A discover script is included to select the processes to monitor.
TCP total active sessions: shows the total number of active TCP sessions.
TCP established sessions: shows the number of TCP sessions in
establishedstatus.Uptime: shows how long the host has been booted.
Users: shows the number of users registered in the tool.
New versions of the HP and Dell packs

As part of WOCU-Monitoring’s effort in the latest versions to control and reduce power consumption, the Dell-server-hwinfo and Hp-server-hwinfo packs have been enriched with new services that monitor the power consumed by the servers of these brands.
The monitoring services include new metrics that will allow us to generate a historical record and to detect higher than normal wattage consumption.
Other improvements and fixes
Every new version is full of small changes, fixes and optimisations that should be briefly highlighted. We list the most notable ones in this release:
In the output modal of the Add comment to service action applicable in monitored-services, the Host and Service to which the record belongs are now listed.
Fixed a bug in the Configuration of Monitoring Packs modal of the Templates section, where the Template ID name was erroneously being incorrectly set to that of a Host. The
Host_namefield has been changed toTemplate_name.Modified the style of several tables in the application, in order to harmonise and structure their presentation, as the content sometimes exceeded the tables.
The default ordering of Hosts present in the Services Inventory has been adjusted.
Fixed an issue in the display of the
check_commandinside the host modal, when displaying a Host Business Processes.Fixed a bug in the operation of the selection/deselection button of the values discovered by the Discover action.
The possibility of modifying the visibility (public or private) of a report from the Centralized Report Management is operational again.
The Realm Selector has undergone the following changes:
Display of all available Realms, instead of presenting only the first 20 elements.
The string search option included in the selector now works exclusively through the
Display_nameattribute.Changes in font size and associated icons to achieve a more harmonised and homogeneous design.
The sort order set in the Tasks Table is preserved after a refresh and update of data.
From this version onwards, during the Configuration of Monitoring Packs (Packs), the Discover action associated with Complex Macros will be accompanied by the checkbox Disallow update values (unchecked by default), useful to block the update of values during the discovery process performed on this macro.
New filtering option for realms based on Host Groups within the global Realms listing of Aggregator’s Configuration module.
Parameter checking in Host Health Diagnostics threads has been optimised, evaluating only what is necessary to launch an operation.
From this version onwards, when a task is executed, the data displayed in the Tasks Status Table will be immediately updated.
Optimised the tables Host Groups and Packs, in particular:
The height of the rows in both tables has been reduced, increasing the space available to display more information.
The colours of the monitoring status indicators have been dimmed when their value is
0, in order to focus all attention on the rest of the indicators. In addition, the action of linking to other tables will be blocked in this case.
New informational text in the action of delete a Host in Monitored Assets, detailing the current protection status whereby the Host cannot be deleted. In order to be able to perform such an action, the Host must be unlinked from the Business Processes specified in the dialog box.
New function to show/hide filters applicable on Services Inventory elements. It is identified by the icon of arrows converging when filters are visible, and arrows pointing to the ends when they are hidden.
In the table Host Modal Services a dash (-) shall be displayed in the Next Check column when a service has disabled the execution of monitoring status checks.
In addition to assigning icons to Hosts according to the associated Monitoring Packs, from now on, the system will also take into consideration the value of the
DEVICE_VENDORmacro, which contains the manufacturer of the Host it describes.From now on, the Realm Selector will be disabled when there is only one Realm, with no other options to choose from.
Fixed a bug, which did not redirect the user correctly when the credentials expired, returning an access denied.
Any bulk action executed in the application shall be accompanied by a loading spinner during processing. They are also included in the data requests of the Contacts tables.
The size of panels and widgets located in the Dashboards module is increased, for more clarity in the interpretation and reading of data.
Refactoring for the removal of duplicate code in the tables migrated to the application’s
REACT.Relocated the error message about missing data, shown in the modal logged_users.
From this version onwards, when Discovering a macro of a Monitoring Pack, only the values in reference to the fields marked as unique, specified in each pack configuration file (.cfg), will be updated. Also, the system will not support spaces, comma (,) and semicolon (;) in the query and addition of macros, returning instead a low slash (_).
The styling of the bulk action selectors throughout the application has been modified, providing a more homogenised style.
The delete and send actions to Blacklisted are available again for certain assets located in Monitored Assets and Pending Assets.
Fixed a bug that prevented new Business Processes hosts from being added to the Monitored Assets and Pending Assets inventories from the Administration Module.
The Home returns the list of Realms in ascending alphabetical order (A-Z).
Fixed the display of a Realm’s Events registration widget when the user did not have the necessary permissions in the Reports module.
Modification of the behaviour of the paging selectors, always obeying the last option chosen.
Admission of the character
&in the term identifying complex macros.Fixed a bug where trying Add a new Realm (+ New Realm) would not correctly redirect to the Login view when permissions expired.
The delete action in table Hosts is now disabled on Protected Hosts, due to its link to Business Processes.
Upgraded software
As always, other pieces of software have been incorporated and updated in this new version of WOCU-Monitoring:
Software |
Previous version |
Current version |
Remarks |
|---|---|---|---|
Python3 |
3.8.12 |
3.8.13 |
|
Ruby |
2.1.9 |
2.7.4 |
https://www.ruby-lang.org/en/news/2021/07/07/ruby-2-7-4-released/ |
Memcached |
1.4.31 |
1.6.15 |
https://github.com/memcached/memcached/wiki/ReleaseNotes1615 |
Django |
3.2.12 |
3.2.13 |
|
Supervisor |
4.1.0 |
4.2.4 |
https://github.com/Supervisor/supervisor/blob/master/CHANGES.rst#424-2021-12-30 |
Gettext |
0.18 |
0.21 |
https://lists.gnu.org/archive/html/info-gnu/2020-07/msg00009.html |
Ncurses |
5.9 |
6.3 |
https://lists.gnu.org/archive/html/info-gnu/2021-11/msg00001.html |
NRPE |
2.13 |
4.0.3 |
https://github.com/NagiosEnterprises/nrpe/blob/nrpe-4.0.3/CHANGELOG.md |
NagVis |
1.9.11 |
1.9.33 |
|
OpenSSL |
1.0.2s1 |
1.1.1l |
|
Libevent |
2.0.22 |
2.1.8 |
https://raw.githubusercontent.com/libevent/libevent/release-2.1.8-stable/ChangeLo |
JQuery |
1.11 |
3.1.0 |
About WOCU-Monitoring
WOCU-Monitoring is a monitoring tool that integrates the latest Open Source technologies for monitoring, visualisation, metrics graphing and log management, providing a wide visibility on the status and availability of network elements, servers, databases and workstations (among others) using customised Monitoring Packs.
In addition, the Enterprise version of WOCU-Monitoring called Enterprise allows deployments of thousands of IP hosts, in a distributed environment, with customisations tailored to each customer’s infrastructure.