Release Notes 0.40
The following are the new features of the 0.40 version of WOCU Monitoring.
We continue to add value to WOCU and increase its usability by incorporating new functionalities. Such as the filtering of Problems according to the duration of the incident, which allows to evaluate and act according to its criticality and control the impact of each alert in the business processes; or adding new workspaces with the new tab Dashboards, reserved for the export and integration of dashboards elaborated in external tools, but of complementary use to WOCU.
This version includes important improvements in relation to the configuration of Assets. Among others, the possibility to exclude a specific service from a specific Host, without having to remove the entire monitoring pack, stands out. Also, thanks to the new action Differences in the Pending Assets list, the user is provided with a comparative table between Host versions, which have been rediscovered after the release of a new task and which present variations in their configuration. Both functions make the Asset monitoring options much more flexible.
On the other hand, we continue to update the look and feel of the tool, with new aesthetic changes that show an even clearer and more cohesive design.
In parallel, our catalogue of Monitoring Packs continues to grow steadily with new packs and services, as does the refactoring of numerous WOCU components to REACT technology.
And finally, in relation to the documentation we provide, our User Manual continues to be enriched with new use cases that streamline the handling and management of WOCU.
In conclusion, this latest version continues to work on maintaining the robustness of the operational flow, since in addition to centralising all data on the status of IT infrastructures quickly and efficiently, it is possible to control adverse situations during monitoring and to react proactively in time.
Without leaving behind the integration of different market needs that continue to position WOCU as the strategic tool that covers all the monitoring requirements that an operator needs to have a complete technological network under control.
But there’s more, read on for a complete list of what’s new in this version of WOCU and get the most out of all the latest features.
Interface
New filtering option by duration on the Problems page.
WOCU shows in both tables (hosts and services) of Problems, those elements that are not in a normal operating state (UP/OK). In complex environments, there can be a large volume of issues that need to be examined and dealt with by the operator. Because of this, as a measure to speed up the processing of alarms, a new selector has been included that makes it possible to filter problematic Hosts and Services according to the time that the incident has been active.

The selector has multiple options: more than 30 minutes, more than 2 hours, less than one day, etc. The flexibility in filtering allows to respond to queries such as: display only Hosts that have been in a critical state for more than 2 hours (typical service level for many customers).

Remember that the joint use of filters and actions available in the interface allows a more organised management of the currently active alarms.
Note
More information can be found at: Filtering by Duration.
New Dashboards tab for displaying dashboards by Realms
WOCU offers as a complement to its functions a series of OpenSource tools (Grafana, Panorama, Nagvis, etc.), which, although they work independently, allow the export and integration of different resources in WOCU to generate customised dashboards, which will be visible in the Dashboards tab of each Realm.
Therefore, this new view centralises different graphs, topological maps, statistical tables, diagrams, etc., exported from external tools to WOCU, under configuration and choice of the Administrator.
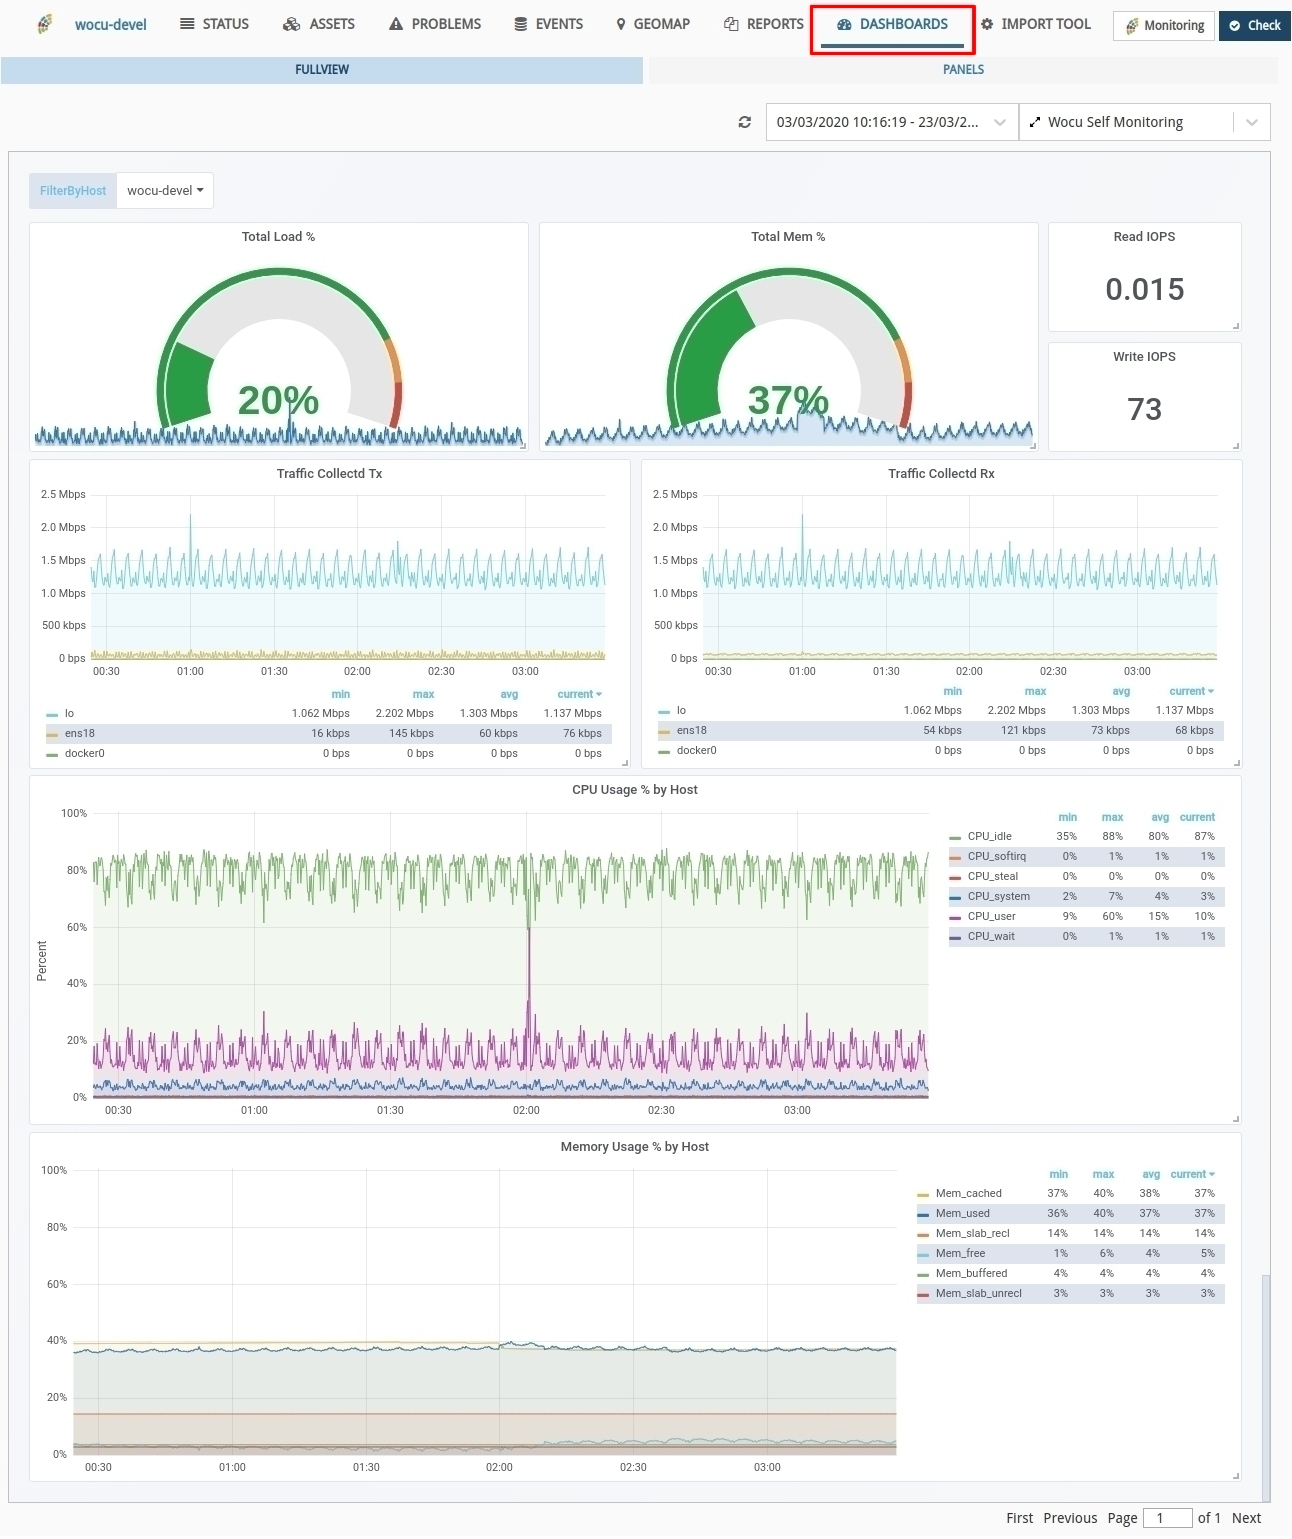
Thanks to the versatility of WOCU to manage an infinite number of metrics, tables, databases, etc., of different types and origins, it is possible to generate dashboards with powerful graphic capabilities that show, for example, the behaviour of monitored infrastructures in real time, favouring the resolution of incidents, or the logical relationships and interactions between applications in a local network, by means of network diagrams.
The tab consists of two possible views:
- Fullview
Displays a single dashboard (with corresponding panels) per view.
- Panels
Displays up to 10 panels per view, distributed over several pages. If you want to display a specific panel, select it in the drop-down menu above and the view will be updated with the marked element (hiding the rest of the panels).
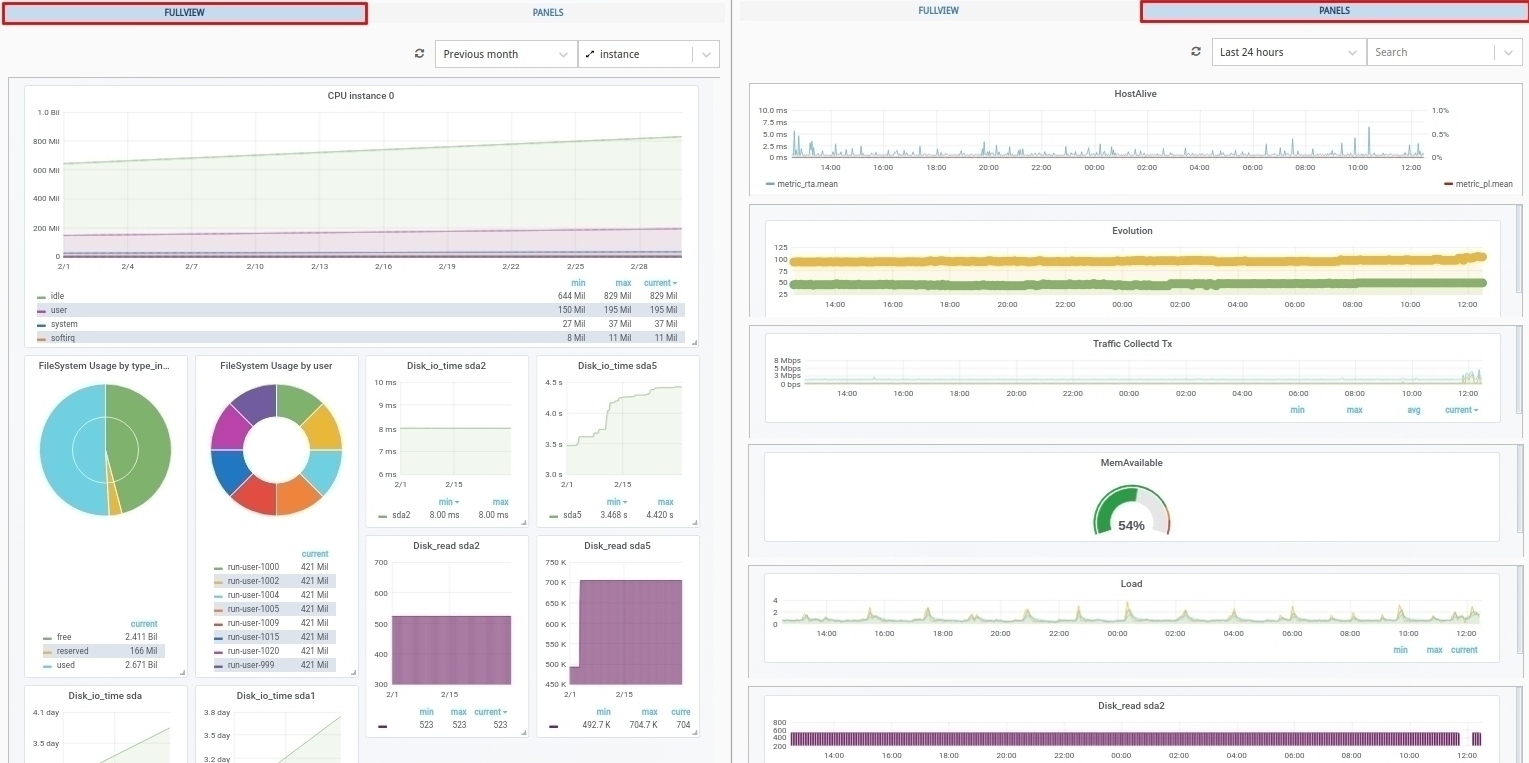
To highlight several issues:
1. The configuration of this view is completely free and will depend on the Administrator’s needs and use cases. The configuration will be carried out only by system administrators, but will be visible to all other users.
2. From the Advanced configuration of the Import-tool, the Administrator will be able to link and manage dashboards. It is as simple as adding the
URLof the elements you are interested in adding to your dashboard.3. Both views have options for filtering, paging and refreshing data, which facilitates the interaction and processing of dashboards, which can sometimes be quite complex.
4. WOCU allows customisation of the distribution of the elements that make up each view at the user’s discretion. It is as simple as dragging and dropping panels to their new location, or resizing them by adjusting their size.
In conclusion, this version takes advantage of all the possible options for graphing and rendering dashboards, with the aim of reducing time in routine user tasks, resolving incidents, consulting external tools, etc. WOCU continues to position itself as a convergent and centralised tool that unifies and manages several modules from a single console.
Note
More information can be found at Dashboards.
Filtering by Host Group in all reports
Prior to this release, only in Availability Reports, Availability Periods Reports and Multimetrics Reports it was possible to filter by Host Group during configuration.
From now on, this option will be integrated in all reports, being added in:
Remember that with this configuration parameter it is possible to filter the data collected and reflected in reports, showing only those related to the Host Groups (Host Group) existing in WOCU.
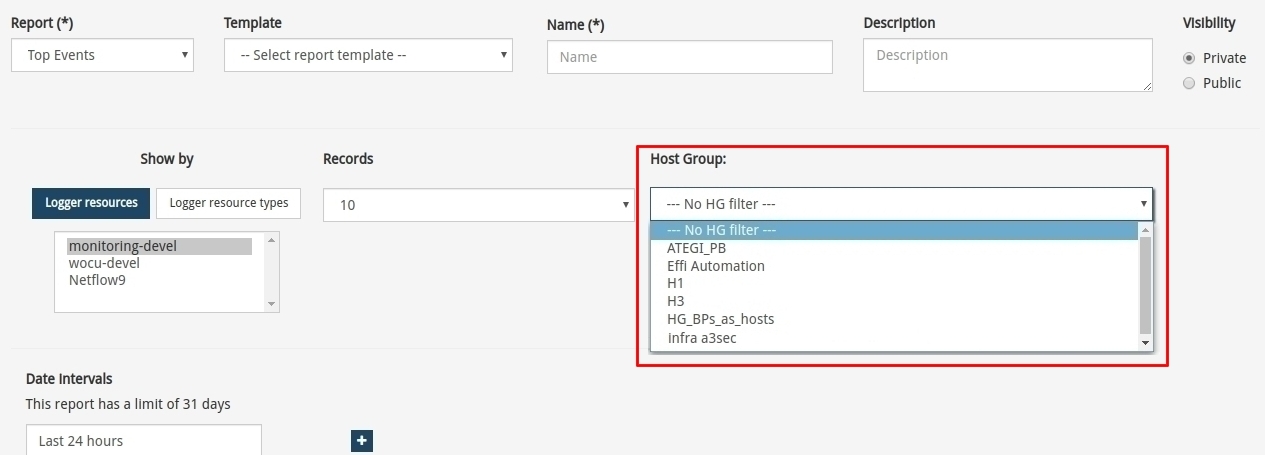
To select and filter the results of the report by a specific Host Group, simply choose the name of the group from the drop-down menu Host Group. All the groups registered within the realm will be displayed. To deactivate the filter, the user must choose the option No HG filter that appears first when the list is displayed.
New interface aesthetic changes
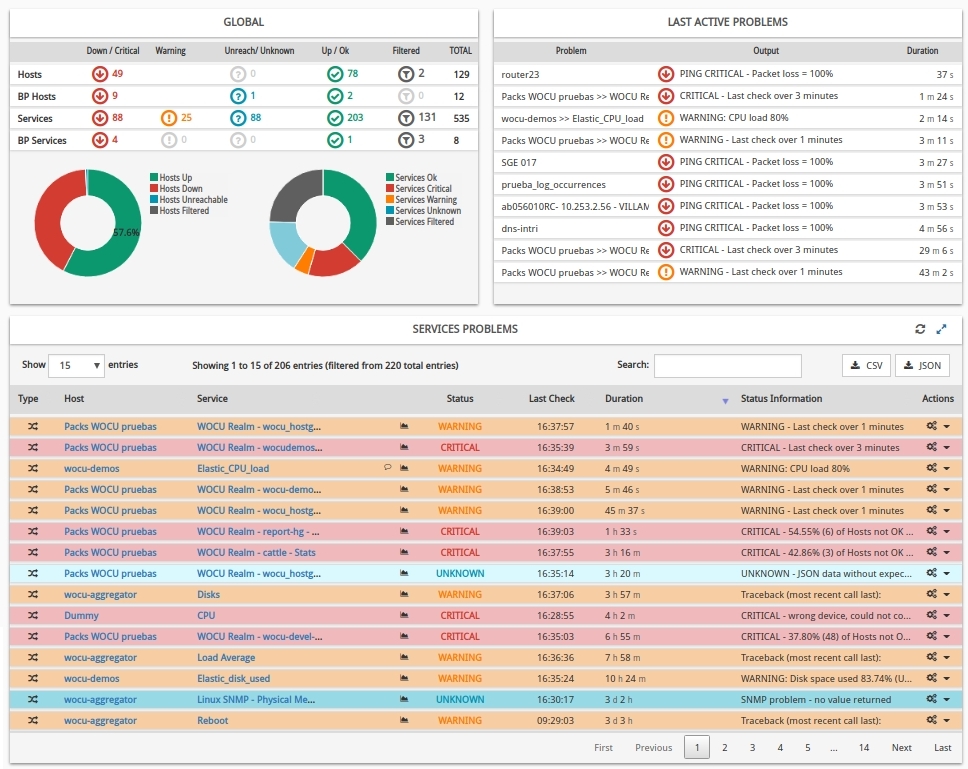
WOCU continues to improve its image by adding new aesthetic adjustments. In this version, the view of tables and widgets has been slightly modernised, with an even clearer and more cohesive design, highlighting headers, maximising the space or incorporating a new font, in short, details have been polished to improve the user experience while using the tool.
This update is not only aimed at a more modern look and feel, but also at a clear visualisation of data in a user-friendly and intuitive environment such as WOCU.
Improvements in the configuration
New info window on differences between newly discovered Host versions
The workflow or life of a Host in WOCU is summarised as follows:
1. Its import by executing Import Tasks (Tasks).
2. It is provisionally moved to the inventory of Pending Assets. From that moment on, the Host is integrated in the WOCU DB, but not yet monitored.
3. From this point, the operator may send the Host to monitoring (Monitored Assets) or discard it in this and future updates by sending it to the Blacklisted Assets.
Remember that during the execution of tasks it is possible to rediscover Hosts that are already being monitored, i.e. items that were previously scanned and imported and that with the execution of another task, a new version of the Host (with different properties) is discovered, passing in a first instance to the Pending list.
In relation to this, a new action has been added for each Host in the Pending Assets table, called Differences.
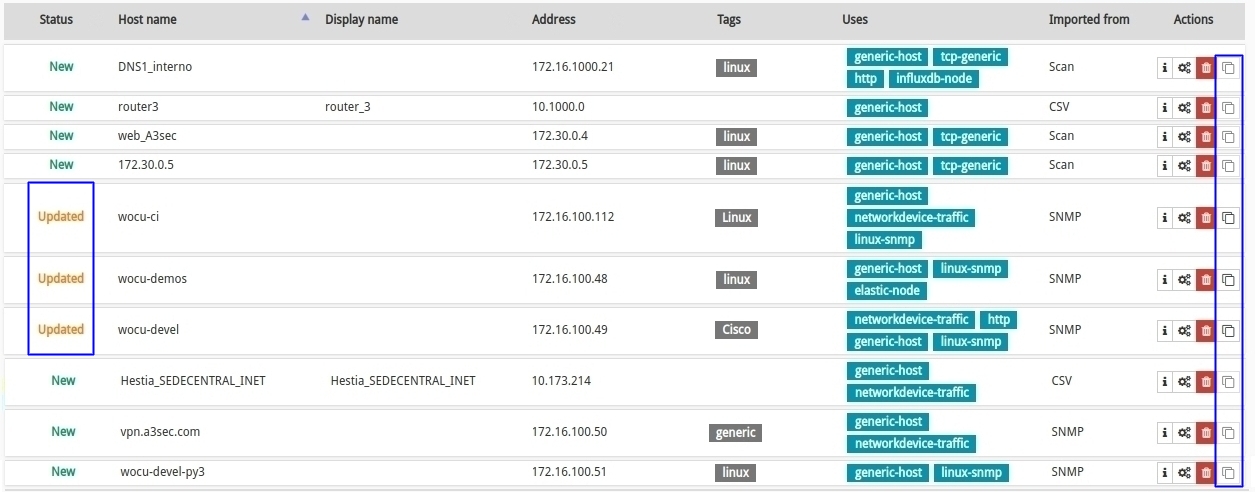
Attention
This button will only be enabled for Hosts that reach Updated status.
This action is purely informative, where a tabular format is used to present the main differences in the configuration of a Host that has been rediscovered and, consequently, is once again included in the database of pending assets.
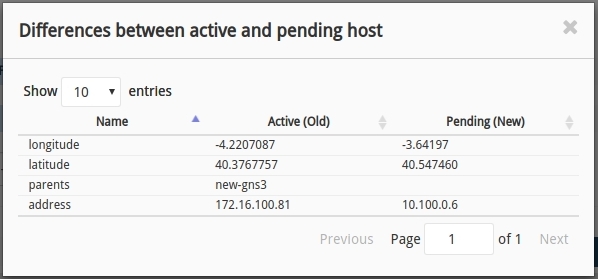
From this information, the operator will be able to see the differences between the two versions, and decide whether to upgrade the Host or to discard the latter version and keep the original one.
At the moment it is only possible to accept all changes, but in future versions it is intended to include the possibility to select certain fields.
Note
More information can be found at: Actions from the Pending Hosts list.
New service configuration fields from the Hosts edit and registration form.
As we already know, WOCU allows you to monitor different types of hosts by applying Monitoring Packs. A Monitoring Pack is a predefined configuration profile, which performs a certain monitoring function. Each of them includes a set of predefined services to monitor.
As there is a wide variety of packs and associated services, WOCU offers the opportunity to exclude certain services without having to remove an entire pack. See our Monitoring Packs Catalogue for details of the services that each pack manages.
For convenience, it is now possible to configure Host services from the WOCU interface without having to access the administration backend. In particular, the Advanced service configuration section has been added to the Host editing forms, with the following fields:
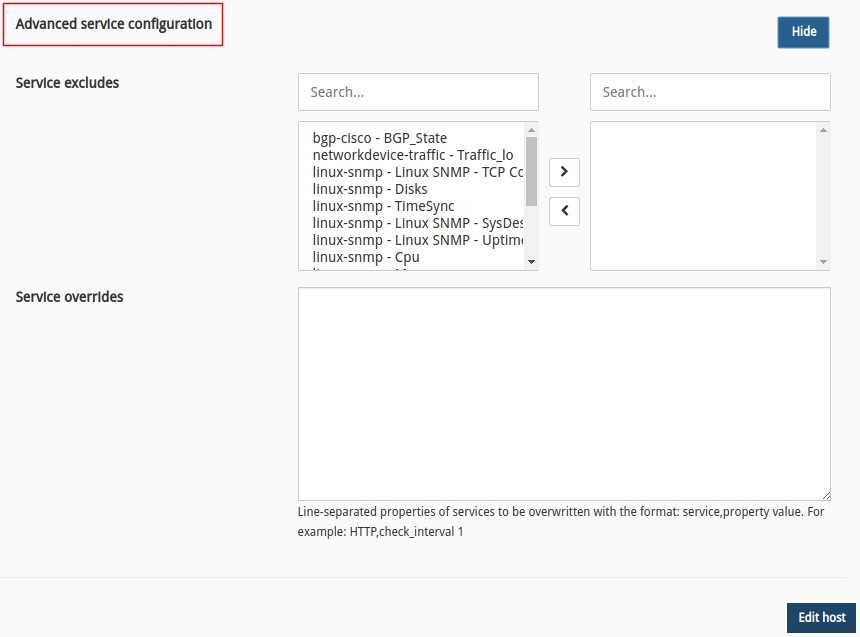
1. Services exclude: the first block lists all the services that are associated with the Appliance, as they belong to the monitoring packs currently assigned to it. Services that are moved to the second block will be excluded from the Host configuration.
The procedure for inclusion and exclusion is simple, select the services of interest from the list of both blocks and use the < or > options to the adjacent block.
2. Service overrides: this field allows you to overwrite the values of the directives of a given service for a specific Host, regardless of the value preset by the pack that distributes that service. By default, the services have predefined parameters for their directives (configurable variables). Therefore, from this field it is possible to change these values for each of the services individually and according to the operational and functional needs.
This listing must be composed of a single service directive per line, maintaining the format:
service,directive value.
Examples
Modify for the CPU Stats service, the time period for sending notifications to contacts, from 24x7 (predefined value in the pack) to 24x5. To do this, you will have to overwrite the directive with the new time criteria:
CPU,notification_period 24x5
Modify the service name HTTP, with a new display_name to display a new service name in the interface:
HTTP,display_name web A3sec
These configurable fields are available in the following forms:
Note
More information on these configuration parameters can be found in: Add Host.
Documentation
New use cases in the WOCU User’s Manual
Two new use cases have been added to the User Manual:
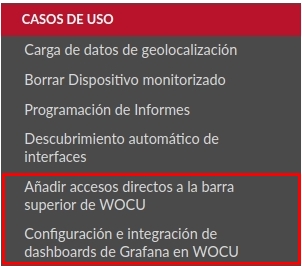
Adding shortcuts to the top bar of WOCU-Monitoring.
The process of configuring and embedding new shortcuts to the main toolbar from the Advanced Settings module of WOCU is described in detail.
This licence offered by WOCU to the Administrator enables the centralisation of other tools external to WOCU that the user uses regularly, whether they are corporate portals, complementary tools, external documentation generated in another portal, etc.
In conclusion, WOCU reserves this space for the customised configuration of certain aspects of the main bar display, with the aim of streamlining the dynamics and daily operations of users.

Configuration and integration of Grafana dashboards in WOCU-Monitoring
A complete procedure on the creation, export and integration of dashboards in WOCU is presented. It covers from its construction and configuration in Grafana, to its integration and visualisation in the new tab Dashboards of a given Realm.
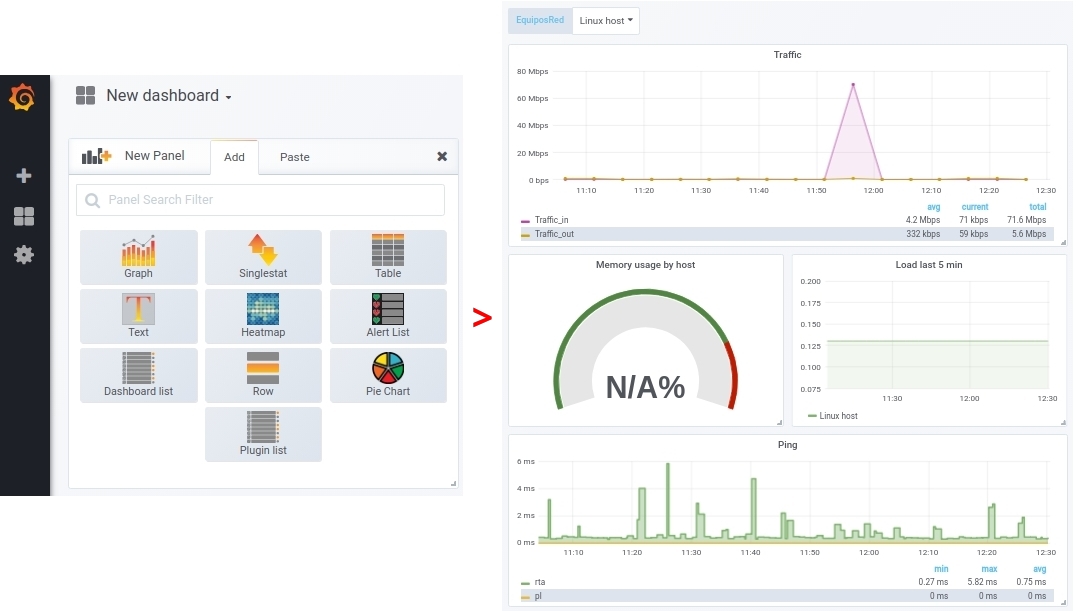
A dashboard is a key element, through which we can simplify and group metrics in a simple view, with the aim of improving the understanding of the data and information available that can impact our business. Consequently, a well-built dashboard facilitates the measurement of a multitude of metrics, which will help us in decision making and in the application of action measures when appropriate.
Refactorings
Migration of several widgets to REACT technology
The non-visible part of several widgets in the Detailed view of Hosts and Business Processes have been simplified by migrating them to REACT technology. These are:
Monitoring packs
Check out our catalogue of WOCU Monitoring Packs at the following link: link.
New rpm-juniper pack
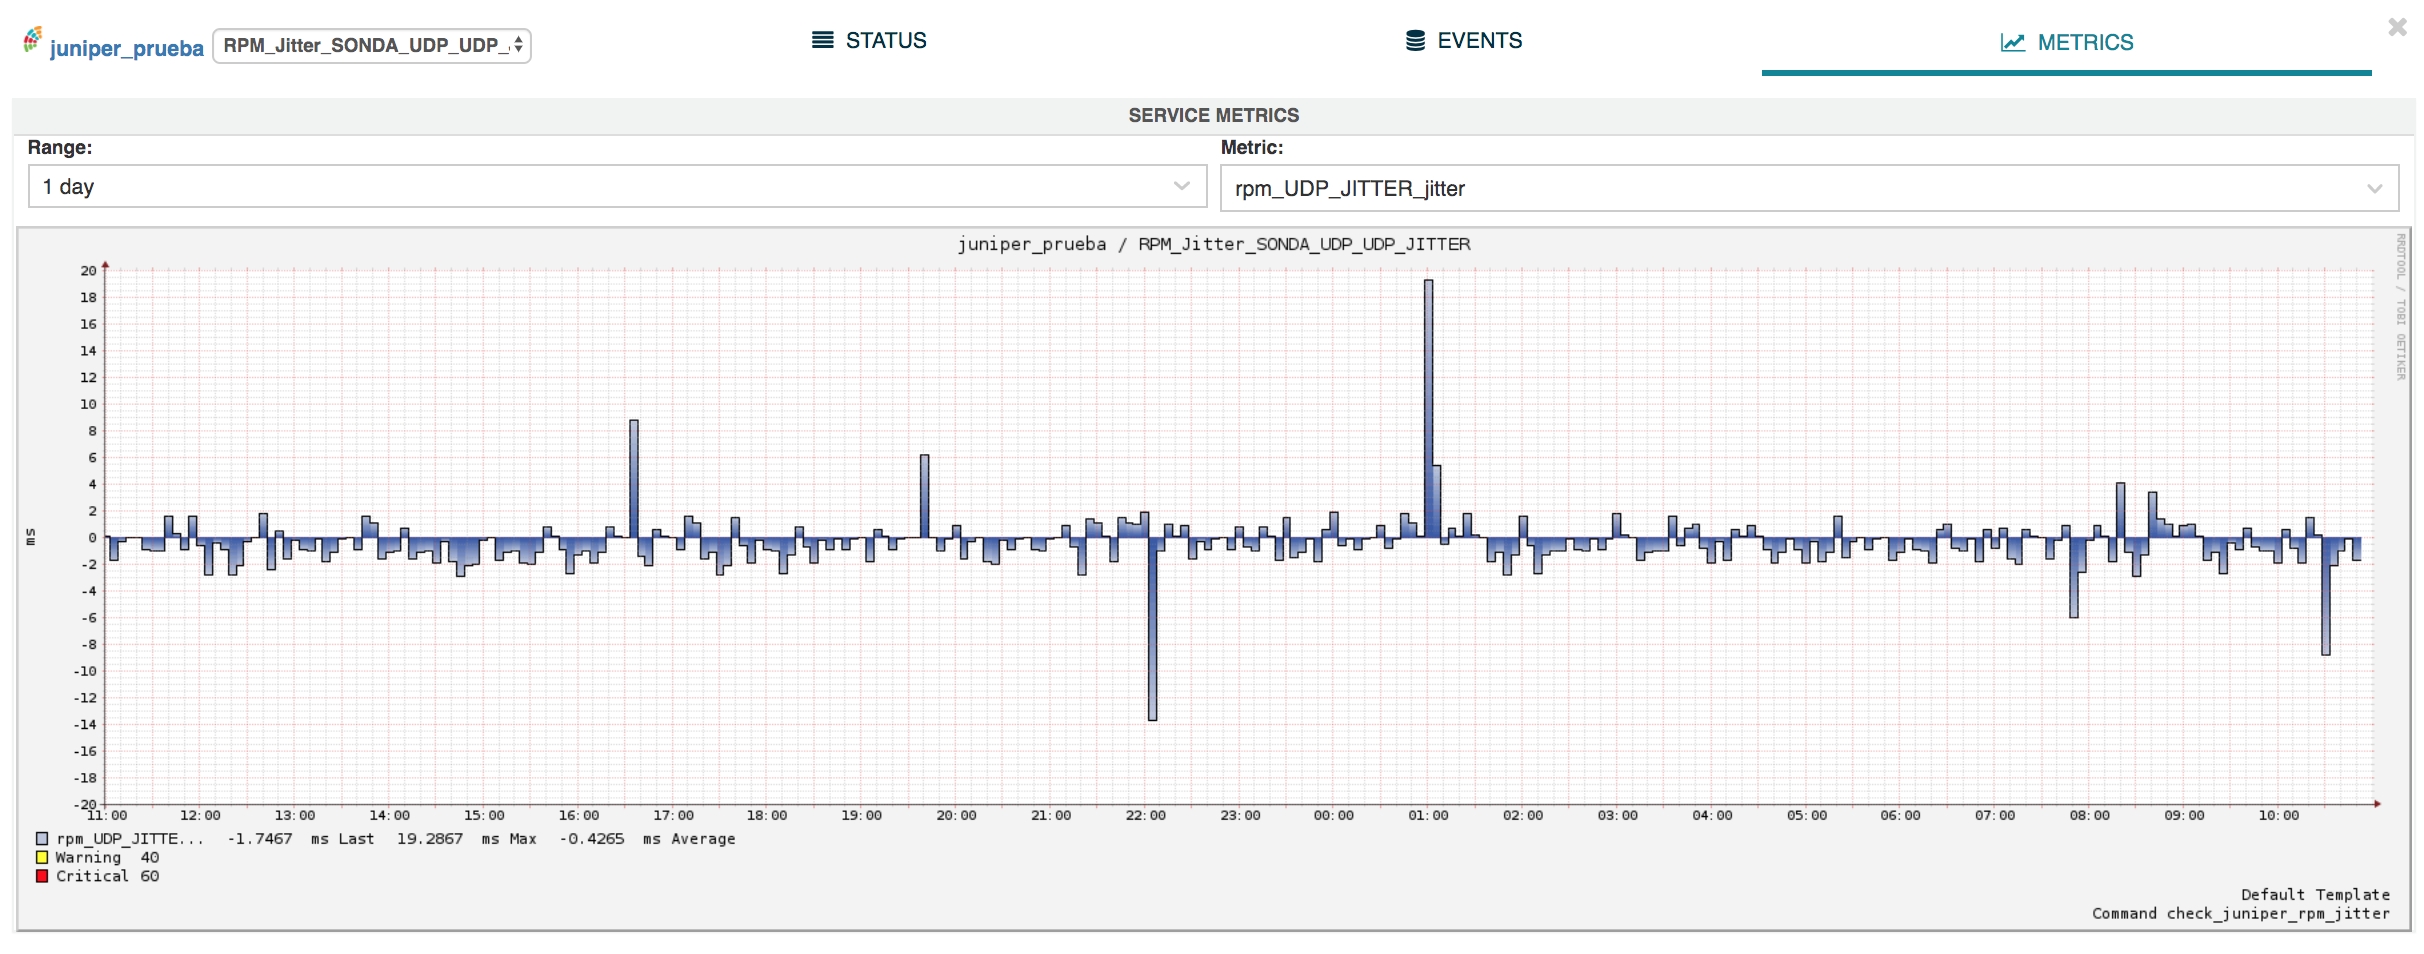
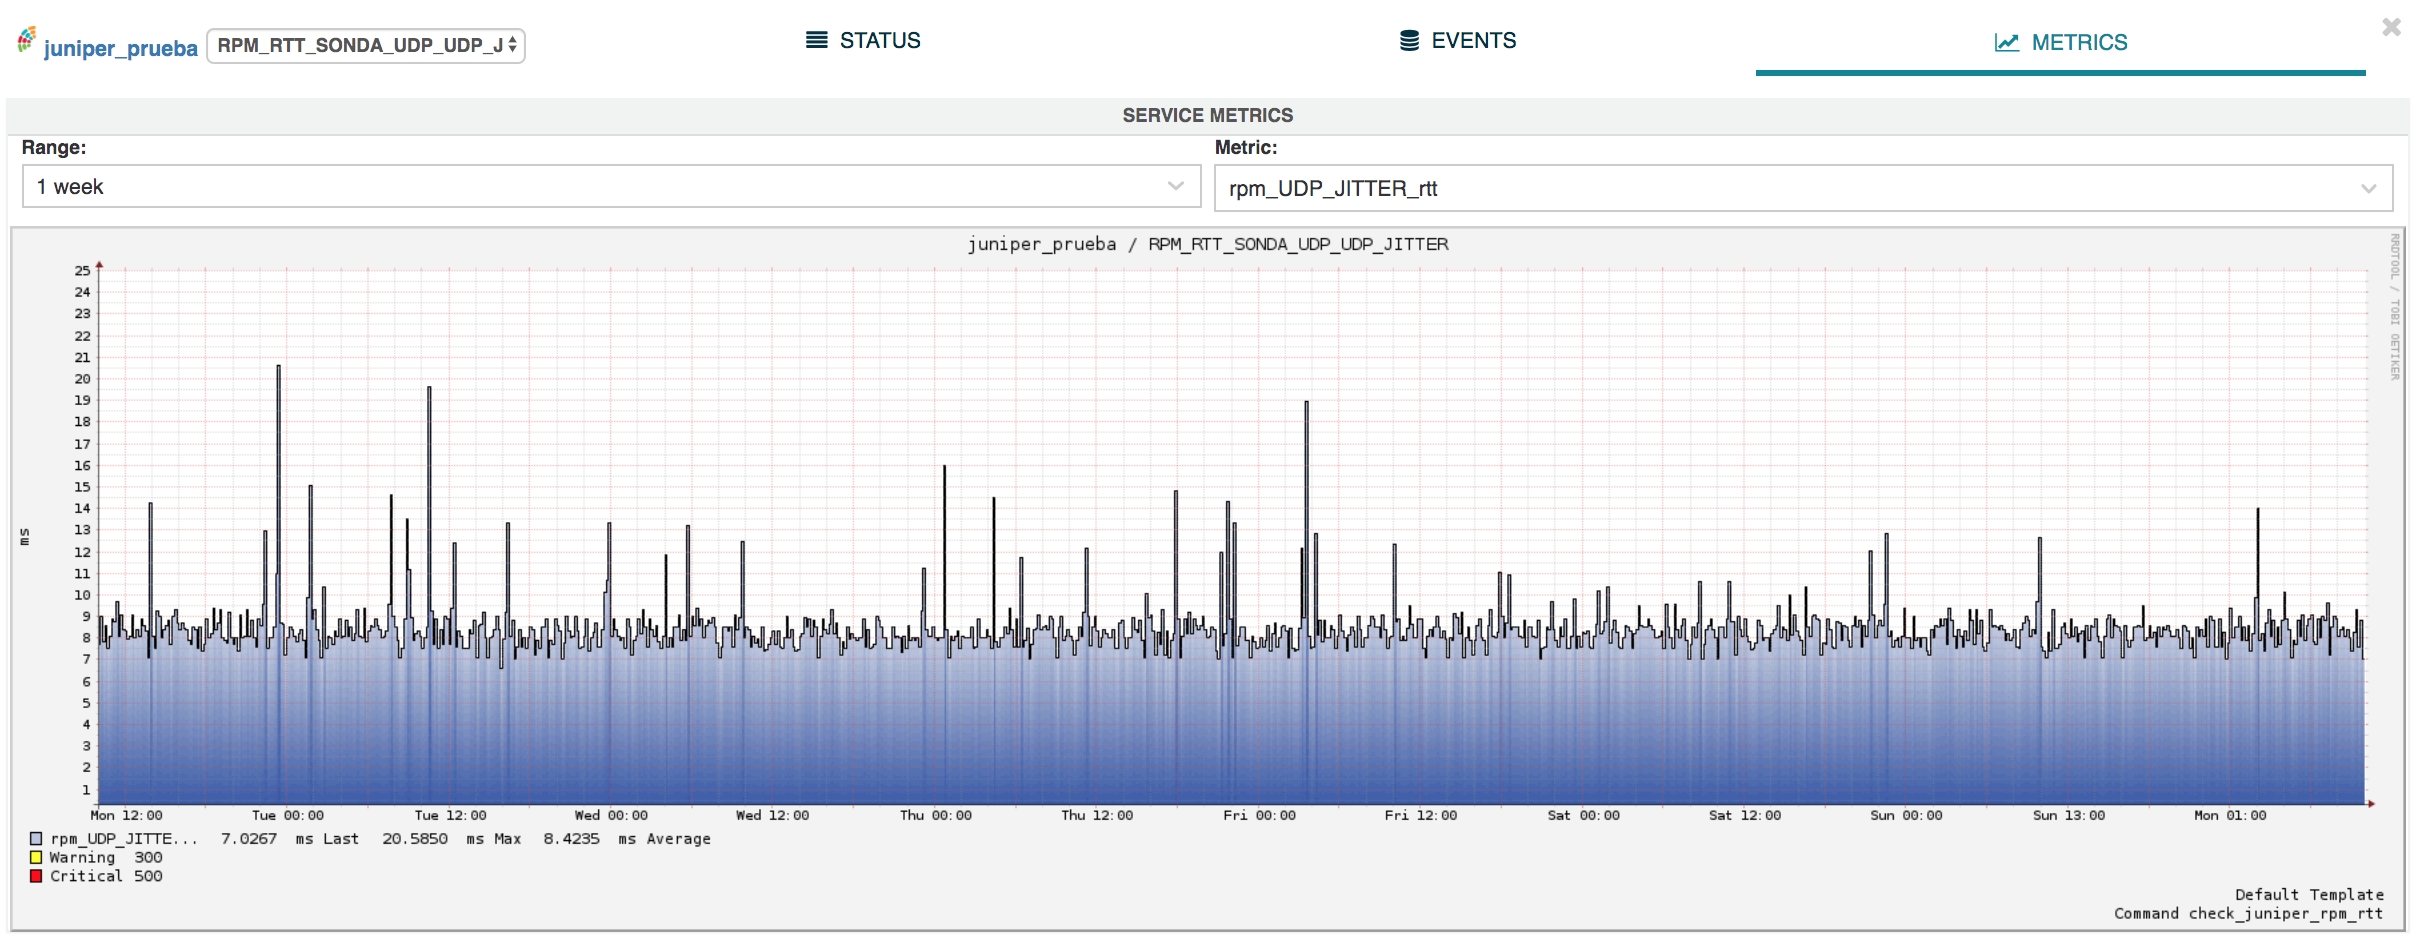
Pack capable of discovering and monitoring real-time performance monitoring (RPM) probes configured on a Juniper host. The monitored metrics are: round-trip time (RTT), jitter and packet loss percent.


New pack bgp-juniper.
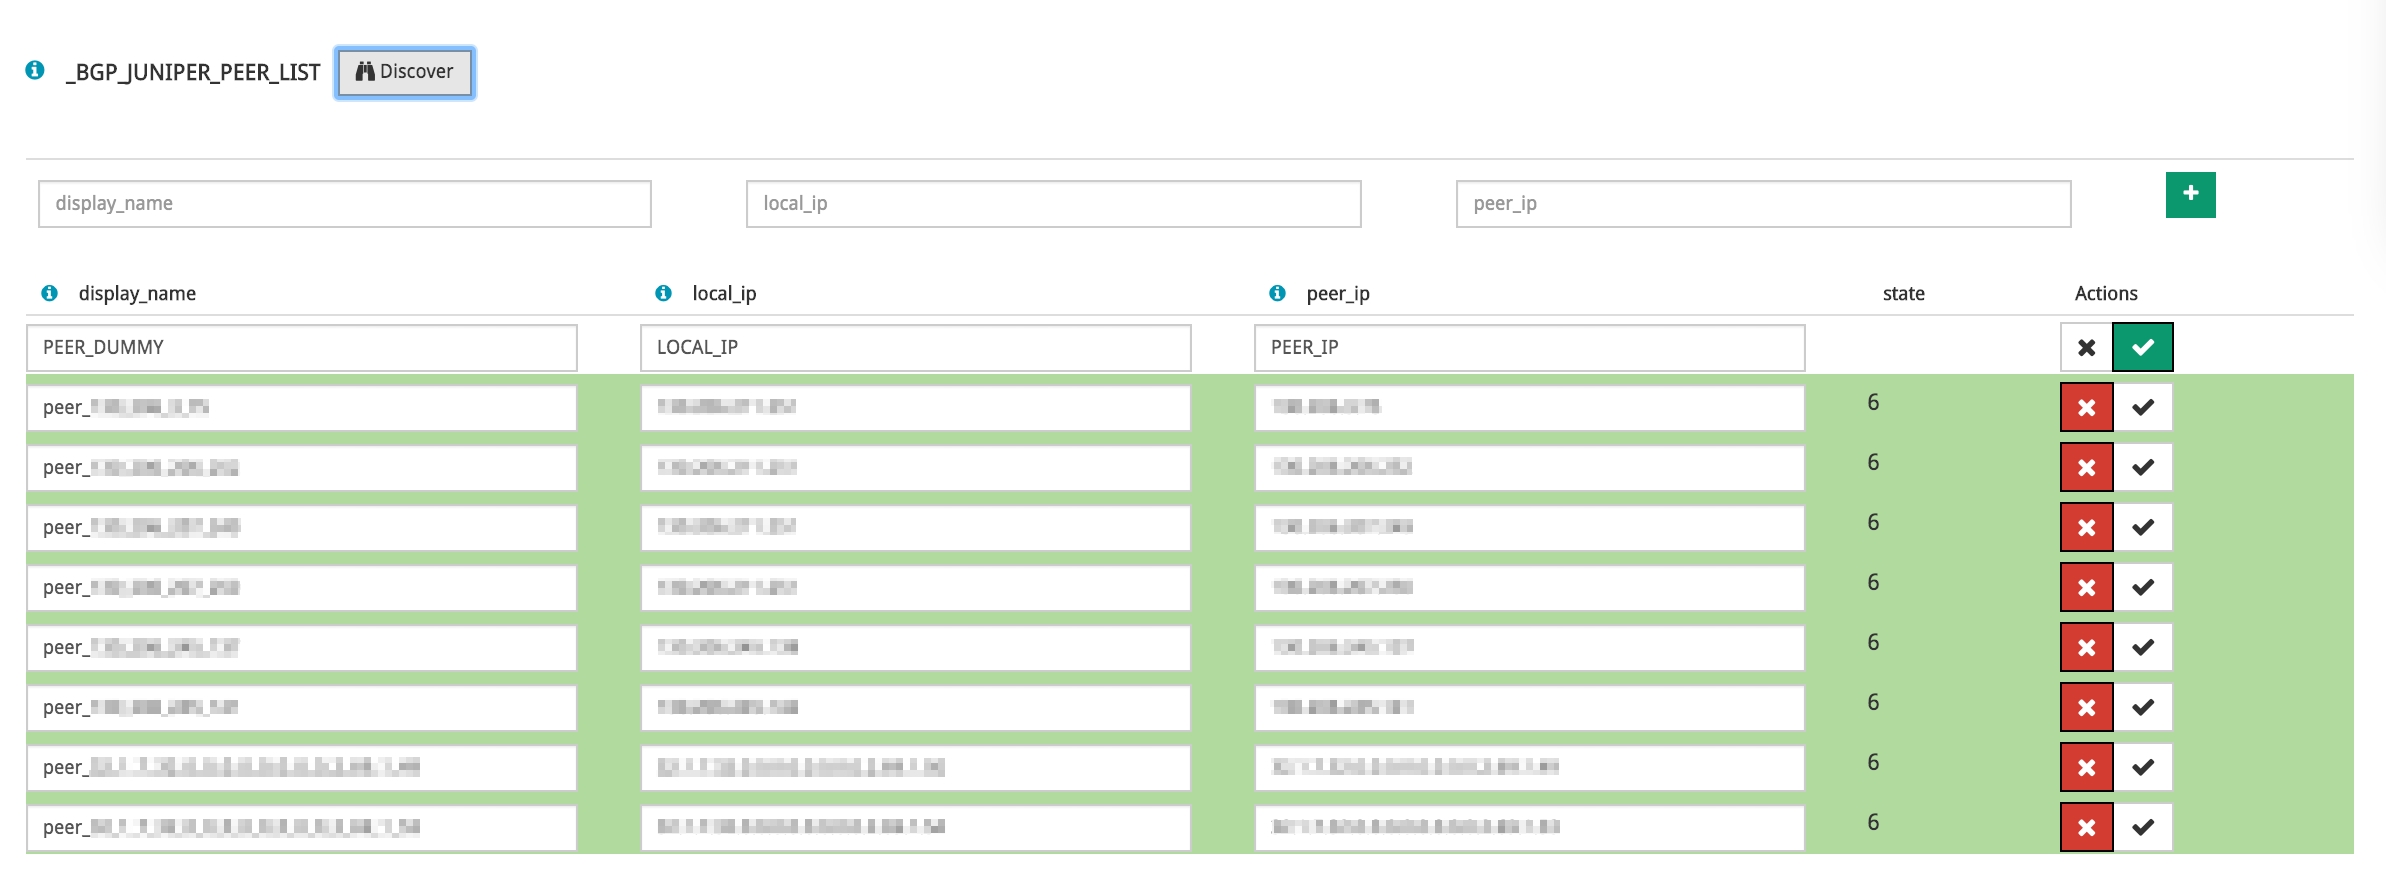
This pack discovers the BGP peers configured on a Juniper router and monitors their status. It generates alarms if the peer status is not established.

New MOS metric in the ipsla-cisco package
The Mean Operation Score (MOS) metric has been added to the monitoring pack to measure IP SLA values on Cisco hosts. This metric is used to measure the quality of audio or video communication. It is an arithmetic mean of the score expressed by users. The values are within a defined scale, where 1 is the worst score and 5 is the best.
New pack nqa-huawei-icmp.
A new specific pack has been created to obtain metrics from Network Quality Analysis (NQA) sessions of type ICMP. This pack includes a discover function that detects the sessions configured in the equipment and extracts their configuration in order to autofill the macro of the pack.
Added support for Cisco NCS models
The generic networkdevice-cpu and networkdevice-mem packs now also support Cisco NCS (Network Convergence System) equipment with IOS XR.
New packs fortimail y fortimail-standalone
Two new packs have been created specifically for Fortimail hosts from Fortinet. Both packs include a discover function that detects mail queues configured on the host and autofills the pack’s macro. In addition to the mail queue checks, including the Deferred queue, the packs contain usage checking services for: cpu, memory, maildisk and logdisk, plus uptime, SSH and GUI connectivity services. Additionally, the Fortimail pack includes the High Availability (HA) check service.


New qos-huawei package
Pack to discover and monitor the Quality of Service (QoS) classes of Huawei equipment. In addition to discovering the ``QoS`` classes applied to network interfaces, it obtains the metrics of *Transmitted Traffic (TX) and Dropped Traffic (DROP). It generates alerts if TX or DROP exceed configured thresholds.


New services in the linux-snmp package
The Swap, TCP Connections, Uptime and SysDescr services have been added to monitor and generate metrics for memory usage, TCP connection status, host on time and host information respectively. In addition, these services also generate alerts if configured thresholds are exceeded.

New services in the esx-host package
The pack that monitors existing VMware machines on an ESX system now has a new service to check synchronisation with NTP servers. Alerts will be generated when the drift and/or the number of NTP servers configured are outside the defined thresholds.

Support for Cisco ASR 9K equipment in the cisco-asr-health package
The pack that monitors temperature, fan and power supply sensors for Cisco ASR hosts now also supports 9000 series equipment.

New pack ironport-cisco
New pack specifically for Cisco Ironport hosts. The pack monitors the following services:
CPU: Percentage of CPU usage.
Memory: Memory usage percentage.
Memory Status: Memory status.
Files/Sockets: Number of files and sockets open on the host.
Power Supply: Status of the main and redundant power supply.
Raid Status: Status and errors of the disks in the raid.
Temperature: Temperature sensor values.
Licenses: Expiration date of installed software licenses.
Queue count: Number of queued mails.
Queue usage percent: Percentage of mail queue usage.
Queue status: Status of the mail queue.
Conservation reason: Reason why the equipment has entered conservation mode.
Oldest message: Time the oldest message has been queued.
Mail related threads: Number of threads that perform some task related to mail transfer.

Upgraded software
Numerous pieces of software integrated into WOCU have been incorporated and updated:
Software |
Previous version |
Current version |
Remarks |
|---|---|---|---|
Perl |
5.18 |
5.30 |
Latest stable version of the interpreter and its base library |
Erlang |
R15B03 |
18.3 |
Version update |
Go |
1.11 |
1.14 |
Latest stable version, required by DML |
Outlet |
8 |
10 |
Upgraded to LTS version (long time support) |
Python2 |
2.7.9 |
2.7.17 |
Latest stable version of the 2.7 series |
Python3 |
3.7.3 |
3.7.5 |
Latest stable version of the 3.7 series |
LMD |
1.8.1 |
1.8.2-13 |
It includes fixes for performance and stability issues, and integrates increased timeouts. |
ElasticSearch |
1.7.1 |
1.7.1 y 7.6.1 |
Version 7.6 is distributed alongside the currently supported 1.7, although it will not be enabled by default until the development team makes the appropriate transition. |