Release Notes 59
Date of Publication: 16/02/2024
The present document is about the new features, functionalities, improvements, and corrections integrated into version 59 of WOCU-Monitoring, addressing the requests and suggestions from our users and meeting current market needs.
The recently added Module GConf has undergone a significant evolution in this version, thanks to the new integrations added, designed to simplify the management and specific monitoring of assets based on different attributes or conditions.
Another notable development is the distribution of the new Free License, which is presented as the ideal entry point to the WOCU-Monitoring ecosystem, allowing you to explore its versatility and power for free.
Notably important has been the optimization of the performance and loading times of the application, ensuring that users experience significantly faster loading times when launching the application.
But that’s not all, new Monitoring Packs are continuously being developed, tailored to meet the technological demands of the market.
Without further ado, let’s proceed to detail in-depth all the innovations that come with this new version of WOCU-Monitoring. You can find more information in the User Manual if needed.
1. New Free License for WOCU-Monitoring
The new free version of WOCU-Monitoring is fully functional and provides a monitoring solution for small and medium-sized businesses.
Among the most prominent features are:
License for up to 1500 services.
On-Premise in AIO (All In One) format for Debian 11 and Redhat 8 distributions.
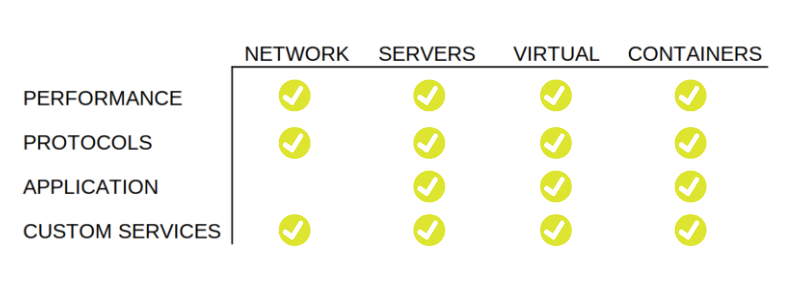
Includes 23 Monitoring Packs.
Note
Discover the rest of the features and access the download page at the following link.
2. Optimization of the performance and loading times of the application
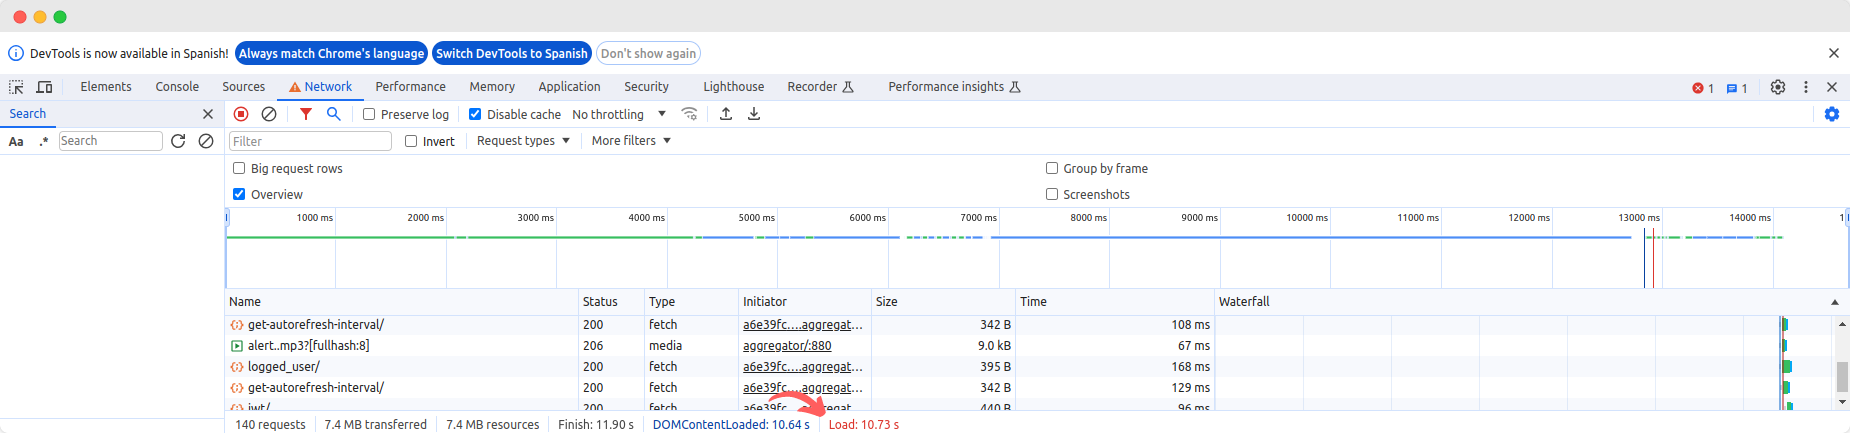
In this version, the performance of the application has been enhanced, specifically reducing and alleviating the initial loading time. These improvements involve a thorough code review to eliminate potential bottlenecks, optimization and segmentation in the loading of interface resources, and the implementation of advanced caching techniques.
As a result, users will experience significantly faster loading times when launching the application, contributing to a smoother and more efficient experience.
3. New Aggregator Summary View
Within Settings a new option has been included that gives way to the view Aggregator Summary. This is a space designed for provide an overview of the monitored infrastructure according to the nature of the administered Realms and connectivity there of,at the time of the consultation.
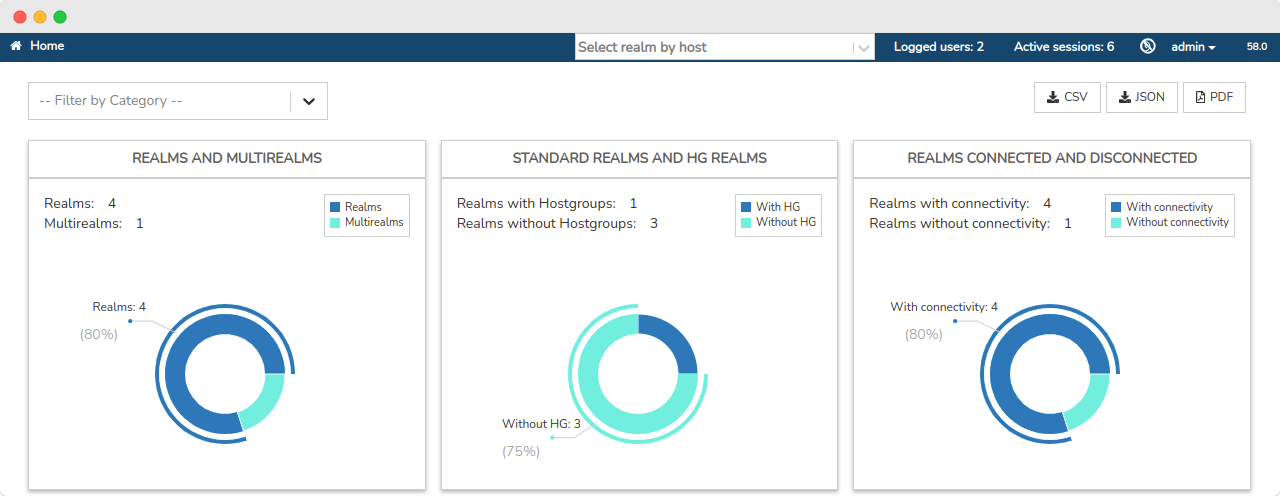
The view is divided into three panels, each containing charts illustrating a count of each type of Realm.
Similarly, each segment of the chart includes its own modal with detailed information on each Realm that integrates the selected group, along with various Export the full view.
Note
This view is in an initial phase and will continue to evolve in the next iteration of the development cycle.
4. Evolution of the Gconf Module
Given its relevance, in this version, work has continued on the development and improvement of the GConf. The following details the new features that have been included:
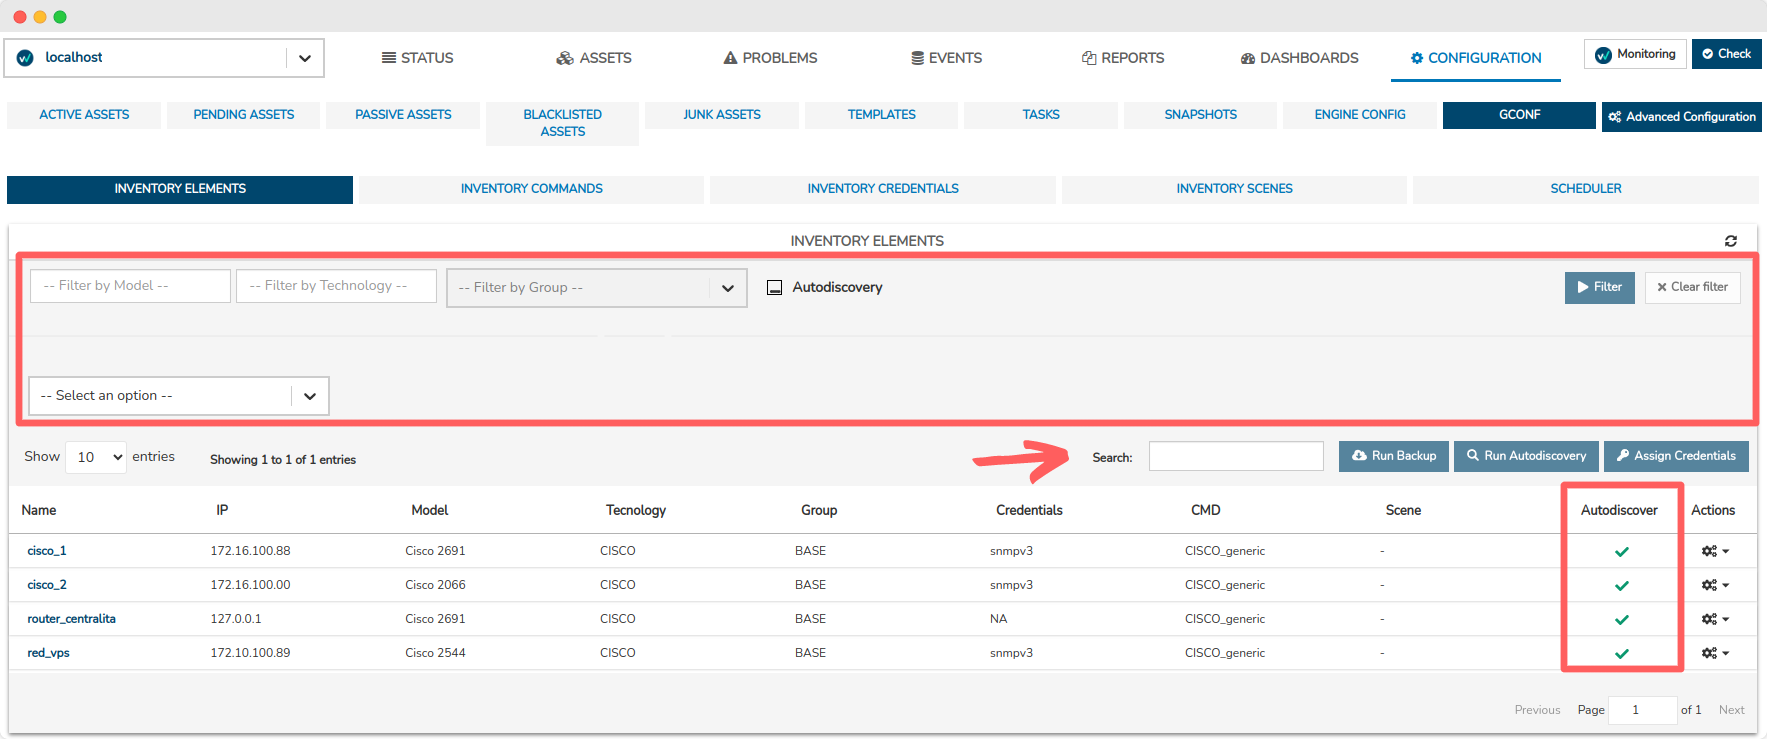
In Device Inventory:
In the general table, an additional column called Autodiscover is added, indicating whether the device is enabled for autodiscovery through the Autodiscover action.
New Filtering, Selection, and Exporting Items for elements have been added, designed to simplify the management and specific monitoring of assets based on different attributes or conditions, such as:
Filter by Model of the asset.
Filter by Technology implemented by the asset.
Filter by Group of assets.
Enabled or disabled autodiscovery filters.
Additionally, the function of Multiple Selection of Elements has been incorporated as a complement to the actions:
Run Backup: to execute a collective backup of all selected items in the table.
Run Autodiscovery: to execute a collective autodiscovery of all selected items in the table.
Assing credentials: for assigning credentials to a specific group of items.
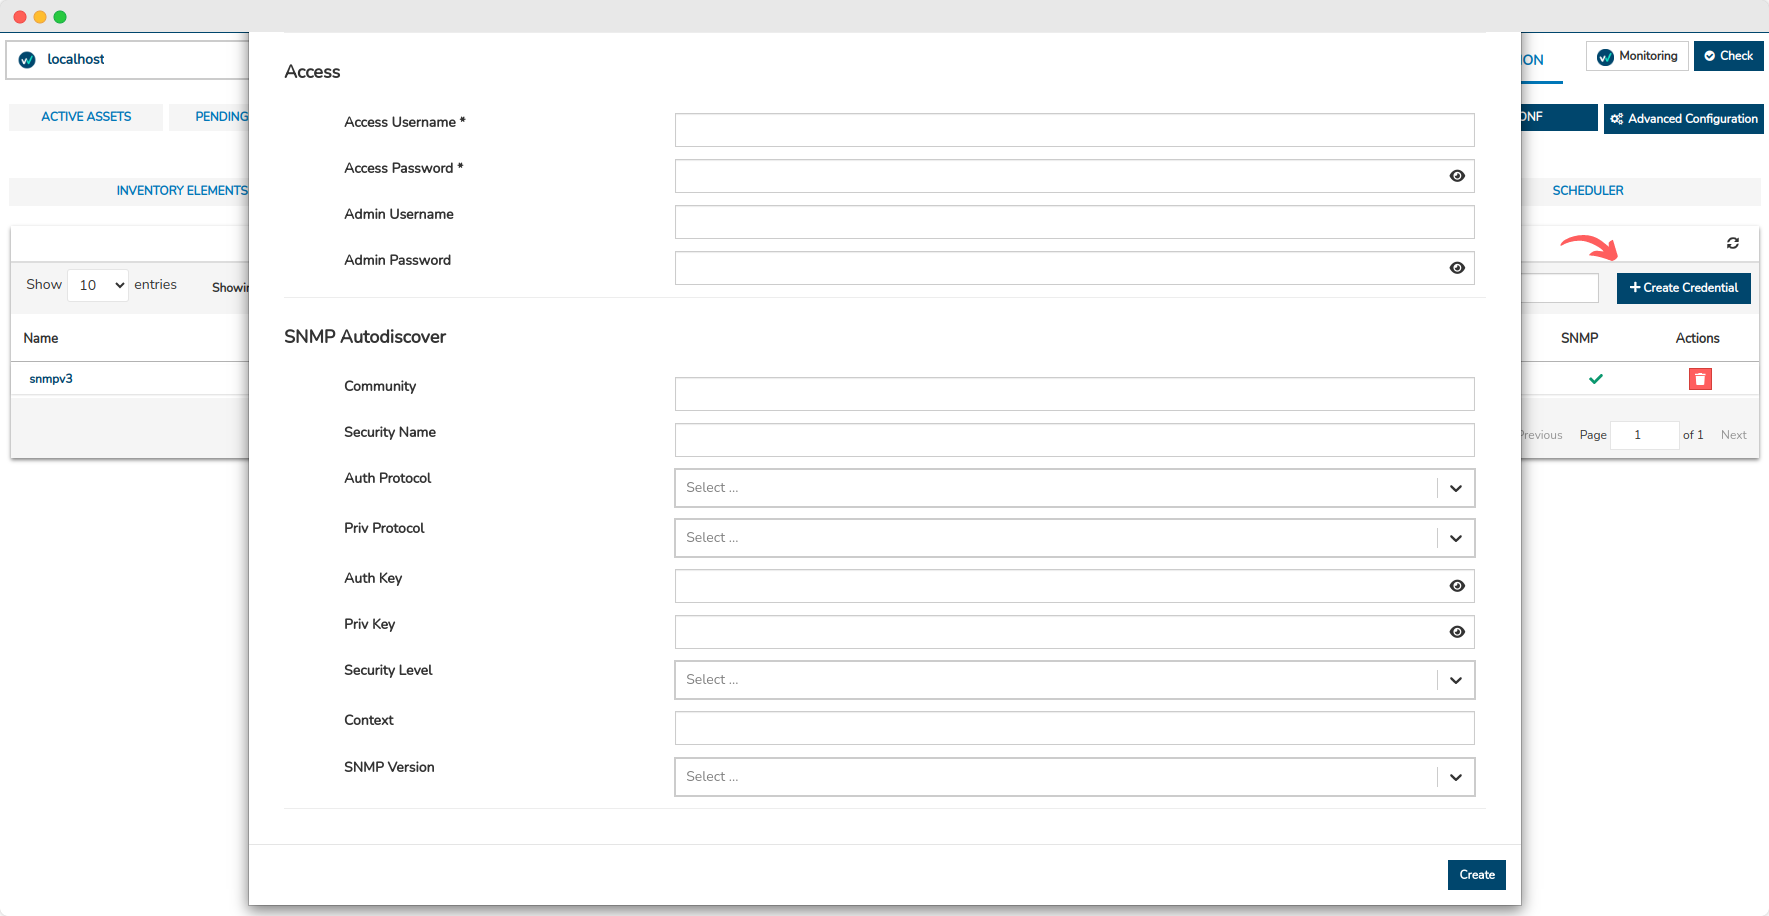
In Credentials:
The Registration of new credentials form now includes new configuration parameters related to computer access and SNMP connection.
5. Refactoring of RTA and PL Metrics Charts
This version introduces a renewal of the metrics charts for RTA (Round-Trip Average) and PL (Packet Loss) of monitored devices. In this process, the pnp4nagios component has been replaced with an in-house chart representation system implemented through an internal library.
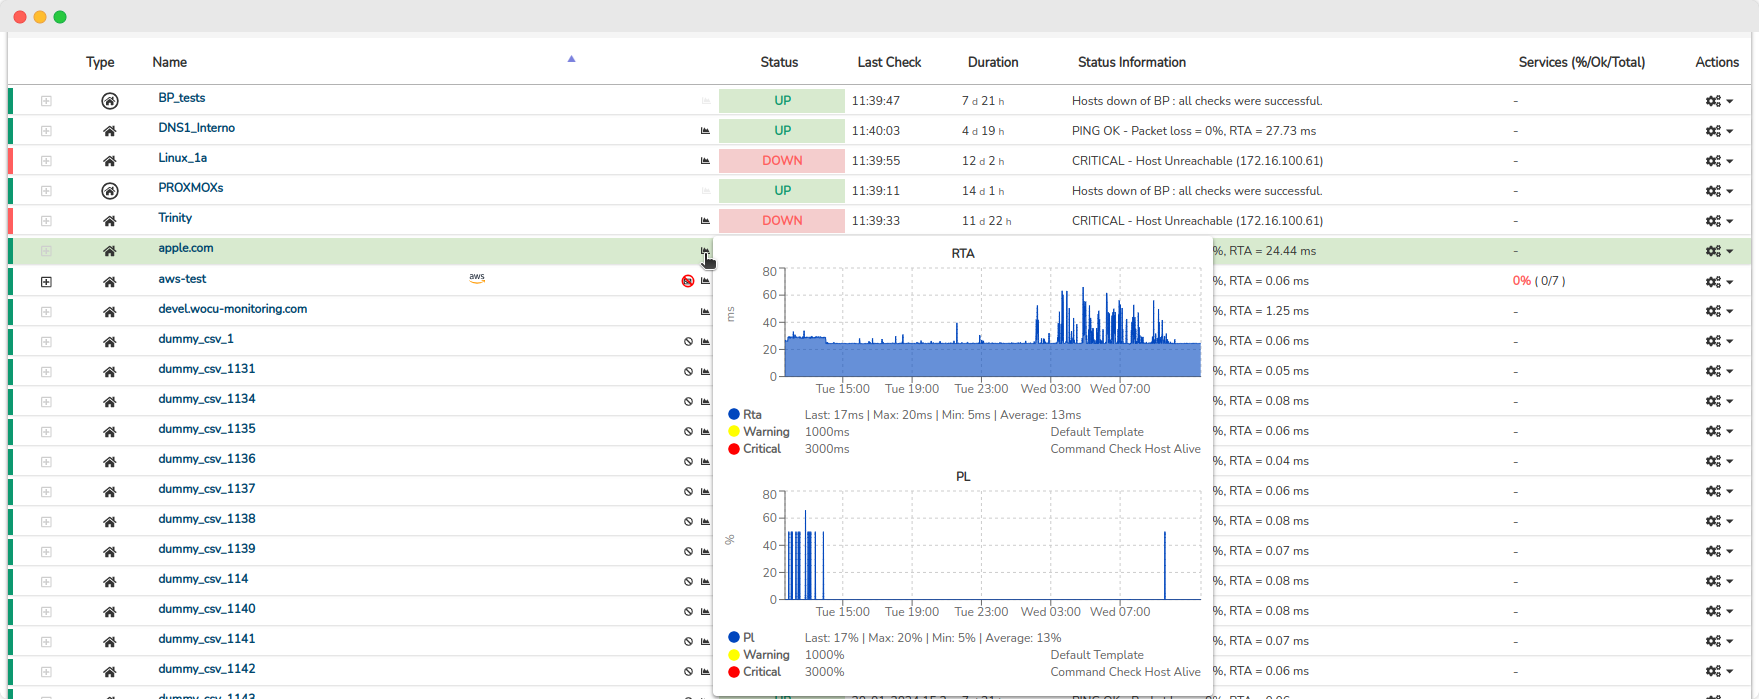
This change aims to improve efficiency and the visual experience, providing a more accurate representation of crucial metrics within WOCU-Monitoring.
Moreover, by adopting our proprietary chart representation system, significant improvements have been achieved in loading speed, customization capabilities, and the accuracy of visual representations. This translates into a smoother user experience and the ability to obtain key information more quickly and efficiently.
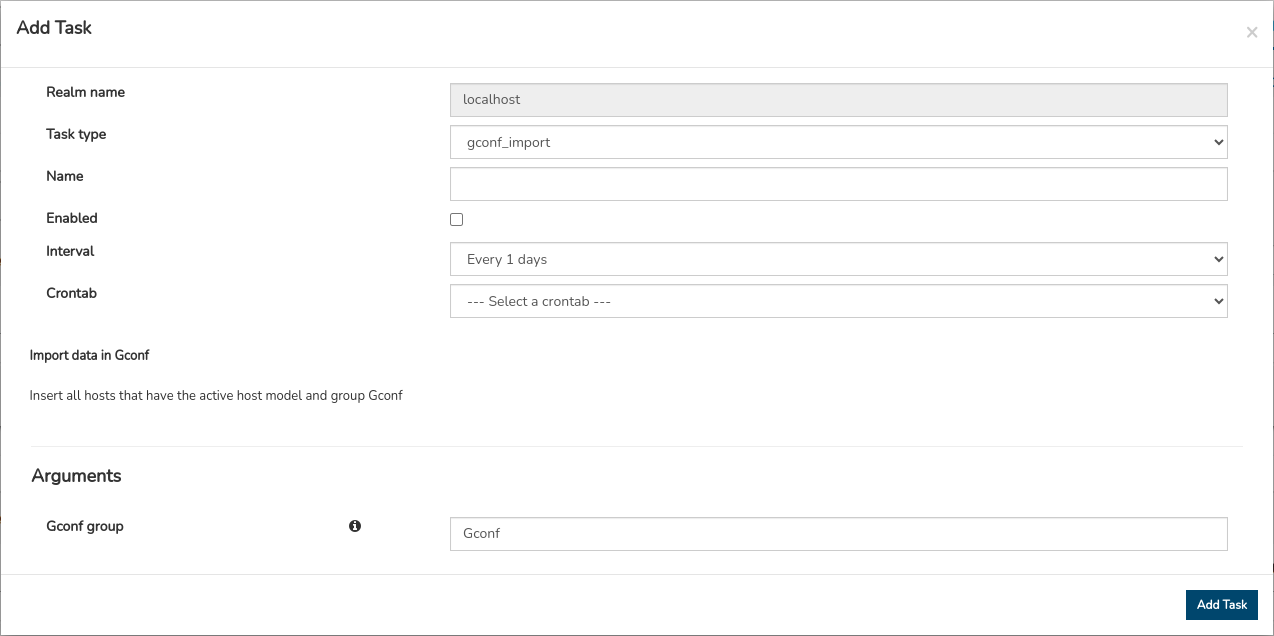
6. New import task Gconf_Import”
The new Asset Import to Gconf (Gconf_import) Task has been developed, with the functionality of adding new assets to WOCU-Monitoring. Initially, these assets will be placed in the GConf for subsequent configuration management, backups, and version control.
In this context, this task establishes centralized access for efficient management of assets in terms of configurations, significantly contributin to the stability and adaptability of the monitored infrastructure. This positions WOCU-Monitoring as a comprehensive tool for the management, monitoring, and continuous maintenance of networks.
7. New Summary View of Executed Import Tasks
The View Job Information accessible from the Tasks Status Table has been revamped. It now includes new and detailed information about the outcome of each executed import task in the application.
With these significant improvements, operators will have access to specific details about what happened with each imported asset. The set of actions is visually presented through a pie chart, offering an intuitive graphical representation of the distribution of results. Additionally, a summary table complements this information, providing specific details about each executed task.
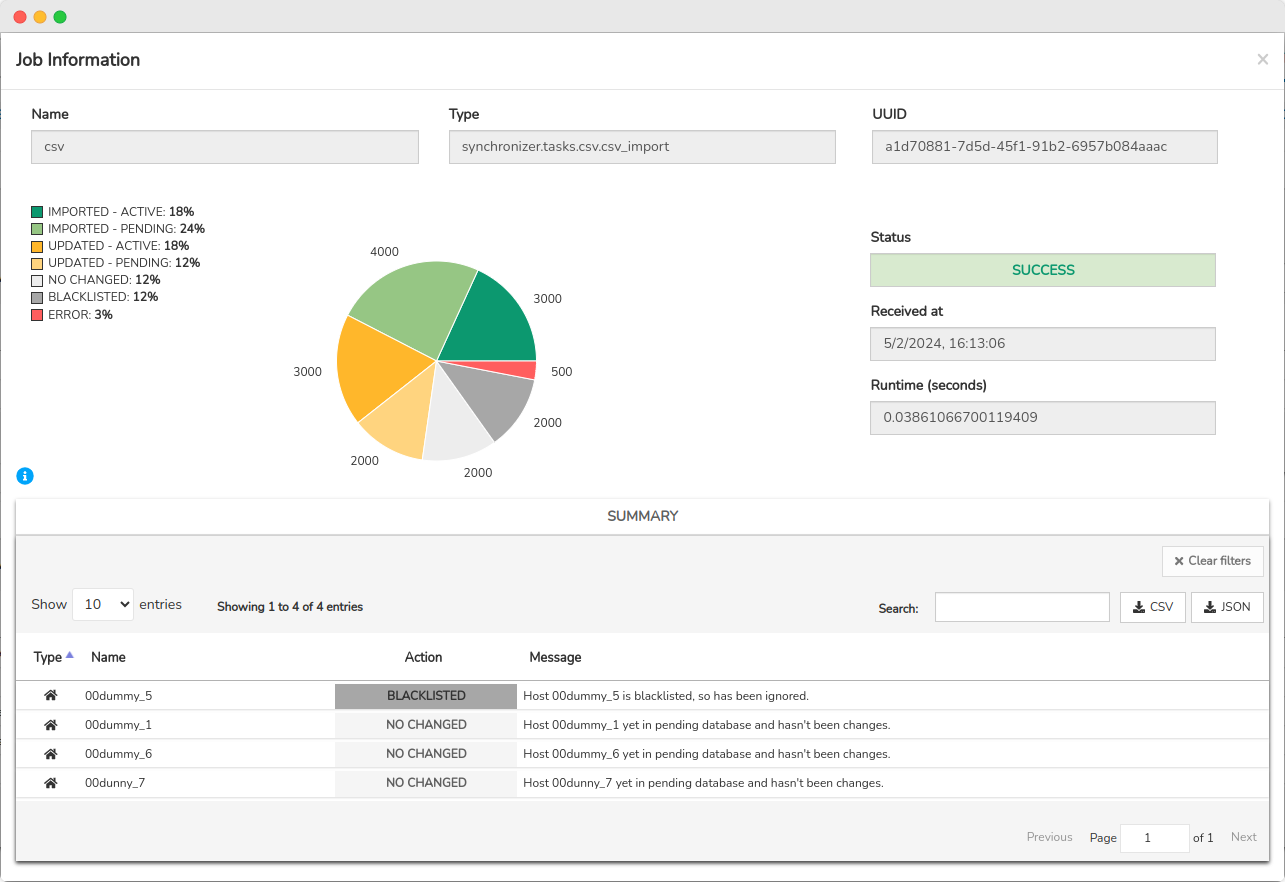
With this update, the aim is to provide a more comprehensive and transparent experience, enabling users to easily understand the status and results of import tasks, thereby facilitating informed decision-making.
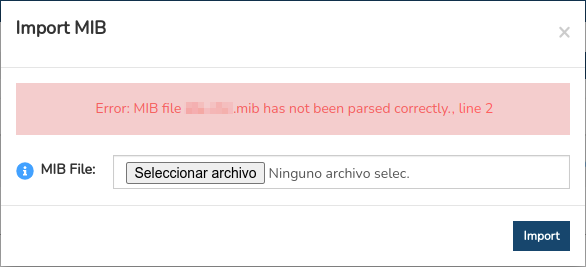
8. New Enhancements in MIB Management
In this version, work has been done on the MIBS section. Specifically, significant changes have been included to optimize both the management and the importation and manipulation of data associated with MIBs (Management Information Bases).
From now on, the system will not allow the importation of erroneous MIBs. An error message will be returned in the same import modal.
Additionally, after a successful import, a new informative view with the associated data for that MIB will be displayed.
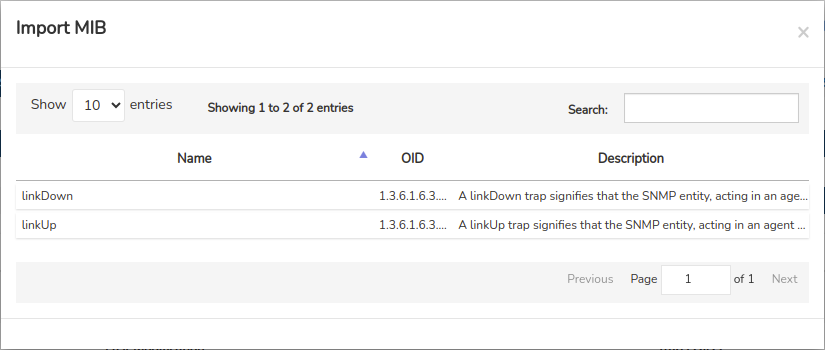
Finally, in the global MIB table, the Traps OIDs column has been added, indicating the number of Trap/Notification type OIDs that the respective MIB contains.
The special attention given to the MIBS section reflects the ongoing commitment to perfecting the user experience.
9. Administration Manual Update
With the release and distribution of the new free license of WOCU-Monitoring, documentation related to the installation and update procedure of this new service has been added.
This addition includes step-by-step instructions that cover system requirements and necessary configurations for an efficient deployment, ensuring that users have detailed and accurate information.
10. Packs de monitorización
Check out our Monitoring Packs catalog at the following link.
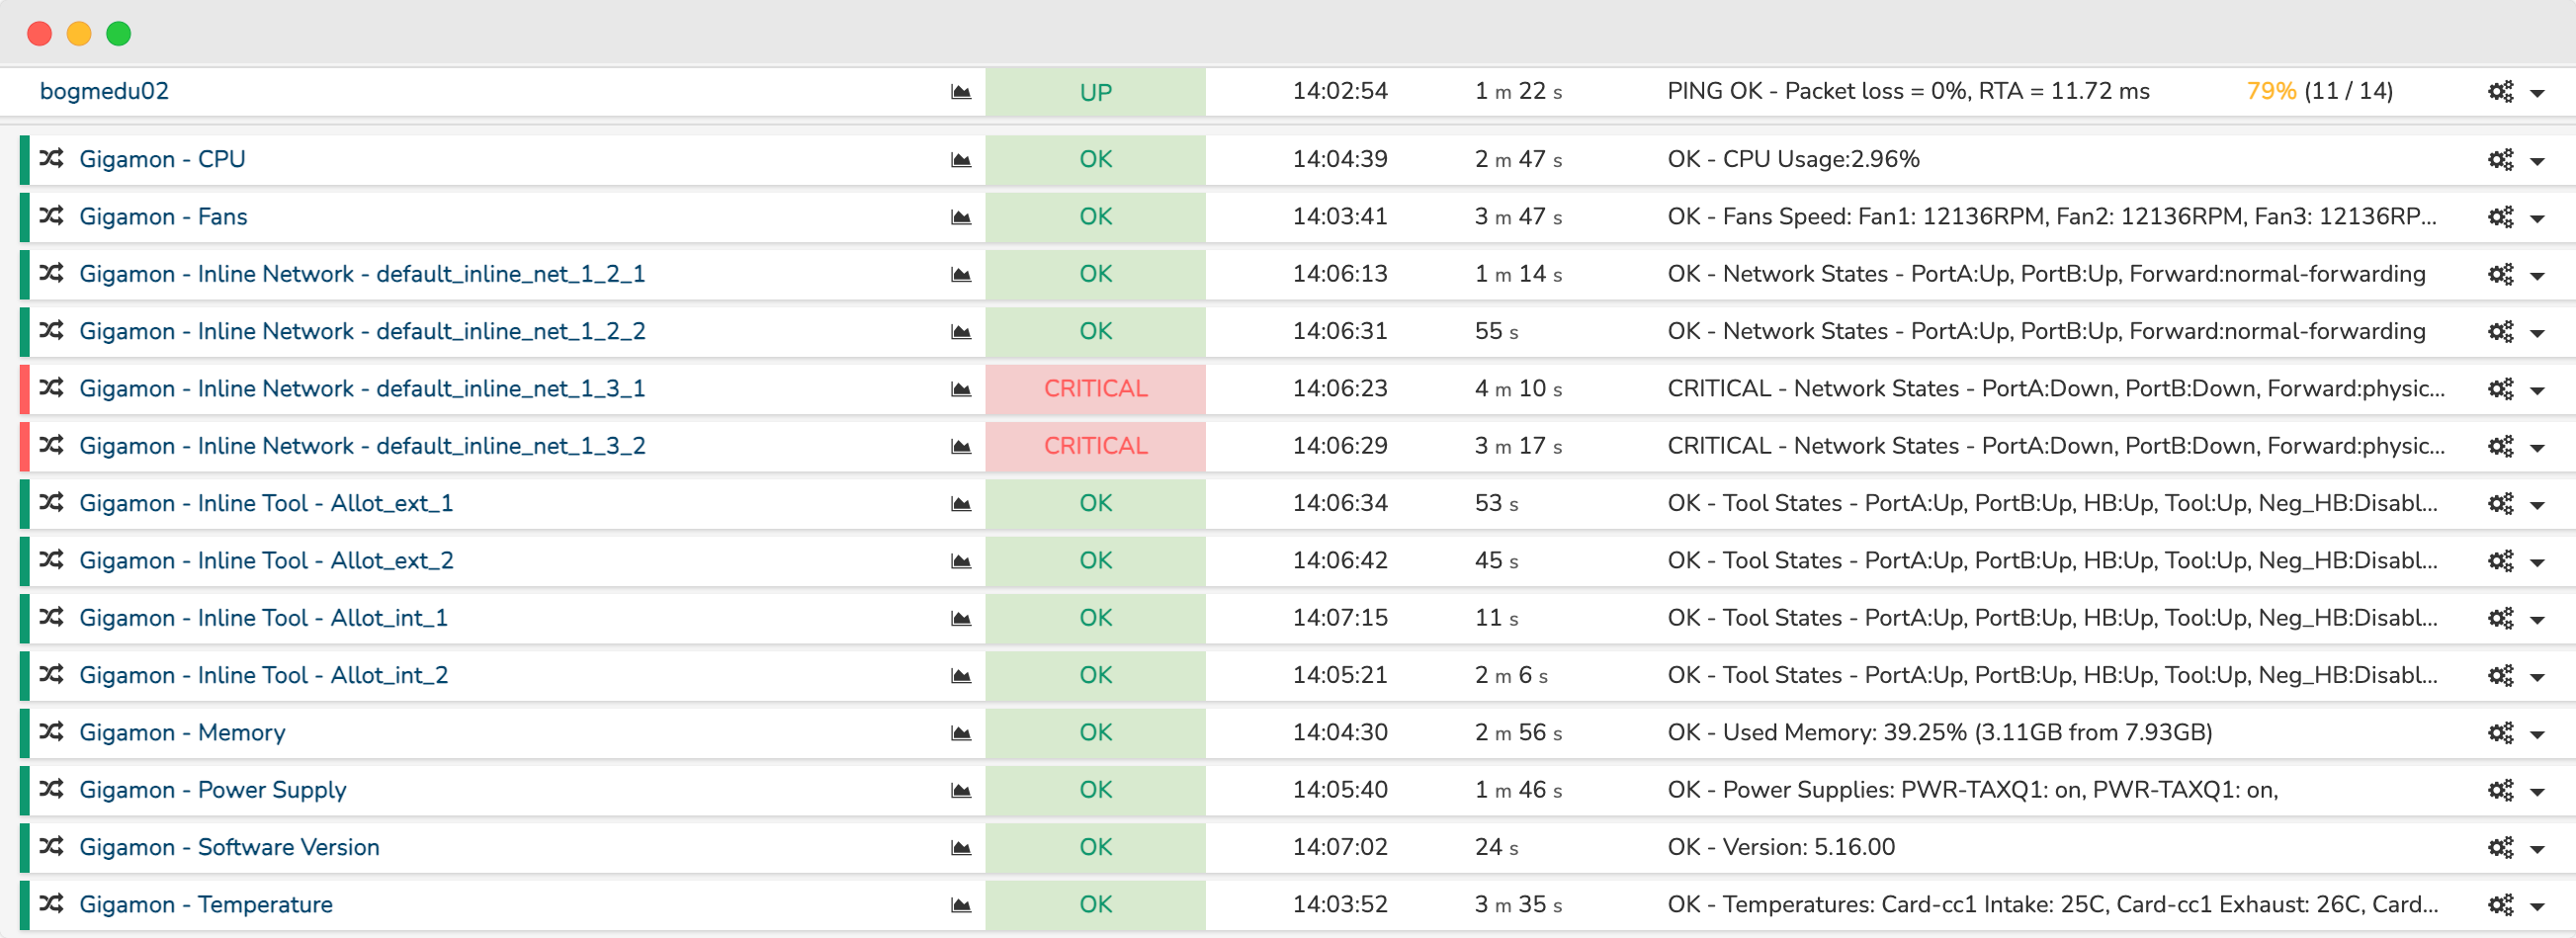
New Gigamon pack
A new package is added to the catalog for monitoring the health and performance of Gigamon brand network devices. The package allows the discovery of the networks and inline tools configured on the device, and enables the selection of those that are necessary.
The monitoring services included in the Gigamon pack are the following following:
CPU: Percentage of CPU usage.
Memory: Percentage of memory usage.
Fan: Fan speed.
Power Supply: Status of power supplies.
Temperature: Temperature sensor values.
Version: Returns the software version of the device.
Inline Tools: Status of the selected inline tools.
Inline Networks: Status of the selected inline networks.
New api-test-generic Pack
A new pack has been designed to monitor the status and response time of API endpoints.
The api-test-generic pack allows configuring multiple endpoints on the same Host. It supports authentication, Http or Https protocol, destination port, etc. It also includes a macro to specify the query timeout for the endpoint and thresholds to trigger alerts when the response time (elapsed time) of the endpoint query exceeds them.

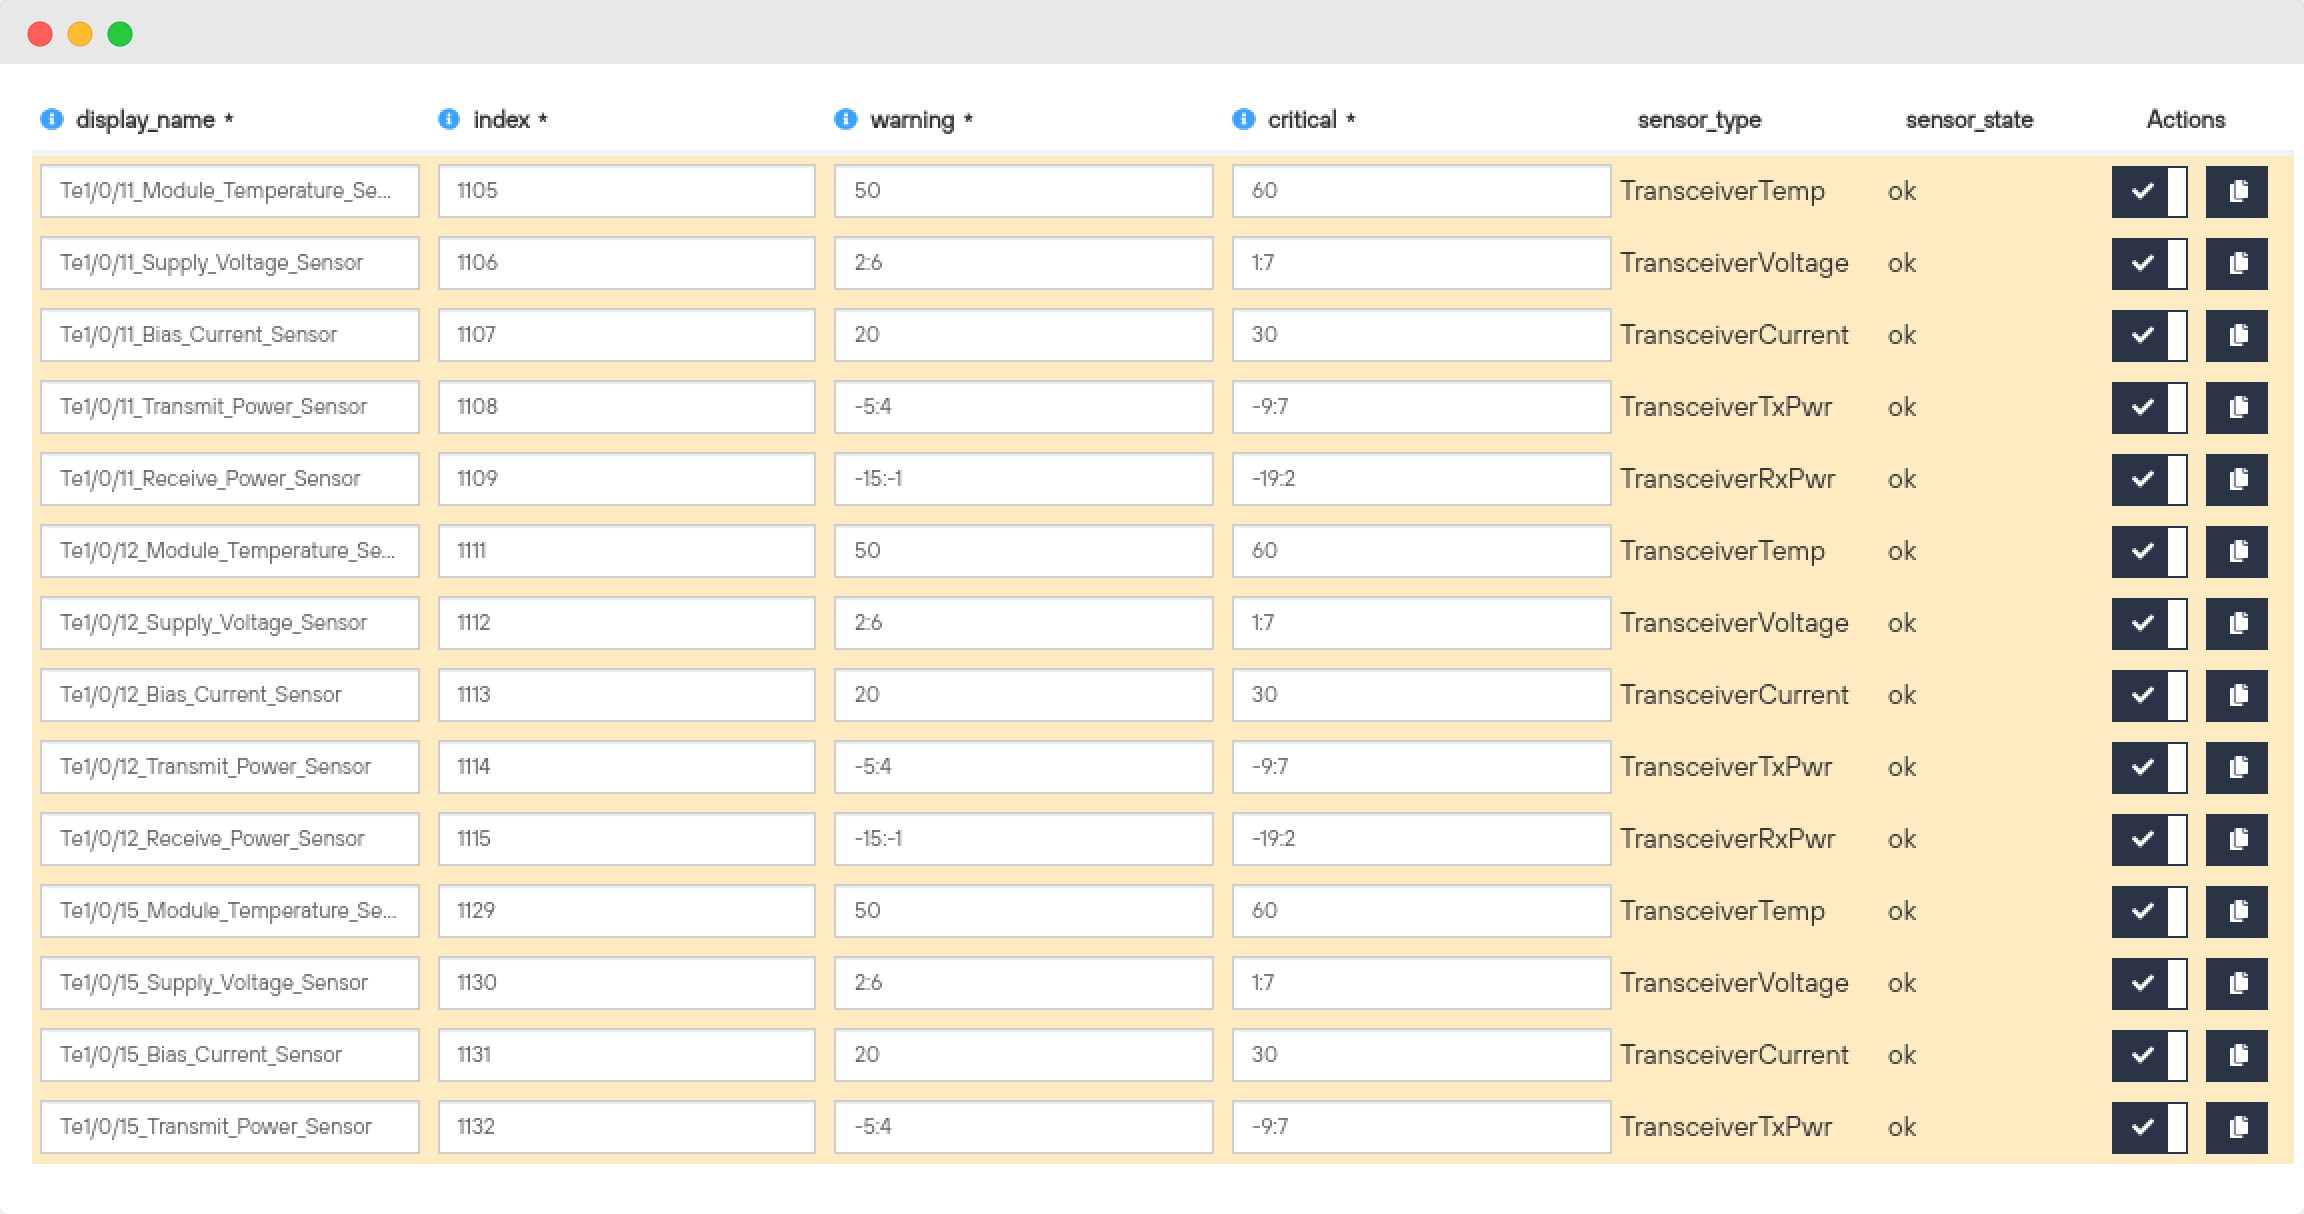
New Networkdevice optical ifaces health pack
A new pack has been developed to discover and monitor the sensors associated with optical interfaces of Cisco brand equipment.
The following sensors are supported:
TransceiverRxPwr
TransceiverTxPwr
TransceiverCurrent
TransceiverVoltage
TransceiverTemp
New Metric Configuration for the EfficientIP Pack
The option to configure Warning and Critical thresholds for all metrics provided by the DHCP service in the monitoring pack EfficientIP has been added.
The metrics include:
Discovers
Requests
Releases
Offers
Acks
Nacks
Declines
Informs
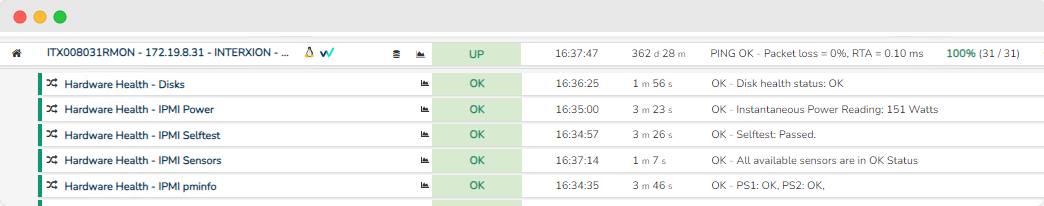
New Wocu-hw-health Pack
A new pack is added to the catalog to monitor the physical servers where the WOCU-Monitoring application is installed.
he pack consists of several services
Disks: Health status of the disks.
IPMI Power: Instantaneous power consumed by the server.
IPMI Selftest: Result of the self-test included in the IPMI tool.
IPMI Sensors: Alerts if the status of any of the IPMI sensors such as temperature, fans, power supplies, etc., is not OK.
IPMI PMInfo: Alerts if any of the power supplies report a state different from
OK.
Other improvements and fixes
Every new version is full of small changes, fixes and optimisations that should be briefly highlighted. We list the most notable ones in this version:
Fixed a bug where the Go to geomap button on the map alarms did not work properly.
An informative tooltip has been added to the Status columninformation from table Problems.
The Duration parameter (visible in different tables of the application) has been updated. From now on, it will take into account when a Device is in SOFT state.
An issue has been fixed where the full name of a BP Services in the Business Processes Inventory was not being displayed.
In the Administration subsection, a copy function (to the clipboard) for the dates of each audit action performed on an object has been added. This simplifies the data copying process with just one click.
A minor error in the component that returns the
OKlabel has been corrected, as it was displaying the digit ‘0’ instead of the letter O.In the Business Processes Inventory, when hovering over any entry in the Name column, a tooltip will display the Display name followed by the Description attribute in parentheses.
The Business Impact parameter is included in the Configuration.
Unified the design of the Check icon (✓) in the Configuration Module, aiming to ensure coherence and aesthetic consistency throughout the application.
Extended the time limit for KPI tasks in Celery to ensure comprehensive monitoring, avoiding premature interruptions and ensuring that tasks have sufficient time to collect accurate data on network performance.
The Services column in the Services Inventory now incorporates alphabetical sorting by name of Monitoring Packs.
The website has been updated to HTTP/2, improving site performance with faster loading times and increased security.
The Service overrides parameter has been added for overwriting monitoring services in the forms of creation and editing of Templates.
When accessing the Problems, a red-colored label indicates the total count of generated alarms. From this version onwards, this indicator is persistent and updates simultaneously with the page.
The Imported from field has been added to identify the source of data for a Host in the Inventory of Hosts. It will also provide information on whether the provided value has been created manually (via the Manual attribute) or from Import Tasks (Tasks).
The Enable parameter in the Add Host form now includes a pre-check for when the GConf is not operational.
The seven-day limit has been removed from the date range filter for Events, meaning the defined range can now exceed that interval.
Upgraded software
As always, other pieces of software have been incorporated and updated in this new version of WOCU-Monitoring:
Software |
Previous version |
Current Version |
Observations |
|---|---|---|---|
react |
17.0.2 |
18.2.0 |
https://github.com/facebook/react/blob/main/CHANGELOG.md#1820-june-14-2022 |
react |
1.3.9 |
1.8.10 |
https://www.influxdata.com/blog/release-announcement-influxdb-oss-enterprise-1-8-10/ |
nginx |
1.14.2 |
1.24.0 |
|
python3 |
3.8.16 |
3.9.17 |
https://www.python.org/downloads/release/python-3917/ https://docs.python.org/3/whatsnew/3.9.html |
lmd |
2.1.5 |
2.1.7 |
|
grafana |
6 |
8 |
https://grafana.com/docs/grafana/latest/release-notes/release-notes-8-0-0/ |
About WOCU-Monitoring
WOCU-Monitoring is a monitoring tool that integrates the latest Open Source technologies for monitoring, visualization, metric graphing, and log management, providing extensive visibility into the status and availability of network elements, servers, databases, and workstations (among others). This is achieved through custom Monitoring Packs.
In addition to the Free, the Enterprise version of WOCU-Monitoring allows for deployments of thousands of IP devices in a distributed environment, with customizations tailored to the infrastructure of each client.