Release Notes 0.34
Here we present the new features of WOCU version 0.34 after a month and a half of hard work by our development team and other contributors.
The reporting module has been improved by adding several functionalities to existing reports and by improving the management of localised dates in the scheduling of reports.
Work has also been done to enrich asset discovery tasks to make them more flexible by adding new options.
On the other hand, the user experience has been improved with several changes such as being able to configure basic asset attributes from the monitoring page itself and to show the alias of the services from the interface. In addition, it is now possible to configure service-based business processes and massively apply packs to monitored assets.
In addition, user authentication has also been improved, allowing to manage the realms to which a user can have access through groups, which allows to manage users in a more comfortable and controlled way and facilitates the integration with delegated authentication systems such as LDAP.
In conclusion, in this latest update, we continue working on functionalities that provide greater flexibility, agility and comfort in operator tasks and asset management, as well as maintaining the usability, simplicity and scalability that characterises WOCU.
But there’s more, so keep checking this document for a full list of what’s new in this version.
Information
Multimetric Report enhancements
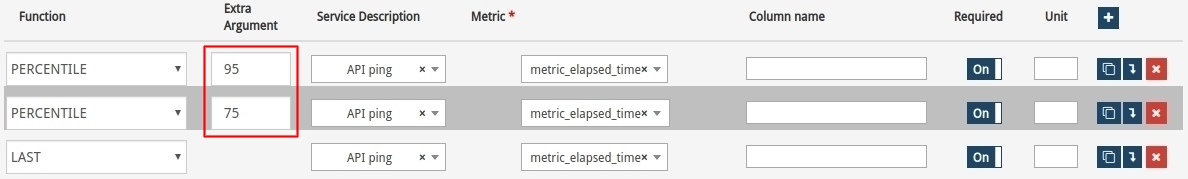
In the previous version 0.33, the Multimetrics Reports only allowed to apply the Percentile function with a value of 95. In this new version, this function becomes configurable, allowing the operator the possibility to take percentiles of any value of the metrics monitored by WOCU, without limiting the configuration of the function and giving more flexibility to the multimetric report.
By selecting the PERCENTILE option from the drop-down, a new Extra argument field will appear to define the value of interest in the new multi-metric report.
Note
More information can be found at: Function.
Service filtering in the Availability Report (SLA)
Included in the generation of Availability Reports is the ability to filter by certain services, in the context of:
Hosts and Services
Only Business Processes (Only BPs - Hosts & Services)
All (All)

This functionality allows, for example, to obtain an availability report only taking into account the services whose name/description includes the configured text string. The field will behave as a regular expression, providing greater flexibility and customisation on filtering.
The regular expression used will be visible in the configuration panels of the resulting report (including in PDF format).


Note
More information can be found at: Filter service by.
Important
Regular expressions will be case insensitive to facilitate filtering.
A simple string or complex regular expressions can be used (see the python documentation for reference).
Discovery tasks
Filtering per interface in the SNMP import task
The SNMP import task (see SNMP_Import task) is able to discover the network interfaces associated with each host and add them as ready to monitor without human intervention. A new option has been added to this import task to filter by the type of interface discovered. For this, a regular expression (regexp) is used to aggregate the discovered interfaces that comply with this expression.

A simple string or complex regular expressions can be used (see the python documentation for reference).
Note
Note that these expressions will be case-insensitive to facilitate filtering.
The fields to check against are the interface description (ifDescr) and the alias (ifAlias).
This functionality is really useful for e.g. discovering only the WAN interfaces (if the equipment administrator has set an appropriate description or alias for each interface).
Examples of search expressions, from simpler to more complex:
Intel
(Fast|Giga)Ethernet
.*WAN.*/\d+/\d+
The regular expression must be valid, otherwise the form itself will do the corresponding validation.

Important
Regular expressions will be case insensitive to facilitate filtering.
A simple string or complex regular expressions can be used (see the python documentation for reference).
Improvements in network scan import task
WOCU provides several import tasks for automatic asset discovery. One of these tasks is the network scan import task which has been significantly improved in this version.
In order to load the network assets as automatically and completely as possible, the import task is now able to assign the corresponding packs to each discovered host, based on the obtained properties, such as operating system and open ports.
In this way, the open ports of each machine will be monitored by the tcp-generic pack, but other packs will also be applied, e.g. the http pack in the presence of an open port 80 or 443.
Interface
Display Name en Servicios
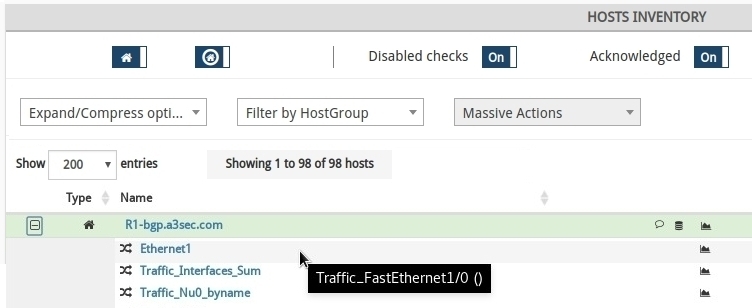
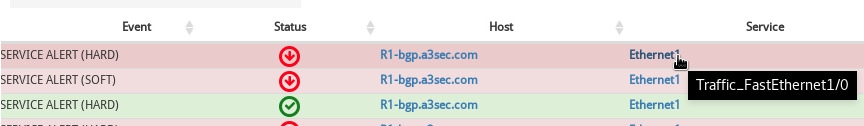
Added functionality to display the display_name of services instead of their description. Whenever a service has this attribute configured, its display_name will be displayed wherever it appears.
Remember
A display_name is an alias by which the service will be known in WOCU, making it easier to understand and identify services referenced by the name assigned by the operator.
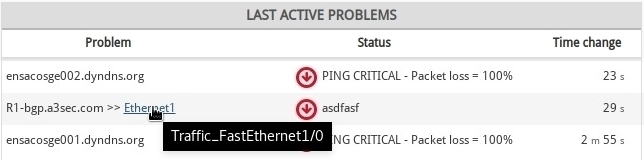
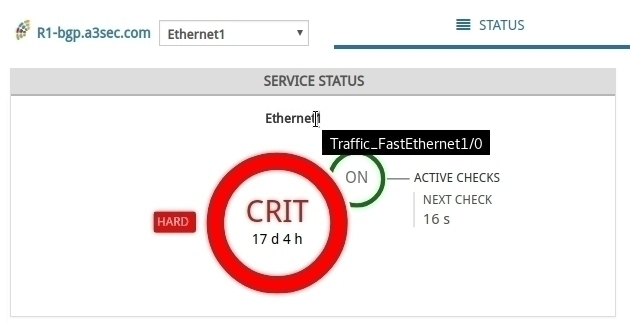
If on the other hand there is no display_name associated, the service will be displayed named as usual, with its description. In all possible cases if the display_name of the service is displayed, the description will also be displayed via a tooltip.
See the following examples:
Host Inventory from the Assets section:
Last Active Problems panel of the Status section:
Modal Services:
List of Monitoring Events (Monitoring) from the Events section:
Asset configuration
Automatic snapshot at each complete restart of WOCU
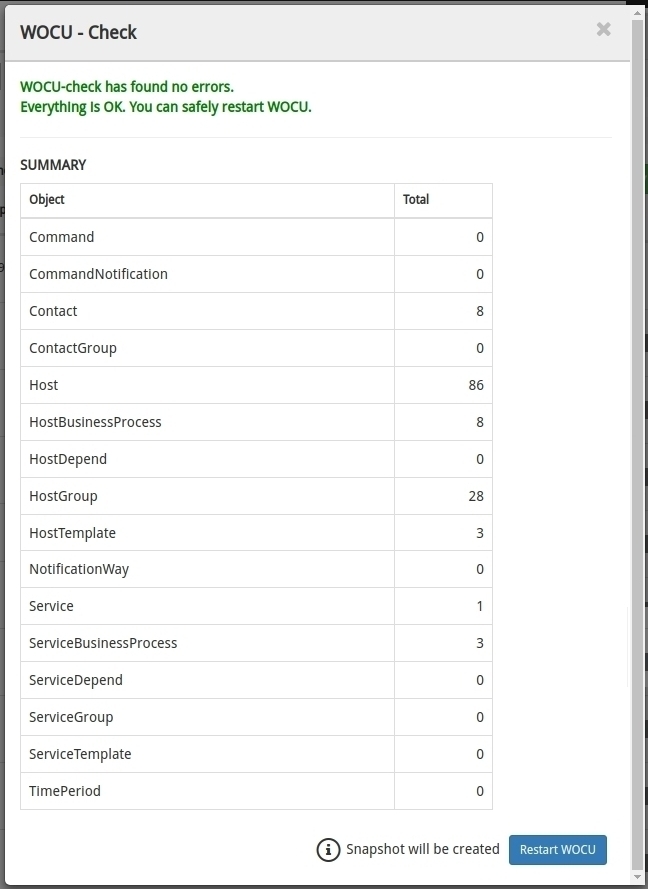
In import-tool it is necessary to perform an asset configuration check in order to restart the services. In this new version, automatically before restarting, a backup of the asset configuration will be created as a step before restarting. This is really useful to keep an automatic history of previous asset configurations, in order to be able to reapply them if necessary.
The interface has also been changed to warn the user about this behaviour.
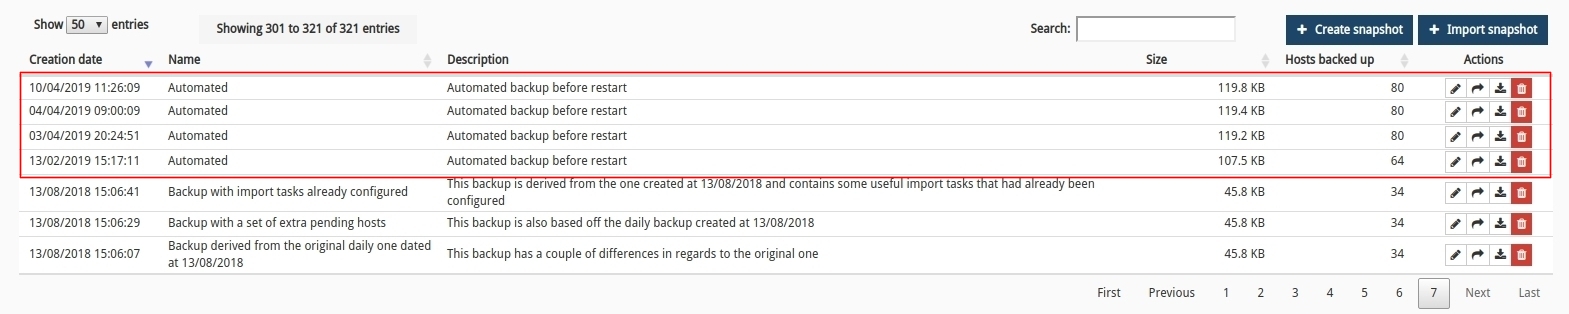
In the Snapshots section, all the backups of the configurations performed are listed. Those executed on WOCU restart will be registered with the name Automated in the global listing, along with the exact date and time of creation, for easy identification.
Host and Business Process Editing from the Host Modal
In previous versions, editing of Business Process Hosts and Business Process Hosts (BP Host) was only possible from the import-tool.
Now, for the operator’s convenience, a new editing tab has been added to the Hosts and Business Process Hosts modal, facilitating the manual modification of basic configuration parameters of assets monitored by WOCU.
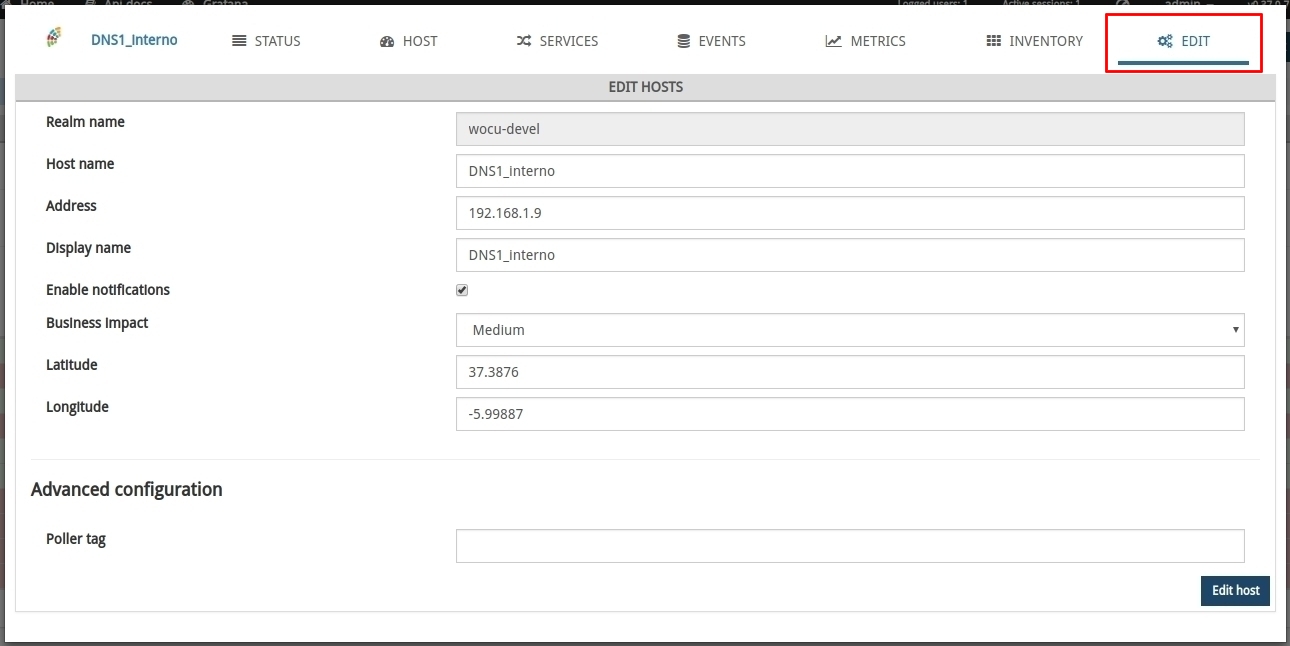
This tab will only be visible and accessible from standard Realms, i.e. it will be hidden for Realms based on Hosts Groups and Multirealm.
Note
More information can be found at: Edit Host.
Bulk configuration of packs
It is now possible through the Active assets and Pending assets tabs of the import-tool to mass configure monitoring packs to Hosts.
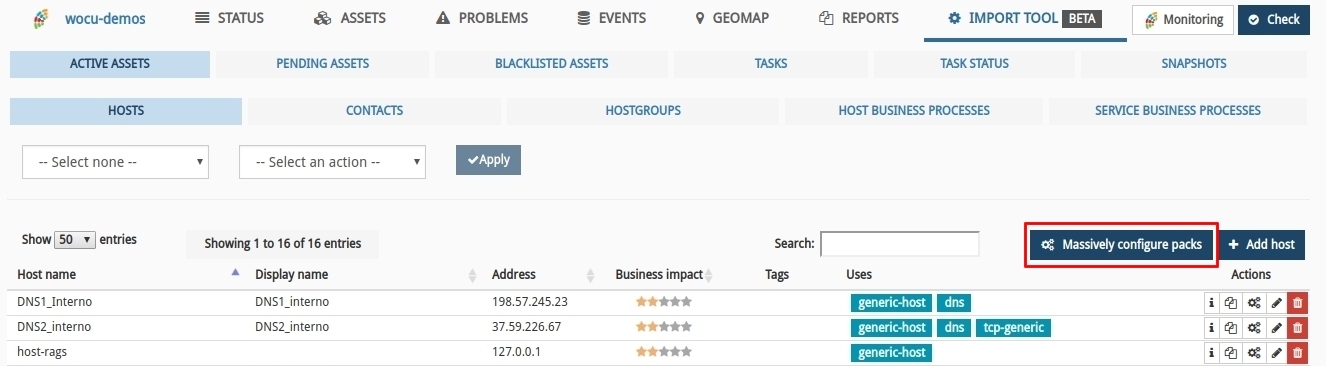
You will be able to select from a list of Hosts and then from a list of packs, and then choose to assign or unassign the chosen packs to the selected Hosts.
If packs are assigned, the behaviour will be that the selected packs will be added (if not already applied) and without removing the previously assigned packs. If the action is to unassign packs, it will remove the selected packs if they were assigned on any of the selected Hosts, otherwise no action will be taken.
Note
More information can be found at Packs.
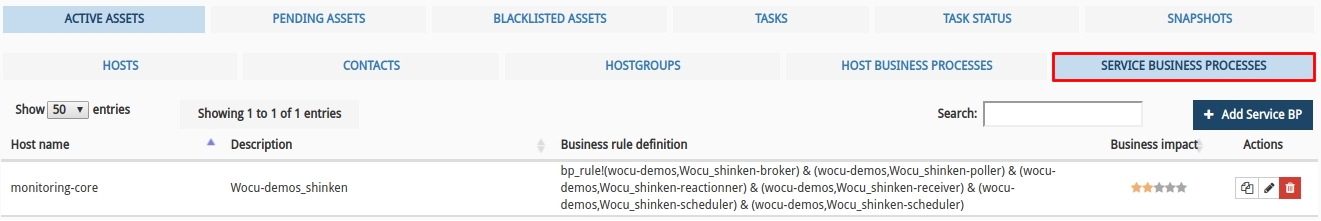
New tab for Service Business Processes
A new subsection has been added in Active Assets (integrated in the Import-Tool), for the registration and management of Business Process Services.
As in the other subsections: Hosts, Hostgroups, and Host Business Processes, from this single interface it is possible to create, edit, duplicate and delete items from the list of services.
Remember
A Business Process Service (BP Services) is a logical definition created by the user in WOCU, at the time of its configuration, that groups one or more Services defined in logical and/or physical Hosts, i.e. Business Process Host Services and/or physical Host Services.
Note
More information can be found at: Service Business Process.
API
Performance improvements when querying host information
The WOCU API provides two endpoints capable of obtaining information about the hosts configured in all realms. One of these endpoints obtains information relative to a given ip address while the other endpoint obtains information relative to a host name.
get /api/config/hosts/host_name/{host_name}
get /api/config/hosts/address/{address}/
Since the same host can be configured in several monitoring realms, these endpoints are responsible for querying all the import-tools associated with each of the realms in turn. Because the current implementation sends these requests sequentially, resolving these endpoints is quite time-consuming.
In this release, the entire import-tool request/response flow has been implemented in parallel using threads to substantially improve overall response times. Ideally, the response time is now equal to the slowest response time among all configured import-tools, instead of the sum of the time of all import-tool requests as before.
These endpoints are used, among other things, to complete information in the processing of traps and syslog events with the importance that this entails when a large number of events are received.
Documentation
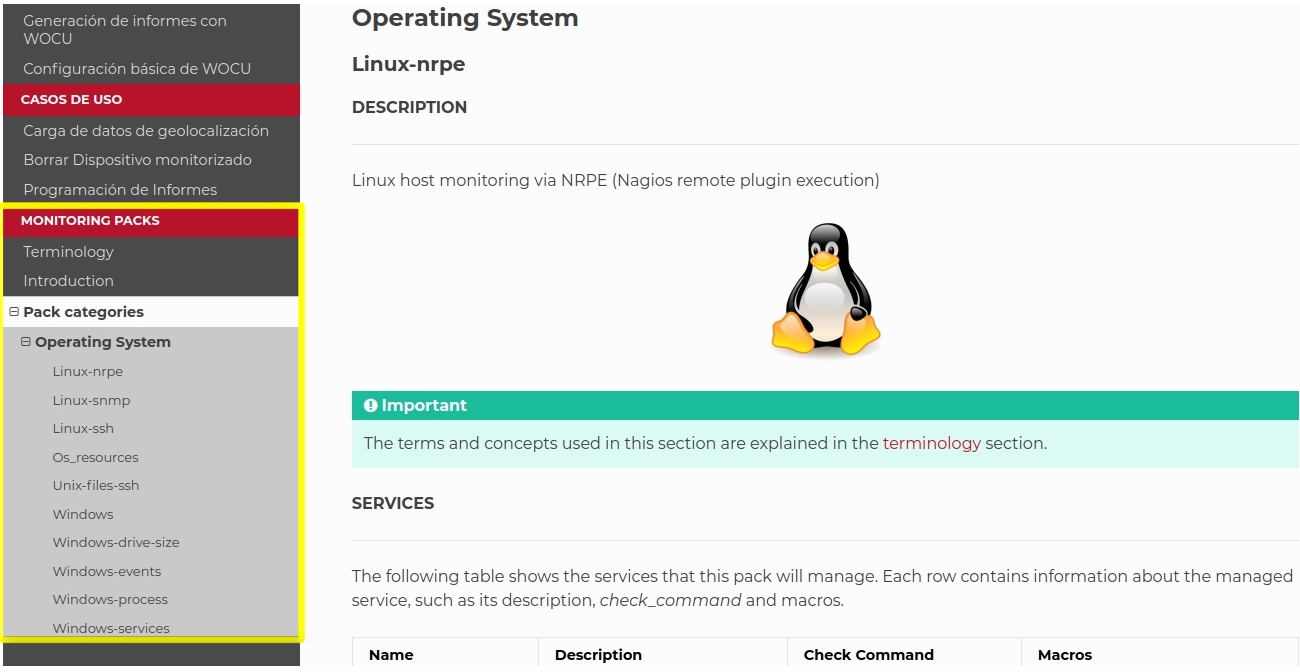
New Monitoring Packs catalogue
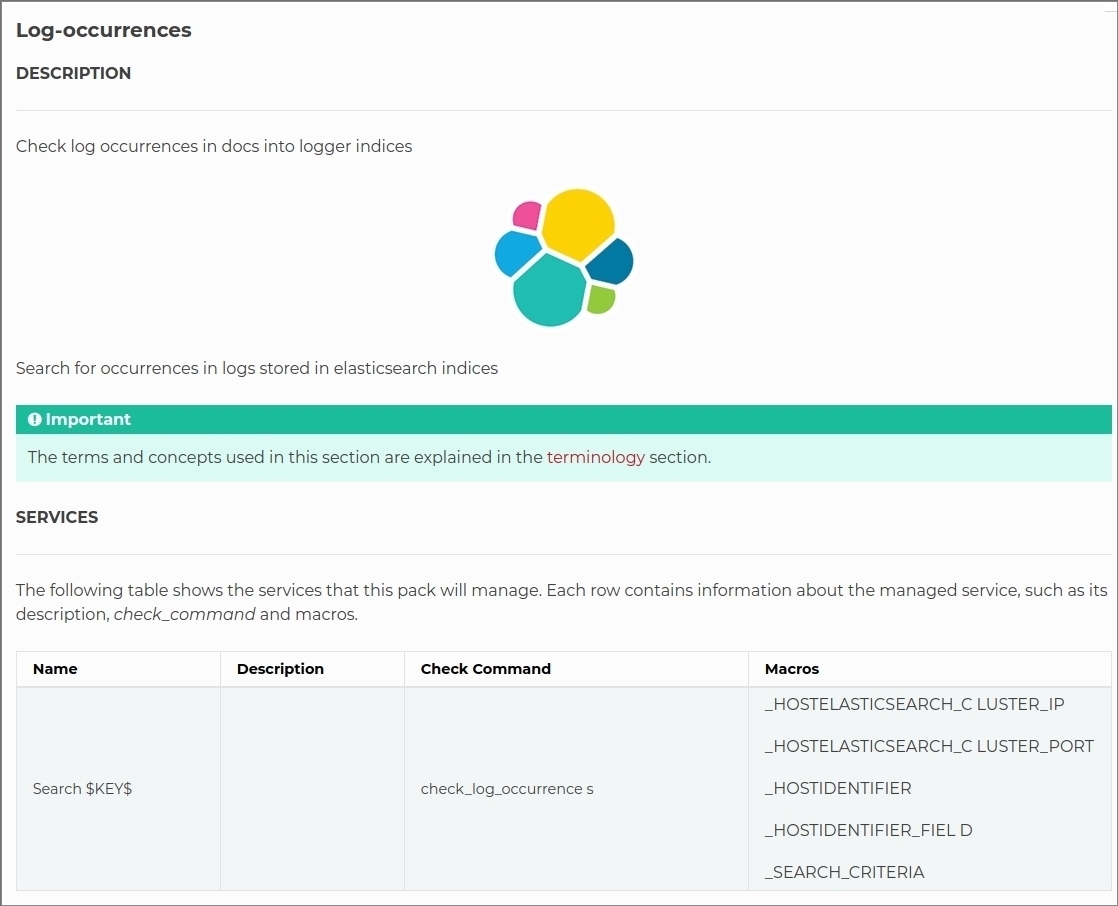
A new chapter has been added to the technical documentation of WOCU, namely a complete catalogue of Monitoring Packs available in the tool.
Remember
A Monitoring Pack is a preset WOCU model or configuration profile, which performs a specific monitoring function. They are created and designed according to the most common technologies currently available on the market.
This new chapter is organised in three sections:
Terminology: compilation of a set of key concepts in the configuration and application of monitoring packs.
Introduction: section whose main purpose is to contextualise the user in relation to the packs and their scope in the tool.
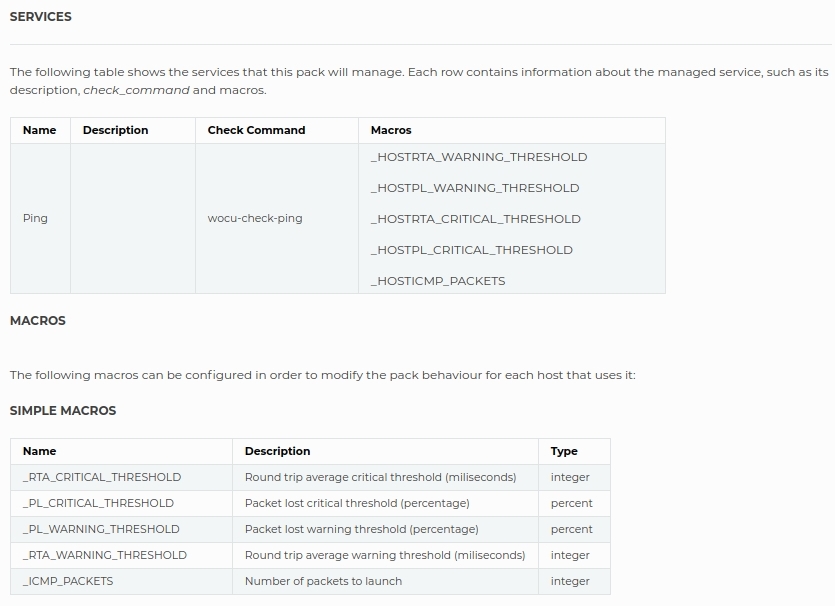
Pack categories: packs are classified into categories according to technical and functional aspects. Here you can find a detailed description of each pack (along with its services, macros, discovers, etc.) associated to a specific category.
Most of the information is presented in table format to facilitate the reading and organization of the data.
Unlike the rest of the manual, the documentation in this chapter is self-generated from the information in the packs themselves. For this reason, it may contain some inconsistencies or empty fields that will be filled in and updated over time. Similarly, this chapter is written in English, as all packs are registered and documented in WOCU in English.
The creation of packs is continuous and will depend on the appearance of new technological or functional needs, which will lead to a fully updated catalogue.
Note
Access the Monitoring Packs catalogue at the following link.
Link of packs to their technical documentation
In the Hosts configuration, specifically in the pack assignment section (inside the import-tool), we can see a brief description of the usefulness of each one of them.
Previously, in some packs, this information was extended by the + button, providing additional information. In this new version, all packs now have the ❓ icon, which links to the technical documentation of the specific pack.
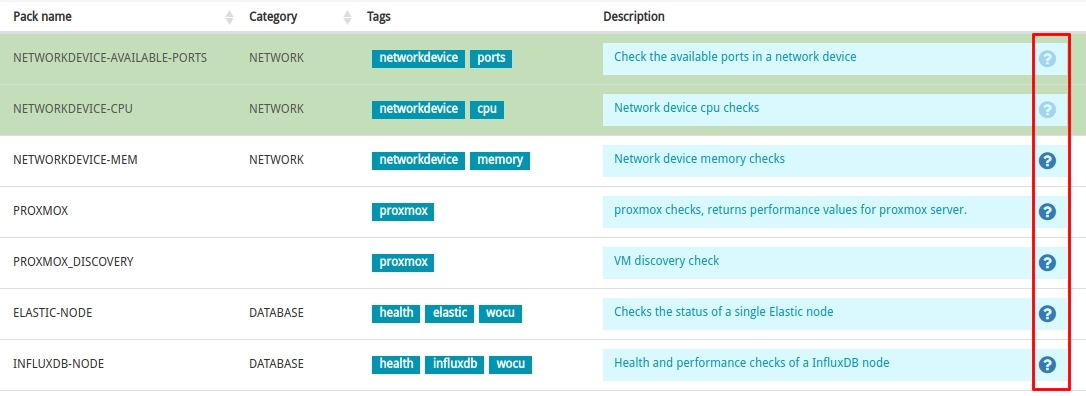
In the technical documentation of the monitoring packs, you will find a detailed description of each pack, along with the services it manages, simple and complex macros, discovers, etc…
Note
Access the Monitoring Packs catalogue at the following link.
Authentication and authorisation
Realm visualisation through user groups
WOCU allows you to configure from the Administration interface which realms are accessible to each of the system’s users. In this way, it is possible to define viewing or restriction access to certain realms, allowing an operator to view only the realms that affect his daily operations and, likewise, prevent him from viewing unauthorised information from other realms in question.
The problem comes when the number of users and realms grows out of all proportion, and this granularity of user permissions becomes unmanageable.
As a solution, in this version we have added the possibility of managing permissions for viewing realms by means of user groups. This simplifies the configuration and joint definition of permissions, as it will only be necessary to keep the list of users integrated in a specific group up to date.
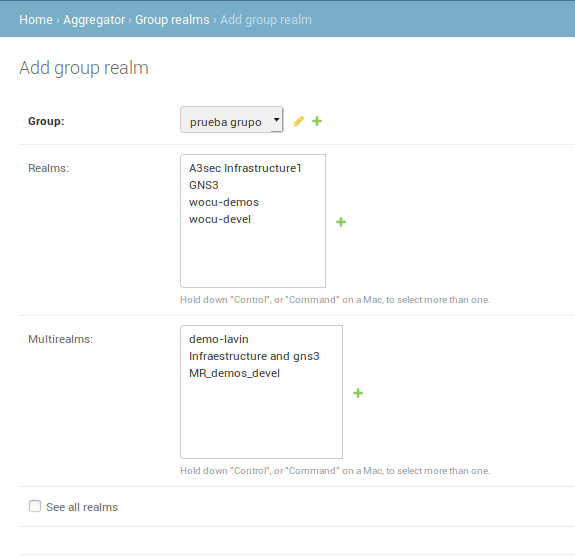
In conclusion, a user will now see the realms to which he/she has access individually, plus the realms visible to the group(s) in which he/she is integrated.
Note
More information can be found at: Realm display configuration.
Monitoring packs
Below are the updates made to some of the packs provided by WOCU-Monitoring. For a complete list of the monitoring packs supported by WOCU, the pack catalogue can be found in the following link.
Elastic-node
The pack that monitors Elastic, is now usable to monitor entire clusters by monitoring by node names instead of by identifier.
Linux-ssh
The script that obtains memory usage metrics has been modified to return results in bytes (B) instead of kilobytes (KB). In this way, the autoscaling of RRD graphs creates consistent units of measure by adding the prefix K, M or G to the unit B.
Networkhost-traffic
The interface traffic calculation script has been improved, so that when using SNMP version 2 the 64-bit counters are checked as before, but with the new feature that if these counters are not available, the 32-bit counters are consulted. This avoids having to monitor hosts without 64-bit counters using version 1 of the protocol.
Umts-generic y networkhost-mobile-signal
Support for LTE (4G proprietary) technology has been added to the umts-generic pack. In addition, a new networkhost-mobile-signal pack has been created, with this and other changes that will decommission umts-generic in future releases.
Cisco-interfaces-advanced-health
Thresholds (warning and critical) have been added for each of the monitored services:
crc
overruns
collisions
giants
drops