Release Notes 0.41
The following are the new features of the 0.41 version of WOCU Monitoring.
We continue to work on a unified and homogeneous monitoring line. WOCU is an all-in-one tool, where all the information regarding the status, performance and capacity of the monitored infrastructure is integrated in a single console. Thus, this version adds the new Performance view, where all the monitoring metrics are collected together with their performance values, recorded for each service, as a result of the continuous checks in terms of operability towards the network elements.
Regarding the Inventory module of asset data and attributes, WOCU is now able to detect links in inventory values and convert them into clickables. Another feature that continues to optimise one of the tool’s most powerful modules
The sorting method of two of the most relevant columns in the Problems tables has also been modified: Impact and Duration. These fields are closely related and will allow the operator a more agile resolution of alerts depending on the assigned impact.
Although the Differences action for Hosts in the pending list was added in the previous version, it has been improved by adding a new table that breaks down which Configuration Macros have been recently updated
We continue to enrich our User Manual with a new use case on how to get the most out of Passive Monitoring in WOCU, by applying a specific pack.
In terms of security, on this occasion we worked on the ability to monitor access attempts to the tool. Being aware of WOCU’s exposure on the internet, it was necessary to work on access traceability, to detect failed authentications and act accordingly by blocking accounts.
In addition, new enhancements have been added to the configuration API and we continue to add value to our catalogue Monitoring Packs, both by adding new monitoring packs and services, and by supporting new technologies and manufacturers.
This version comes loaded with new integrations and improvements, read on and read the complete list of new features and get more information with the User Manual if necessary.
Interface
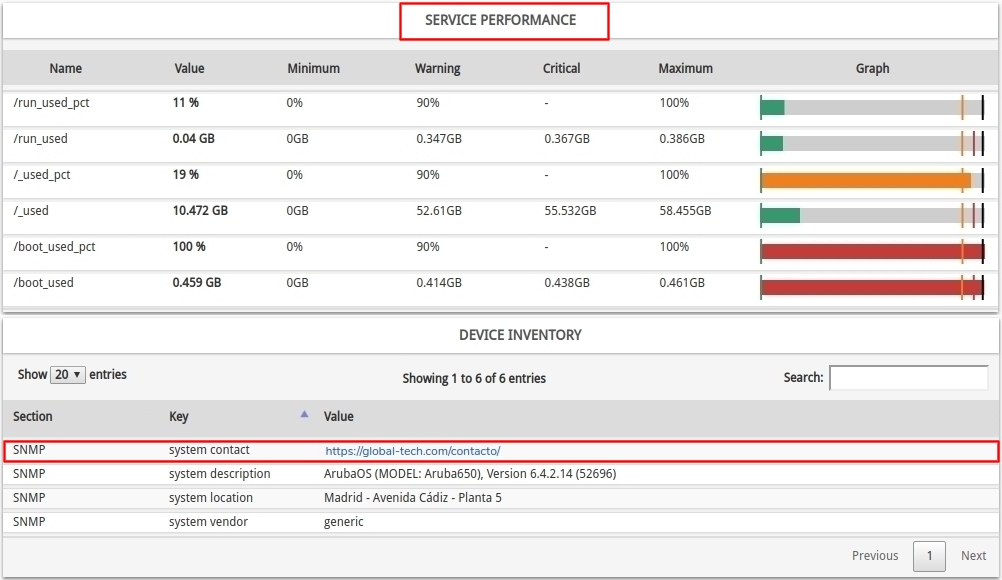
New Performance data view (Performance) of monitoring metrics
WOCU’s operation is broadly as follows: a pack monitors Hosts via services. As a result of the operability checks that the service launches on a Host, metrics are generated that record performance values, allowing a deeper analysis of the service, and consequently, of the Host in terms of availability.
In this new version, WOCU adds a new tab called Performance, where the monitoring metrics generated for each service are compiled. The set of values is presented in a tabular format, where an entry is included for each metric, which facilitates its individualised study. This table is merely informative, it does not allow any change to be made to the Host.
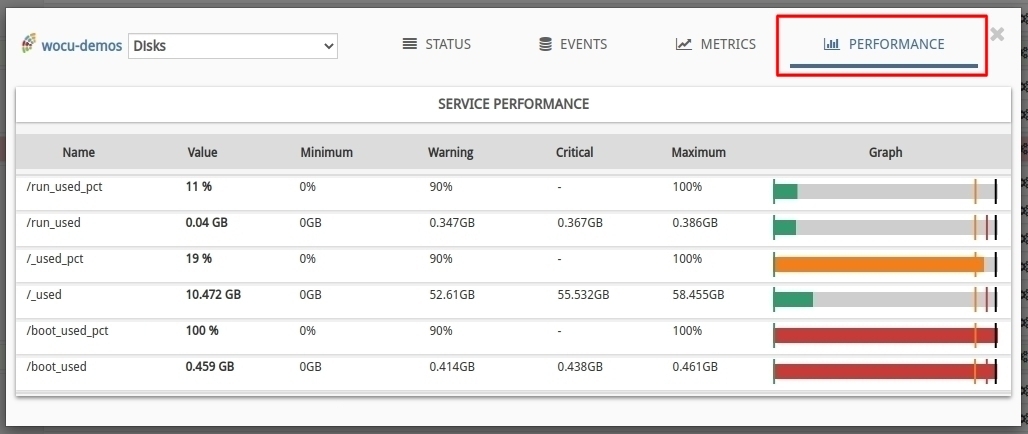
The Service Performance table contains the following data:
1. Monitoring metrics data:
Name: name of the monitoring metric.
Value: last performance value recorded in that metric.
2. Measurement thresholds:
Minimum: defined minimum threshold that the metric can reach. It is identified by a green vertical line positioned (normally) at the beginning of the bar.
Warning: defined threshold above which the metric will reach a warning or alarm state. It is identified by a vertical orange line.
Critical: defined threshold above which the metric will reach a critical state. It is identified by a vertical red line.
Maximum: maximum defined threshold that the metric can reach. It is identified by a vertical black line positioned (normally) at the end of the bar.
3. Graphing the metric:
Graph: the current value of the metric (column Value) is represented graphically by a rectangular bar of length proportional to the recorded value.
Thresholds act as indicators and are represented by vertical lines along the bar. Each threshold has an identifying colour associated with it.

The colour distinction is as follows:
Light grey colour: indicates the absence of metric data (value = 0).
Dark grey colour: indicates that the value is lower than the set minimum.
Blue colour: indicates the existence of a recorded value but no alert thresholds. This situation generates some uncertainty about the actual status of the metric.
Green colour: indicates that the value is above the minimum value and below the warning thresholds.
Orange colour: indicates that the value is above the WARNING threshold but does not exceed the upper thresholds.
Red colour: indicates that the value is above the CRITICAL threshold or higher.
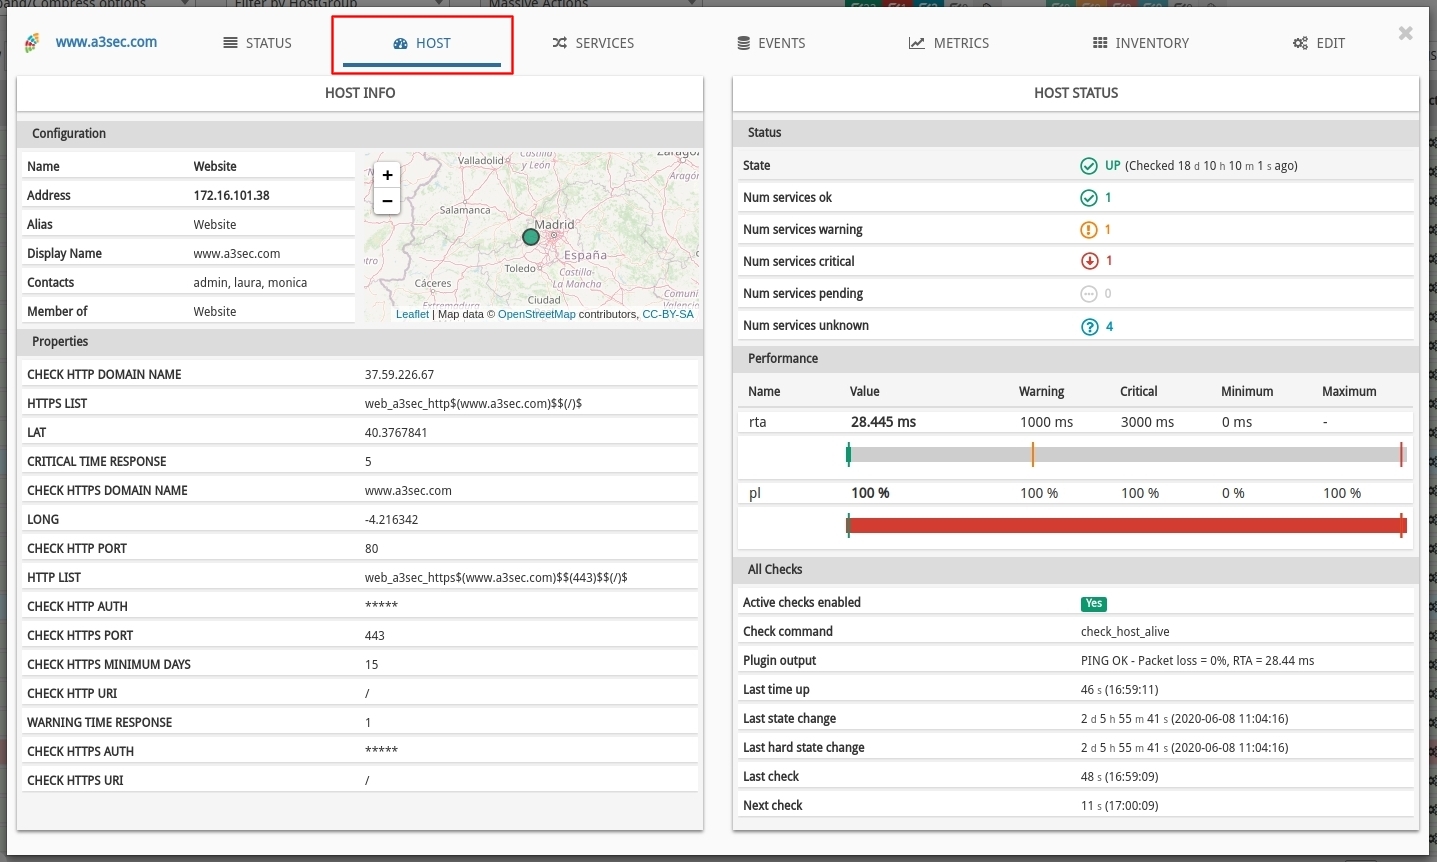
Finally, this table has also been included in the Host Info section, in particular in the HOST STATUS section, which provides precise information on the configuration, properties and status of the Host in question.
Thanks to the versatility of WOCU to manage an infinite number of Monitoring Packs, services and metrics of different kinds, it is possible to generate performance tables that allow us to carry out a detailed study and to know the real situation of our network or infrastructure, as well as to help identify problems and errors in performance and capacity.
We continue to work to integrate and provide in a single console, all the information regarding the status, performance, limitations and capacity of the assets that WOCU manages and monitors, without having to resort to other external tools.
Note
More information can be found at: Performance.
Aggregation of links as Host inventory values
WOCU has its own powerful inventory module, where technical and functional data is stored and provided for each monitored asset. These inventories are enriched with new or updated values, discovered after launching one of the many inventory import tasks available.
From this new version, the system will detect the links in the text of the inventory values of a Host and convert them into clickable. Centralising all the information served in the WOCU inventory, you can even link to other databases, documentation and tools in your organization from a single point.
From the tab Inventory.
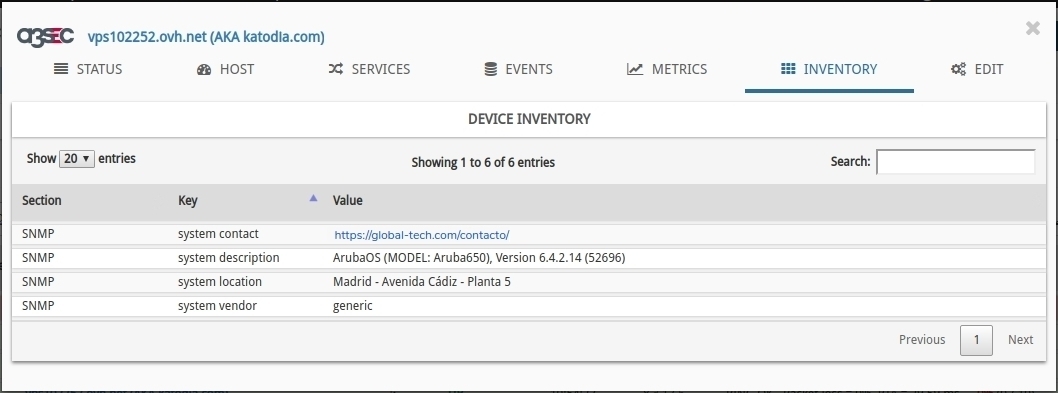
From the Device Inventory Reports.
The comfort, agility and navigability in the use of our tool is paramount, therefore WOCU facilitates the aggregation in a single view of all the information of interest of a Host (whether text or link), unlike other solutions that must resort to third party applications for inventory management.
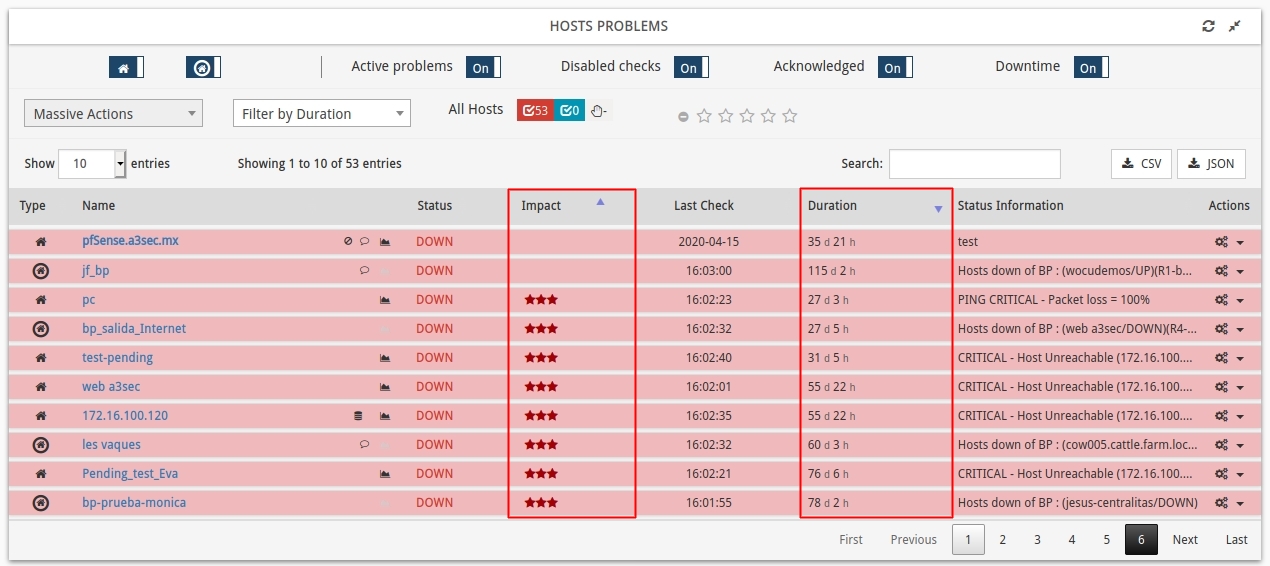
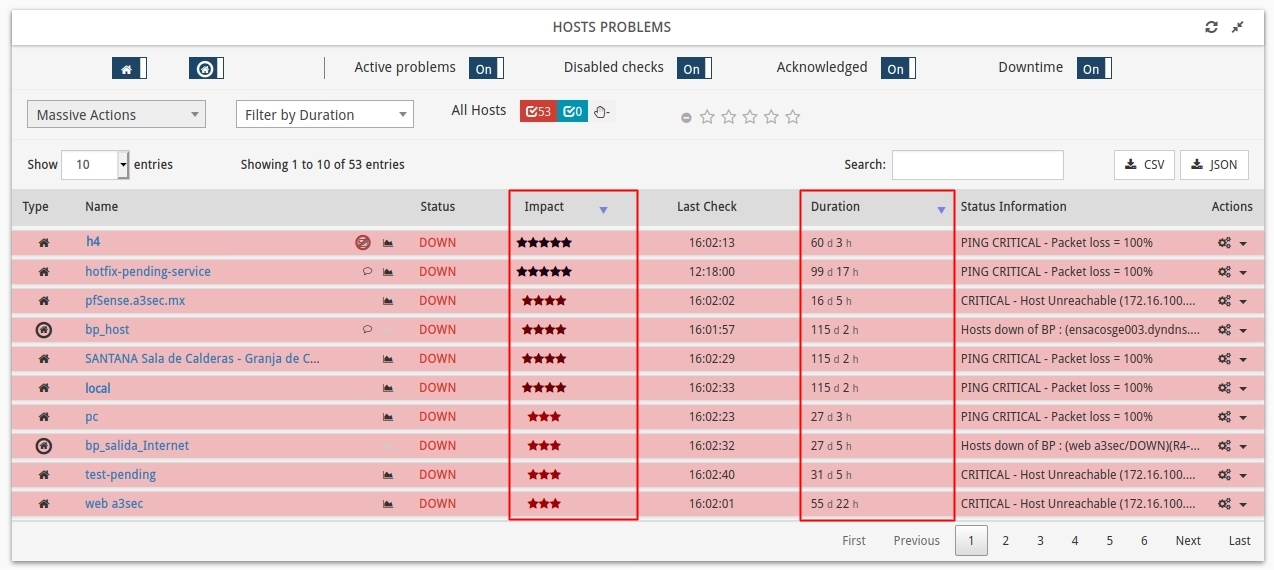
Multiple sorting of the columns Impact and Duration in the list of Hosts Problems.
One of the crucial concepts in the monitoring and operation of networks and systems is the diagnosis and management of Problems. The usual workflow in the WOCU environment assumes that every alarm must be examined and dealt with by the operator or Administrator. Therefore, it is always a good practice to acknowledge (Acknowledged) the processed issues, alternatively to disable the active checks (in certain circumstances), or to apply the scheduled downtime (in case of scheduled maintenance or intervention). In this way, the alarm view will be kept as clean and uncluttered as possible.
This new version adds multiple sorting of the Impact (degree of criticality or importance of the asset in the business process) and Duration (time elapsed between the start and end of an alarm) columns. This means that after sorting (ascending or descending) the Impact column, the system will automatically display the values recorded in the Duration column in ascending order (for each scale of values), with the aim of placing the most recent incidents (shortest duration) in the first positions of the table, as their resolution is probably more urgent than the rest, since sometimes the operator voluntarily ignores some of them.
Ascending order of the Impact column:
Descending order of the Impact column:
In short, in addition to good practices in the use of the tool, such as the joint application of filters and actions that allow for a more organised management of alarms in complex environments, we continue to work on simplifying their treatment, prioritising the resolution of incidents from highest to lowest impact in the list of Host alarms.
Note
More information can be found at: List of alarms on monitored assets.
Improvements in the configuration
Incorporating modified Macros in the Differences action view of a Host
In the previous version 0.40 a new action was added for each Device in the Pending Assets table called Differences, where a tabular format presents the main configuration differences that a newly discovered Device has undergone, and that consequently, is hosted again in the pending assets DB
But this view did not show the Macros that had been modified in new discoveries. Therefore, this action is improved by incorporating a new table where the Macros that have undergone any modification are broken down, hosting in a single view all the attributes and configuration variables of a Device, without the need to access the administration backend to observe possible variations.
This new view will be distributed in two tables:
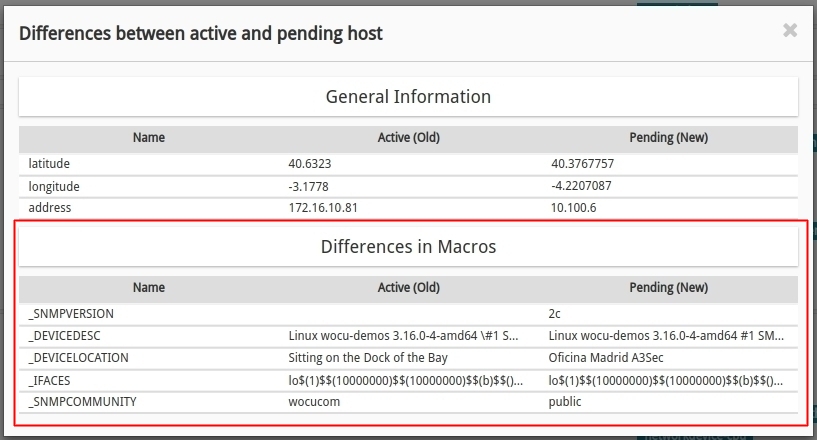
General Information: includes inventory attributes and properties that have been modified.
Differences in Macros: includes variables and internal Host configuration parameters that have been modified.
Note
More information can be found at: Actions from the Pending Hosts list.
Traceability and access blocking
More and more users are using WOCU to manage their infrastructures. And in many cases, WOCU is exposed to the internet to serve more customers. Therefore, it was necessary to add capabilities to track access, detect failed authentications and act on them.
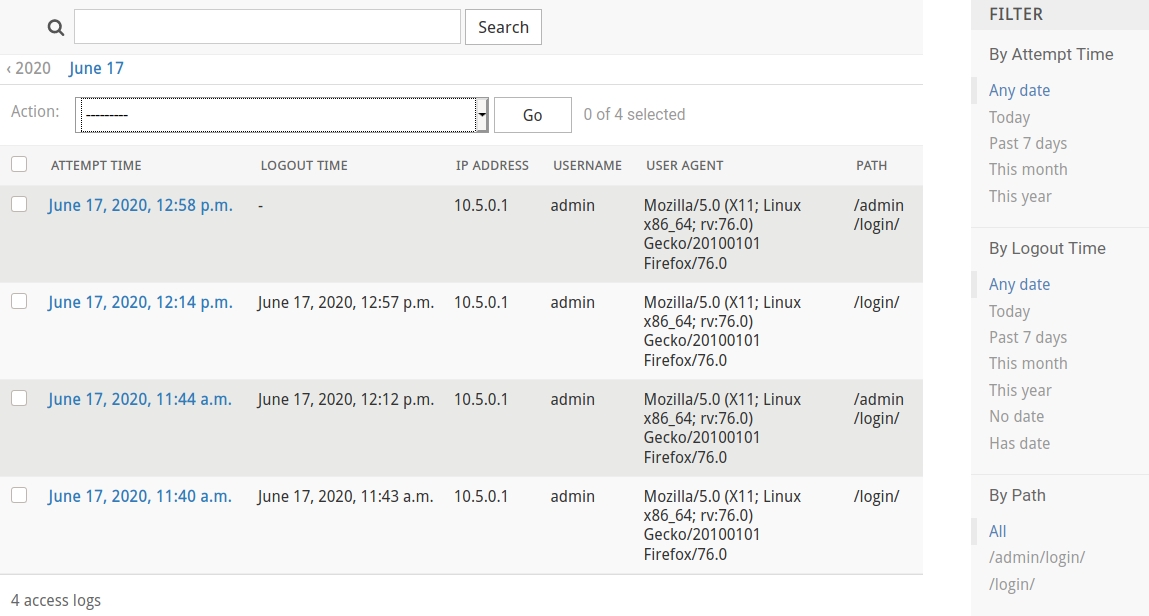
In this new version, a new additional security functionality has been added, the ability to monitor interface access attempts and to prevent brute force attacks, when a previously configured limit of allowed attempts is exceeded. This information will persist in the database making it possible to perform audits or forward logged events to other systems.
Access attempts are monitored by IP address, by user name, by user agent, or by a combination of both, and when the allowed limit is exceeded the user will receive the following message prohibiting access to the application:
Attention
Account locked: too many login attempts. Please try again later
Inactivity periods can also be configured to clear the accumulated failed attempts and thus re-enable access from the previously blocked IP address or user.
Note
More information can be found at: Access to WOCU-Monitoring.
API
Improvements to the configuration API
From this new version, it is now possible to add a new member to a given Hostgroup, by means of a request to the configuration API, without needing to know previously the members that compose it and without overwriting the established configuration.
In addition, the request for aggregation of new members is done through the Host_name and not by ID as previously implemented.
This enhancement is very useful when the number of members in Hostgroups and Business Processes is high, making the task of aggregating new items as agile and less tedious as possible.
PATCH /api/hostgroup/hostgroup1
Member (host_member/bp_members/hostgroups_members): new-member
Filter by domain or URL in the configuration of External Dashboards.
Previous versions of WOCU introduced the ability to integrate and display Dashboards from other tools such as Grafana
In many cases, the configured dashboards are not accessible from the browser due to access limitations to internal networks. A configuration variable has been added that allows to filter by a regular expression, dashboards of a given domain or URL name. In this way, users will not feel the confusion of displaying dashboards to which they do not have access beforehand.
New endpoints for the calculation of Key Performance Indicators (KPI’s)
New endpoints have been implemented for the calculation of Key Performance Indicators or KPI’s, which will allow us to obtain information regarding the efficiency during the resolution and escalation of incidents originating in the monitored plant.
Endpoints for obtaining KPI’s on the incidents of Devices and Services in a Realm:
GET /api/events/realms/{realm_name}/monitoring/kpi/hosts/
GET /api/events/realms/{realm_name}/monitoring/kpi/services/
Endpoints for obtaining KPI’s on the incidents of Devices and Services in a Multi-Realm:
GET /api/events/multirealms/{realm_name}/monitoring/kpi/hosts/
GET /api/events/multirealms/{realm_name}/monitoring/kpi/services/
These KPIs generate a list of the dates of all Device or Service (in Realms or Multi-Realm) outages that have occurred within the time period indicated, together with the date and user of creation of the associated ACK (if any) and the date of return to operation of the asset if this has already occurred.
In this way it is possible to quantify and measure levels of efficiency in terms of time, when responding to and resolving incidents that arise in the monitored infrastructure. The data returned will be useful as a measure to optimise the internal incident resolution process in order to ensure the best possible service operation.
Note
Access the full WOCU API documentation at: Public API documentation.
Other improvements and fixes
During the development of this 0.41 version, other aspects of the stable version have been improved and are listed below:
New options for filtering by duration have been added to the Problems page to further refine and limit searches.
Fixed an issue that prevented closing the Host modal when the
ACLssystem was enabled.Availability endpoints have been refactored by removing HTML tags.
Removed the display of certain macros with sensitive information on the Assets page.
It is now possible for a report to be public, even if it has no contacts/target assigned in the programming it.
Aesthetic changes have been made to the bulk actions table and the scheduled tasks table.
The final indicator obtained in Availability Reports is now truncated to avoid unnecessary decimals.
Fixed a bug in the contact/user listing of programmed reports, where users from other realms could be displayed.
The display of availability indicators has been improved when no data were found in the requested time range.
General improvements in the differences modal in terms of configuration between discovered Hosts and already monitored hosts
Fixed an issue with percentage type fields in the Monitoring Packs configuration.
The Top Hosts Reports now includes more conversion units in its options.
The Host availability graph by Ping now supports different monitoring intervals than the default.
The button that allows launch new import and asset discovery tasks, will now be disabled when the task in question is busy.
The Dashboards tab will now only be enabled when there are dashboards configured in the Realm. Except for Administrators whose display is permanent.
Documentation
New use case on Passive Monitoring in WOCU
A new use case has been added to the User Manual.
WOCU unifies and manages two methodologies for network monitoring: Passive Monitoring and Active Monitoring. Thanks to the combined use, the limitations of both typologies are reduced and the quality assurance level of our tool is increased, since problems are detected before they occur, or almost in real time, allowing a deep understanding of the root cause that has caused them.
So this use case shows how WOCU handles the logs indexed in the backend of events from the passive monitoring world, and how to create custom alerts based on these external events by configuring and applying the Log Ocurrences monitoring pack.
Note
More information can be found at: Passive monitoring using the Log occurrences pack.
Monitoring packs
See our catalogue of WOCU Monitoring Packs in the following link.
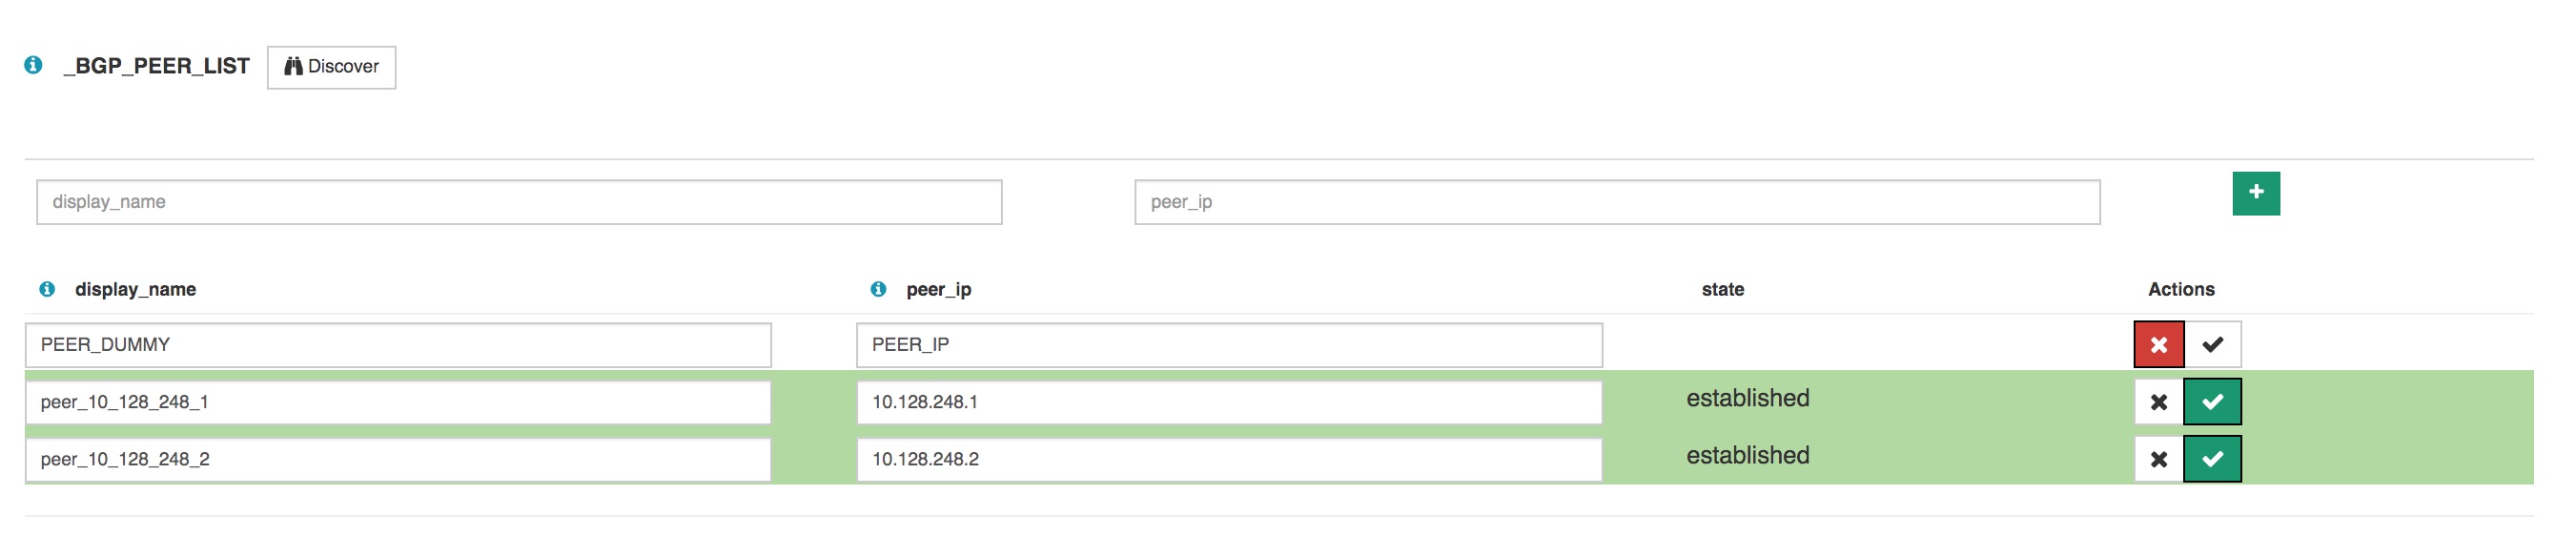
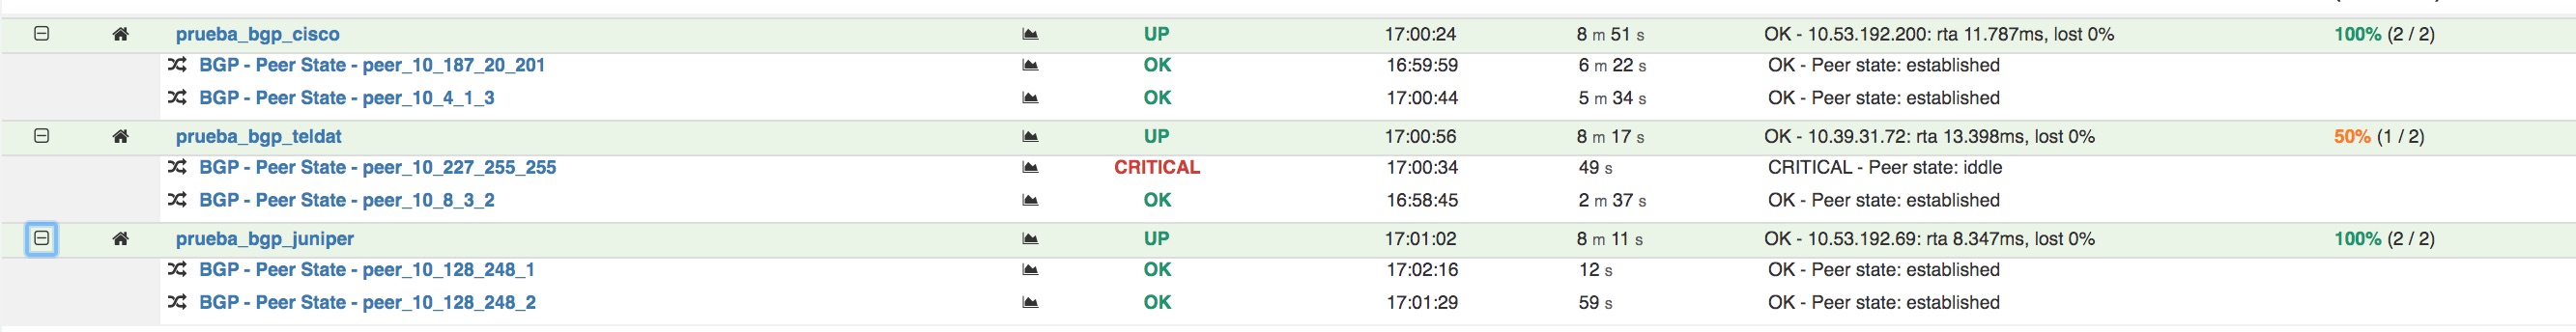
New bgp pack
This pack discovers the BGP peers configured on a router and monitors their status. It also generates alarms if the peer status is not established.
It has been tested with Cisco, Juniper, Huawei, OneAccess and Teldat equipment.
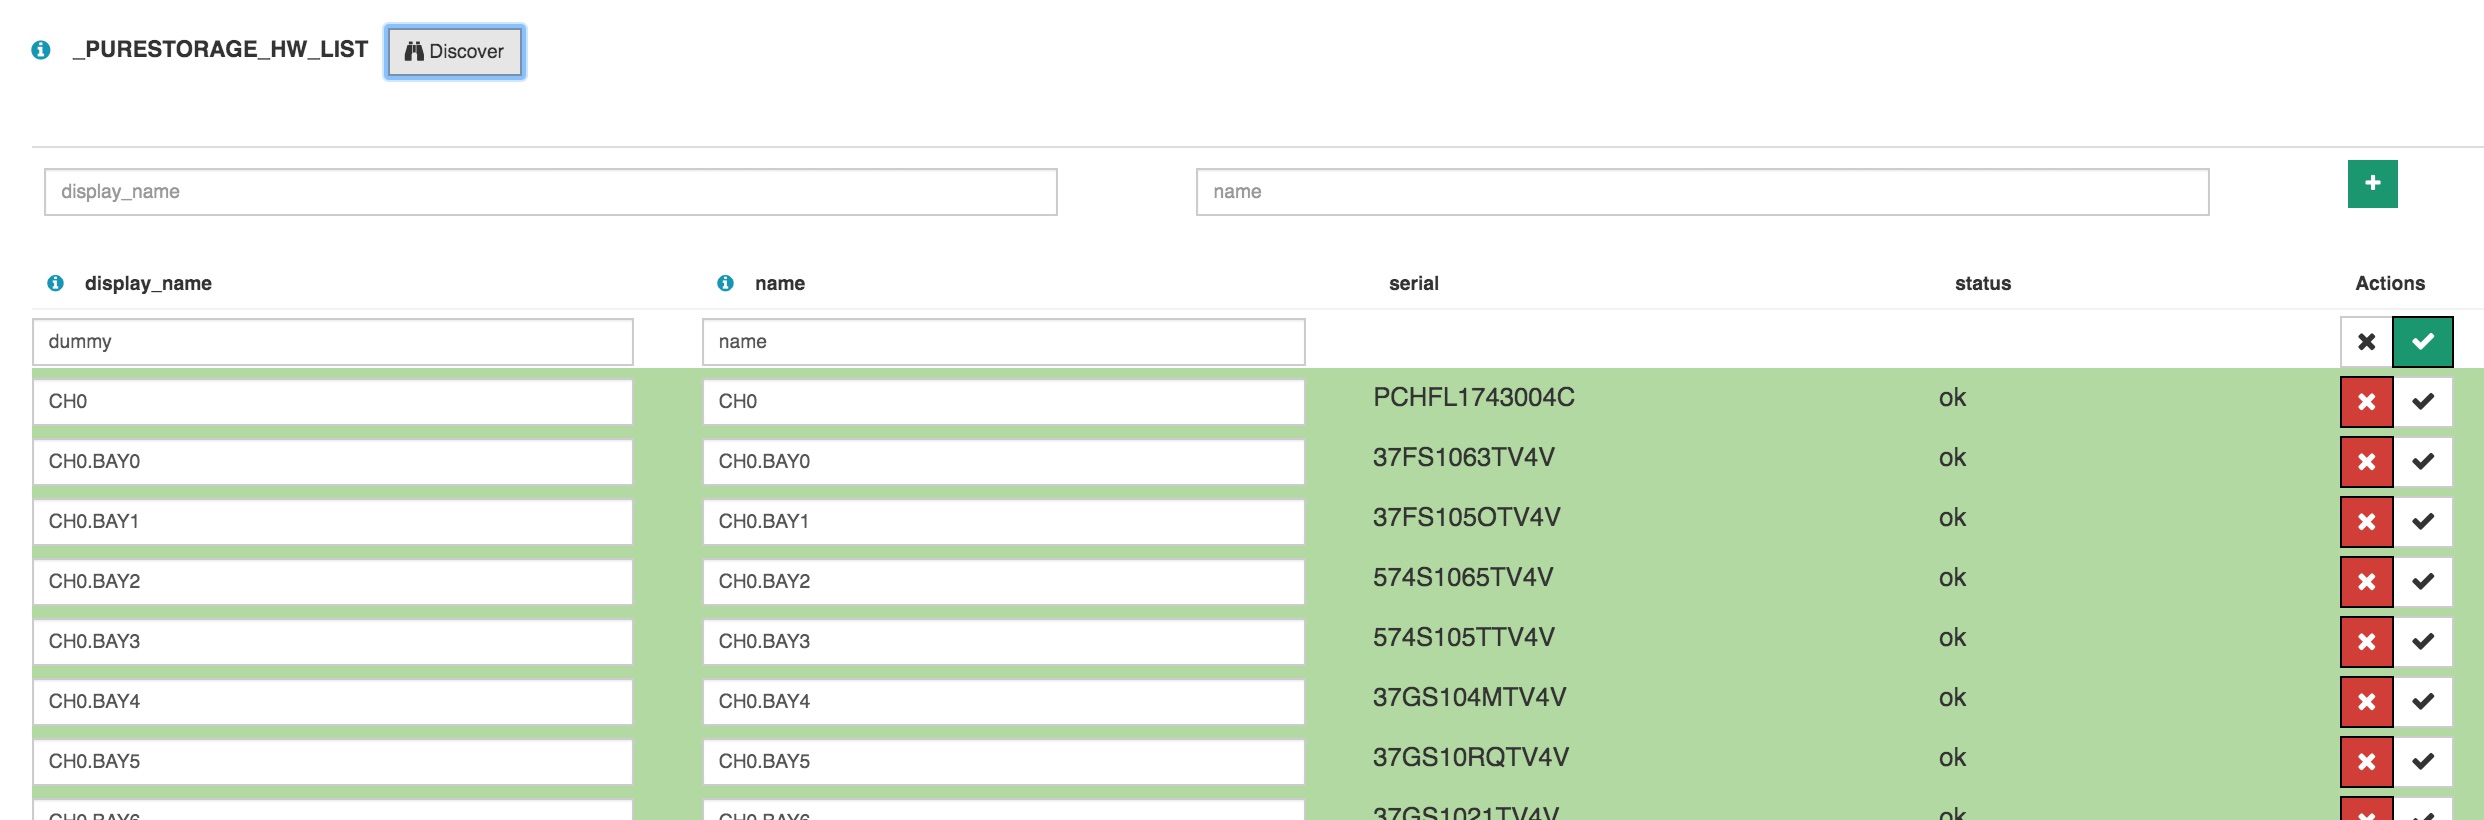
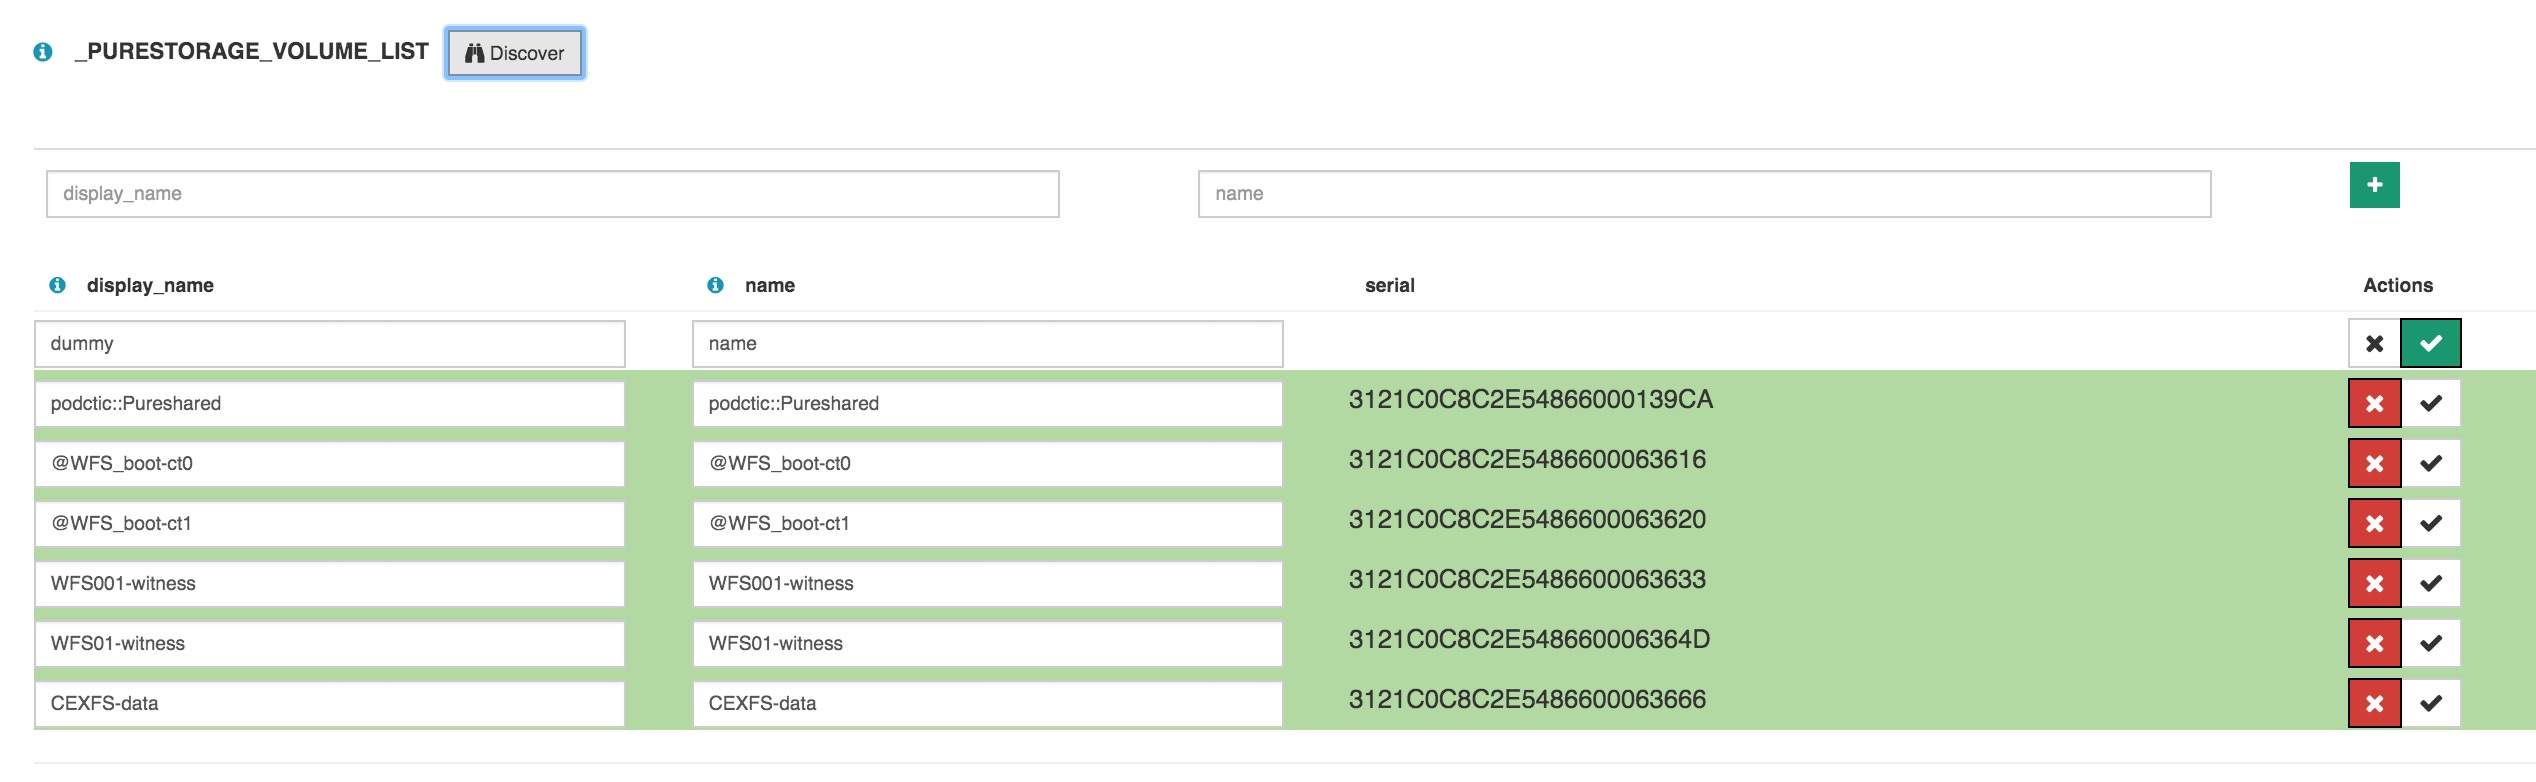
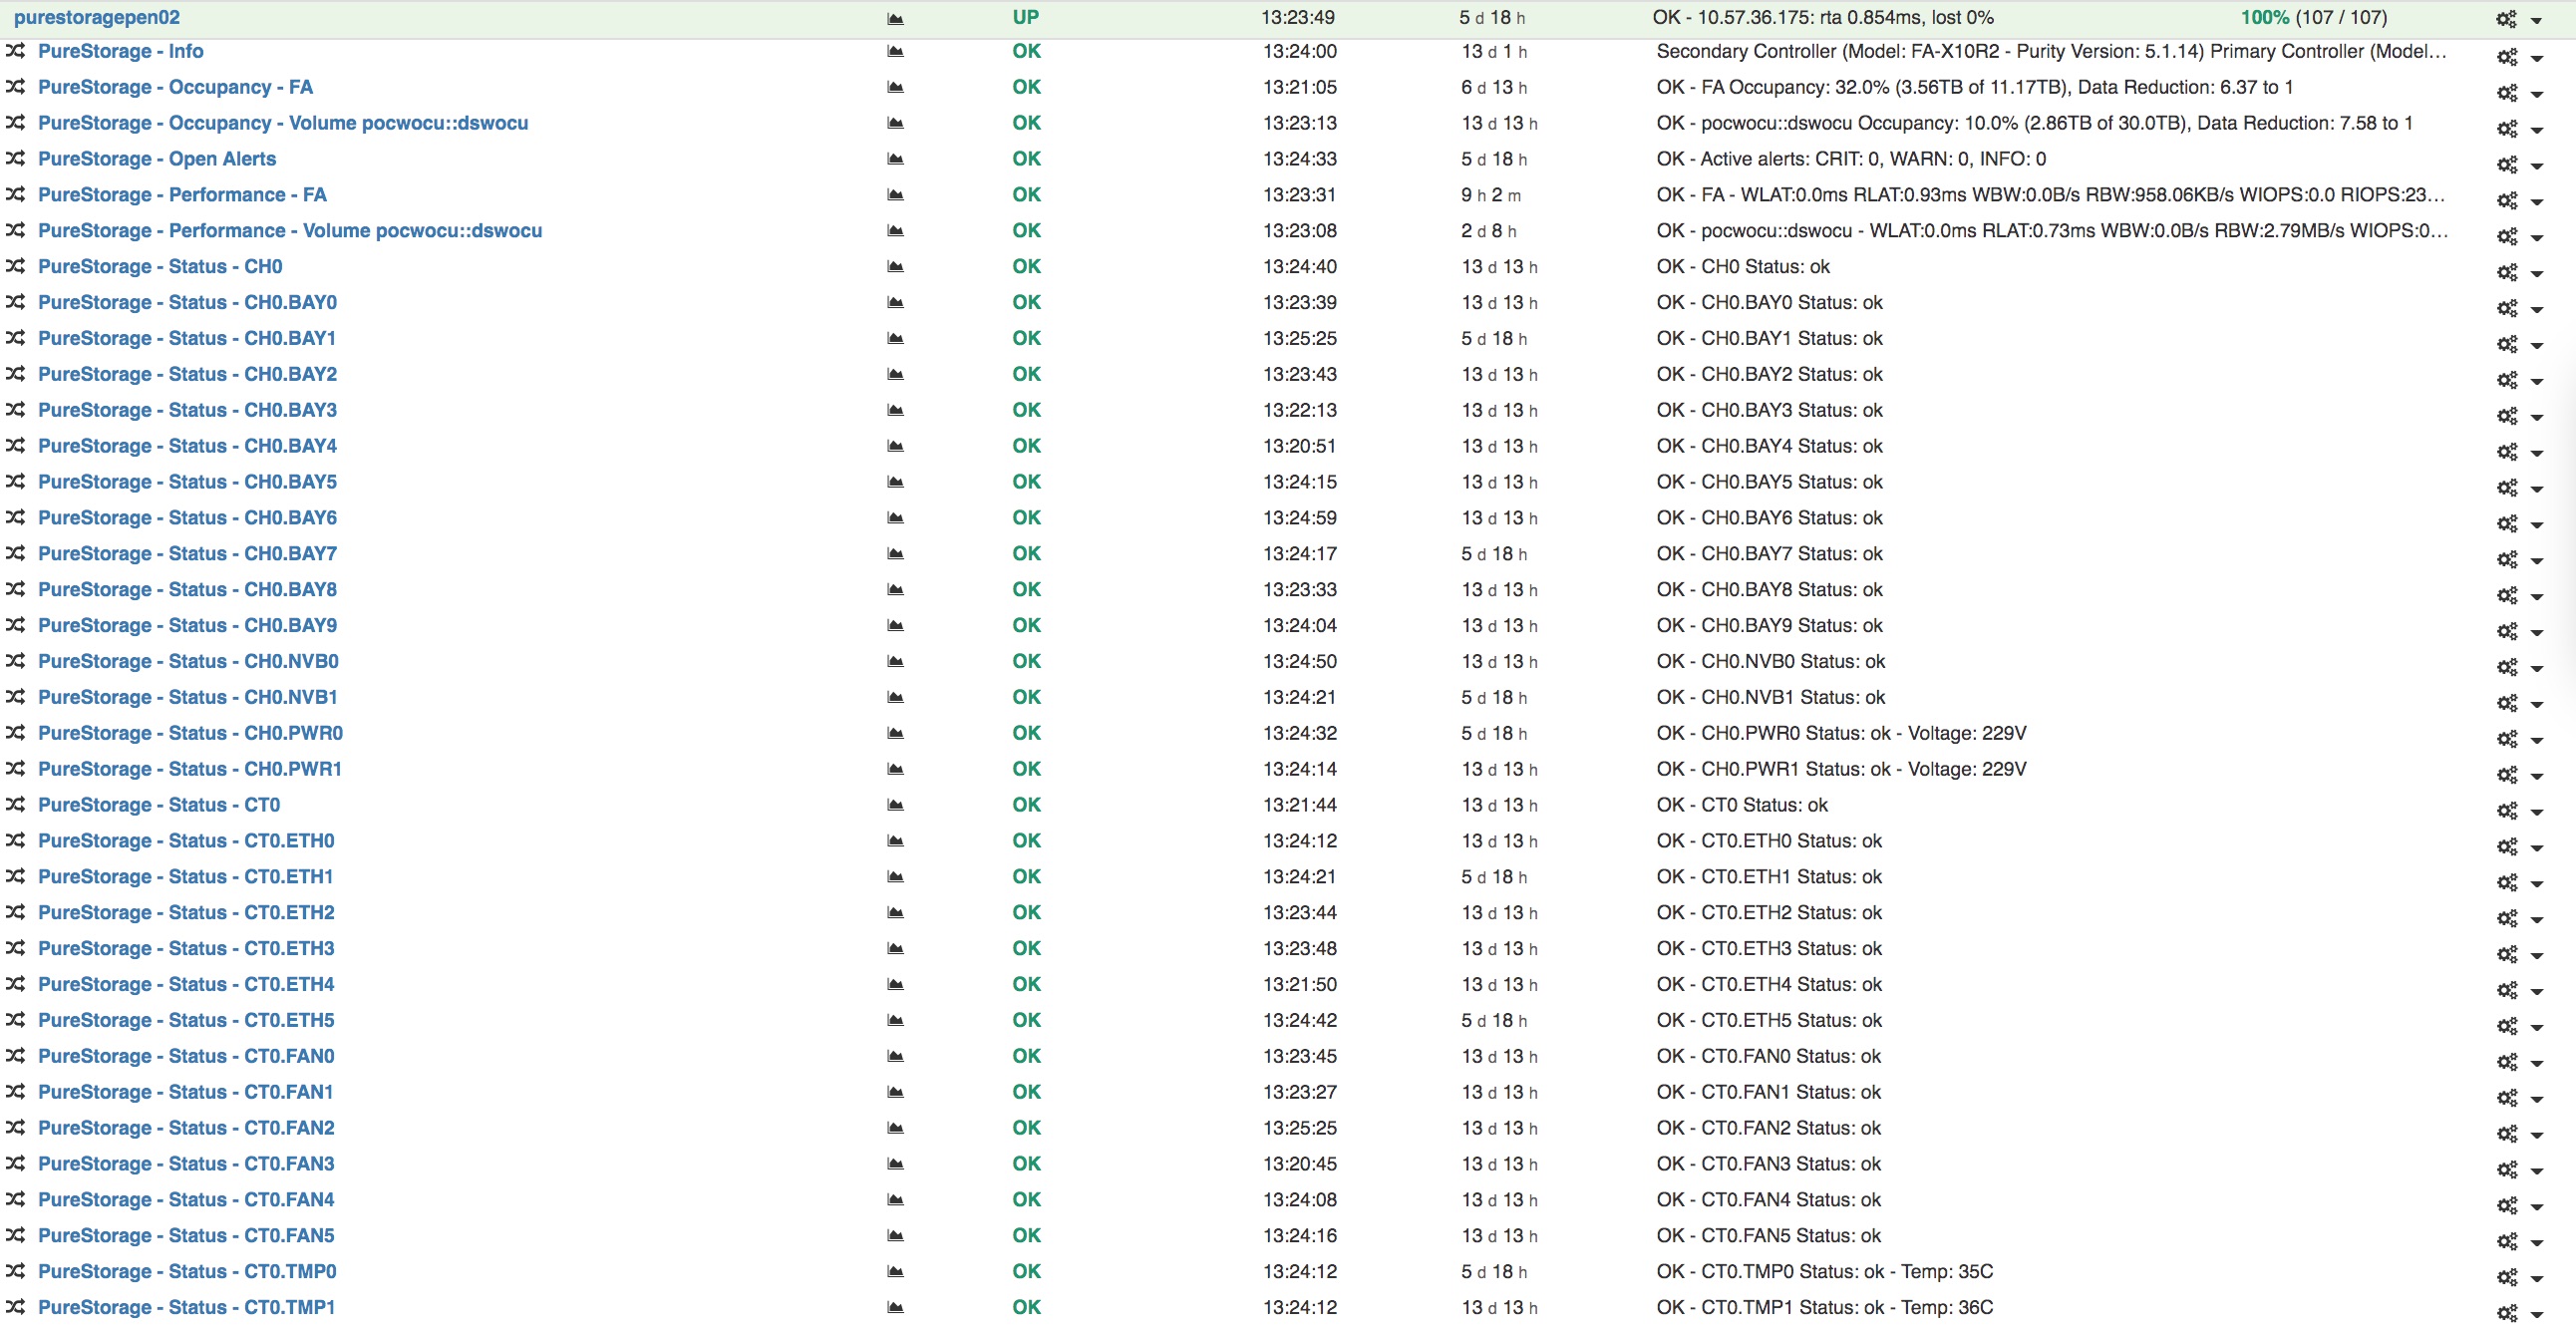
New purestorage pack
Pack intended for PureStorage FlashArray storage equipment. Includes discovery functions to choose the volumes and hardware components to be monitored.
The different services included in the pack are:
Info: shows the hardware model and software version installed on the controllers.
Open Alerts: alerts in open status.
Status: status of the selected hardware components.
Occupancy: overall and volume occupancy rate.
Performance: Read/write performance metrics (latency, bandwidth, IOPS)
New pack networkdevice-traffic-all
We have created a pack that unifies the networkdevice-traffic and networkdevice-traffic-health packs. The main advantage is that you only need to discover the interfaces once to create the traffic, interface_discards and interfaces_errors services.
On computers with many network interfaces, this can mean significant savings in configuration time. Of course, the networkdevice-traffic and networkdevice-traffic-health packs are still available separately.
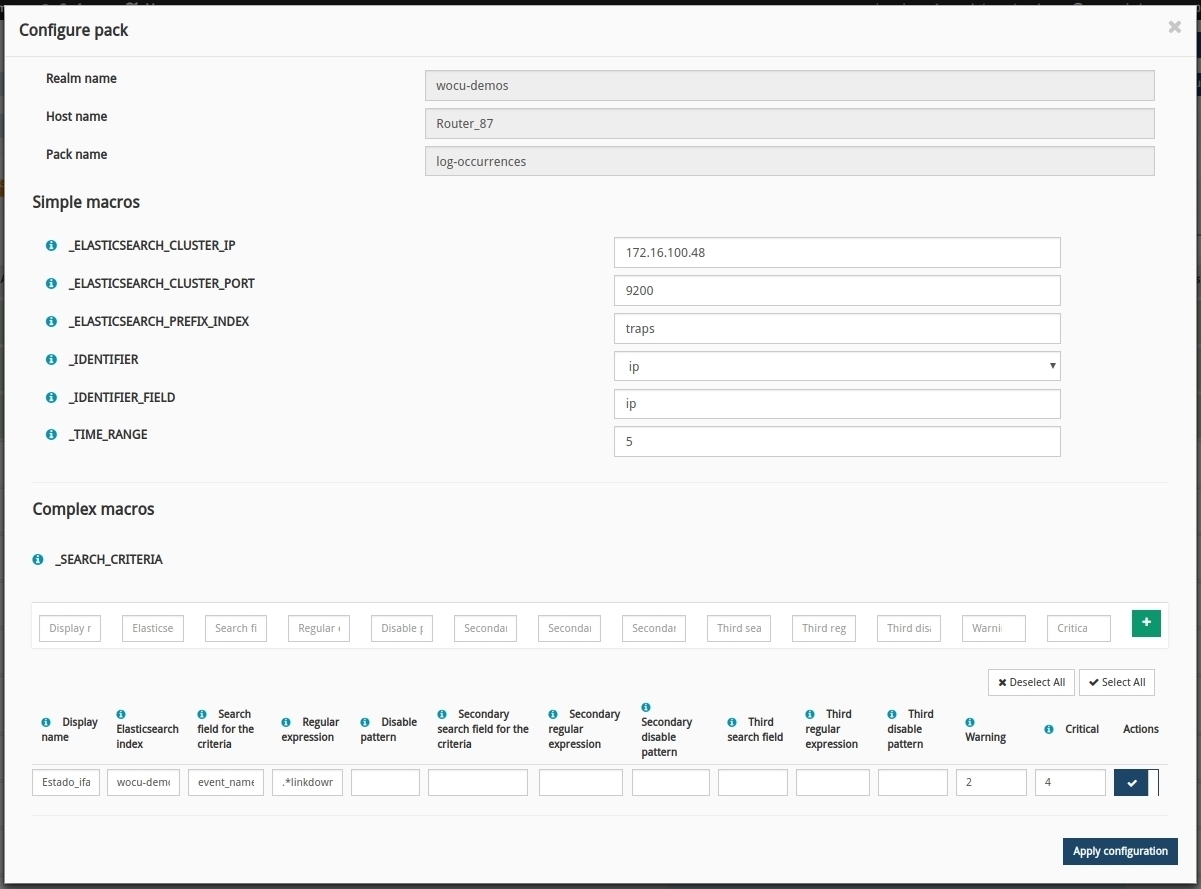
The macro _TIME_RANGE is added to the log-occurrences pack.
Thanks to this macro, it is now possible to set the time window in the query that is performed in ElasticSearch. This macro refers to the last x minutes. The maximum value is 1440 minutes, equivalent to 24 hours.
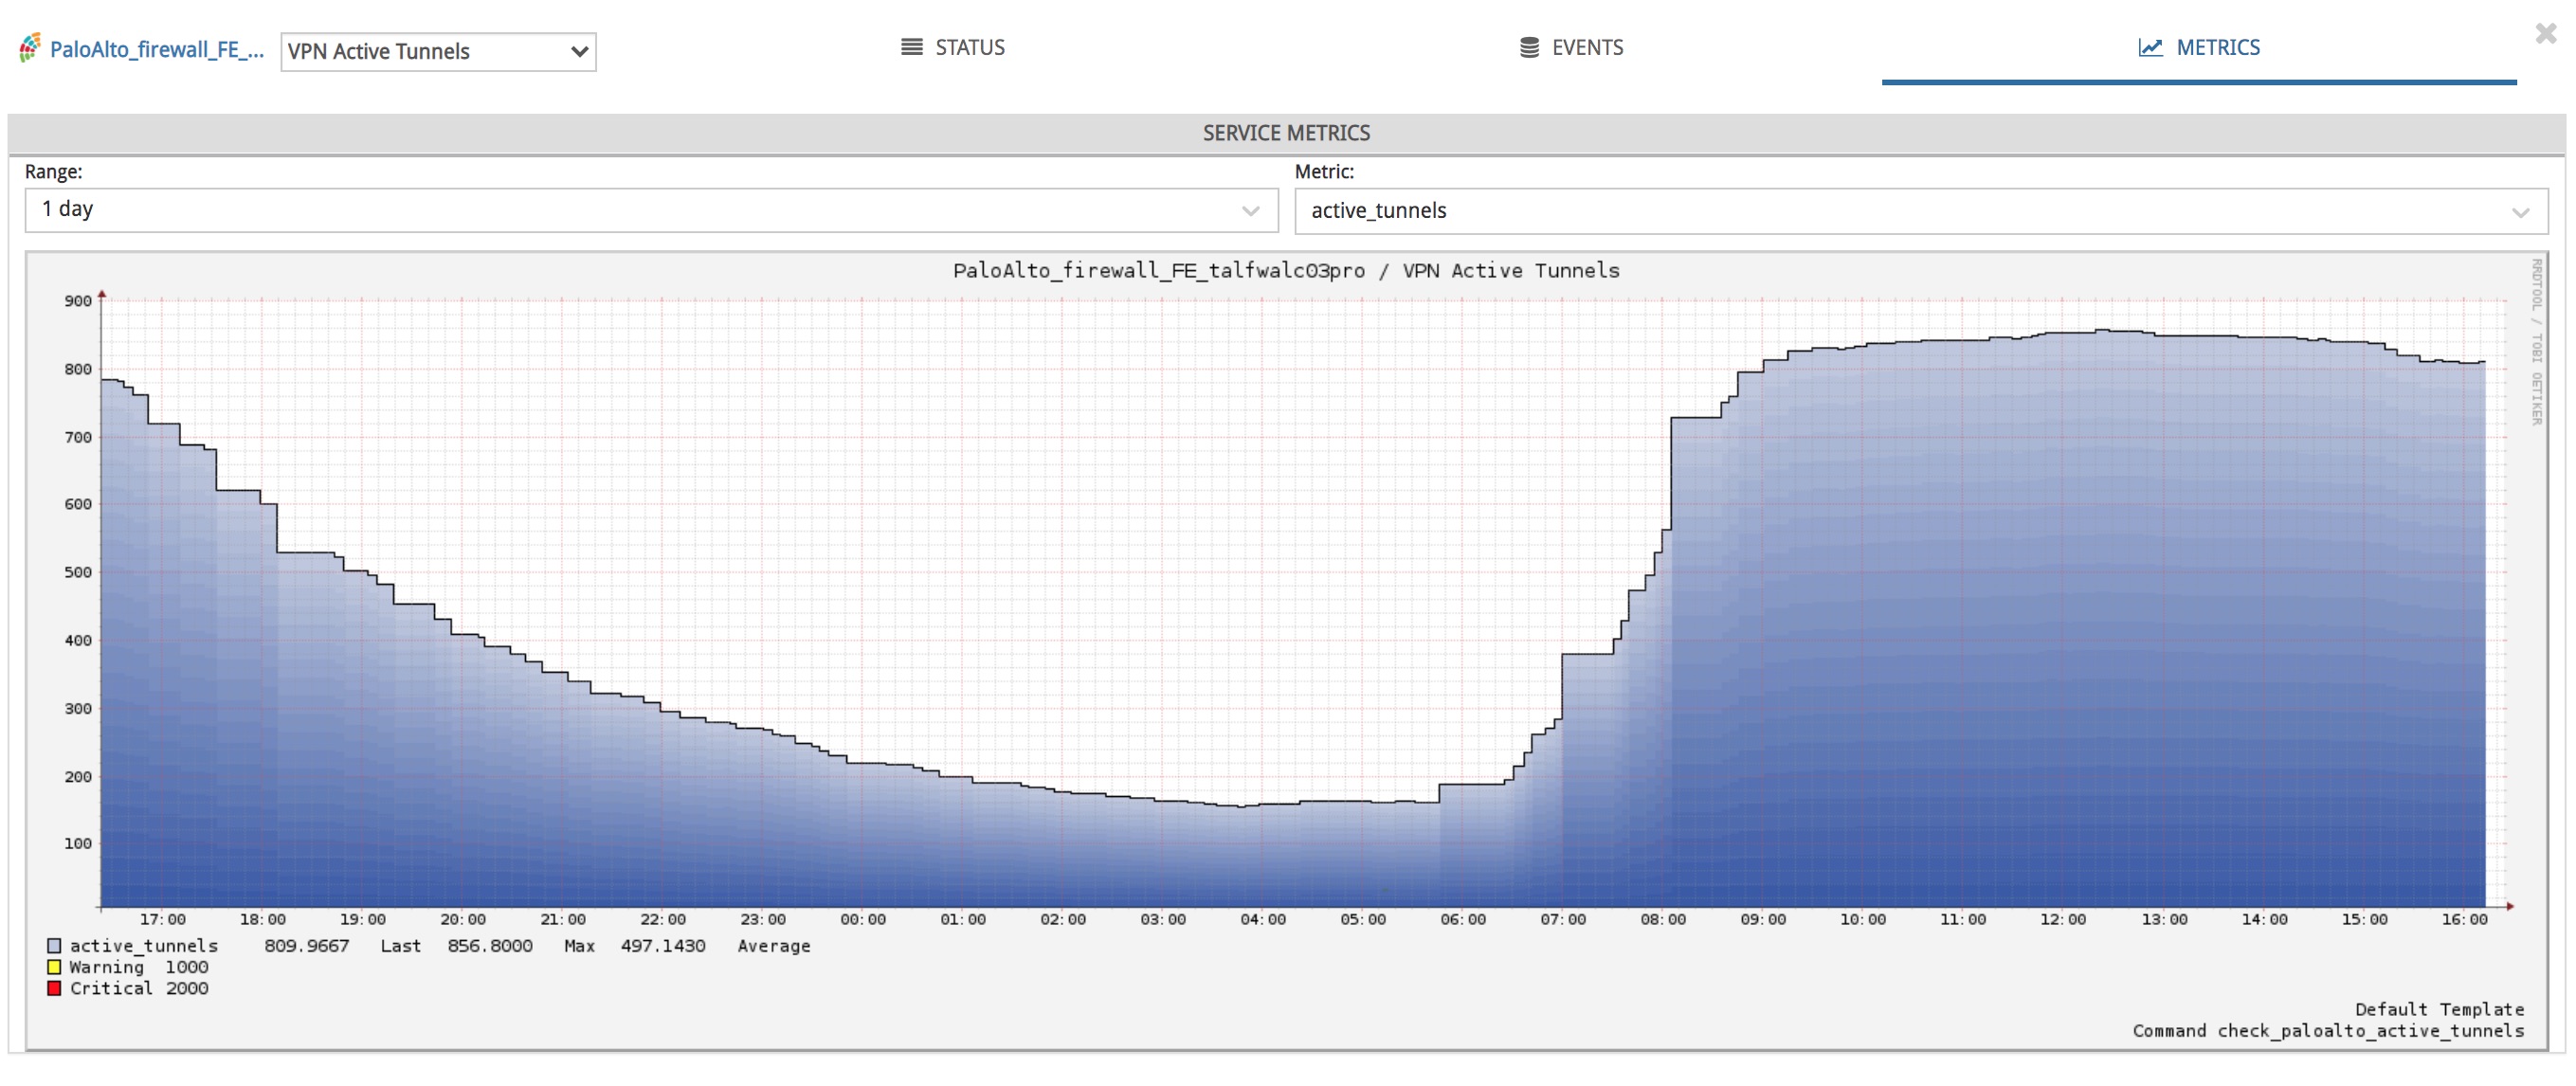
The VPN Active Tunnels service is added to the palo-alto pack.
A service has been added to check the number of active VPN tunnels. This service allows setting thresholds for a minimum and maximum number of tunnels.

The node state service is added to the stonegate-fw pack.
A service has been added to monitor the operational state of the nodes in a cluster. The service allows to choose the configured state of the nodes, and will return CRITICAL when the state obtained in the query is different from the one chosen in the pack.
This service also includes a no-OK state persistence functionality. This allows to maintain the CRITICAL state caused by a temporary state change. A macro defines the state persistence time.

Upgraded software
Django 2.2
We continue in the process of updating WOCU’s core components. In this case, our most used framework in backend, Django, has been upgraded from version 1.11 to 2.2. It brings with it some security bug fixes, along with other beneficial features for all other applications. The previous version 1.11 dropped support for bugs and security issues last month. This new version, called LTS (Long Time Support) is supported until April 2022 and is only compatible with Python3 (the complete migration from Python2 to Python3 in the WOCU code base has already been done in previous versions).
Other components
Numerous pieces of software integrated in WOCU have been incorporated and updated:
Software |
Previous version |
Current version |
Remarks |
|---|---|---|---|
Python3 |
3.7.5 |
3.7.7 |
Latest stable version of the 3.7 series |
LMD |
1.8.2 |
1.8.3 |
Improvements in the performance of some requests and in the management of connection timeouts. |
RRD graphics repair utilities
We have included several scripts to repair RRD graphs that become corrupted when adding new metrics to a service, or to retrieve historical data when there are changes to a service identifier (service_description), as these identifiers are used to name RRD files.