Release Notes 46
Publication Date: 15/06/2021
Important
WOCU-Monitoring has been in production environments for years and has outgrown its beta status, which is the reason for the version jump from version 0.45 to version 46.
The new version WOCU-Monitoring 46 is loaded with new features and improvements in response to the requests and suggestions of our users and the current market needs.
Our catalogue of Monitoring Packs, as an inherent part of the tool, has been the main protagonist in this version. Its value and usability has been exploited in a number of ways:
✓ Showing icons identifying technologies associated with Packs in each Host detail mode.
✓ Adding informative labels of Packs applied in a multitude of Host views. In addition to this integration, the inclusion of tags referring to Templates of configuration used.
At a glance you can learn the details of the monitoring profile and configuration of each element in WOCU-Monitoring.
As internal improvements to the tool, we have worked on increased performance in queries to the monitoring backend, with several changes introduced that will improve, on the one hand, a much more fluid user experience and, on the other, the general stability of the solution by reducing the overall load on the system itself.
WOCU-Monitoring was already able to import Host Groups and Host and Service Business Processes interchangeably. Therefore, in this version, a new subsection has been created for each of the previous types, specifically in the Pending Assets section, to host, manage and graphically configure these elements prior to monitoring.
Also noteworthy is the launch of the new Open Source Edition (OSE) version of WOCU-Monitoring, which offers a complete user experience, with sufficient power for optimal infrastructure monitoring from a single interface.
We continue to combine reliability, granularity and speed with each new release, integrating powerful functionalities and improving services. We will now go into more detail on all the new features that this new version brings with it.
1. Information on Templates and Monitoring Packs applied
With the recent addition of Templates as predefined Host configuration templates in WOCU-Monitoring, it was appropriate and necessary to record their application in different views, both general and specific, of the tool. Therefore, in this version, the following new informative fields have been added to replace the previous Use field, these are
Packs: where a set of tags corresponding to the Monitoring Packs applied and associated to the Host in question are listed.
Templates: where a set of tags are listed that inform the user of the configuration templates used and assigned to the Host. In this case, each of the tags corresponds to a Configuration Template applied.
These elements have been incorporated in the following sections:
✓ Host Mode Host tab
This new information has been added in the Configuration, integrated in the Host tab of the Host Modal, where precise information regarding the configuration, properties and status of the Host in question is collected
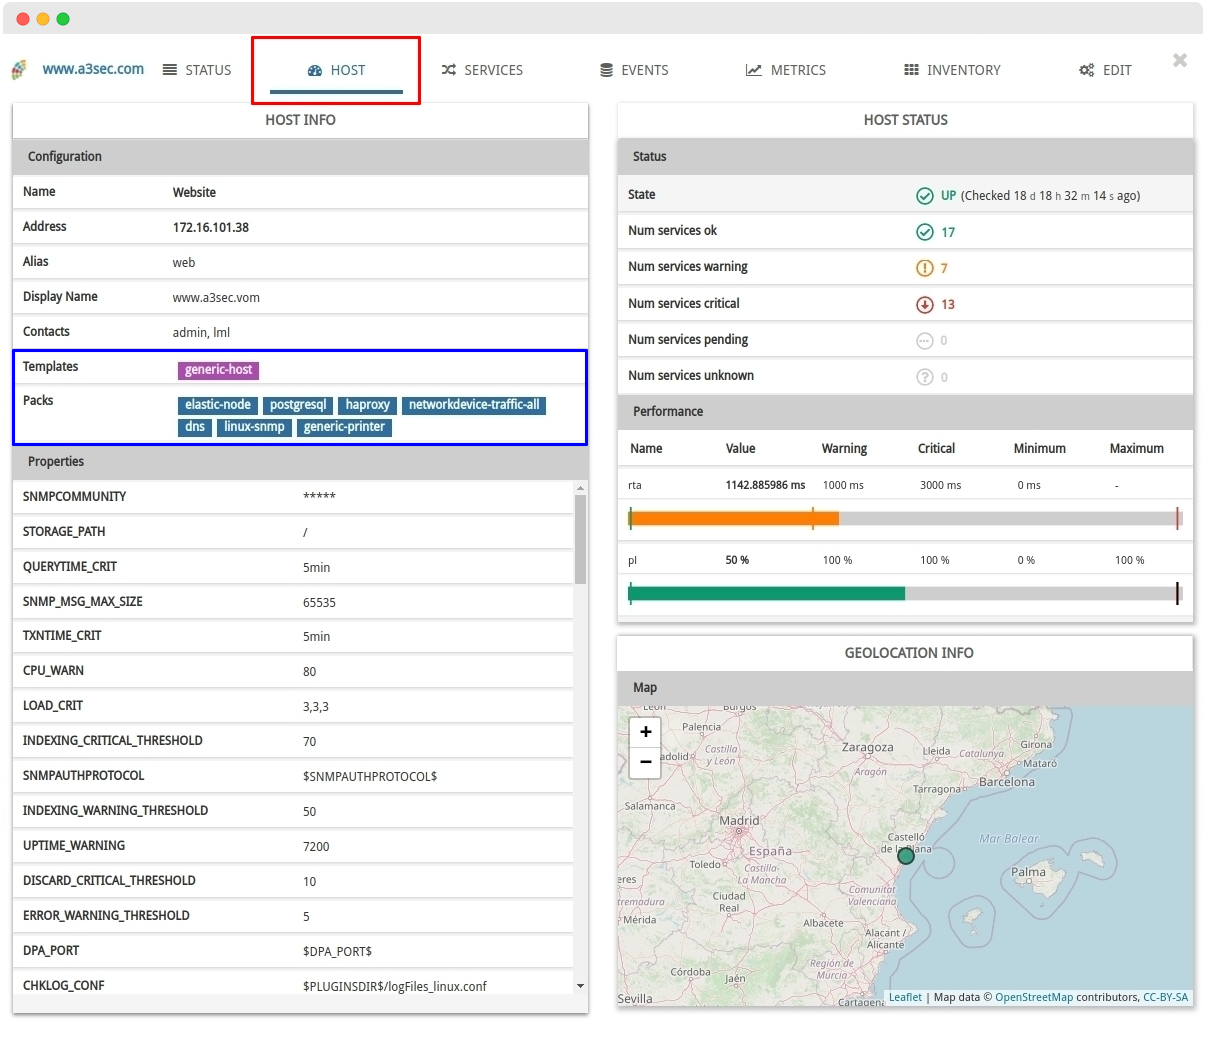
In addition to this integration, the geolocation map of the Host has been moved to a new independent section called Geolocation Info.
✓ Host Listings in Active Assets and Pending Assets
Both fields have also been added to the Hosts table, which lists the items that are actually being monitored, and to the Hosts in Pending table, which lists the items that are waiting to be included in the monitoring plant.
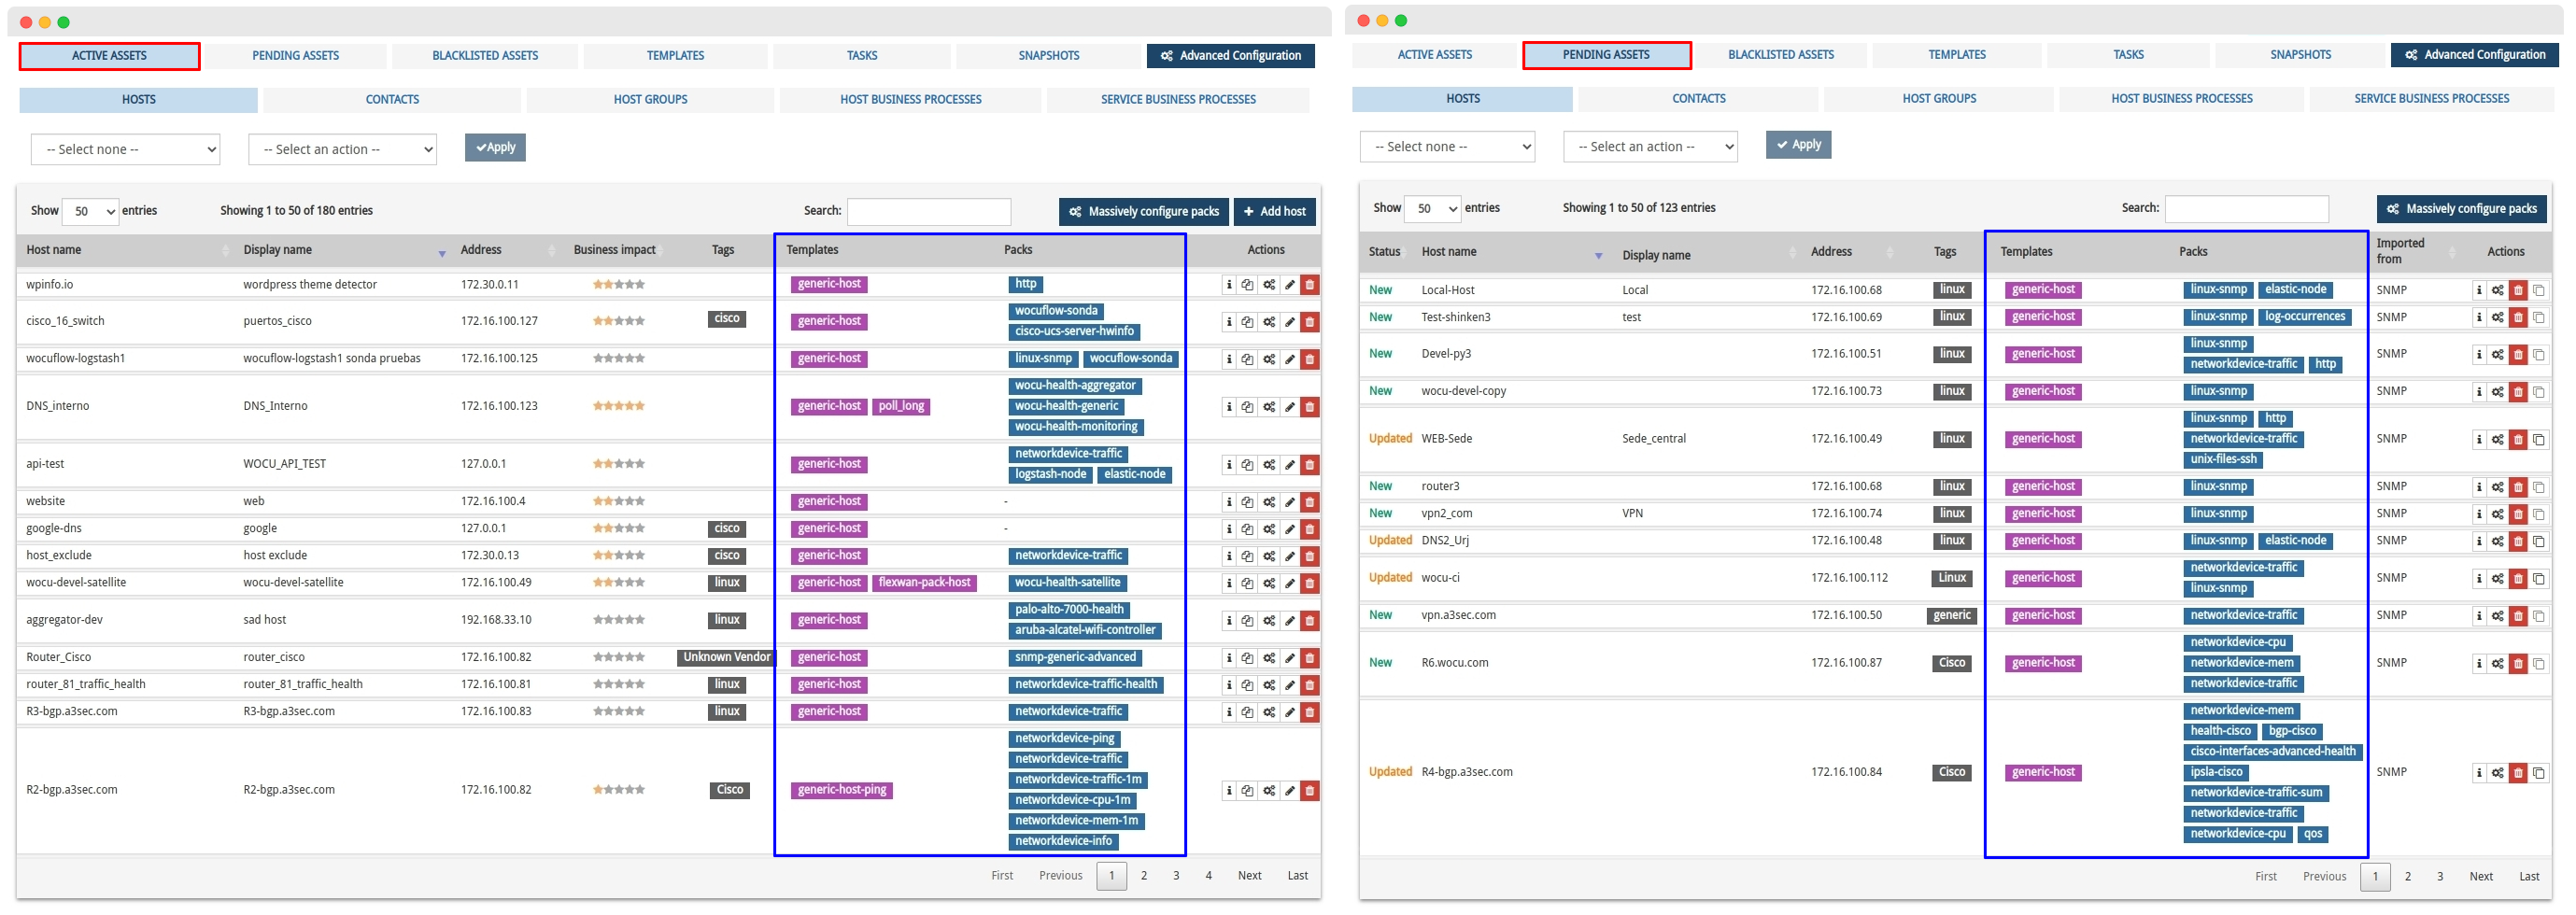
✓ Detailed information view of Operating and Pending Hosts.
Finally, these fields will be available in the Host attribute and configuration information views, displayed after executing the Information (ℹ) action, located in each of the above table entries: Hosts and Hosts in Pending.
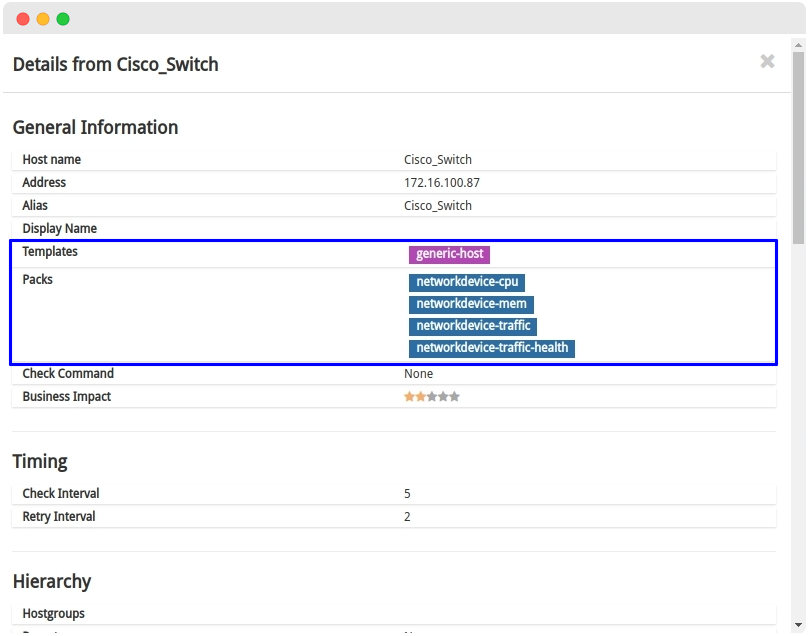
Our aim is to continue to add value to these meaningful views by collecting and centralising crucial data within the operator’s daily operational flow.
2. Display icons identifying technologies associated with Monitoring Packs.
WOCU-Monitoring distributes a wide and rich catalogue of property-based monitoring packs, designed to model the most common technologies and manufacturers in the field of monitoring networks, servers, firewalls, IP PBXs and all kinds of devices and services.
Regarding the new aggregated information on Monitoring Packs applied in different modes and Host listings, we wanted to further enhance its usability and versatility by including identifying icons in the header of each Host Modal, based on the packs that are being applied
Its operation is based on the query of specific text strings against a predefined dictionary, where text strings and icons are associated (for each dictionary entry). The matching of these patterns within the list of applied packs facilitates the assignment of representative icons to the Host.
The system will display a maximum of three icons ordered by a scale of weights defined in the above mentioned dictionary. The purpose of this operation is to give priority to the most representative and relevant (and less generic) icons of the monitoring profile of the Host.
Finally, by placing the cursor over a specific icon, a text alluding to the technology represented will appear. This text can be configured as a title in each corresponding entry of the icon dictionary.
By leveraging all the information that WOCU-Monitoring provides and manages, we enhance the ability to quickly and seamlessly view all monitoring details for each network element.
3. New version OSE (Open Source Edition)
A smaller version of WOCU-Monitoring, an easy to install and maintain monitoring platform, is now available. It integrates different Open Source tools that together are able to offer a complete user experience and allows the monitoring of infrastructures from a single interface.
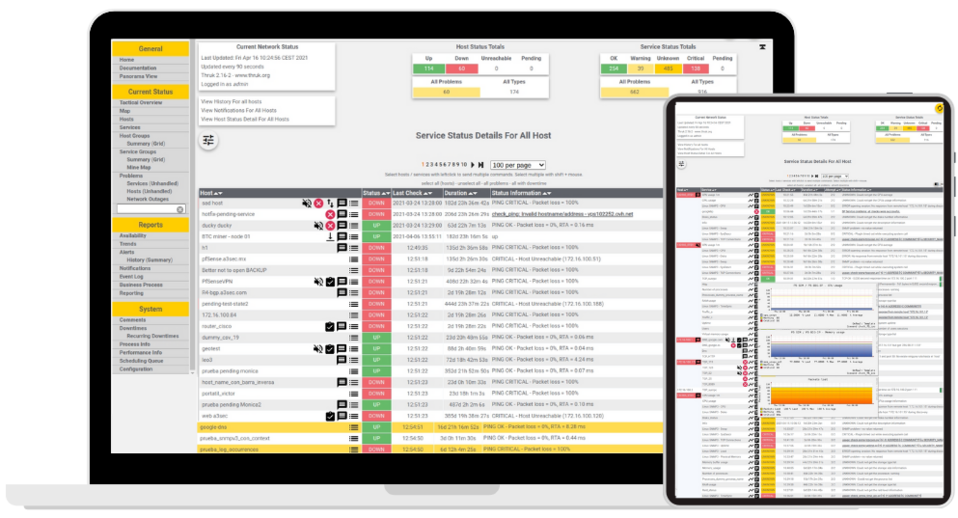
The main components that make up the OSE version are:
Shinken: monitoring engine
LMD: Livestatus API proxy
Thruk: monitoring interface
Pnp4nagios: performance metrics generation
It can be a good entry point for testing WOCU-Monitoring, since if you decide to upgrade from an OSE version to an Enterprise version, the configuration is fully compatible.
4. New information on the status of checks executed in the Host Mode
Some of the benefits of using WOCU-Monitoring are: real-time knowledge of the operational status of the infrastructure, optimisation of the use of IT resources and assets and increased proactivity in daily operations in terms of network management and administration. This is possible thanks to the variety of data, metrics and detailed information that the tool provides to the operator for subsequent decision making.
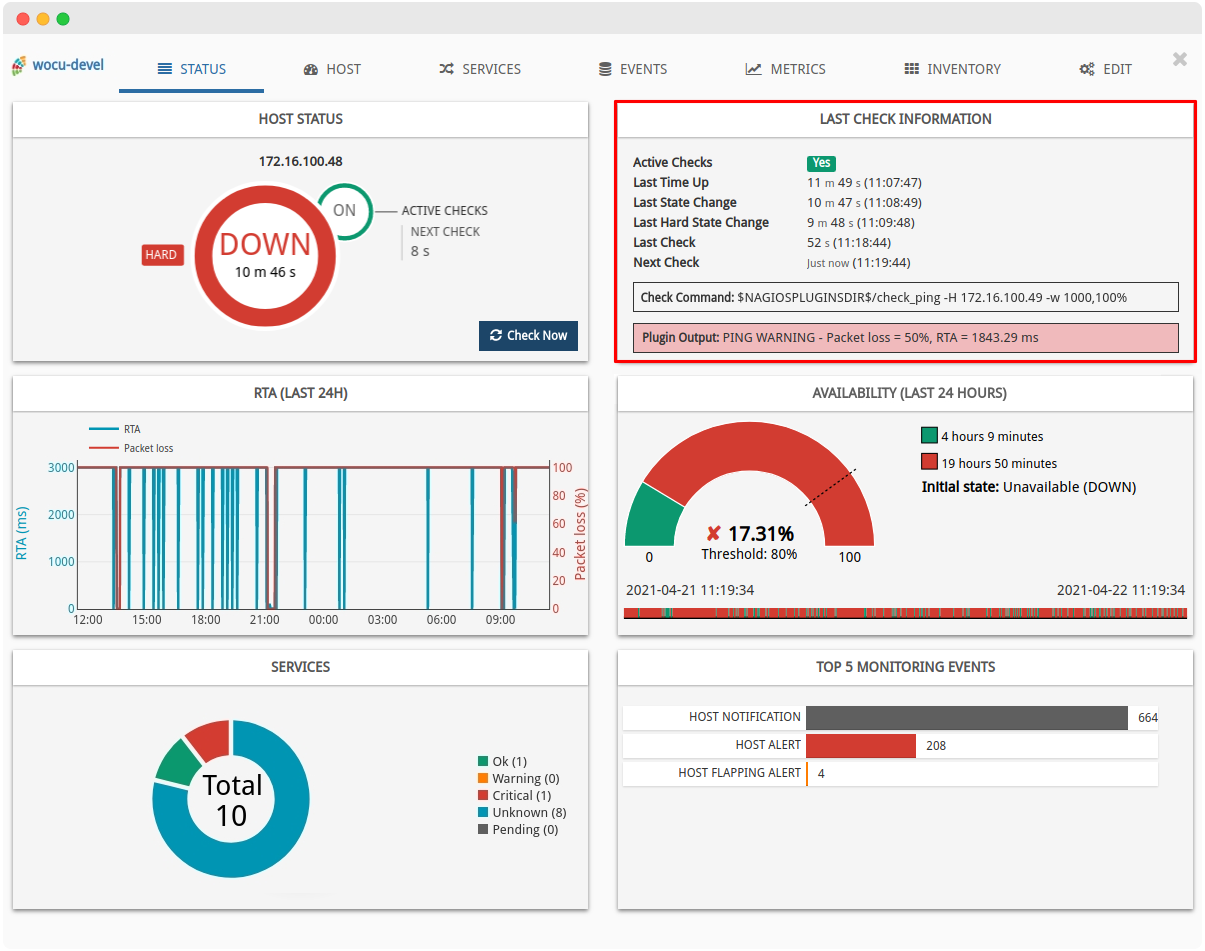
One of the busiest environments due to its information load and usefulnessis the Device Modal, where it is concentrated updated information (collected over the last 24 hours) of amonitored asset. After a functional analysis of each of the sections that make up this modal, the view has been reorganizedincorporating a new Last checks information panel to the tab:doc_url:Status <docs/operaciones/2_8_4_modal_host_bp.html#state-status-of-the-asset-detail-view-and-bp> of the modal, replacing the location geomap.
This modification is aimed at operator convenience, giving preference to the panels and widgets that are most consulted and therefore most influential in daily operations with WOCU.
5. Prevention of security attacks by vulnerable units
In order to check the correct functioning of the software and to verify the quality of the code, within our methodology and development flow, a series of adapted checks and tests (tests) are executed in a continuous integration environment (CI).
As a novelty in this version, new measures to strengthen and prevent attacks that could affect the security of the system are established, integrating in the CI the checking of installed dependencies for known security vulnerabilities. This new sub-process will query the database where vulnerabilities of packages that are in use are recorded, to detect or rule out the existence of security risks. This process will also suggest the necessary updates to resolve the vulnerabilities detected.
REPORT |
|||
|---|---|---|---|
Package |
Installed |
Affected |
ID |
|
|
|
|
Cross-site scripting (XSS) vulnerability in Django 1.2.x before 1.2.2 allows remote attackers to inject arbitrary web script or HTML via a csrfmiddlewar etoken (aka csrf_token) cookie. |
|||
In short, the CI will detect in the development phase vulnerable dependencies, both in backend and frontend, that may affect the security of the application and suggest appropriate changes to address them.
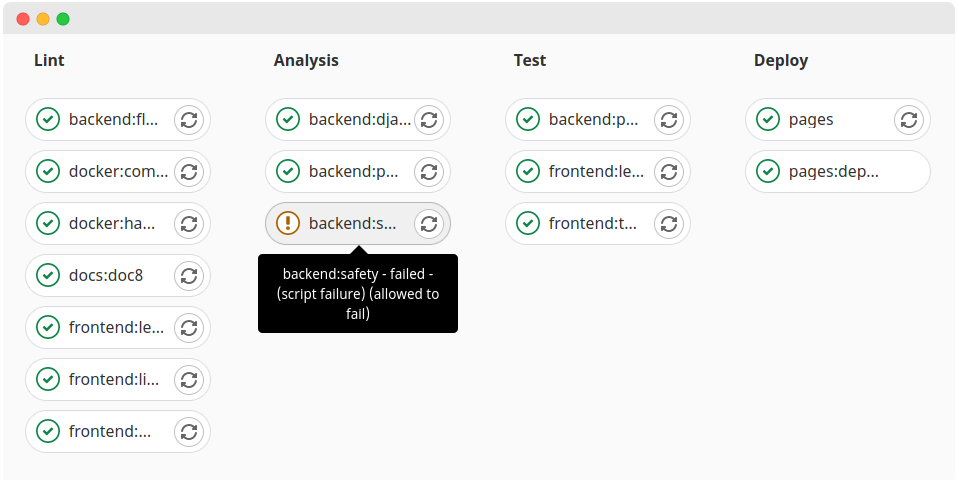
This change is a further step in the quality and security of the code, a source of concern since the first versions of WOCU-Monitoring.
6. Migration to REACT technology
Migration of widgets
The non-visible part of several widgets has been simplified by migrating them to REACT technology. These are:
✓ Inventory tab of the Host Mode
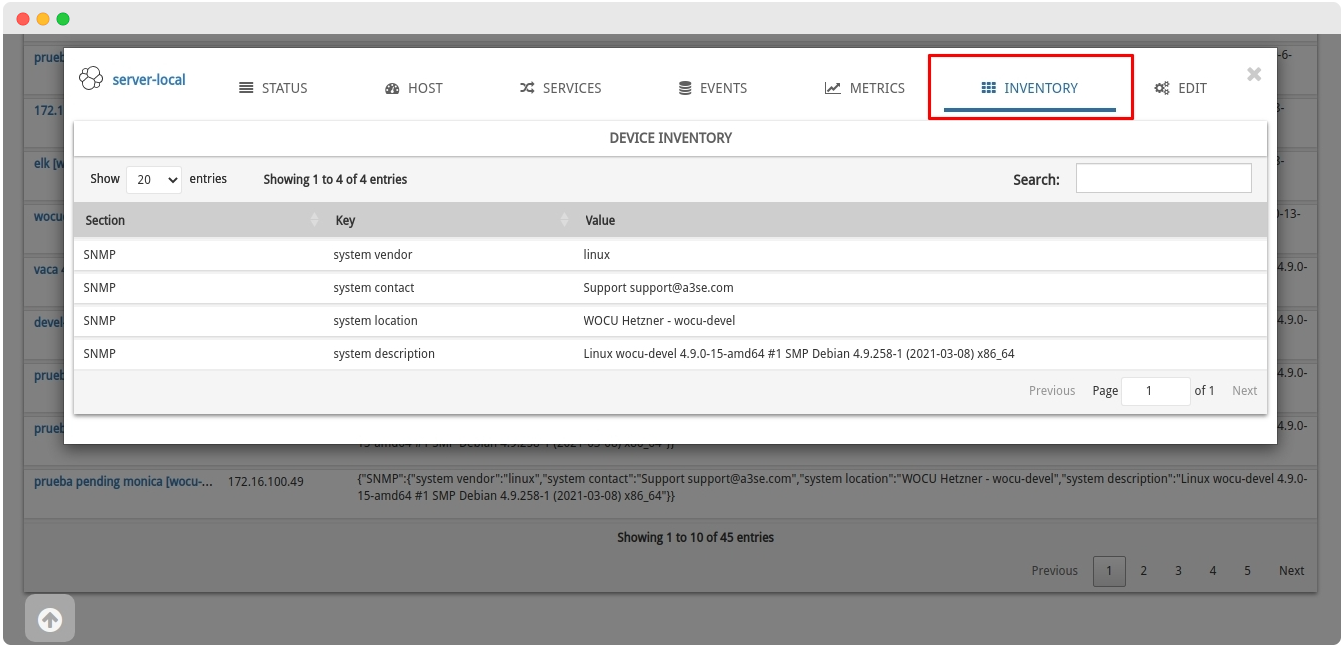
✓ Panel Last Check Information of the Modal Services
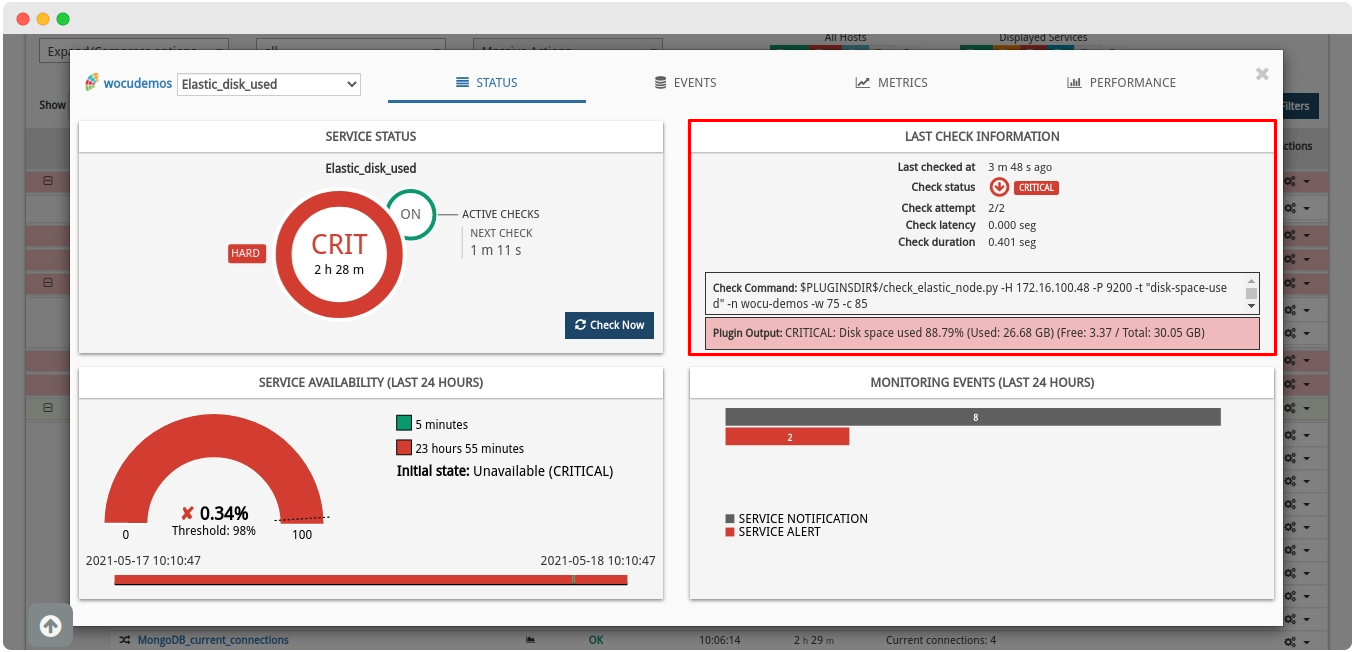
These changes will result in better data visualisation, improved maintainability and responsive visualisation. A homogenisation of styles has also been carried out, as a correction of minor variations in appearance.
Improved compatibility and support for EsLint and Typescript.
With Typescript we increase the quality of the developed code, thanks to the detection and warning of errors prior to displaying them in the browser. These errors are monitored by the EsLint linter.
A thorough refactoring has been carried out to increase the functionality of both elements and thus further streamline the workflow by achieving highly efficient error analysis.
Other notable changes
✓ A number of improvements have been made to global style management (
CSS).✓ The
CSSfile path has been simplified and colours that did not use the corresponding variable have been removed.✓ The palette of colours used has been reduced, eliminating those of residual use so that the brand image and product colours are better defined.
7. New views Host Groups, Hosts Business Processes and Service Business Processes in Pending Assets
If the ability to import Hosts Groups, Services Business Processes and Hosts Business Processes, e.g. by reading a CSV file, the next step was the creation of specific listings for the hosting and management of these assets
The Pending Assets section of the Import-Tool, is the first step before monitoring with WOCU-Monitoring, where all newly imported assets are first placed. Thus, three new subsections have been added for the management of each of the above imported element types. These are:
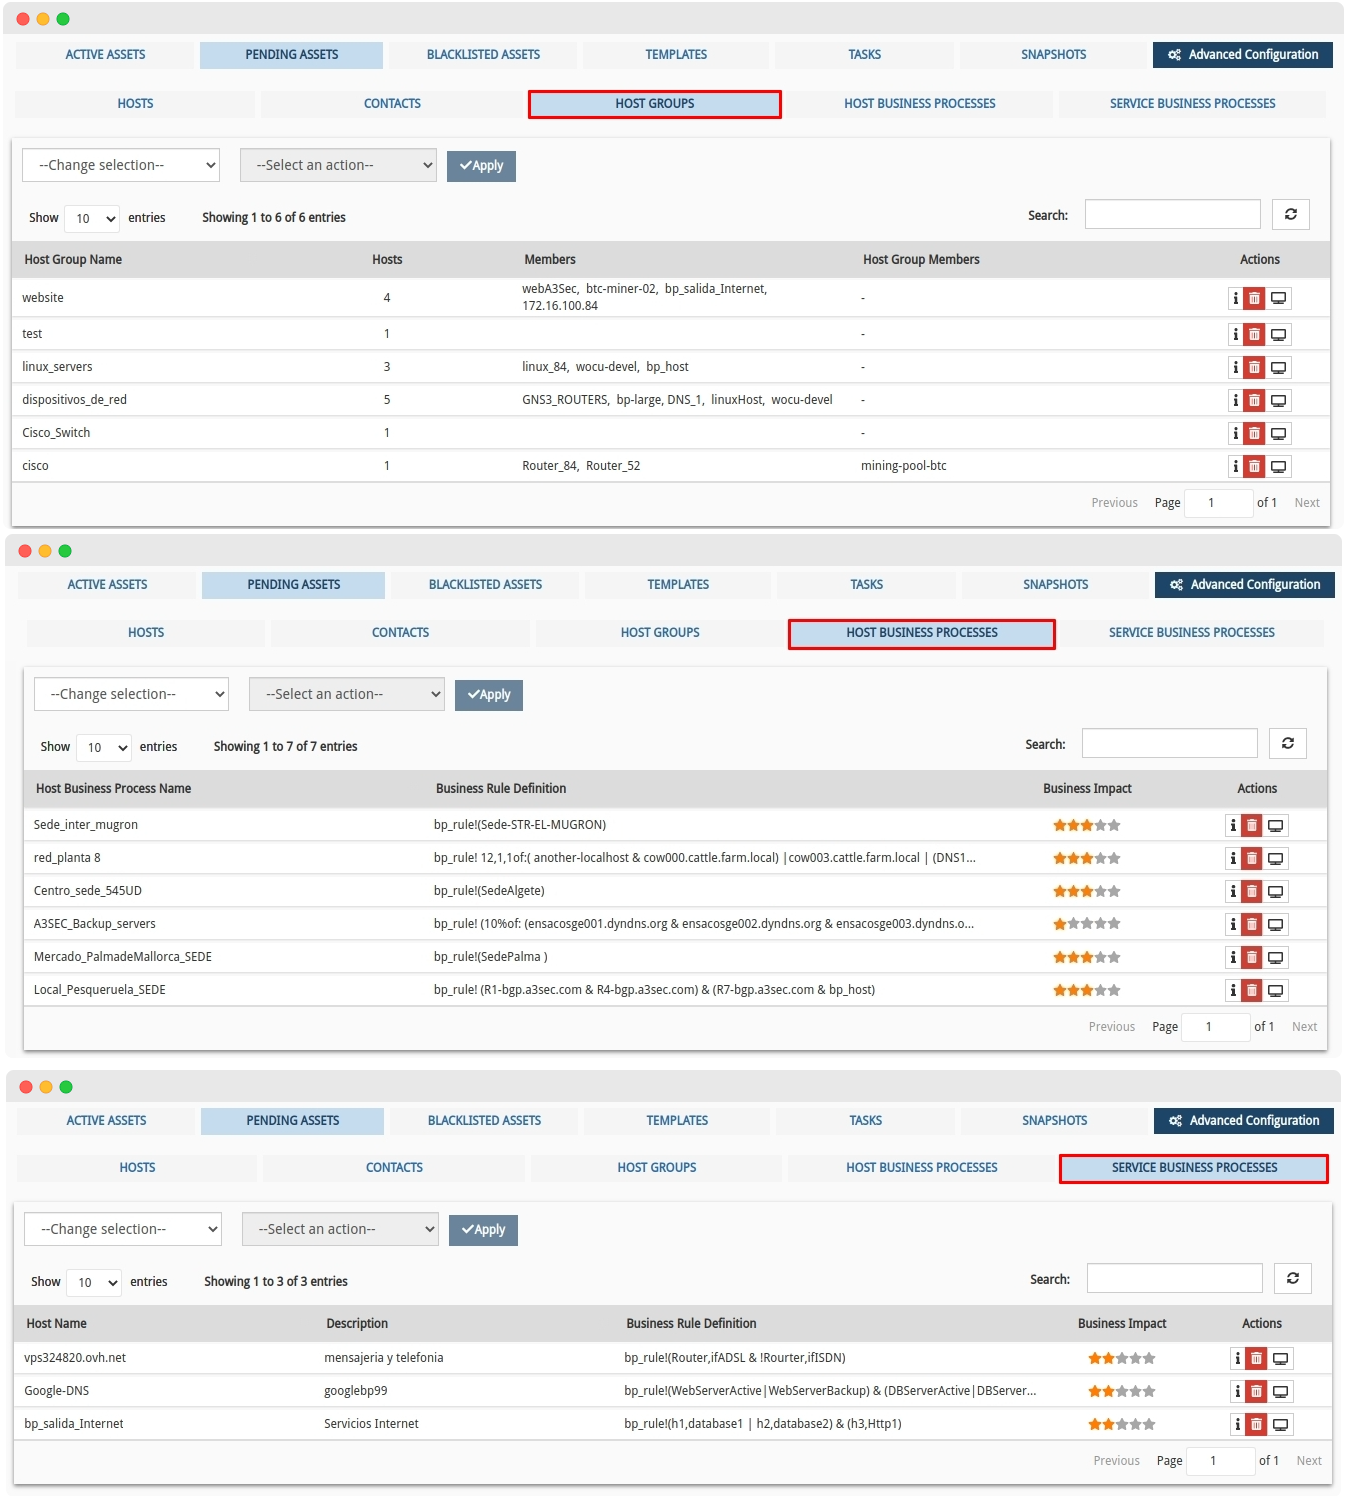
In these spaces, the operator can perform a review of the imported items, their configuration and attributes, before deciding whether to include these assets to the monitoring plant or not, i.e. to the list of Monitored Assets.
This new integration supports the logical operational flow of WOCU-Monitoring, from the import of assets to the configuration and monitoring of an entire network.
8. New integrations and changes to the Templates section of the Import-Tool
In this version, work has continued on the recent Templates section of the Import-Tool, adding new information and reorganising various other elements. This set of concatenated changes aims to centralise all useful information in a single environment and facilitate template management.
The changes made are set out below:
✓ Application and configuration of Monitoring Packs in Templates
The opportunity to associate Monitoring Packs to specific templates has been included, thus completing the configuration profile of the Hosts on which it is being applied.
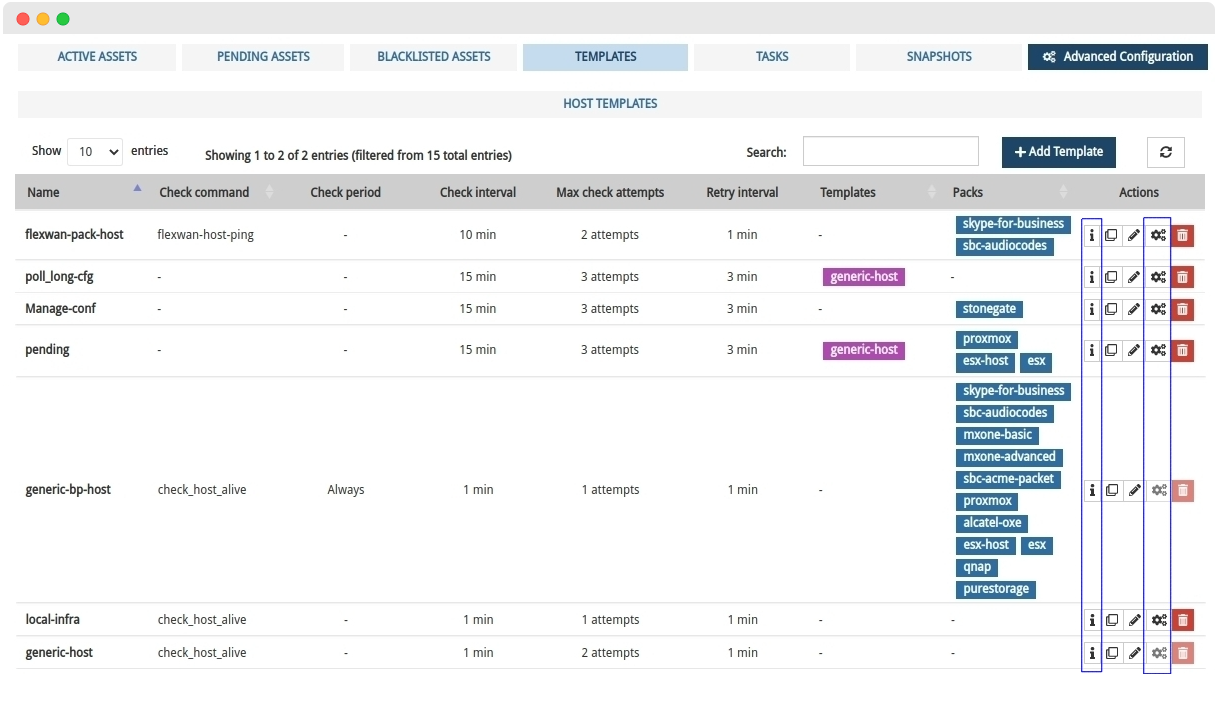
For this purpose, the new action List of Host Templates has been added to Configuration of Monitoring Packs, which gives access to the pack assignment and administration module, from where the operator can modify the packs suggested by the system, add new ones that better suit his needs or freely edit parameters and intrinsic variables of specific packs.
Alongside the executable actions for each template, a new Information button (ℹ) has also been added which brings together all the generic and specific configuration details for the template in question.
✓ New Packs column
As a consequence of the previous integration, a new column has been added within the List of Host Templates, which registers and shows for each of the registered templates, the associated Monitoring Packs, and therefore, also the Hosts that make use of that template.
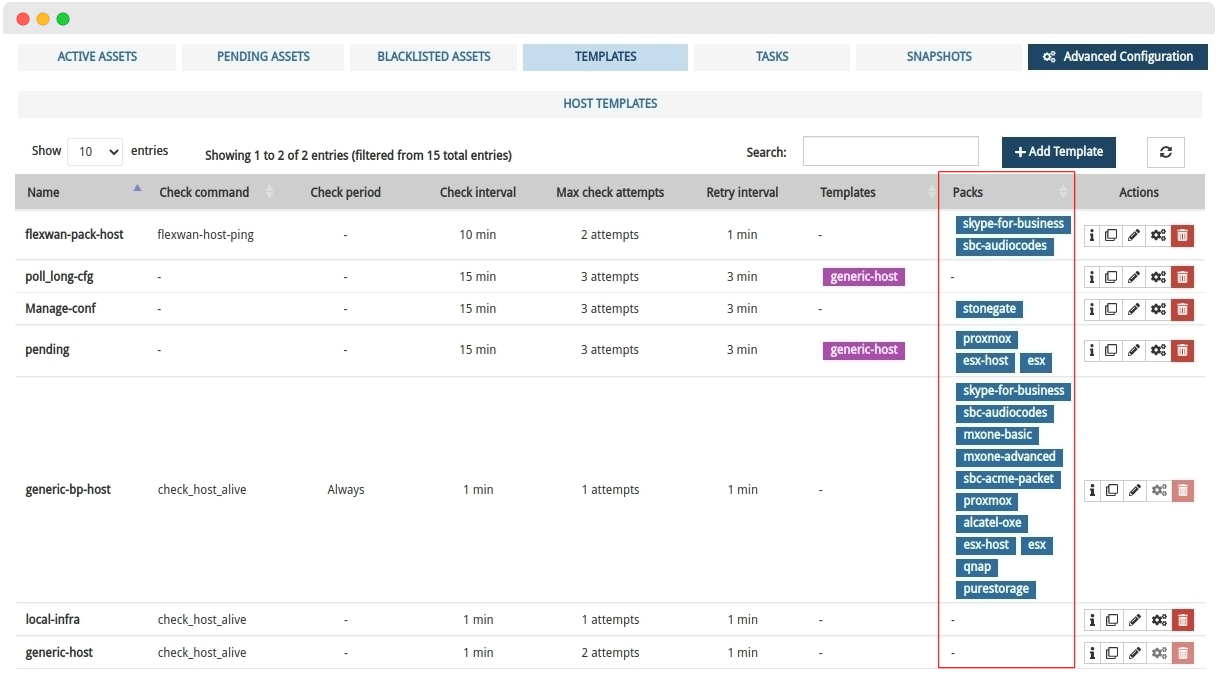
WOCU-Monitoring supports large-scale infrastructures, that said, it is our priority to make the process of importing and managing assets even more streamlined with the incorporation and management of Monitoring Packs in Host configuration templates.
✓ Protection of generic templates:
A template can inherit (not overwrite) attributes from other generic templates predefined in the system, such as generic-host and generic-BPhost, in fact, it is recommended that any new model inherits the configuration of one of them so that the basic and minimum monitoring requirements are covered.
Considering the relevance of these templates, both become protected, i.e. they can be edited but actions such as their final deletion or configuration of Monitoring Packs will be blocked, as misuse could trigger errors in the application.
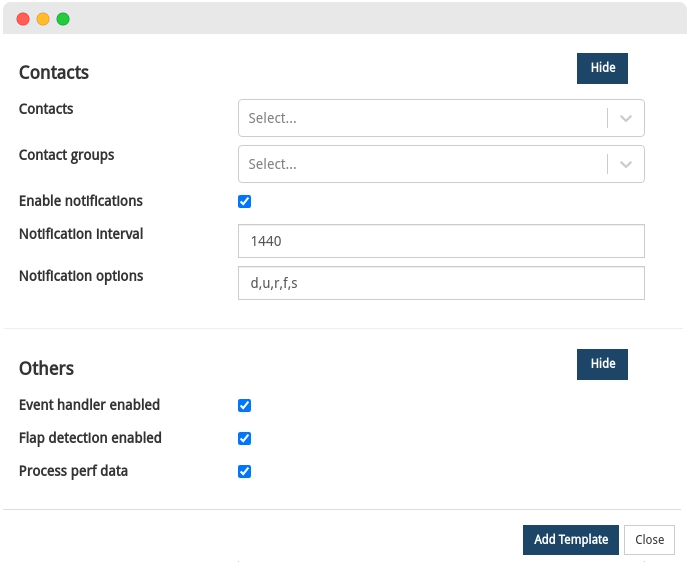
✓ Remodelling of the registration form for new Templates.
Several of the blocks of the template creation and configuration form have been updated, removing from the template parameters that became redundant as they are already covered by the previous changes introduced:
The Macros block has been removed, as they can now be configured with the Configuration of Monitoring Packs.
New configuration parameters in the Contacts block:
Notification interval: to record the number of minutes that have to elapse before the contact is notified of a new downtime or unavailability of the Host.
Notification options: for defining the valid states of a Host, for sending notifications to the contact.
New block Others accompanied by the following fields:
Event handler enabled: by checking this box, the event handler of the Hosts applying the new template will be enabled.
Flap detection enabled: checking this checkbox will enable detection of the operational state flapping on Hosts applying the new template.
Process perf dat: checking this box will enable performance data processing for this new template.
9. Increased performance in queries to the monitoring backend.
In this new version we have made an effort to radically improve the performance of the queries that the user console makes to the monitoring backend Livestatus (database used for the current monitoring status). Several changes have been introduced that will improve, on the one hand, the user experience by presenting a much more fluid interface and, on the other hand, the general stability of the solution by reducing the overall load on the system itself.
Upgrading LMD to version 2.0.0
WOCU-Monitoring uses LMD as a Livestatus proxy for the monitoring backend. In its update to version 2.0.0, the system benefits greatly from the following improvements:
Use of indexes to improve the query speed of the Hosts and Services tables when filtering by Host_name or by Hostgroup. This change is important for our reporting modalities of Hosts and Services and for Hostgroup-based realms
Initial loading of the
Livestatustables in parallel for a much faster start-up.Disables the
SyncIsExecutingoption to check for checks of devices and services running at the same time, avoiding small overheads in table synchronisation.
Optimisation of Livestatus requests
The number of unnecessary requests for information addressed to the Livestatus module has been significantly reduced:
Hostgroup based realms: from now on, this type of request will not query the Comments and Downtimes tables unless information is required from those tables. This drastically reduces the number of requests against the
Livestatusbackend, especially on the aggregation page if there are many Hostgroups based realms configured.Various widgets from the Host Modal and Services Modal.

10. Association of the service to each metric recorded in Metrics Evolution Reports
The versatility of WOCU-Monitoring to manage and process an infinite number of metrics with values collected during operational status checks, makes it possible to generate complete Metrics Evolution Reports.
Thanks to its powerful computational power, this report correlates a multitude of service metrics and their evolution in a given time frame, generating complex reports that require careful analysis. Therefore, to facilitate its comprehension, each metric collected will now be presented together with its associated service, i.e. the service that records it (metric (service)). This aggregation will be visible both in the visualisation of the report in the tool itself, as well as in PDF format.
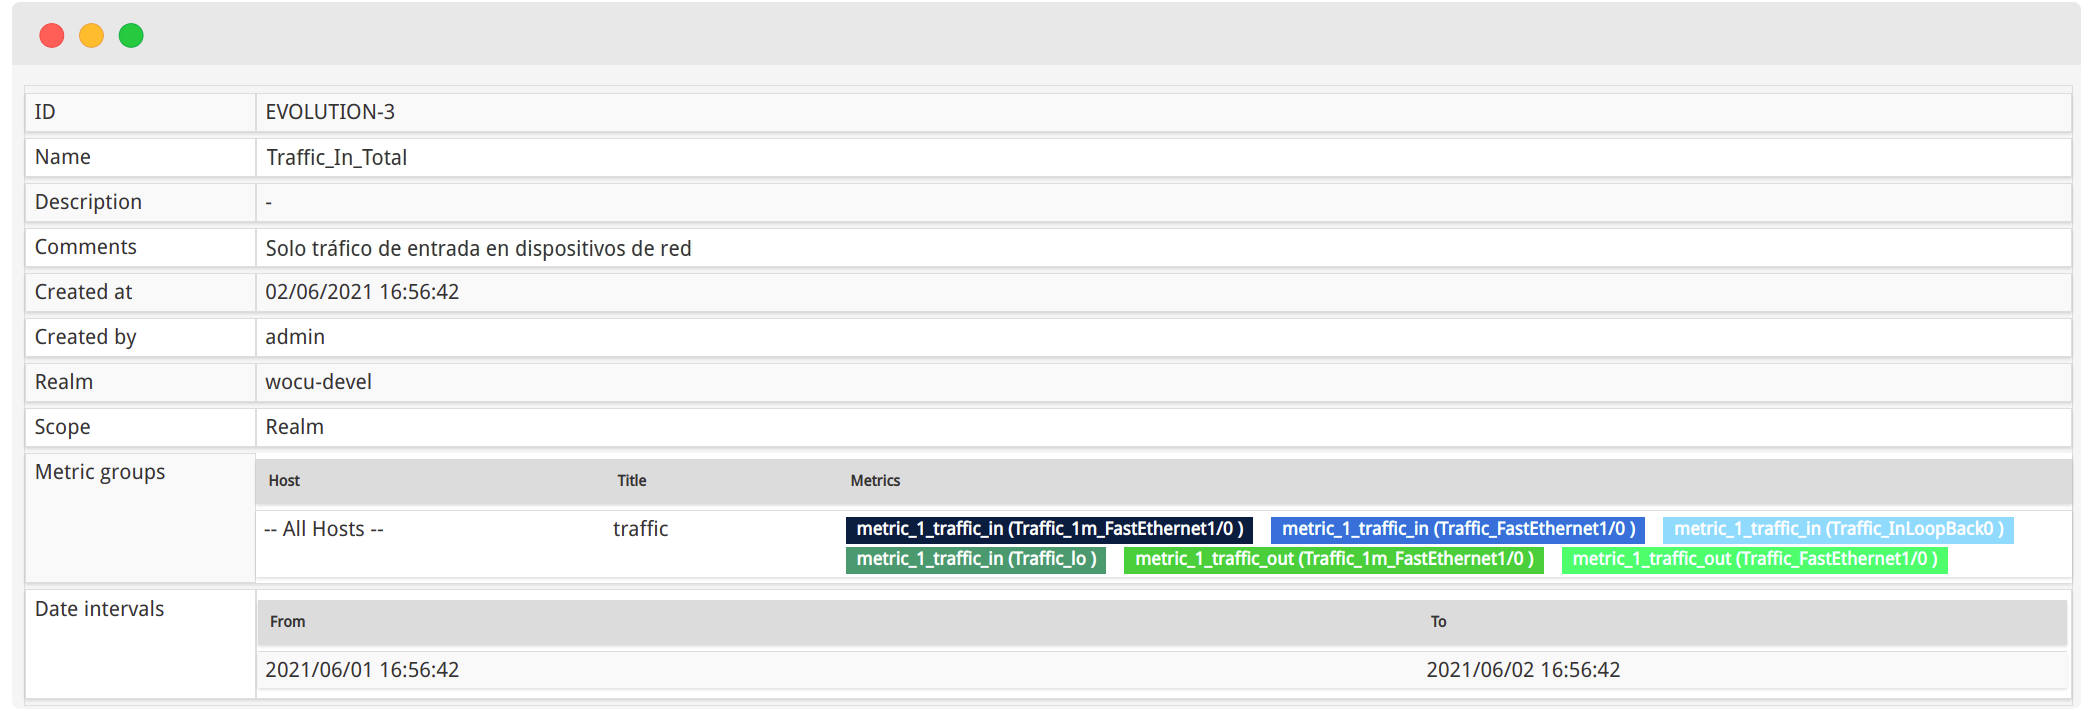
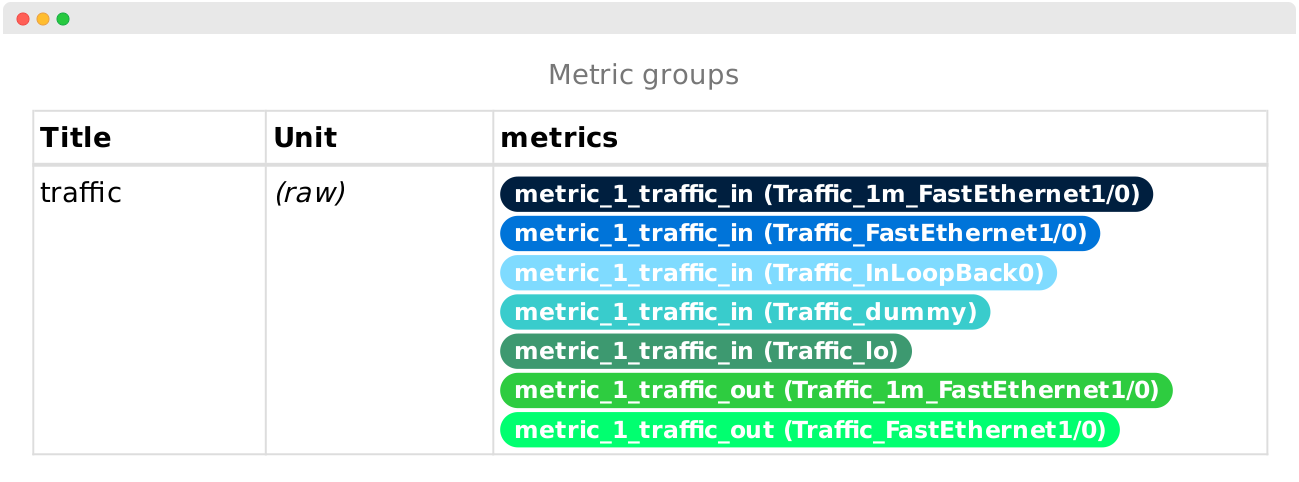
A well-constructed report allows us to know, over specific periods of time, the progress and evolution of relevant metrics that impact our business, which has repercussions on decision-making and the implementation of measures to act accordingly.
11. New endpoint for obtaining user-visible Realms and Multi-Realms
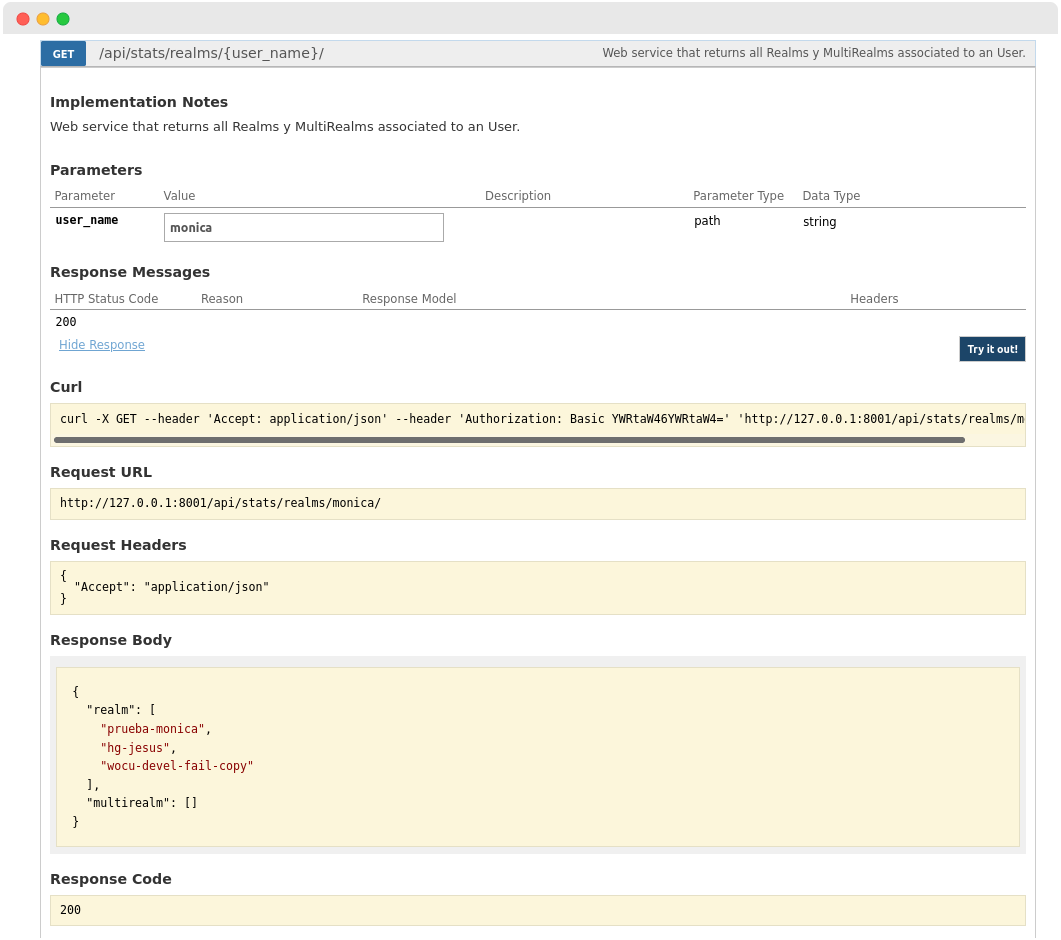
The WOCU-Monitoring Public API has been updated by adding a new endpoint designed for querying and retrieving Realms and Multi-Realms associated with a specific user.
GET /api/stats/realms/{user_name}/
WOCU allows to define which Realms and Multi-Realms are accessible for each of the users of the system. In this way, it is possible to configure access or restrictions to certain Realms, making it possible for an operator to be able to view only those that only affect his daily operations
This endpoint makes it easier and more manageable to query viewing permissions when the number of users and Realms is increasing dramatically.
Note
Access the full WOCU-Monitoring API documentation at Public API documentation.
Other improvements and fixes
Every new version is full of small changes, fixes and optimisations that should be briefly highlighted. We list the most notable ones in this release:
Following the revamp of the Multimetrics reports presentation format (version 0.45), the reports prior to this update reached a state of obsolescence, which implies the disabling of several of the actions and their display. As simple as relaunch a given report again, to build and display the data already in the new report template. To avoid any confusion, a warning message has been added, informing the user of the steps to follow to solve this situation
The usability of the Contacts and Contacts groups fields in the newly created new device setup and add template has been improved, being now a selector of the possible notification addresses, instead of a text box as originally set up.
Fixed a display error in the Other Log Events (Logs), caused after loading the event trace detail component. With this fix, it is now possible to display the bar chart with all traps, along with the detail view of each one.
All the data loading spinners presented at the top left of the different pages of the tool have been removed. These were no longer necessary, as there are other spinners integrated in each widget of the page. With this modification, the views are cleared of redundant elements.
In previous versions, comments longer than one line were cut off with a consequent loss of information. To avoid this situation, comments with line breaks that reach
Livestatuswill be converted into single line blocks, presenting the full text consecutively.Added authentication for the data backend (
MongoDB) that stores the monitoring events and global settings to all Import-Tools.The size of WOCU-Monitoring frontend packages has been significantly reduced, excluding files not needed in production environments. In addition, this change will lead to an improvement in the loading times of the affected pages.
In the add-device add and edit form in the Monitored Assets section of the Import-Tool, a specific validator has been added for the use of
FQDN(Fully Qualified Domain Names) in the Address field, which will allow us to verify that the information entered by the user complies with the rules defining this standard. It will also help us to protect against possible Cross-site scripting (XSS) attacks.Fixed a display and save error of the Metric and service description field during Templates configuration of Multimetrics reports
In our code there are different components and files dedicated to sending messages and alerts of the application. This has caused repeated code, so a refactoring has been carried out to eliminate duplicities and to clean and reduce this code as much as possible.
Fixed a backend bug that blocked the output of members that are part of a particular Host Group located in the Pending Assets tab of the Import-Tool.
Optimised the algorithm used to calculate which members of Host Groups go from Pending Assets to Monitored Assets, using intersections, joins and differences, instead of iterating member by member for each Host Group. This enhancement speeds up the asset migration process.
Fixed a bug in the behaviour of the edit-Hosts form in the Monitored Assets listing of the Import-Tool.
Unified styling of the different export options (PDF and JSON) of Reports. The style will no longer change during the marking or unmarking of a particular report as it used to.
A simple cosmetic change has been applied to the Advanced Configuration button. of the Import-Tool, to improve its visualisation and interaction.
Unification of terms in different views of the tool for greater coherence and conceptual interpretation.
The dependency on
Phantomjs, a tool used to render Reports by both the aggregator and Grafana, was previously removed. As Thruk is the only piece of software that currently continues to use this dependency, from this release it will no longer be distributed by default (thus reducing the size of the package), leaving it up to the user to install it using thewocu-ctl install phantomjscommand.Fixed a bug in the Showing XX Entries component that occurred when not all entries in a table were filled, i.e. when the number of registered entries in a table was less than the allowed (internally predefined) value
Unified styling of the different export options (PDF and JSON) of Reports. The style will no longer change during the marking or unmarking of a particular report as it used to.
Fixed a console error generated when a Host did not have Logs logged in the Events tab.
Some of the
legacycode has been removed from the refactored components of the tool, using a set of specific functions, always guaranteeing the operability and functionality of the page.Recovered the search function by Tags, Templates and Packs in the listing Hosts of Active Assets of the Import-Tool.
Fixed a display bug that prevented displaying the associated impact of Business Process Services (BP Services) in the Business Process table within the Assets section
Fixed a bug that displayed a wrong name for a Host (Host Name) in its modal, when accessed from the Host Inventory Report inventory panel modal, when accessed from the Host Inventory Report inventory panel modal, when accessed from the Host Inventory Report inventory panel.
A new parameter has been added in the monitoring pack Kibana Node to modify the address of the API (default
/api) in case it is served in a different location than the default.Duplicate metrics that were not filtered by service and therefore did not correspond to the specified service have been removed from the summary table accompanying the evolution-graph in the Metrics Evolution Reports.
Modified the functionality of the automatic refresh of data displayed on screen, being disabled by default in the Import-Tool module, since it is not useful in this administration environment, as it is in the Aggregator module, where this function is part of the active monitoring, detecting and identifying changes in the set of assets.
The function of redirecting the user to the login view on expired sessions has been added to the set of widgets and modules migrated to
REACTtechnology.The pagination and navigation through listings and tables function in the Events tab has been visually readjusted, as it was sometimes presented outside the table, hindering the interaction and use of the table
Fixed bug that prevented modifying Business Processes Hosts settings from the Edit from the Hosts Modal tab
Fixed a bug in the browser console, generated when opening the Geomap tab in Multi Realms composed of two Realms sharing the same Host name.
In the custom Configuration of Monitoring Packs modal associated with Templates for Hosts, it is now specified which configuration macros are mandatory to complete in order to make your new configuration profile effective. A short informative text indicates that any macro accompanied by an asterisk (
*) is now mandatory.Added the Select an option option to the selector for the Mass Deletion of Reports, resolving a bug in marking items on different pages of the Reports table.
The code implementing the wocu-ctl stop and wocu-ctl restart commands has been greatly improved by improving the detection of Shinken zombie processes. This results in more reliable stopping and restarting of services and the disappearance of orphaned processes.
Fixed a bug in the Host Modal Services table, which showed wrong information about the last executed check and its duration, only in services with
PendingstatusFrom now on, on Devices or Services in which there is no no previous checks have been executed, the label Never will be displayed in the field Last Time Up of the Last checks information panel of the section Device Modal Status, and in the Last Checked At field of the panel Last check information of its homologous section of ModalDevices.
The table in Host Modal Services returns to alphabetical order, and the arrangement of elements can be changed by using the column sorting function for ascending and descending columns
New support and acceptance of the dot character (.) for services configured in the
service_overridedirective. There are many network devices that contain this character in their interface names. With this support, future read and data processing errors are solved.A new optional parameter has been added to the web service that returns operational and asset monitoring information for the selection of the columns obtained in each query to improve the performance of the requests that make use of this service.
WOCU-Monitoring has the Discover function to automatically detect and assign configuration values to
Macros. In this version a bug has been fixed where the discovered value resulting from the executed query (Discover function), was not correctly assigned to aSingle Macrowith different options of choice, and therefore, it was not stored in the corresponding database.
Upgraded software
Numerous pieces of software integrated in WOCU-Monitoring have been incorporated and updated:
Software |
Previous version |
Current version |
Remarks |
|---|---|---|---|
Node |
10.19.0 |
14.16.1 |
|
Grafana |
5.2.3 |
7.5.4 |
https://github.com/grafana/grafana/blob/master/CHANGELOG.md#754-2021-04-14 |
Kibana |
3.1.2 |
4.1.2 |
|
LMD |
1.9.4 |
2.0.0 |
Monitoring packs
See our catalogue of Monitoring Packs in the following link.
3par
A new pack called 3par has been designed to monitor storage arrays of HP devices. This pack records the following service metrics:
Description of the alerts in the disk cluster.
Number of online nodes.
Number of discs online.
Number of online virtual volumes.
CPU in % of each node.
Disc capacity.
Information, performance and status of each virtual volume.
Unix-files-ssh
The Unix-files-ssh monitoring pack has been updated, allowing from now on the free choice of the unit of time period (days or minutes) for the review of the latest modifications of certain files via the SSH protocol.
Attention
To maintain backward compatibility, the default value of days is maintained.
Maltiverse
Maltiverse is an open and collaborative platform for indexing and searching indicators of engagement (IoCs).
In this version, a new pack has been developed to query, through the Maltiverse API, the level of compromise of the public IP addresses of the devices, as well as their name (FQDN). In addition, it also allows monitoring the compromise of URLs associated with the device as a service.
Mailbox-query
A new pack called Mailbox-query has been created, designed to query a mailbox via IMAP, looking for alert messages sent automatically by electronic devices.
This pack functions as an additional method to detect events that could generate alerts, for example, on isolated machines whose only means of communication with the outside world is via email.
This is why the pack must be applied to the devices that will generate the alert messages and whose ‘IP address’ will appear as the source of the alert in the Subject of the email.

Important
The pack has the ability to detect both the message that generates an alert and the message that deactivates the alert.
The pack maintains the last reported status if no new messages are found.
The pack deletes found messages from the mailbox so that they do not appear in the next search.
ElasticSearch
Authentication (username and password) has been added as an option for the Elastic node monitoring pack.
Recall that this pack monitors services as varied as cluster status, disk space used, indexing health, memory used by the Java Virtual Machine (JVM), and so on.
By adding authentication support, the pack is now able to monitor restricted resources.
Microsoft SQL Server
A new pack called MSSQL (Microsoft SQL Server) has been created, designed to monitor the operational status of Microsoft SQL servers.
In addition to the connectivity through the corresponding port, this pack includes generic checks that monitor through SQL queries the following parameters:
State
Version
Memory usage
Memory Pressure’ indicators
It also has a complex macro that allows you to configure the specific tables you wish to monitor, and to obtain the number of active transactions on these tables, generating the corresponding metrics. This indicator is essential to measure the efficiency of the database. A high number of active transactions may indicate that certain transactions are never being completed.

New bulk discover script for the BGP package
This script allows to discover and configure all peers on Hosts that have previously applied the pack BGP.
By simply executing this script, all peers will be added to the Host configuration and the necessary services for monitoring will be created. The poller-tag functionality is also supported and the script will be executed from the corresponding poller in each case.
Improvements to the Linux-SSH package
A new function has been added to encode the output (stdout) of system command executions using the Linux SSH pack. This function checks the type of data returned (which may vary by operating system, distribution and even version) and if it is of type bytes (the expected data type when invoking external commands, but not always true) it encodes to string accordingly.
Finally, the function can be reused by any pack that executes external system commands, such as Linux SSH.
About WOCU-Monitoring
WOCU-Monitoring is a monitoring tool that integrates the latest Open Source technologies for monitoring, visualisation, metrics graphing and log management, providing a wide visibility on the status and availability of network elements, servers, databases and workstations (among others) using customised Monitoring Packs.
In addition, the Enterprise version of WOCU-Monitoring called Enterprise allows deployments of thousands of IP devices, in a distributed environment, with customisations tailored to each customer’s infrastructure.