Release Notes 0.38
The following are the new features of the 0.38 version of WOCU Monitoring.
This version comes loaded with new integrations and functionalities that enrich our monitoring tool. For example, a great deal of work has been done on the stability of the WOCU aggregation page, increasing its performance and mitigating the excessive load on the machine. Visually, a new graph showing the evolution of the most problematic standard realms, together with the saving of the search performed after reloading the aggregation page, is also a highlight.
Remember that WOCU collects and manages a large amount of data generating very extensive lists, for this reason, the Events list has been reorganised, hiding the SOFT events and showing them only when a new specific filter is activated.
It should be noted that our Asset Import Tool has reached a fully stable and consistent version. Consequently, the BETA label present in previous versions has been removed.
We continue to enrich the Import Tasks, with new configuration parameters to increase the precision in the aggregation of Assets. In parallel, to facilitate the visualisation and monitoring of the tasks processed in WOCU, the Task and Tasks Status sections have been unified, showing all the information in a single view.
In this version, work has continued uninterrupted on the reports module, specifically those related to the availability of Assets. The Availability Report has been improved with new integrations such as: the possibility of defining multiple time frames for data collection or a new window with detailed information and status history on the availability of each Host. But undoubtedly, the star entry in this module is the new Availability Periods Report, with which the periods of operability (available/unavailable) of Hosts and Services are obtained according to the established configuration.
Finally, we continue to complete and add value to our catalogue of Monitoring Packs, both by adding new packs and by supporting new technologies and manufacturers.
But there is much more, keep checking this document for a complete list of new features in this version.
Import tasks
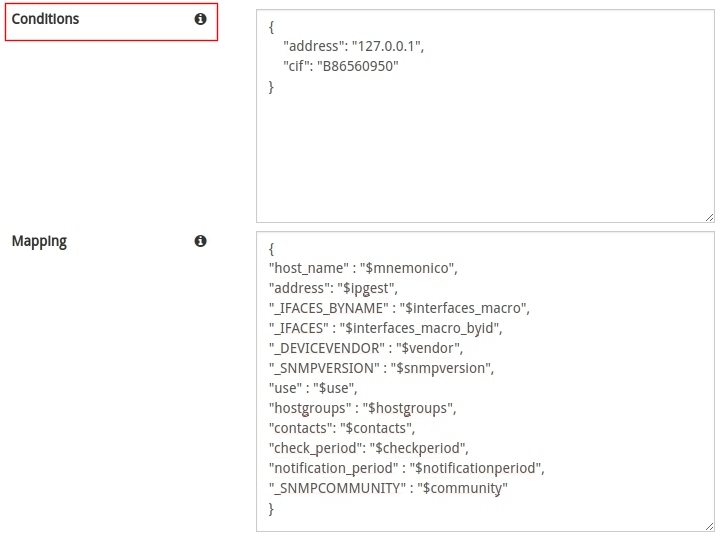
New Conditions field in MySQL import task
The MySQL Database Import (MySQL_Import) task is in charge of importing from a MySQL database and by means of queries to a remote table, the data of the Assets that WOCU needs for monitoring (such as host_name, address, contacts…).
To allow for more precise queries, a new Conditions field has been added to specify conditions for the import. Now when querying the database, you can define as conditions WHERE ... AND ..., thus allowing you to filter and return only certain data you want to import.
Note
More information can be found at: MySQL Database Import (MySQL_Import).
Interface
Performance improvements on the main aggregation page
The WOCU aggregation page has been improved internally with the aim of increasing its performance. To this end, the following changes have been implemented:
1. Ordering of the Realms summary panels by monitoring IP, giving priority for loading to standard type Realms over Host Group based Realms.
2. Individual threads have been created for each standard Realm and Multi-Realm, in order to lighten the processes and avoid interrupting the rest of the threads.
3. For the same reason, the loading of the Realms summary panels has been improved, to avoid bottleneck situations, by first grouping them in blocks, followed by the loading of panels according to the data input.
4. Disabling the auto-refresh of the screen by default, so as not to generate load on the machine.
Saving the search performed after reloading the aggregation page
In the Home, all Realms summary panels monitored in WOCU are listed. In large infrastructures, the number of Realms can be very high, so the filters included in this view are very helpful, as they facilitate the retrieval and management of Realms.
For greater user comfort and usability of the tool, in this version and like the rest of the filters, the Search filter will maintain the search performed after reloading the page, thus preserving the result obtained.
Note
More information can be found at: Filters and sorting of summary panels.
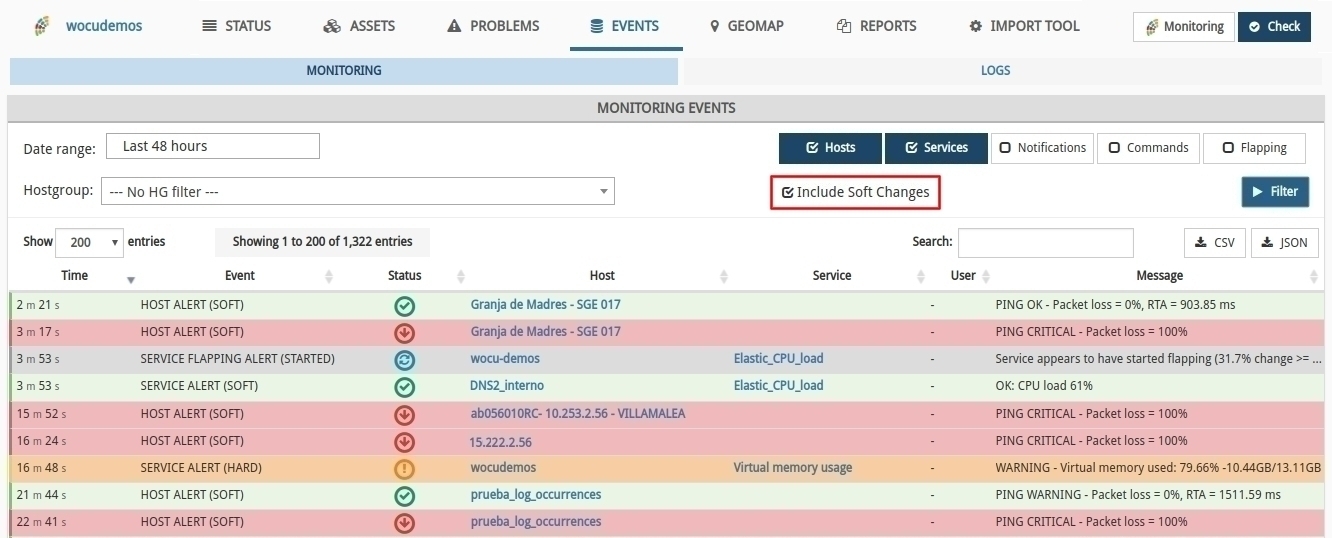
New SOFT type event filtering option
In previous versions, both SOFT and HARD events were displayed in the Monitoring Events (Monitoring), generating very large and information-heavy listings.
From this version onwards, the inventory will only show HARD events by default. And to include the excluded SOFT events, check the new Include Soft Changes checkbox, located together with the rest of the filters. By confirming this action, the inventory will load all events without any restriction.
Remember
SOFT: is assigned when the Service status obtained is not definitive, as it may or may not be reverted in the next check attempt. In the case of exceeding the predefined number of attempts obtaining negative statuses, the error severity level will be raised to HARD type. The objective is to avoid false alarms due to transient problems.
HARD: is assigned when the Service status obtained is erroneous continuously, without being corrected. That is, when the service returns a negative status in the first attempt and also in the subsequent checks, exceeding the number of predefined attempts. This new situation is notified to the contact user.
Note
More information can be found at: Monitoring Filters.
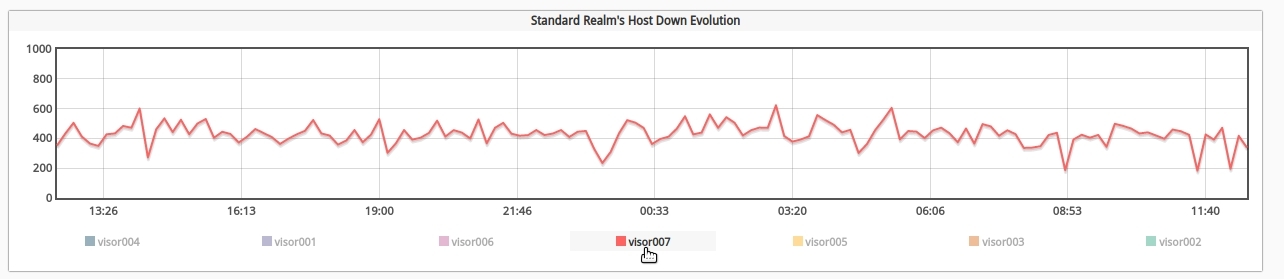
New graph of the evolution of the most problematic Realms on the Home page
A new graph has been added to the Home, in order to continue to provide complete and up-to-date information on Realms monitored in WOCU.
Specifically, this graph accurately presents the ten standard Realms with the most incidents recorded in the last 24 hours. That is, it shows the evolution together with the sum of Hosts and Host Business Process (BP Hosts) outages, integrated in standard-only Realms.
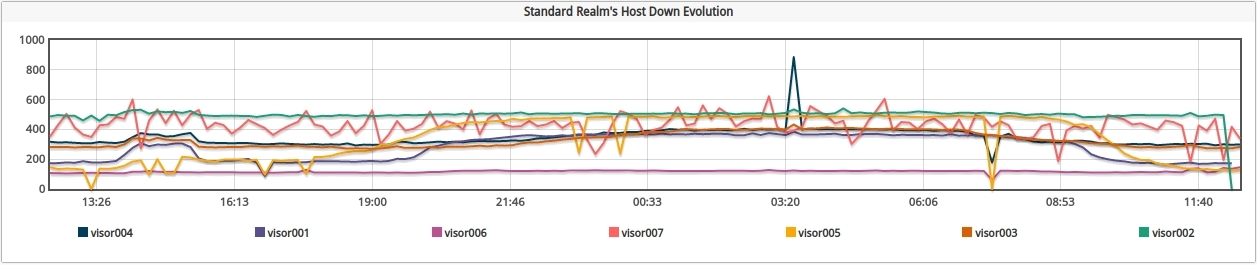
The vertical axis presents the numerical values as a scale, while the horizontal axis expresses the time (exact time within the last 24 hours).
In addition, the chart has the following functionalities:
By hovering the cursor over any point on the graph, an information window will pop up with the values recorded for that particular point. WOCU will first indicate the exact time of the record and then the total value of drops (sum of Hosts and BP Hosts) for the specific standard Realm.
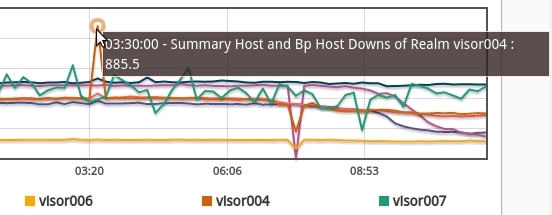
By clicking on one of the Realms in the legend, only the line of the selected Realm will be displayed on the graph and the remaining Realms will be disabled. To restore the initial graph, repeat the action by clicking on the Realm again.
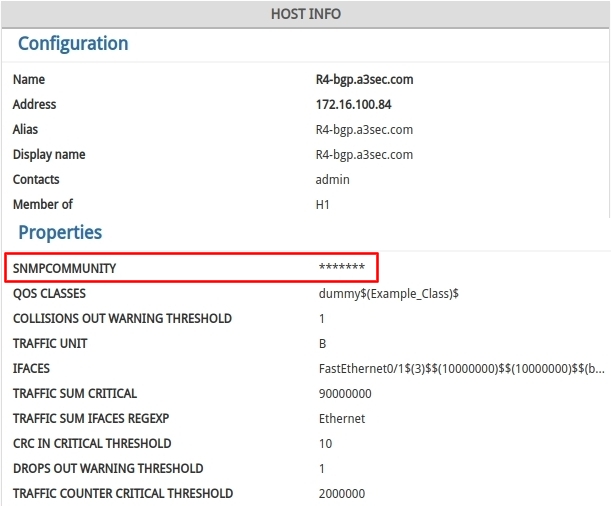
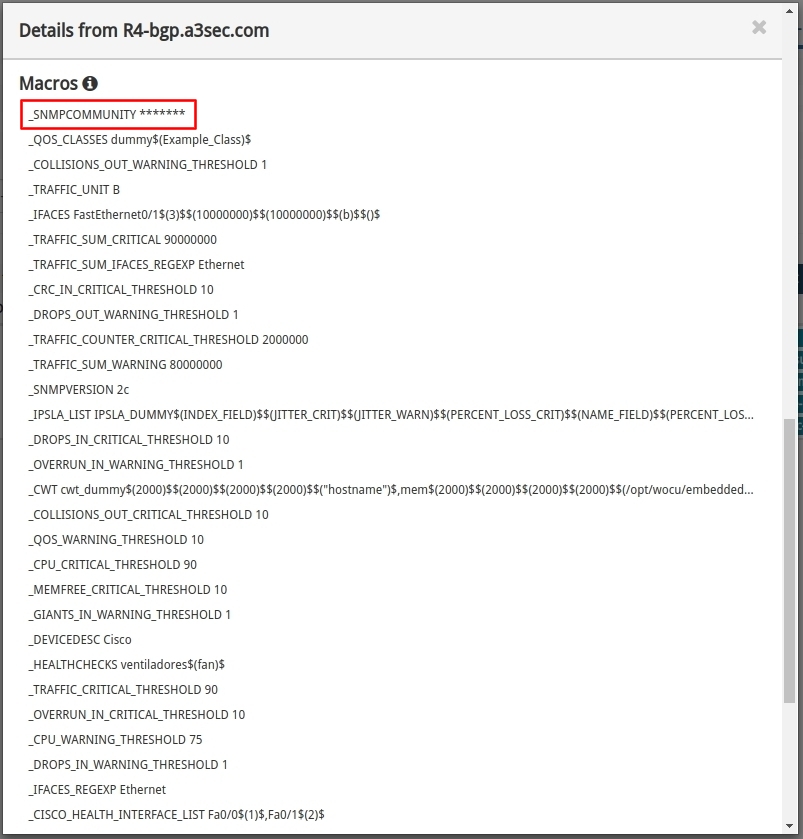
Hiding sensitive macros
Macros are elements that WOCU uses internally to store properties and information of the monitored Assets, which may contain sensitive data. In these cases, those Macros with sensitive information, which are defined as Protected in the monitoring pack to which they belong, their values will be automatically hidden by the interface. In this way, in this new version, users will be prevented from viewing potentially sensitive information.
Note
The macro value is rendered unreadable by a fixed-length string of asterisks”of fixed length”
This change affects the Host Info window:
As well as in view of the Host List Actions (ℹ) information button in the Monitored Assets section of the Import Tool:
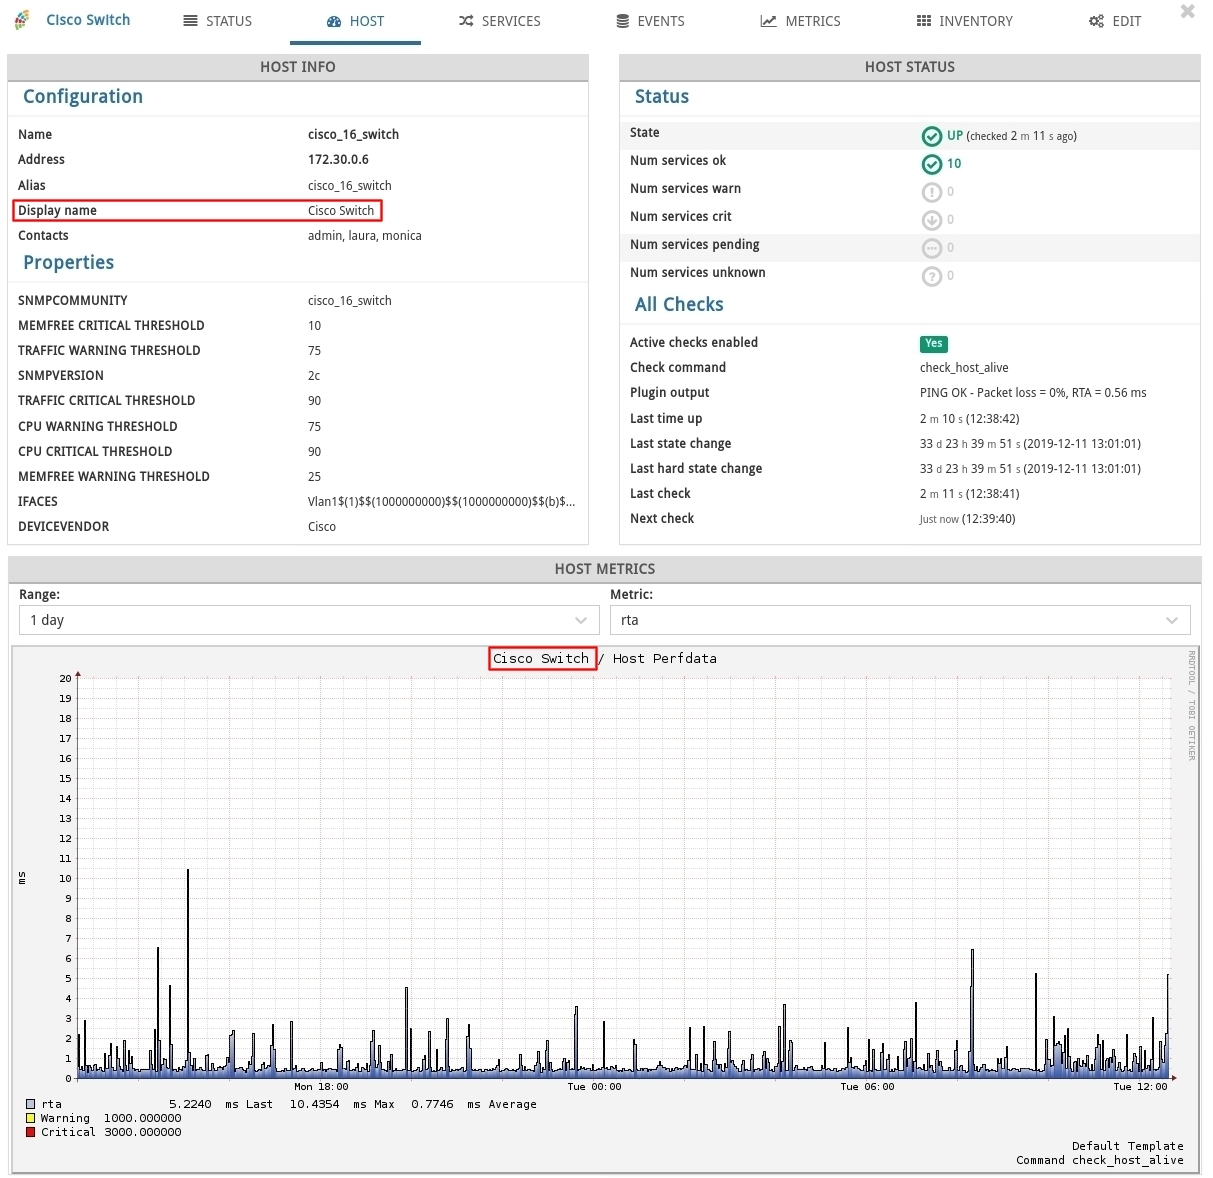
Display of display_name in RRD charts
Every Host in WOCU is identified by its host_name which is a unique value and is not repeated in the rest of the Host configuration. Given the nature of this identifier, where numeric or mnemonic values are commonly used, WOCU provides an additional value called display_name used to display the Host name in the interface.
In this new version, the display_name value is also used in the RRD metrics graphs, thus improving the identification of the Hosts by the tool’s operators when consulting this type of graphs.
Import Tool
Stable status in the Import Tool module
Import Tool, is the base module of WOCU, where the import, configuration and management of the Assets of the monitored infrastructure is carried out.
This is why we have been working continuously to achieve a fully stable and consistent version, which is where we are now. For this reason, the Beta label that used to accompany the IMPORT TOOL tab in the main toolbar has been removed:

Unification of the sections Task and Tasks Status.
All the information from the Task Status tab has been transferred to the Task tab of the Import Tool. With this integration, all the information about the Tasks that WOCU offers to the user is collected in a single view.
The following two tables are now displayed:
Tasks Table: where all import tasks configured in WOCU are managed and from where new ones can be added.
Tasks Status Table: where detailed information on the status and current status of previously executed import tasks is provided.
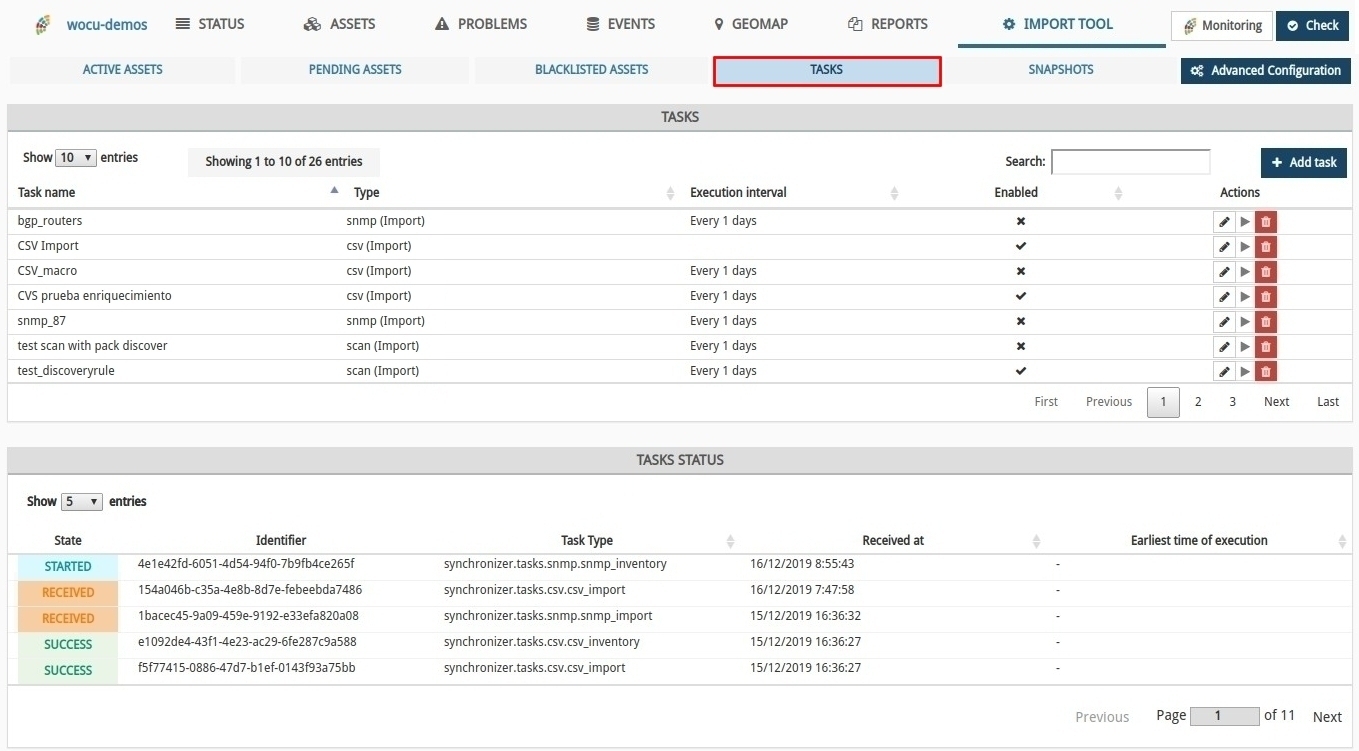
This change is intended to make it easier to view and monitor the tasks processed in WOCU, by not having to navigate between tabs to see their status updates.
Note
More information can be found at: Import Tasks (Tasks).
New Advanced Configuration access button of the Import Tool
To streamline the daily operations of Administrators, the Advanced Configuration button has been added within the Import Tool, redirecting the user to the WOCU Import Tool’s own Administration window.
Attention
Not to be confused with the Configuration option, as they work with separate databases.

This new button replaces the previous way of access: Monitoring button > Import Tool > Advanced configuration.
Note
More information can be found at: Advanced Settings button.
New endpoint to get the list of Hosts using a given pack
A new endpoint has been implemented in the public api of the Import Tool. This endpoint allows to obtain a list with the information related to the monitoring of all the Hosts that have a certain pack configured.
GET /import-tool/apirest/active-host-detailed-info-by-pack/{pack}
Information
Improvements to the Availability report
We continue to work on the functional and operational improvement of the Availability Reports. In this version we highlight the following integrations:
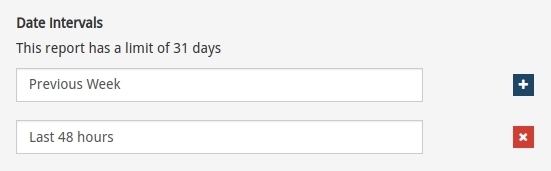
1) In previous versions, it was only possible to define a single time frame in the report generation. Now, the user can configure multiple time ranges, thus overcoming limitation issues in the collection of availability data.
As in other types of reports, adding a new range is as simple as clicking on the button with the plus sign (+) to add a new range, or clicking on the red button with the cross (X) to delete it. Only the remaining ranges will be applied when the report is run.
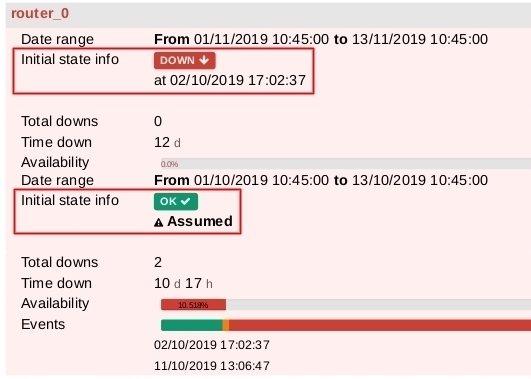
2) In the PDF Availability Report, specifically in the section Host-to-Host Availability (Hosts), the field Initial state info has been included, where the initial state of the Host is indicated, together with the exact date and time when WOCU registered this state.
Remember that in case the system has not collected enough data to define the initial state, the user may assume and assign a starting state during the report configuration in the
Host assumed initial stateparameter. This situation will be identified in the report with the icon of a warning sign (⚠) followed by the word Assumed.
3) Last but not least, a new Host Availability information window has been included. Clicking on any Hosts by host Availability entry in the report will bring up a new view with detailed information on the operability and status history of the host in question.
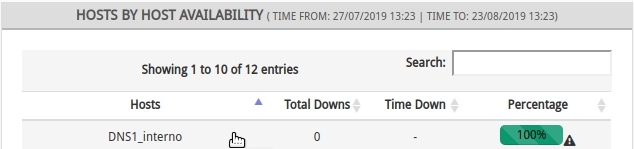
In case you have configured several time frames, you have to select one of them in the Date ranges field. The view shall be updated with the data corresponding to the selected range.
In general terms, in this view we can observe:
Time bar: which provides a history of the availability of the Host over the set time range. A simple legend accompanies this graphical representation, informing the total time (given in days and hours) that the Host has been available (in green) or unavailable (in red).
Initial Host Status: together with the exact date and time when this status was reached and recorded.
Status history table: where the alternation of statuses occurring during the defined time range is recorded.
Note
More information can be found at Availability Reports.
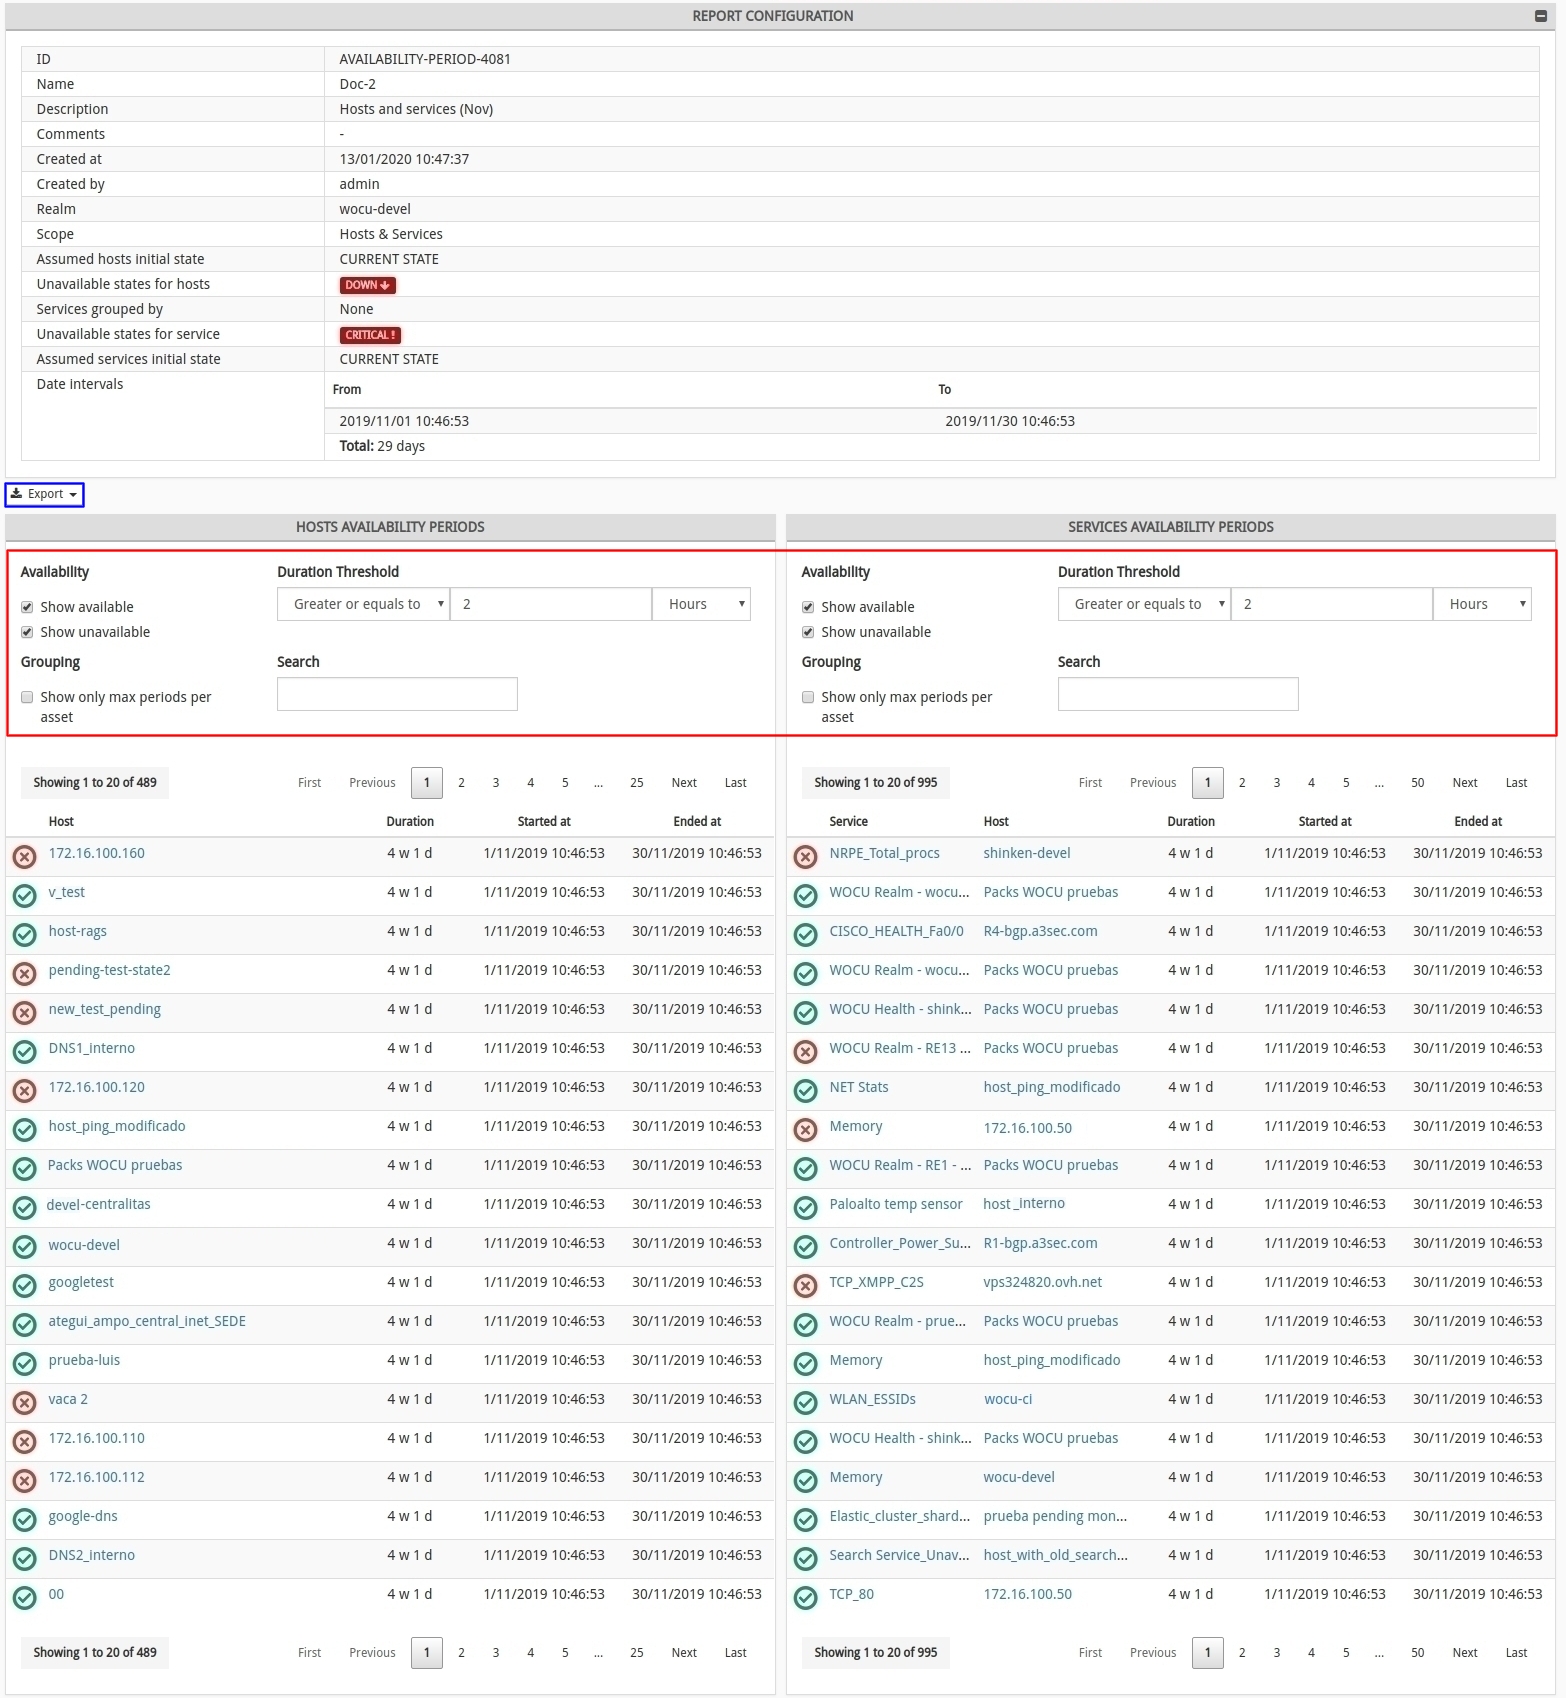
New Availability Periods Report
WOCU manages and provides detailed information about the availability of the Assets of the monitored technological infrastructure. Availability is a concept subject to very varied configurations, for this reason and as a complement to the Availability Reports, the Availability Periods Report has been created, in order to be able to configure and obtain the periods of operability of Hosts and Services that comply with the established configuration.
In other words, this report answers questions such as: Realm hosts that have been down for more than one day in the month of November.
Furthermore, as a novelty and convenience for the user, this report makes it possible to edit the configuration parameters of operational periods and to export in PFD and JSON formats from the report already generated, i.e. it is possible to modify and download a new report without having to go back to the Reports. page.
To do so, one of the parameters available at the top of the report panels will need to be modified. The new results will be instantly displayed in the relevant listings.
Attention
The edited and exported report with a new configuration will NOT be saved in the report history. Only the initially executed report will be recorded.
Note
More information at Availability Periods Reports.
Monitoring engine
Shinken 2.4.3-106
This new version of WOCU includes the development version of Shinken, with over 100 changes from the last stable version released (many of these changes were made by the WOCU developers themselves). This version has been intensively tested by the WOCU engineering team and promises to solve numerous memory overflow problems.
LMD 1.8.1
The LMD software has also been upgraded to its latest stable version (1.8.1) which includes numerous performance and stability improvements. LMD is the tool used to talk the livestatus protocol with Shinken and is of vital importance in infrastructures with a large number of hosts as it acts as a proxy-cache for information requests.
Monitoring packs
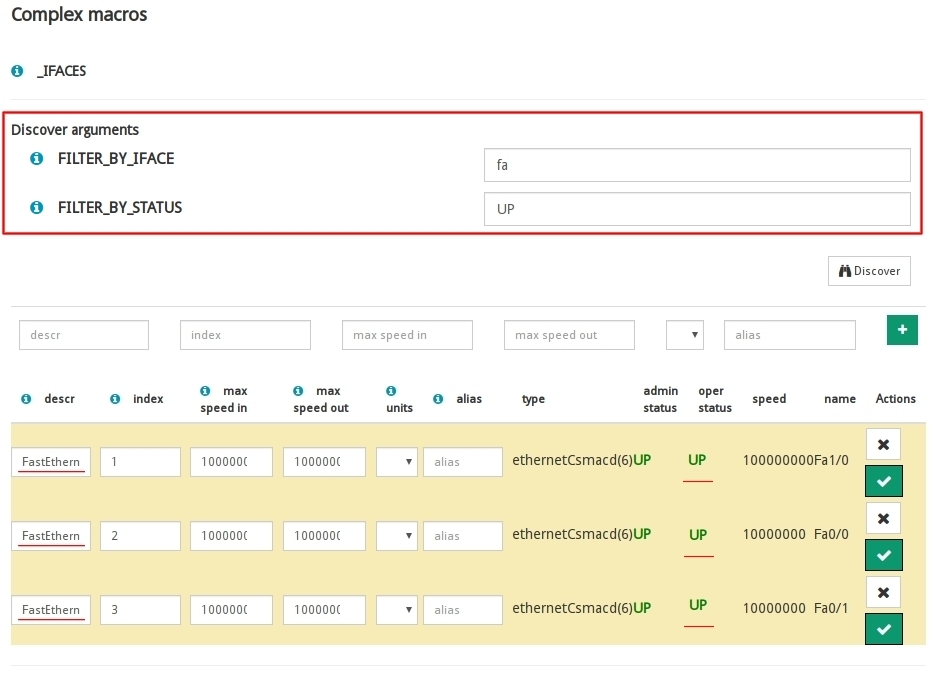
Support for interface discovery filtering in the networkhost-traffic package
The networkhost-traffic pack allows a discovery of the interfaces of a particular asset, in order to monitor its traffic.
For greater convenience in the configuration of the pack, the possibility of filtering by name and status in the discovery of interfaces has been added, allowing to retrieve only the discovered interfaces that meet the established requirement and to exclude those that do not.
As shown in the following image, clicking the Discover button will perform the discovery of only those interfaces whose name or description contains the text specified in the FILTER_BY_IFACE field or whose status matches the one specified in the FILTER_BY_STATUS field.
Improved performance of interface Discover action
In the internal configuration of Monitoring Packs, specifically in interface discovery, WOCU uses the Discover action to retrieve the interfaces found and/or filtered by SNMP queries.
This function has been optimised to be much faster. All data acquisition is now done using the Bulk method, which has allowed us to reduce times enormously.
This improvement is especially noticeable for computers with several hundred interfaces. In this version, the Discover is completed in one tenth of the time it took in previous versions.
New pack snmp-generic-advanced
This pack allows all types of SNMP queries to be made by querying specific OIDs without relying on vendor-specific packs.
To use it you have to configure the OID to query, the type of data, and optionally units and text to add in the output of the check.
The OIDs queried can be of counter or text type:
1. For counter type OIDs, if we choose the
ratetype, the output of the check will show the difference between the last value and the previous one, ideal for querying transfer rates or traffic volumes.2. For text type OIDs, we can define a string (type
string) or a regular expression (typeregex). The check will take care of telling us if there is a match with the SNMP response.
Support for manufacturer Huawei in the networkhost-mobile-signal package
The pack for obtaining mobile signal quality information and metrics (3G/4G), now also supports the manufacturer Huawei, which is added to the already supported manufacturers Cisco and Teldat.
Support for Dell computers running OS 9.14+ in networkhost-cpu and networkhost-mem packs
The packs for CPU and Memory usage metrics now also support Dell machines with operating system version Dell OS 9.14 or higher.
New hp-blade-hwinfo package
This pack allows you to obtain information from HP Blade Server hosts and their hardware sensors.
The information monitored is as follows:
cpuInfo: CPU(s) information > Name, current speed, maximum speed and number of cores.
cpuTemp: CPU(s) temperature > Allows to define thresholds and generate alerts if they are exceeded.
FanStatus: Fan status > Generates alert if status is not OK.
memInfo: Memory module information > Size, manufacturer, model and location.
memStatus: Status of memory modules > Generates alert if status is not OK.
sysInfo: Server information > Serial number, product name and description.
Note
Access the Monitoring Packs catalogue at the following link: link.