Release Notes 54
Publication Date: 01/02/2023
This document deals with the new features, functionalities, enhancements and fixes integrated in version 54 of WOCU-Monitoring.
Our software model all in one, concentrates innovative features that respond to the requests of our users and the current needs of the market.
Always oriented towards an integral monitoring line, the new environment Passive Assets is included, where an alternative to active network monitoring is promoted. This new space acts as the epicentre for the administration and implementation of monitoring services, based on passive communication between device and receiver. A very efficient approach that increases the degree of quality assurance.
Another major part of our efforts has gone into the new Audit Module. At the click of a button, the Administrator can obtain absolute visibility of the actions executed in the application. It traces all movements made in terms of asset configuration and changes tracked by the system.
Focused on the agile, dynamic and fruitful management of the tool by the operator, several options for filtering items in different locations of WOCU-Monitoring have been added, such as the filtering of logs according to time criteria through a graph or the restriction of alarms according to the type of event generated.
The User’s Manual also increases its content, with a new chapter dedicated to the additional UI-ACL module, where the actions that can be disabled for certain profiles within WOCU-Monitoring are typified and broken down.
Our API Public continues to grow due to the development of two new endpoints useful for mass user queries and deregistration.
At WOCU-Monitoring we remain committed to a stable product evolution with lower maintenance costs and high profitability. Read on to find out more about the complete list of new features and improvements in version 54.
1. Incorporation of the new Audit Module
Independent module destined to the meticulous registration of actions executed in WOCU-Monitoring, tracing all the movements carried out in terms of assets configuration and changes tracked by the system, with the purpose of making a later audit of the processed information viable. Thanks to this last integration, the Administrator will have an absolute supervision of all the actions previously carried out.
This service is distributed in two locations:
Global audit
A new tab called Audit has been added, located in the top header of Global Options, from where the application can be fully audited.
Attention
This module will only be enabled for Super-admin users.

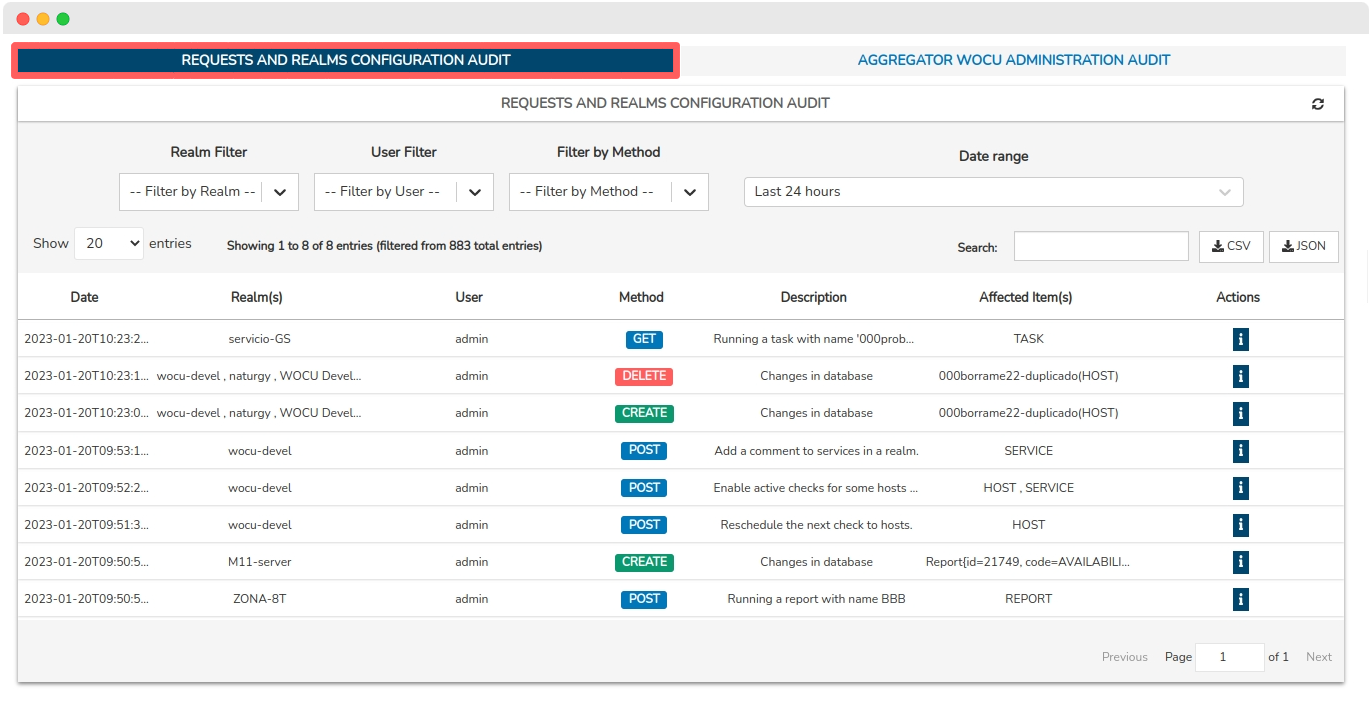
In this new space we will find two different sub-sections:
-
In this section you will be able to view all actions and operations performed on Realms, i.e. information that is audited at Realm level is provided, for example:
Creation, deletion or modification of assets: Host, Hostgroups, Business Process, Packs, Contacts, etc.
Creation, deletion or modification of Periodic tasks.
Execution of Snapshots.
Actions about Problems: Comments, Donwtimes, Submit Passive Check, Exports metrics, etc.
Creation, removal and execution of Reports, Templates and Scheduling.
Addition and deletion of Dashboards.
-
In this section you will be able to view all the changes that occur at administration level (and not at Realm level) in the application from the Advanced_configuration module, for example:
Login control (including failed attempts)
WOCU-Monitoring administration: changes to Realms or Multi-Realm, id-origins, loggers, metrics, realm categories, user assignment, etc.
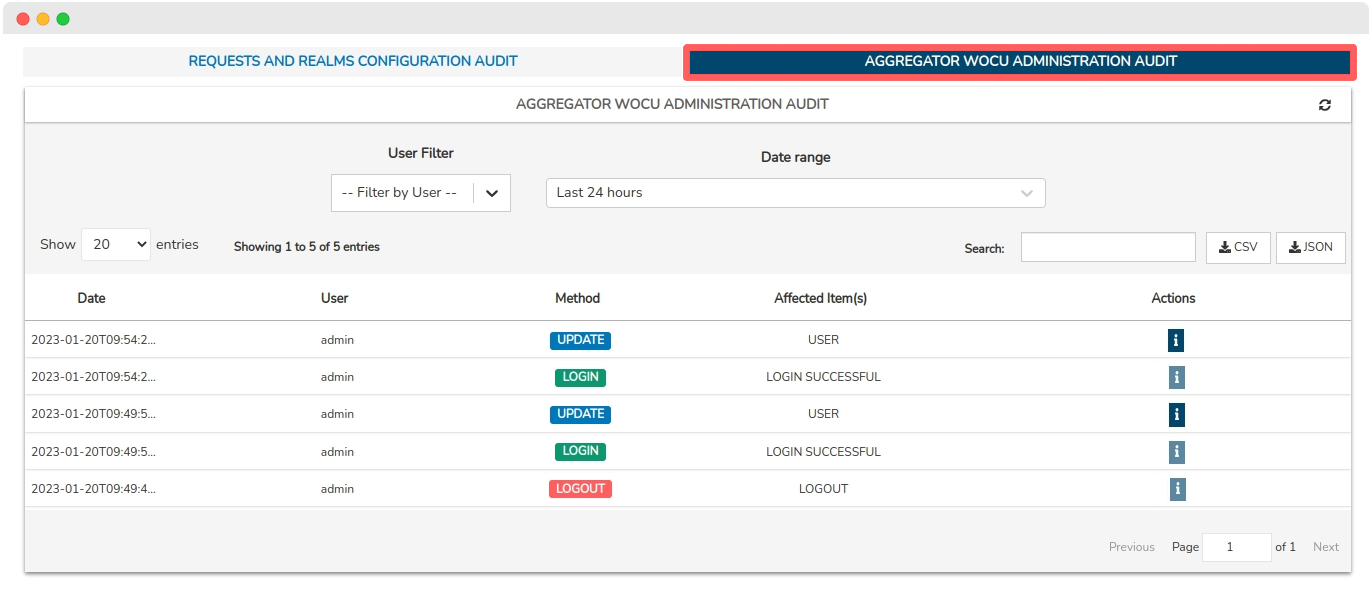
Audit at Realm level: New Audit section in Events.
The Events section integrates a new subsection called Audit. This space overlaps with the Realms mentioned above.
In it, it is possible to visualise all the actions and operations carried out on a specific Realm, i.e. it provides the information to be audited at Realm level, with the purpose of making a subsequent audit of the processed information feasible.
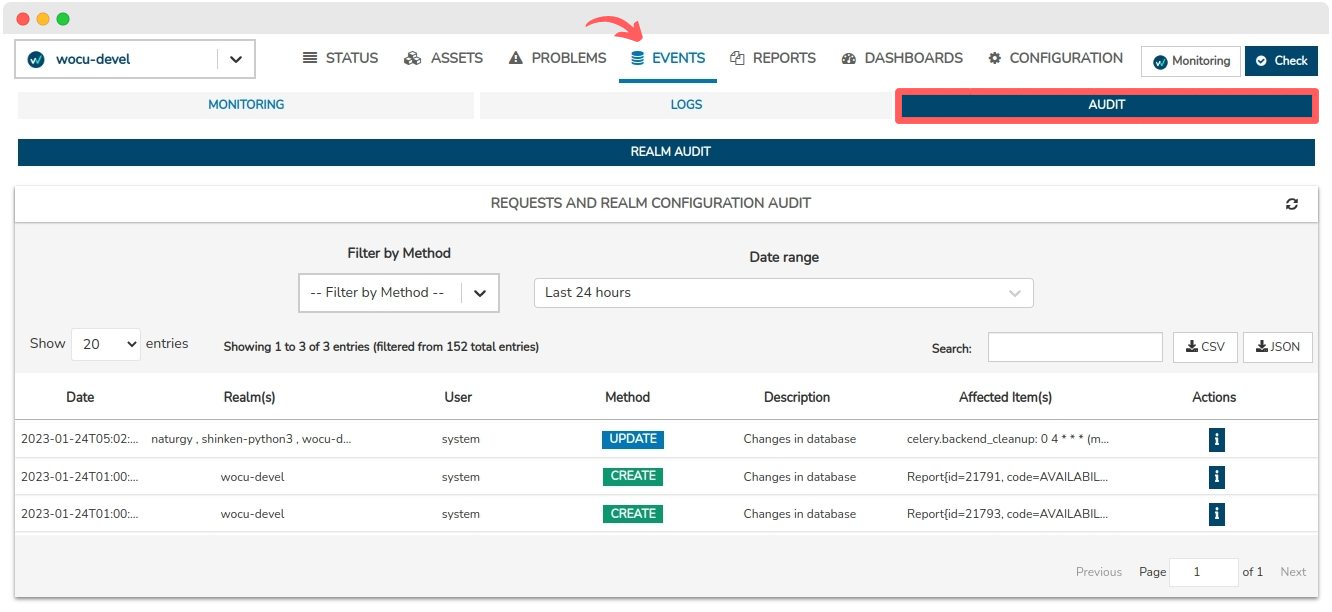
With this evolution, the Events section consolidates as the epicentre for viewing, hosting and auditing logs of a multitude of elements in WOCU-Monitoring.
Note
The Audit subsection can also be managed through the Permission control and authorisation of user actions (UI-ACL) system.
2. Passive Monitoring: New Module Passive Assets.
Within network monitoring, two important methods are distinguished: Active Monitoring and Passive Monitoring. Broadly speaking, while active monitoring is regular in terms of requests for operational status (regardless of whether or not a change has occurred), passive monitoring is asynchronous, i.e. it receives only the events related to these changes, which is a very efficient way of monitoring, as it consumes very few resources.
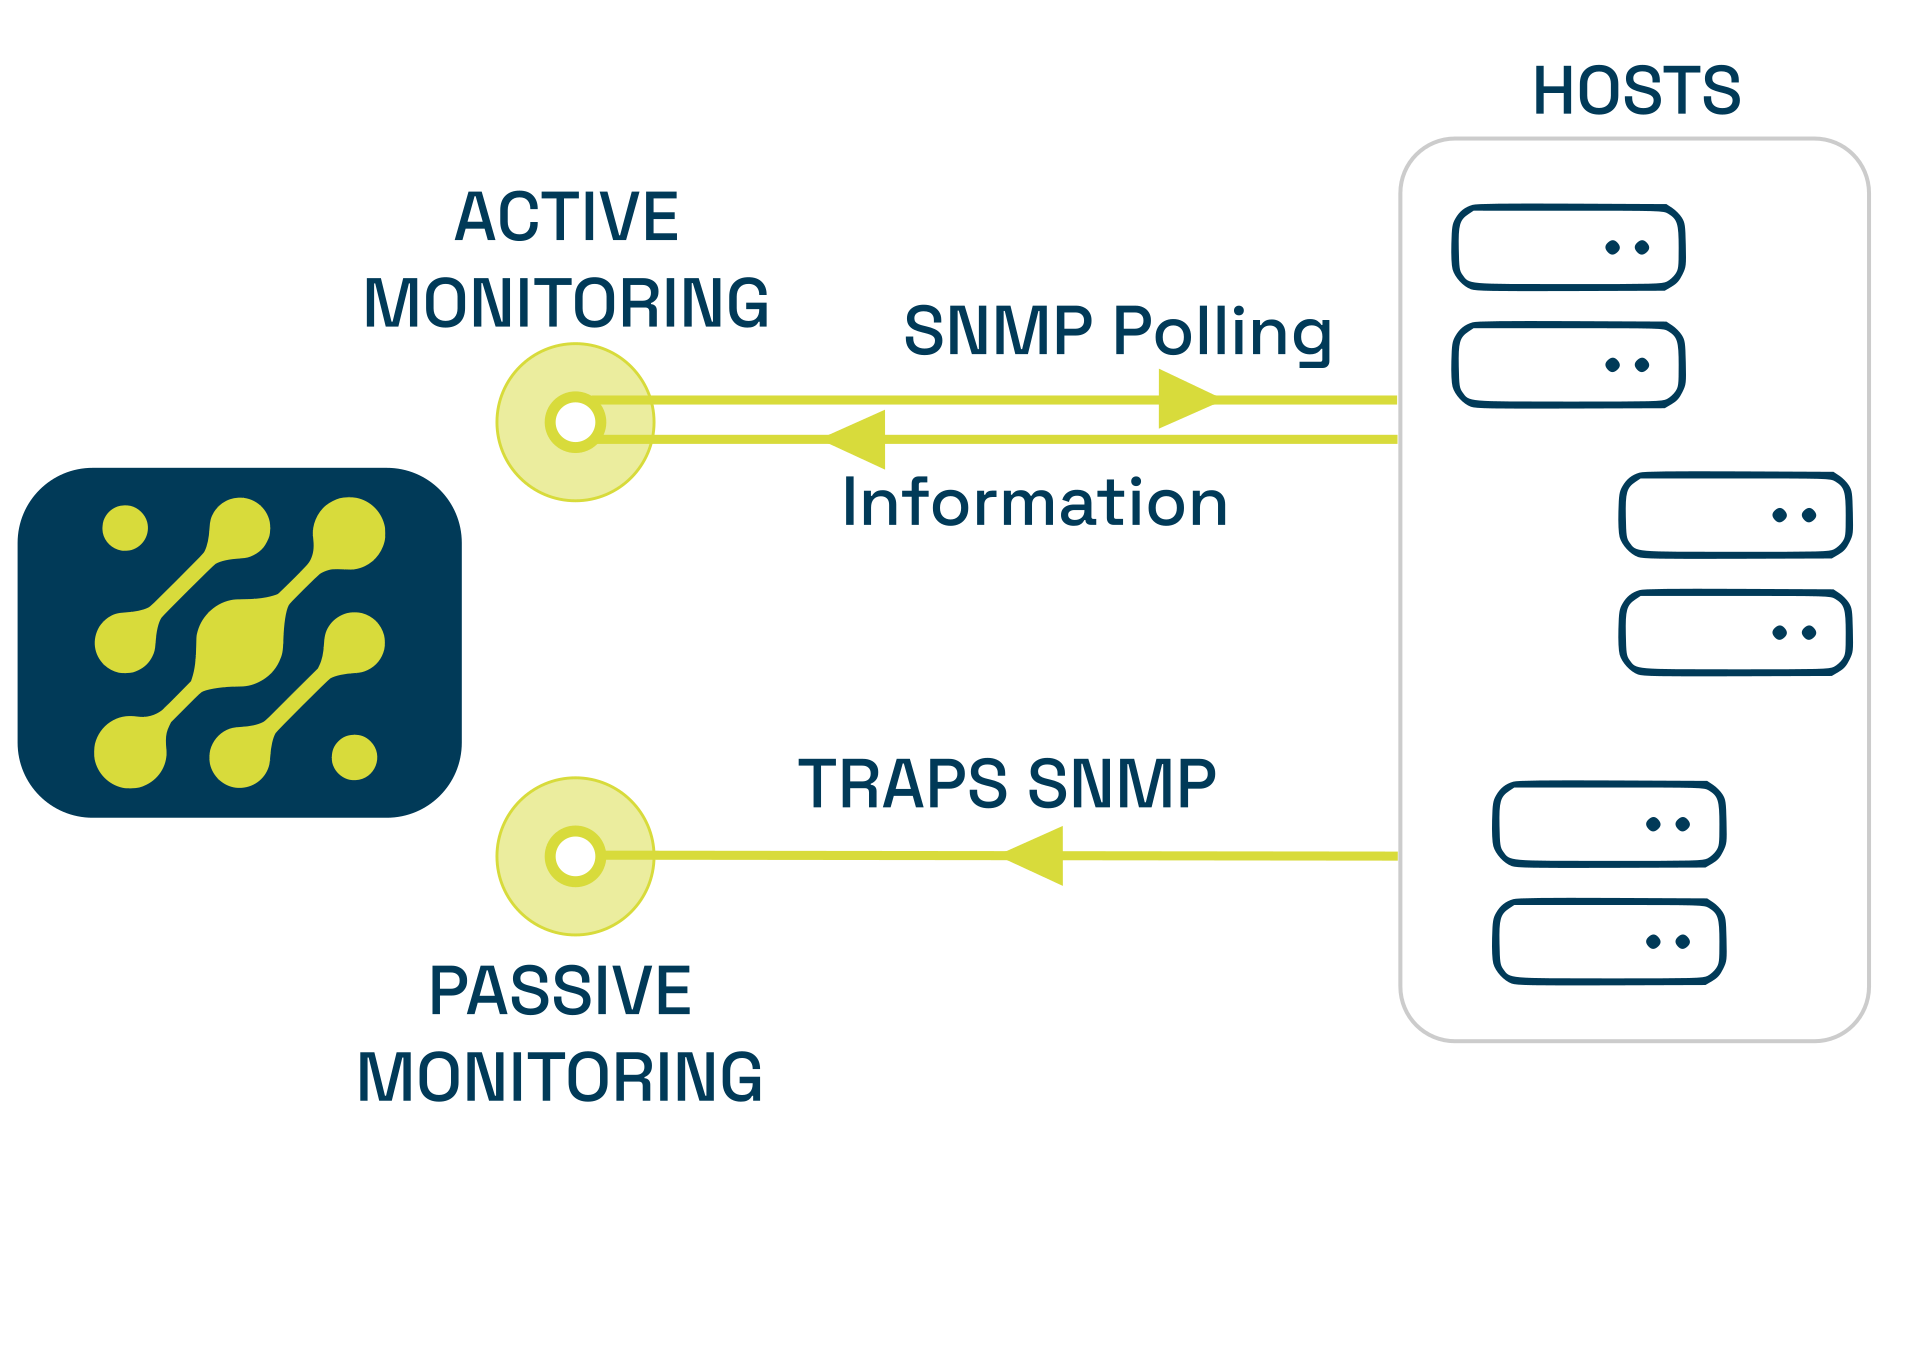
These monitoring methodologies are different, but equally effective. However, WOCU-Monitoring is able to integrate the combined use of them, taking advantage of the benefits of both.
The system has an event indexing backend that is used to receive and ingest events from the passive monitoring world, such as SNMP Traps.

As a new feature, this latest version of WOCU-Monitoring incorporates the new SNMP Traps section, a new instance where the user is able to import, model, and configure new passive monitoring services and link them to network devices to perform their communication function from a passive perspective and without the involvement of any Monitoring Pack.
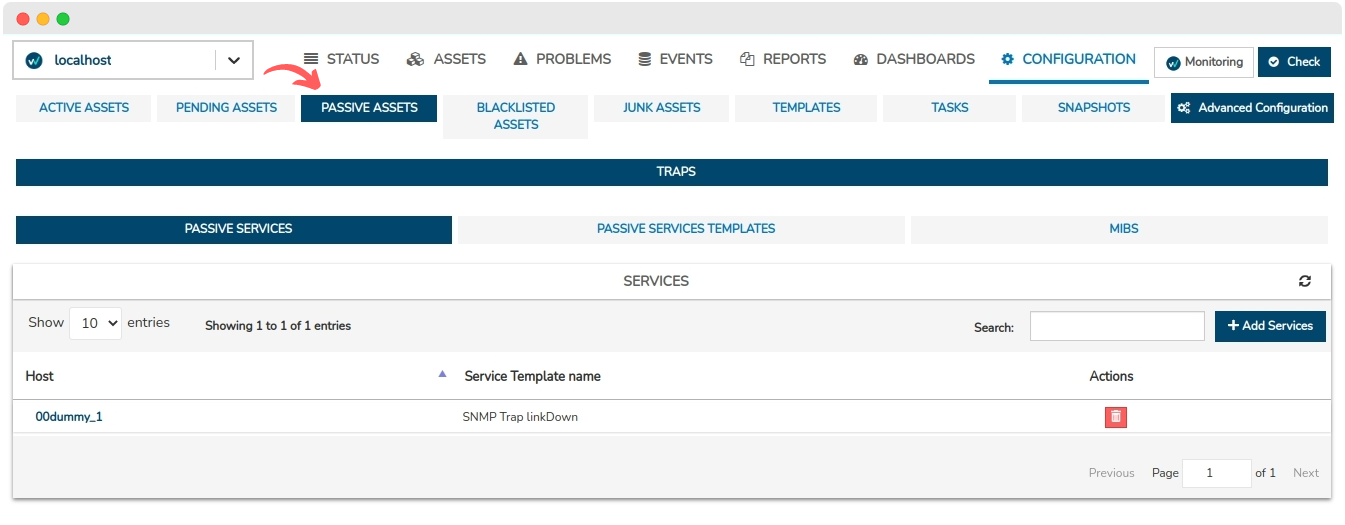
The section SNMP Traps is made up of the followingsubsections:
Trap Services: where Passive Services are linked to Monitored devices and start listening and receiving SNMP
Passive Services Templates: from where new Passive Services are designed and modelled from templates. A template by itself has no value in the system, it must be linked to a device to originate a functionally operational Passive Service.
MIBS: from where MIB files with OIDs (SNMP Traps identifiers) are imported.
With this new functionality, WOCU-Monitoring offers a higher degree of quality assurance by detecting and recording anomalies from two different monitoring methods.
3. Filtering Logs through the bar chart
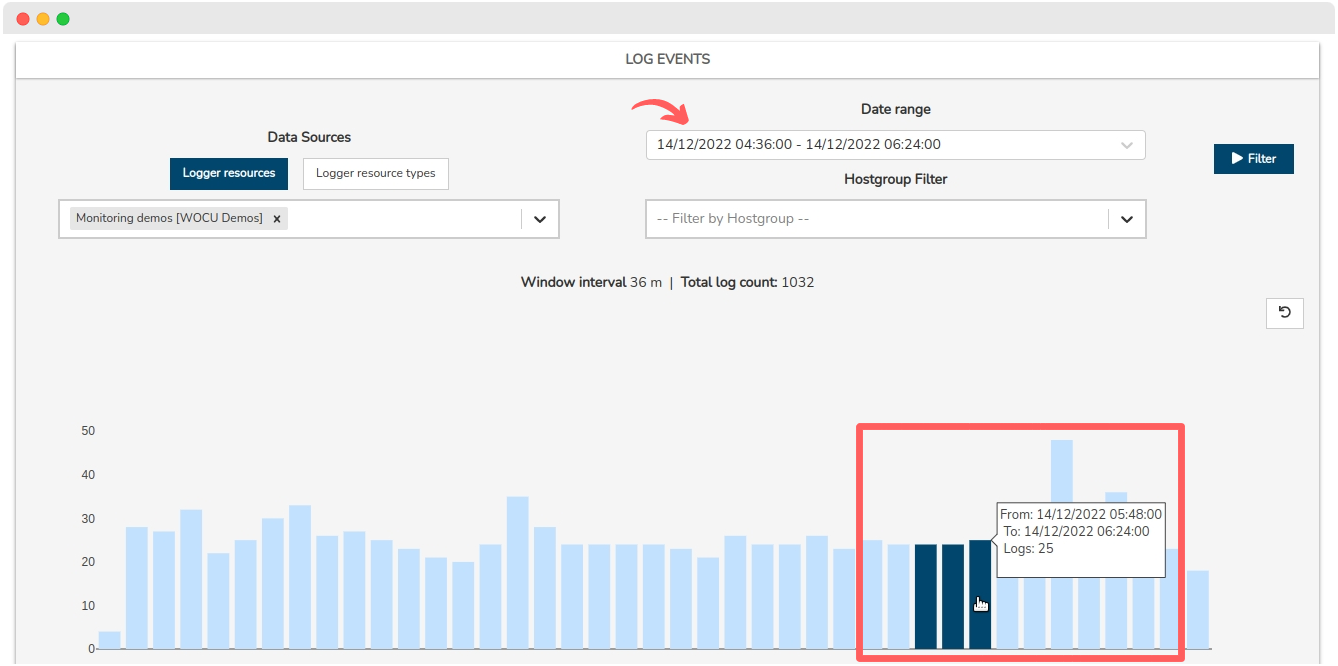
The Other Log Events (Logs) view has been optimised and enhanced by adding a new log filtering option, through user interaction with the Log Event Graph.
The graph is divided into intervals distributed in 40 portions or bars to identify valleys or peaks of events in a very visual way. On the left side of the graph the oldest logs will be displayed and on the right side the most recent ones.
The functions integrated in this version are detailed below:
✓ Filtering of logs by clicking on one or more time bars in the graph
As is well known, hovering the cursor over a given bar displays its summary view, where a specific time range (From/To) and the logs that have been recorded in that period are specified.
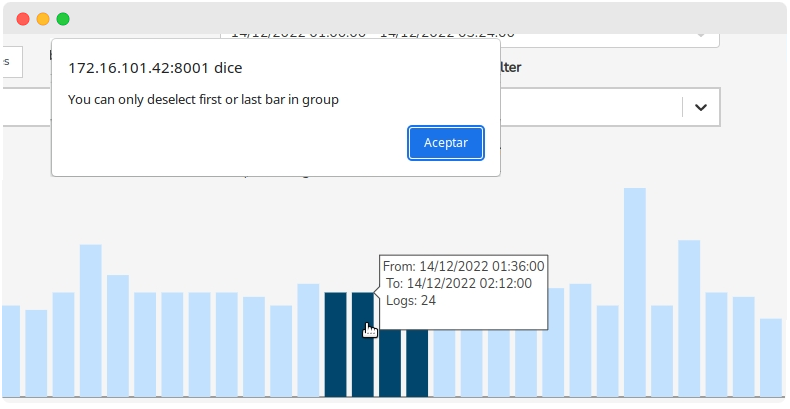
From now on, when clicking on one or more time bars, the Date_range filter will be updated according to the time period comprising the highlighted bar (now highlighted in dark colour). In case two or more consecutive bars are selected, the filter will nest and record the time period between the bars, i.e. the range starts with the time and time of the first bar and ends with the time and time of the last bar.
In addition, to develop this new function it has been necessary to change the library previously used (Recharts >> Plotly) and redo the Log Event Graph.
✓ Inclusion of the reset button.
New reset button to remove the selection set so far. When this action is triggered and the Filter Date Range returns to the default
Last 24 hours. This button will only be enabled when bars are checked.
Important
To consolidate the defined filtering it will be necessary to confirm the action by clicking on the ▶ Filter button.
4. Integration of endpoints of the Public API
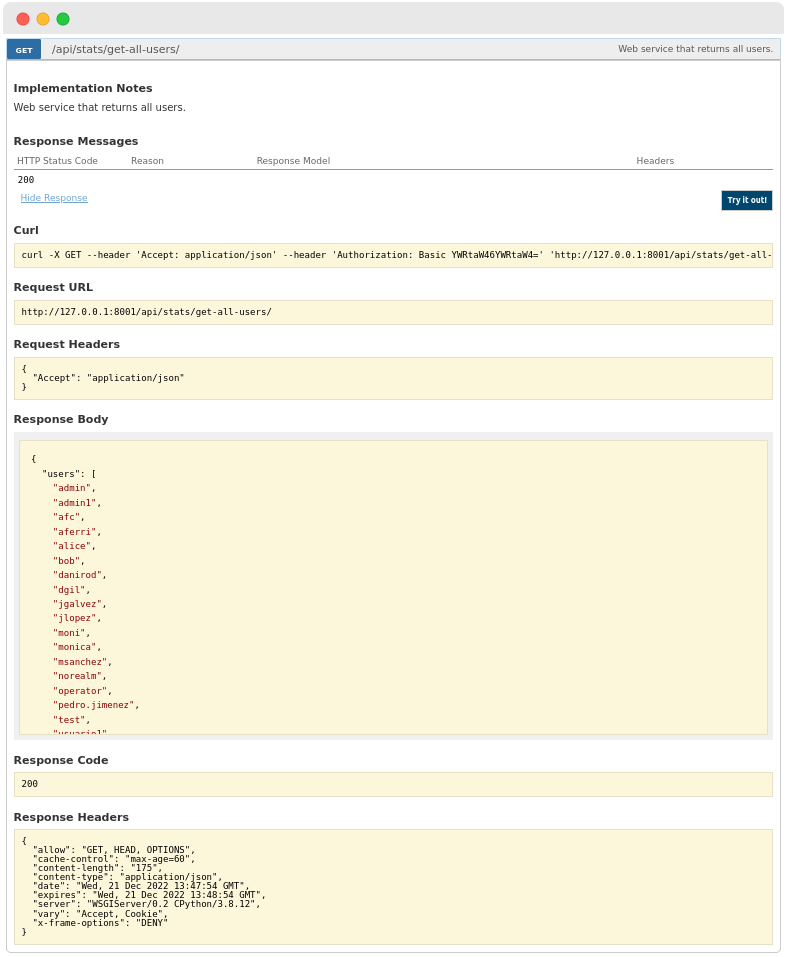
New endpoint for obtaining the list of users managed in the application
The API Public of WOCU-Monitoring has been updated by adding a new endpoint to consult and obtain the complete list of registered users, and therefore, with access to the application.
GET /api/stats/get-all-users/
The result of querying this endpoint could be the following:
New endpoint for deleting unused users
Another new endpoint has been added for the deregistration and deletion of certain obsolete or disused users within the application.
DELETE /api/stats/user/{user_name}/
The result of querying this endpoint could be the following:
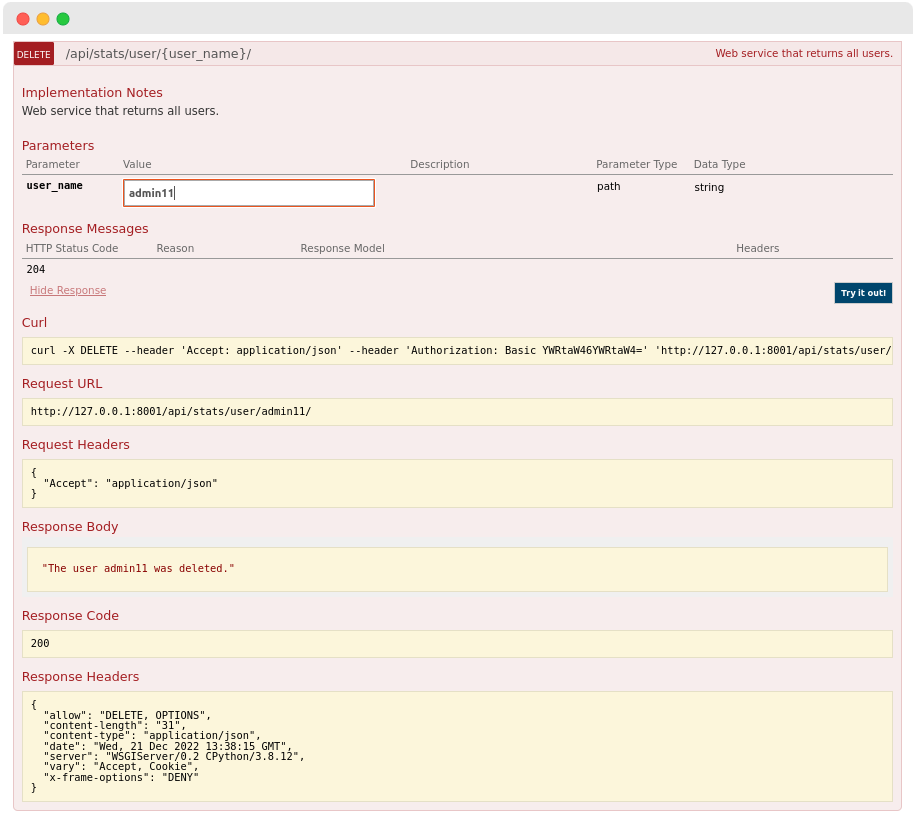
A good practice would be first to obtain the complete list of users managed in the application up to that moment and then to purge obsolete profiles, keeping only valid and current users.
Note
Both endopoints may only be used by Administrators.
5. Different refactorings of the frontend.
✓ The Monitoring Services Detail Modal has undergone several refactorings, including:
✓ Refactoring of the Business Processes Inventory to REACT 7 technology, migrating and renewing all its code. In addition, the option to search for elements in the business rule itself, such as hosts, is integrated.
✓ The View of Detailed information on the device to be discarded expands its content by displaying the same attributes of its Detailed Host Information View in Active Assets, equalising the reporting burden of both spaces.
✓ Removed BETA tag/condition from Services Inventory, as it is now a fully functional and stable space.
✓ Services and Devices filtering functionality is added from the Services and Services by State columns/fields located in the Packs Inventory and Host Groups Inventory.
✓ The display of multi-level data exported in CSV format has been optimised. Following this improvement, the export action supports more complete data structures. For this purpose, the json2csv library has been installed.
6. CSV Report export capability
A new download option for Reports is added to the Reports module. On this occasion, the format is added**CSV** to the Export function available in the Centralized Report Management, along with the rest of the formats already supported previously (JSON and PDF) in the tool.
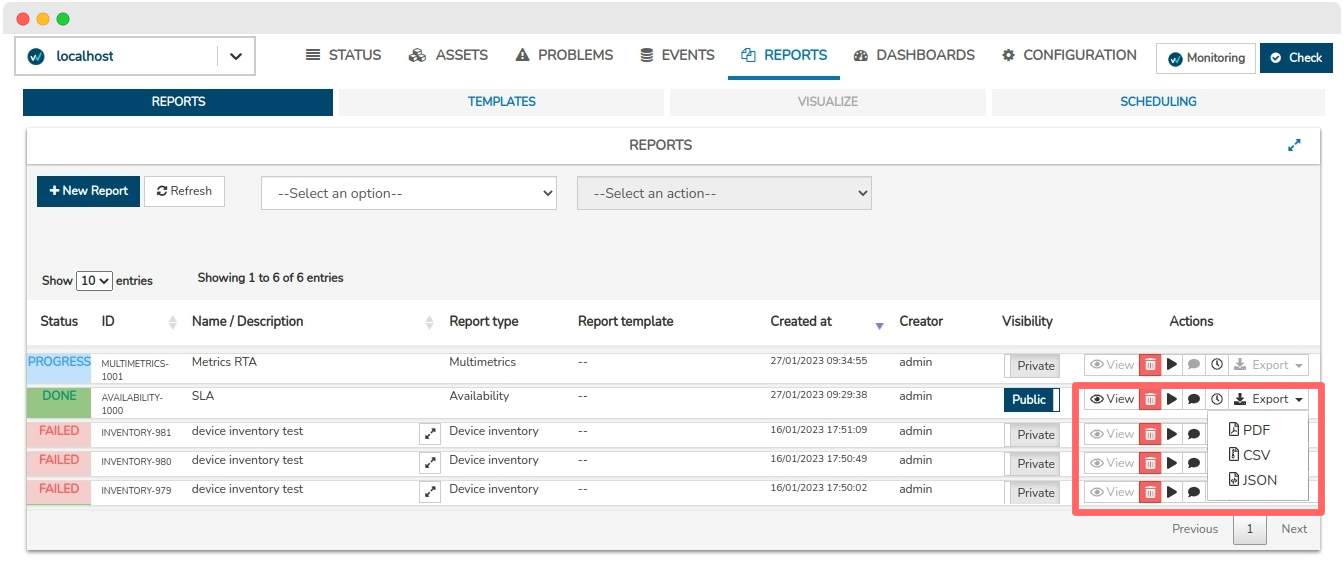
The purpose of this extension is to facilitate the immediate sending of information for further processing, according to the various needs of the user.
7. New SOFT event filtering option in Problems.
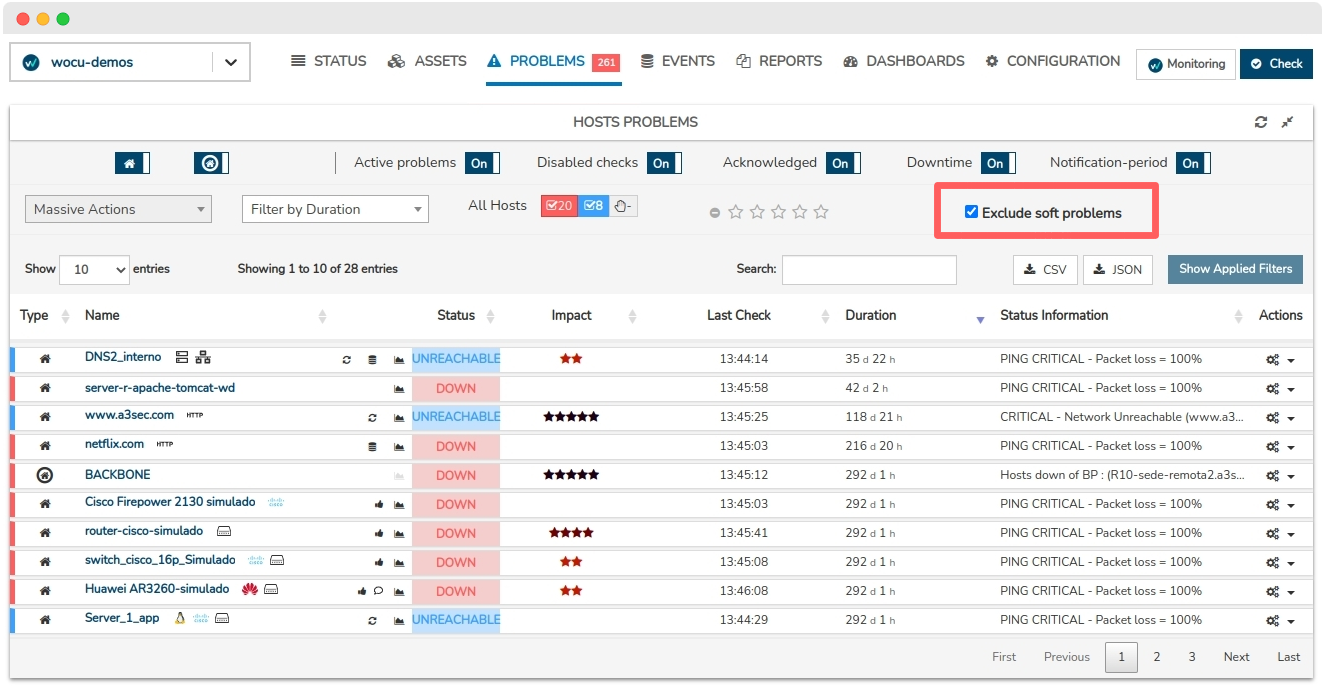
The main table Host Problems displays by default generated alarms of both SOFT and HARD types, sometimes triggering very long and informative listings.
To minimise this possible data saturation during the processing of active alarms, the new filter Exclude soft problems has been incorporated, in order to discriminate and extract all the SOFT type alarm entries from the list, loading and displaying only those of HARD type.
The operation is very simple, by ticking the main box, the listing will automatically load the table with the relevant items.
Remember
SOFT: is assigned when the Service status obtained is not definitive, as it may or may not be reverted in the next check attempt. In the case of exceeding the predefined number of attempts obtaining negative statuses, the error severity level will be raised to HARD type. The objective is to avoid false alarms due to transient problems.
HARD: is assigned when the Service status obtained is erroneous continuously, without being corrected. That is, when the service returns a negative status in the first attempt and also in the subsequent checks, exceeding the number of predefined attempts. This new situation is notified to the contact user.
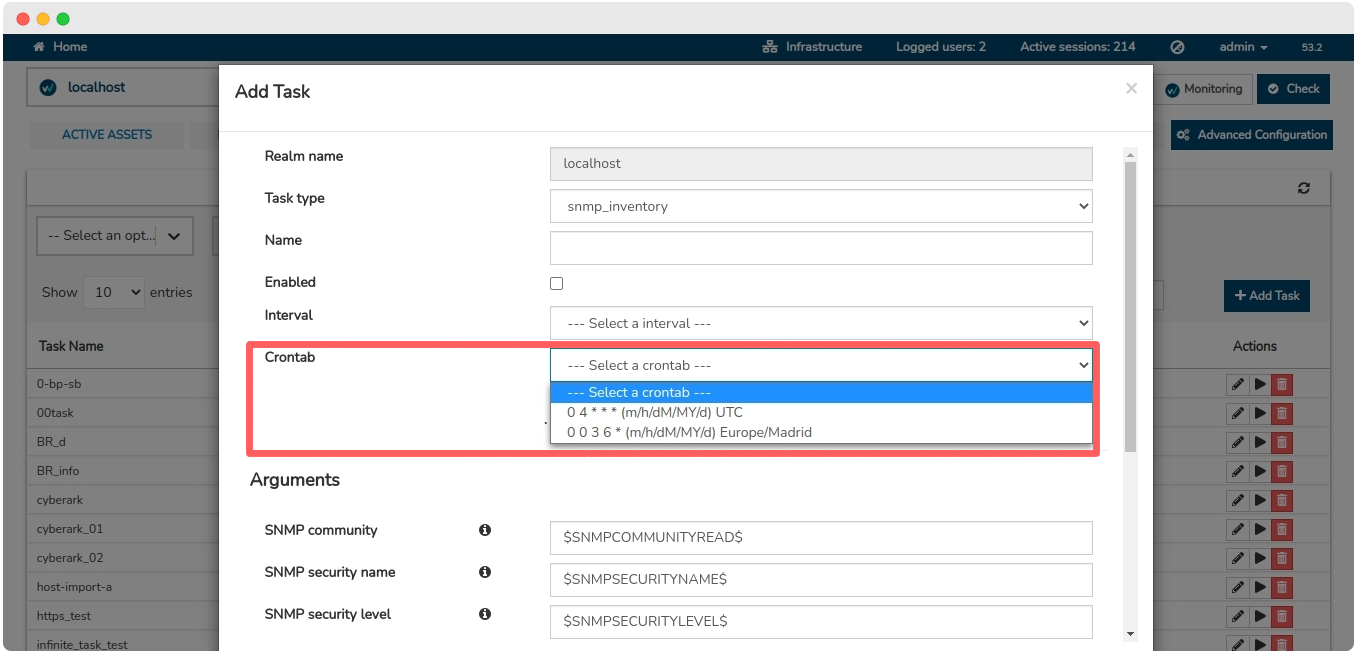
8. Crontab on Asset Import Tasks
The precision capability in the configuration of Import Tasks (Tasks) of WOCU-Monitoring (CSV,SNMP, SCAN, …) is extended by including a periodicity based on Crontab format. That is, in the same way that you can schedule tasks with a Crontab file in Linux, and using the same language, you can schedule the periodicity of these asynchronous tasks.
In this way, greater flexibility is provided for more explicit cases, when indicating the exact time of execution of tasks in the system. Likewise, the restriction to take into account is that from the task creation and edition forms, only one type of periodicity can be added, that is, either of type interval (as it has been established until now), or of type Crontab format. It is not possible to set both formats simultaneously.
9. New chapter on the Extra Module UI-ACL
A new chapter has been added to the WOCU-Monitoring User Manual, dedicated to the additional module UI-ACL.
This section details the process for careful management and administration of users and groups, promoting the separation of privileges and achieving detailed control of the infrastructure.
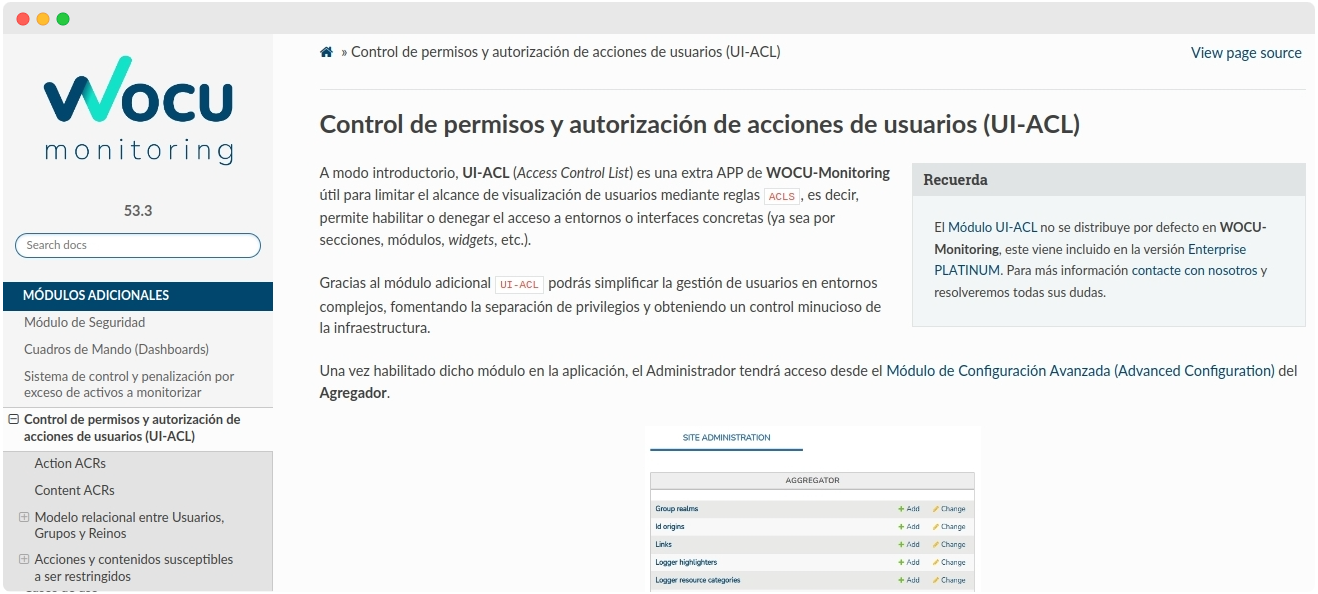
The point Actions and content liable to be restricted where the actions and contents that can be disabled for certain users or groups of users are typified and broken down. Using a tabular format, each restriction option is broken down and linked to the corresponding item within WOCU-Monitoring.
Note
The UI-ACL module is not distributed by default in WOCU-Monitoring, it is included in the Enterprise PLATINUM version. For more information contact us and we will answer all your questions.
10. Migration of Logs Backend to Elasticsearch 7
WOCU-Monitoring uses several backends for event ingestion and monitoring metrics. In the case of Logs (syslog, application logs, monitoring traps, etc.) the powerful Elastic engine is used and in this release it has been updated to its 7.17 version, much more advanced, reliable and with better information management than the previous version.

All new information and indexes are automatically managed with this new version. If there are indexes that you want to migrate from one version of Elasticsearch to another, WOCU-Monitoring has developed a step-by-step migration process to avoid losing any previously stored data.
This is a necessary step that will take advantage of other functionalities, such as the Passive Monitoring and the Audit Module.
11. Integration with Cortex XSOAR
At WOCU-Monitoring we know how important it is not only to detect availability problems in large infrastructures, but also to alert accordingly and in an appropriate manner. We are an ideal tool for monitoring in Network and Security Operation Centres (NOCs and SOCs), where the use of SOAR (Security Orchestration and Automation Response) type tools is becoming more and more widespread.

In this version, integration with one of the most widely used SOARs on the market has been developed: Cortex XSOAR from Palo Alto Networks (formerly Demisto). The possibility of reporting the Events from WOCU-Monitoring as SOAR incidents that can be managed by event correlation and automated responses to other systems is added.
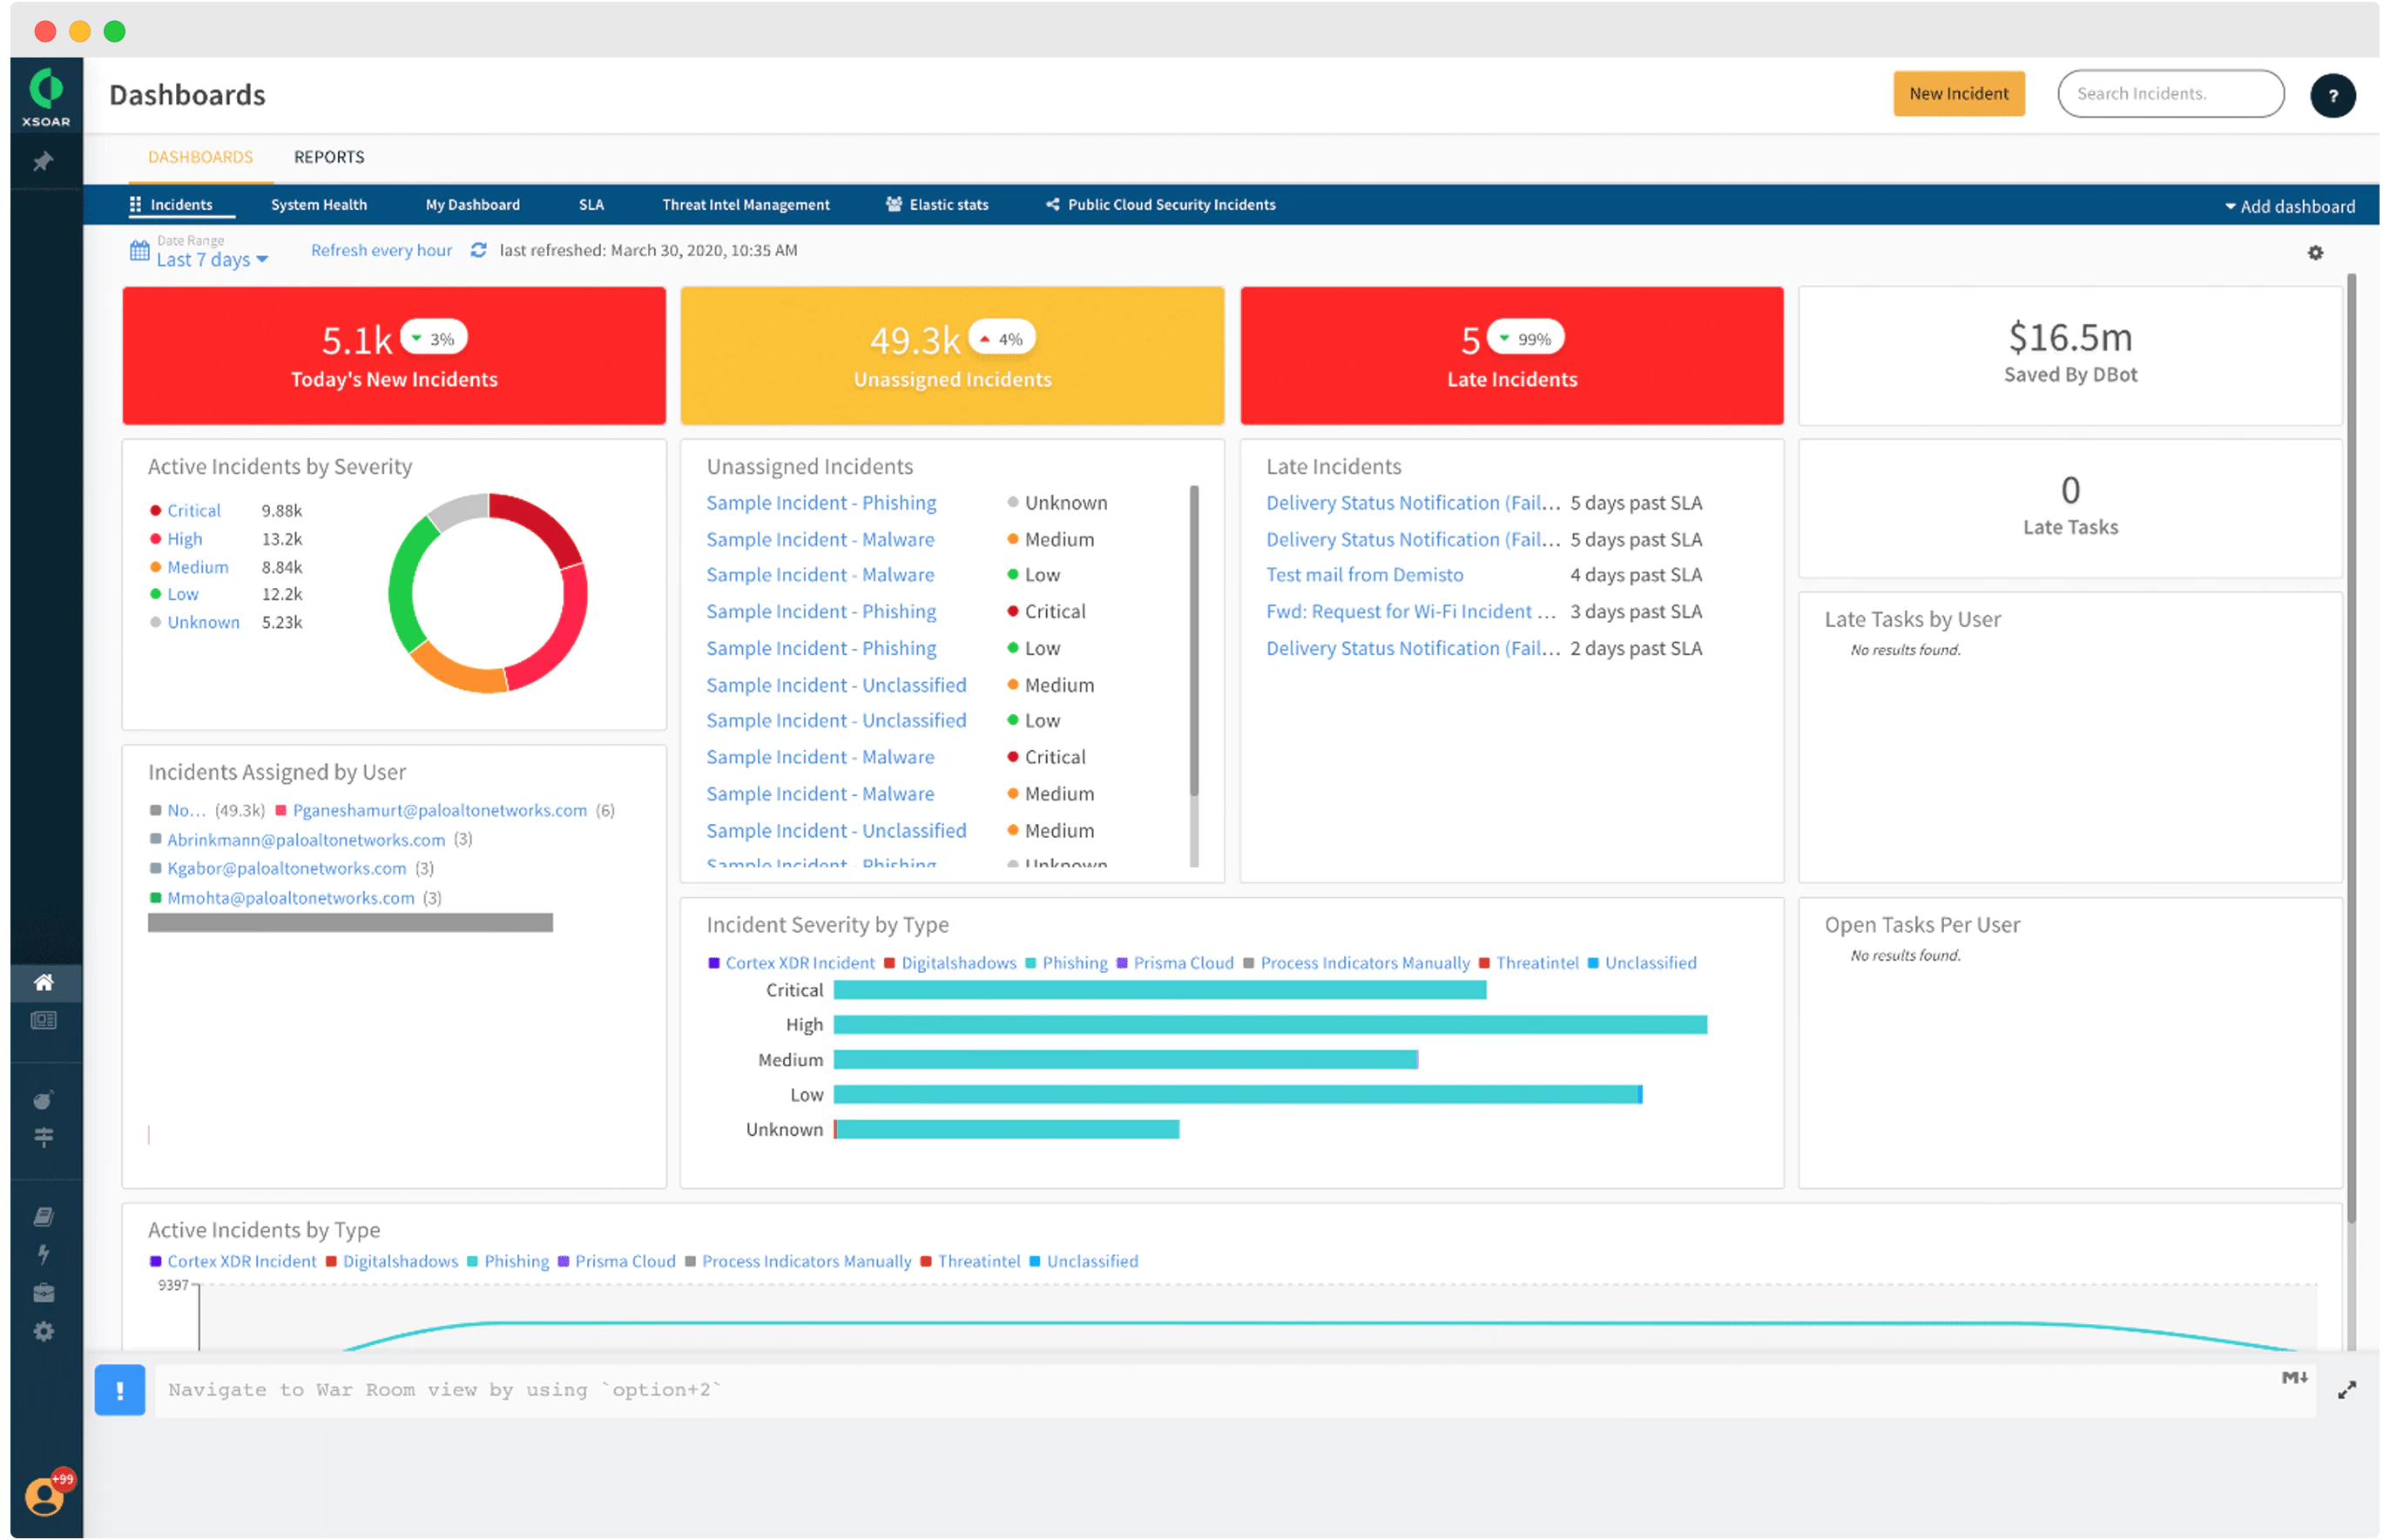
Ultimately, this is one of many methods of integrating WOCU-Monitoring with other notification alerting tools.
12. Multiple selection or by Regex on exclusion of Services
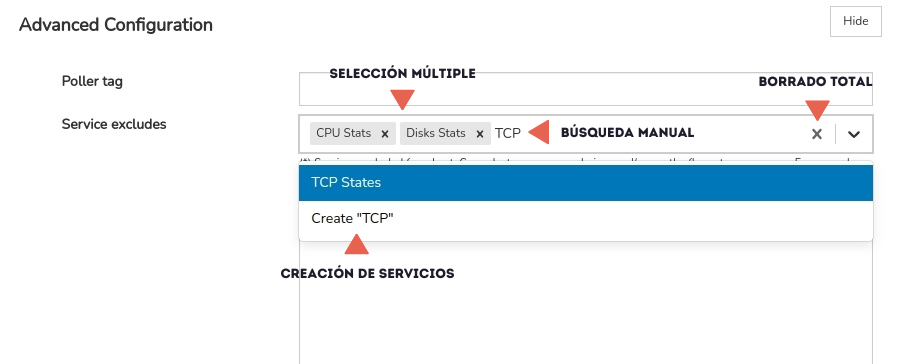
New service configuration methods are added to the Service Excludes field in the Detailed Host Information edit form of the Hosts listing. In particular, new ways of selecting services to be ignored in the asset configuration are added:
Choice of multiple services in the drop-down menu itself (no need to close it).
In addition to the individual deletion of items, there is also the option of a total deletion of the selected items, using the X icon available on the right-hand margin of the selector.
The possibility of searching when adding new services is maintained and, as a new feature, the creation of new services is allowed, thanks to the Create function visible during the specification of the service.
Implementation of regular expressions (Regex), through the use of search patterns that will act as regular expressions. This provides greater flexibility and customisation of filtering.
Other improvements and fixes
Every new version is full of small changes, fixes and optimisations that should be briefly highlighted. We list the most notable ones in this release:
String search capability is extended in the Active Hostgroup and Pending Hostgroup tables, allowing queries to be performed by the Members field.
Fixed a bug that was hiding the Services Inventory when there were no
UI-ACLpermissions on the massive-actions.Fixed a bug where the Modal of a BP Service would not open correctly from the Business Processes Inventory.
Various modifications to the CSV and JSON export action:
Space has been added between the buttons for both functions to improve readability.
Retrieval of permissions via
UI-ACLon such actions.
When logging out while positioned in the BP Host details modal the system redirects the user to the login page.
Fixed a bug that prevented subsections of the Hosts table from updating when clicked on.
Recovery of the mass selection function of items in the Services Inventory when advanced filters were used. In addition, a bug where services previously filtered in the table were not reflected in the downloaded files (CSV and JSON) has been fixed.
The empty brackets in the Event column of the Events section have been removed.
Added a new loading spinner in the Edit Host section.
Fixed a loading error in the Hosts listing, when trying to delete a previously deleted Device. Instead, the application returns an error message informing the user.
The Contacts section is redisplayed regardless of the display permissions applied on the Hosts section.
Several Security Module informational messages have been formatted to improve readability.
Revoke the import action of Snapshots when the necessary permissions are not available.
Unification of styles in the Host Groups Inventory in Multi-realms.
Inclusion of a data loading spinner in the Edit Host view.
The data refresh is retrieved from each of the tables in the subsections of Monitored Assets.
The filtering of Devices by associated Monitoring Packs function in the Services Inventory is working properly again.
Enabled sorting of the Credits column in the Host Business Processes table.
The display state is maintained between the different activities Diagnostic even when the user switches tabs.
Fixed decoding bug that generated some CSV import files, due to UTF-8 variants typically used by Microsoft tools when generating such files.
Buttons for actions that the user does not have permission on in the Configuration Module, will be changed from hidden to disabled, i.e. they will be shown in a dimmed colour to indicate that they are out of use.
Upgraded software
As always, other pieces of software have been incorporated and updated in this new version of WOCU-Monitoring:
Software |
Previous version |
Current version |
Remarks |
|---|---|---|---|
moment |
2.26.0 |
2.29.4 |
|
moment-timezone |
0.5.33 |
0.5.39 |
|
Python |
3.8.14 |
3.8.16 |
|
Pip |
19.1.1 |
22.3.1 |
|
Snmptt |
1.4.2 |
1.5 |
About WOCU-Monitoring
WOCU-Monitoring is a monitoring tool that integrates the latest Open Source technologies for monitoring, visualisation, metrics graphing and log management, providing a wide visibility on the status and availability of network elements, servers, databases and workstations (among others) using customised Monitoring Packs.
In addition, the Enterprise version of WOCU-Monitoring called Enterprise allows deployments of thousands of IP devices, in a distributed environment, with customisations tailored to each customer’s infrastructure.
