Release Notes 75
Publication date: 30/09/2026
This document provides a detailed summary of the new features, functionalities, improvements and fixes included in version 75 of WOCU-Monitoring. This update addresses our users’ requests and suggestions, whilst bringing us into line with current market trends and needs.
1. New MQTT integration for passive monitoring of IoT devices
WOCU-Monitoring now includes a new integration with MQTT, designed for the passive monitoring of devices, particularly in IoT (Internet of Things) environments.
Unlike active monitoring, where WOCU-Monitoring periodically queries the devices, this integration allows the devices themselves to publish metrics or statuses to an MQTT broker. WOCU-Monitoring consumes this information, routes it to the relevant Realm and automatically generates the associated Passive Services.
This new capability makes it easier to integrate devices and data sources that use MQTT, without the need for a specific monitoring pack.
This new feature also introduces:
A new MQTT configuration section in the advanced settings for the <mqtt_conf_realm> realm, where the credentials for accessing the broker and the
MQTT Site IDare defined.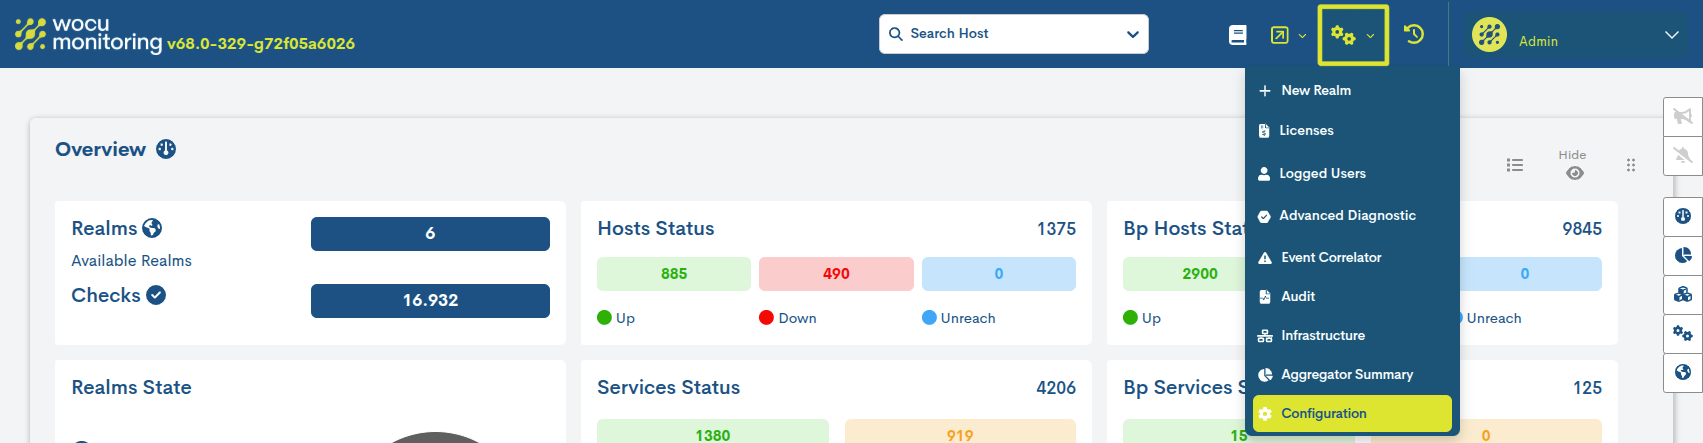
Imagen 1: Acceso a la configuración avanzada del Reino para la integración MQTT.
The new View MQTT Thresholds, which centralises the services generated via MQTT and from which the Warning and Critical thresholds for each service can be configured individually, with support for Nagios range syntax.
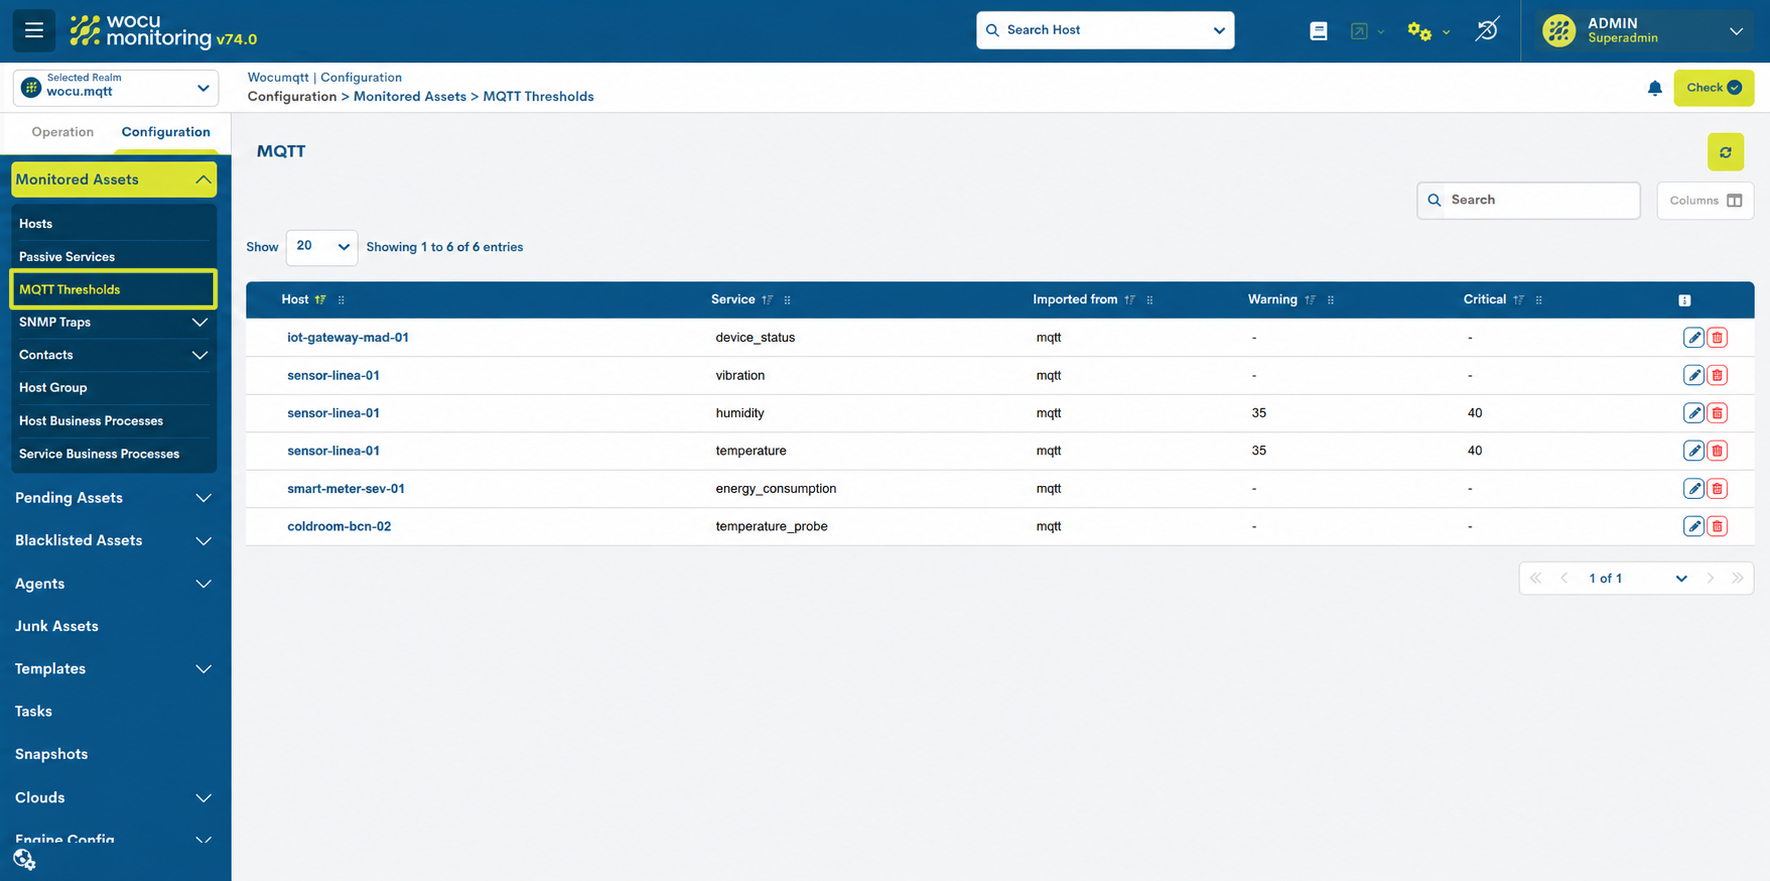
Imagen 2: Vista MQTT Thresholds para la configuración de umbrales Warning y Critical de los servicios MQTT.
Integration of MQTT services into the same state model as the other elements monitored by WOCU-Monitoring, ensuring that any change in status is automatically reflected in the Hosts and Services monitoring views, such as Hosts Inventory.

Imagen 3: Visualización de un servicio MQTT integrado en el inventario de Hosts.
2. New capabilities in event correlation rules
Configuring the DOWN state timeout in correlation rules
The new field Max duration in minutes/hours has been added to the Creating and configuring rules form for event correlation.
This option allows you to set the maximum length of time a device can remain in a hard-DOWN state whilst still being considered as affected by the rule. Once the configured interval has elapsed, the device is excluded from the correlation calculation.
This enhancement complements the Duration in minutes/hours parameter, allowing you to set a minimum and maximum time range to determine which devices should be taken into account when evaluating the rule.
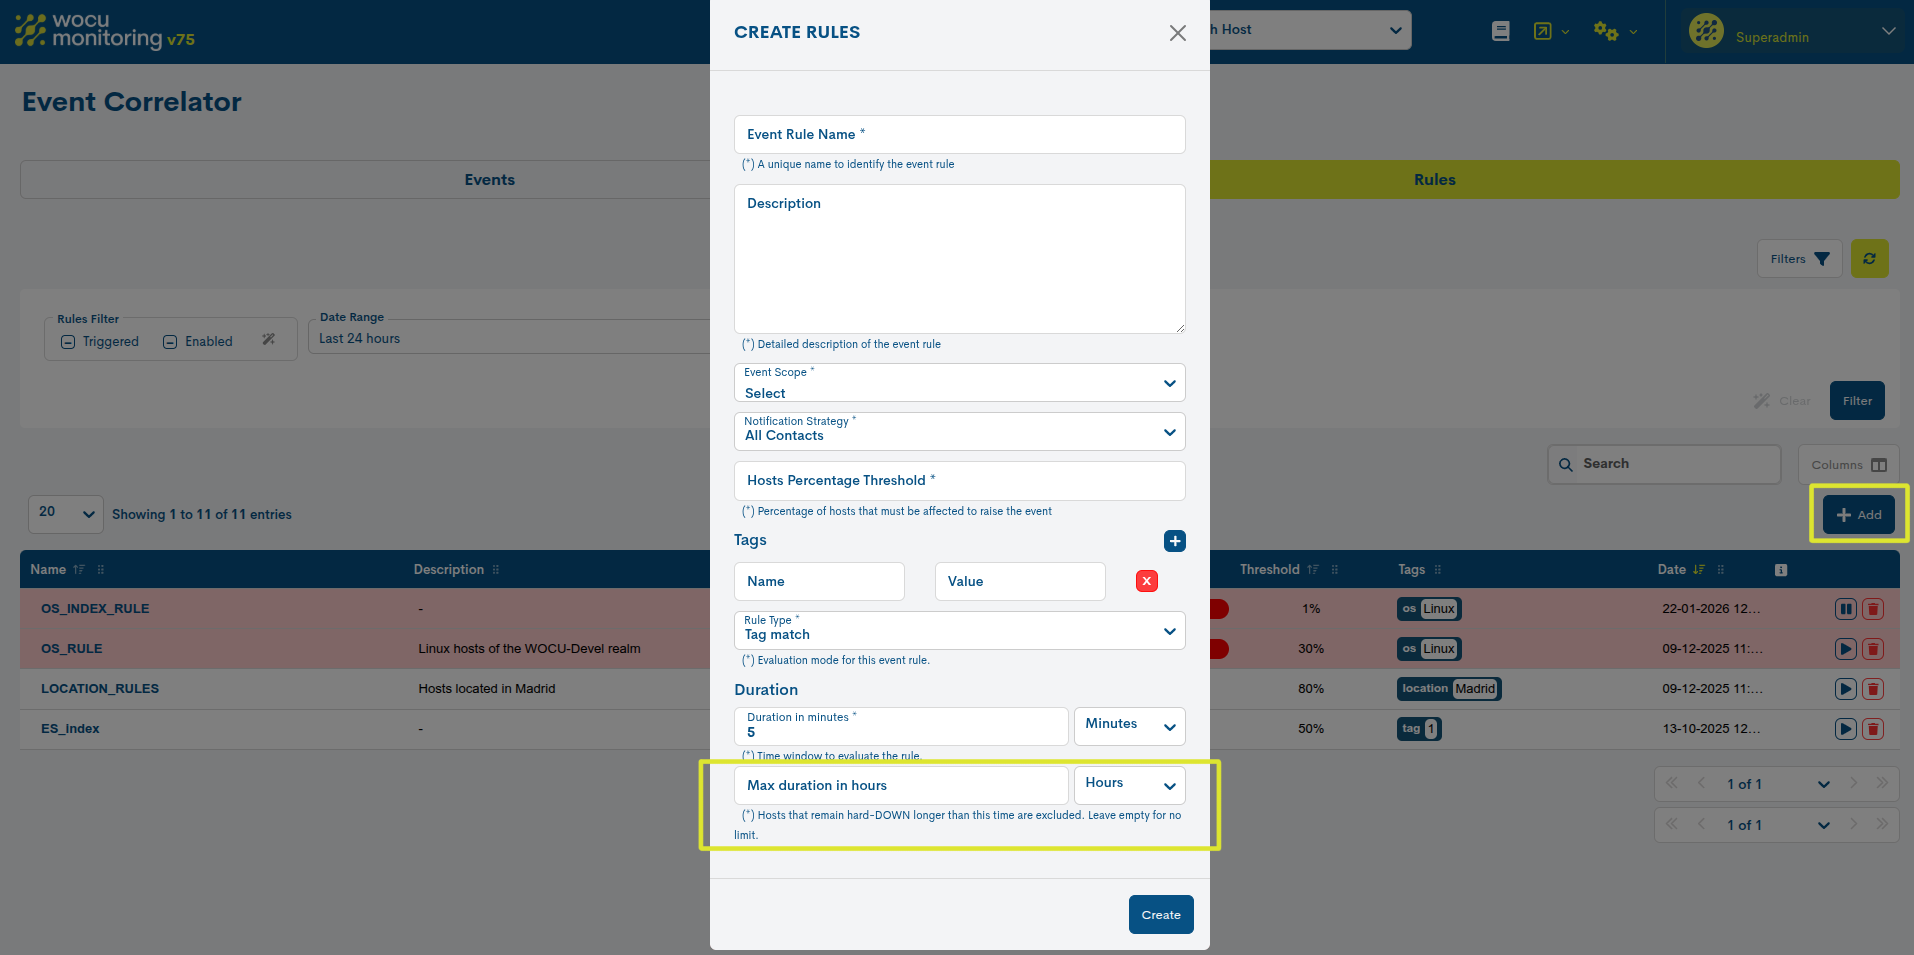
Imagen 4: Configuración de la duración máxima en una regla de correlación de eventos.
New Tag Aggregation option in correlation rules
The new Tag Aggregation rule type has been added to the Creating and configuring rules event correlation form.
This feature allows you to define a tag key pattern using the new Tag Key Pattern field. WOCU-Monitoring identifies all tags that match this pattern, groups the devices according to their values, and evaluates each group independently.
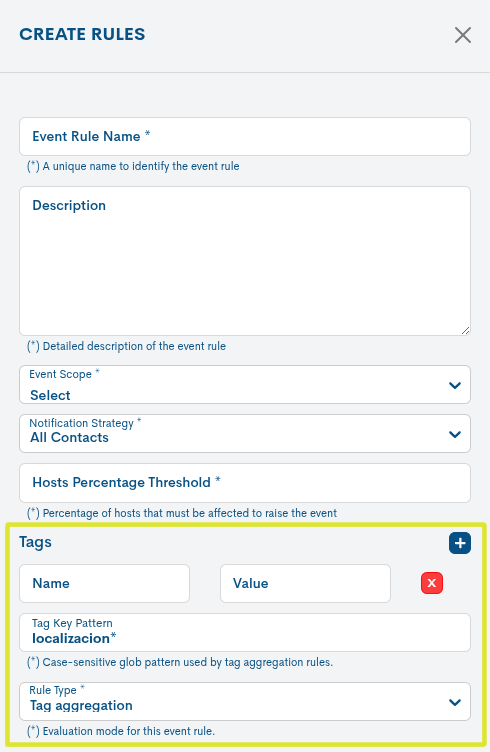
Imagen 5: Configuración de un patrón de agregación en una regla de correlación de eventos.
For example, suppose the following devices have these tags:
Host |
Label |
Amount |
|---|---|---|
host one |
Location 0 |
Madrid |
host_2 |
Location 1 |
Madrid |
host_3 |
Location 0 |
Barcelona |
host_4 |
test location |
Valencia |
If the pattern location* is configured in Tag Key Pattern, WOCU-Monitoring will identify all keys beginning with location and automatically generate three correlation groups based on their values:
Madrid: host_1 and host_2.
Barcelona: host_3.
Valencia: host_4.
Although the devices may use different keys (location_0, location_1 or location_test), those that share the same value will be included in the same group.
Each group is then assessed independently according to the conditions set out in the rule. For example, if a Hosts Percentage Threshold of 50 per cent is set, when one of the two devices in the Madrid group is affected, the 50 per cent threshold will be reached and the corresponding correlation event will be generated.
In short, this improvement makes it possible to define more flexible and reusable rules, which are automatically adapted to the existing values in the tags, thereby reducing the need to create separate rules for each specific location, group or category.
3. New Root Cause Analysis (RCA) initiative
The new Action Root Cause Analysis (RCA) action has been added to the Hosts and Services tables, designed to facilitate the diagnosis of incidents using the WOCU-Monitoring AI Assistant.
This feature performs an automatic root cause analysis, collecting and correlating the information available for the host from the various observability sources within the Realm:
Metrics
Monitoring
Syslogs
Traps
Unlike Action Ask IA about a problem, which focuses on analysing a specific problem, Root Cause Analysis cross-references information from the various available sources to identify possible links between events and determine the most likely cause of the incident.
To run the analysis, go to the Host or Service actions menu and select Root Cause Analysis.
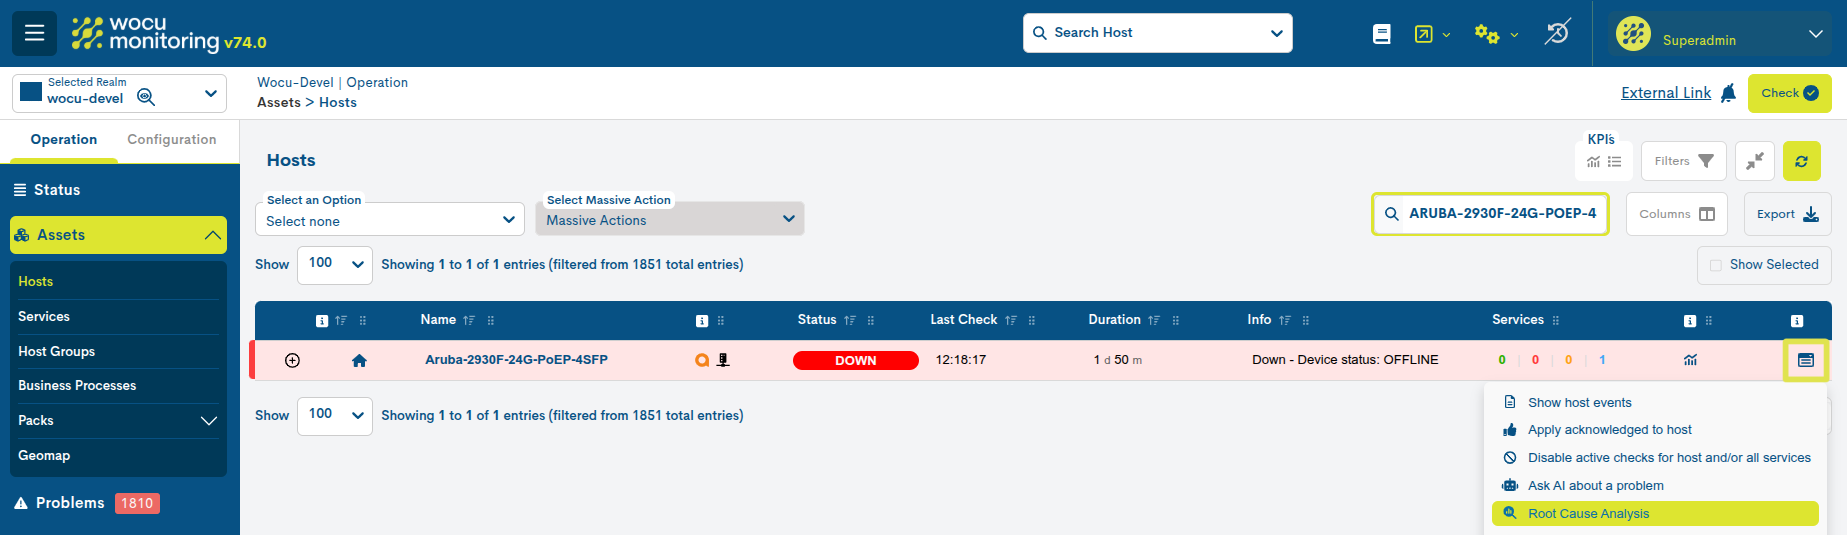
Figure 6: Root Cause Analysis action on a specific host.
Clicking on the action will open a diagnostic window showing the result of the analysis generated by the AI Assistant.
The report may include, amongst other information:
A summary of the problem identified.
The timeline of related events.
The possible causal chain of the incident.
Information used to draw up the assessment.
Recommended actions or checks to continue the investigation.
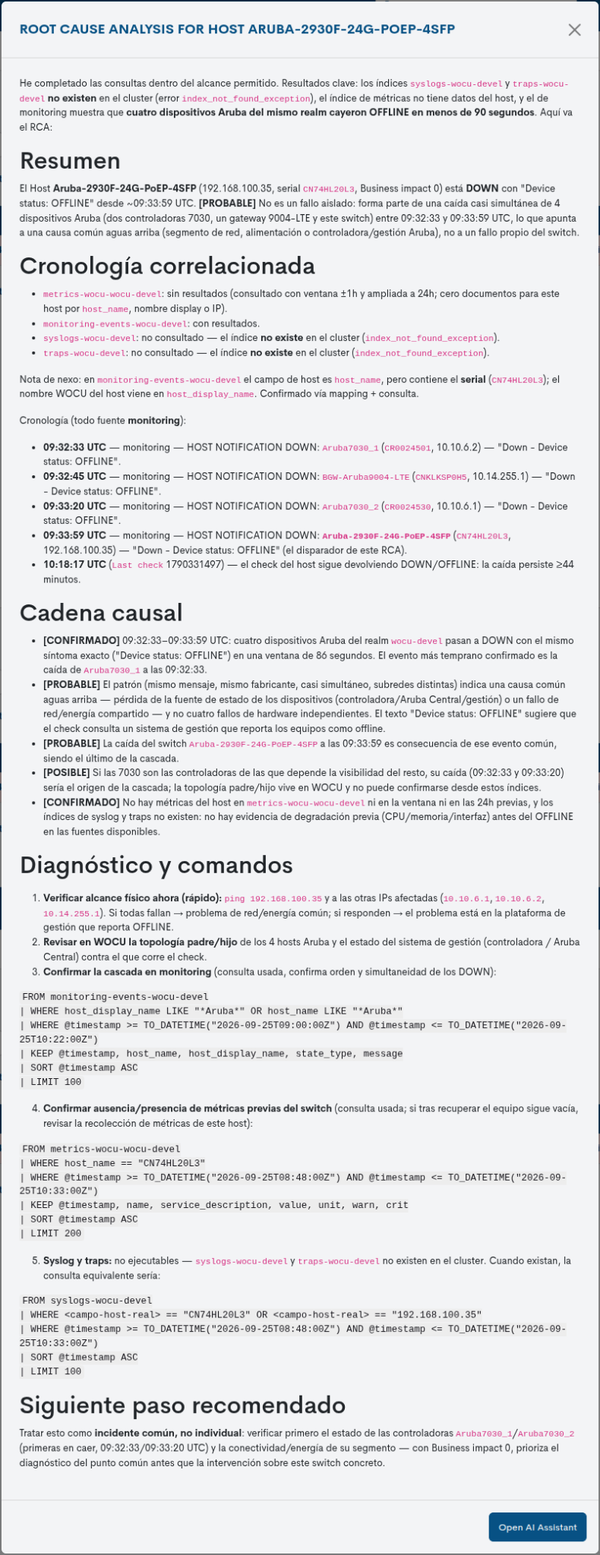
Figure 7: Response following the execution of the Root Cause Analysis action on a specific host.
The analysis always treats the device in question as the primary correlation point. When an action is carried out from a Service, events from the associated device are also analysed, and information relating to that Service is prioritised where it can be identified in the retrieved data.
Furthermore, from the results window itself, you can select Open AI Assistant to continue the analysis by having a conversation with the AI Assistant and asking further questions about the diagnosis provided.
Important
This feature requires the Realm to have a Elasticsearch backend and the Observability correctly configured.
4. Forecasts in metrics widgets and export to PDF
The Forecast functionality has been expanded to include new options for viewing and exporting predictive data.
On the one hand, Single Metrics Graph widgets now include a new Enable Forecast tick box within their configuration form. When enabled, the graph incorporates a forecast of the future trend for the selected metric, displayed separately from the historical data. As Forecast mode operates on a single time series, enabling it restricts the widget’s selection to a single data series.
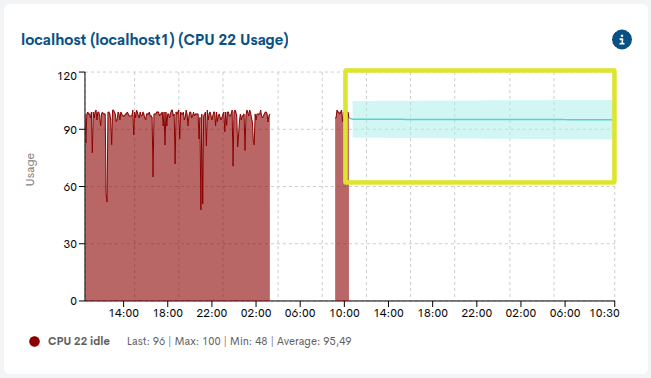
Figure 8: Display of the Forecast applied to a metrics widget.
Furthermore, the PDF export option available in the Metrics section of the Device details view has been improved. When the Forecast function is enabled, the graph included in the exported document will also show the future estimate of the metric, alongside the historical data and the rest of the information displayed.
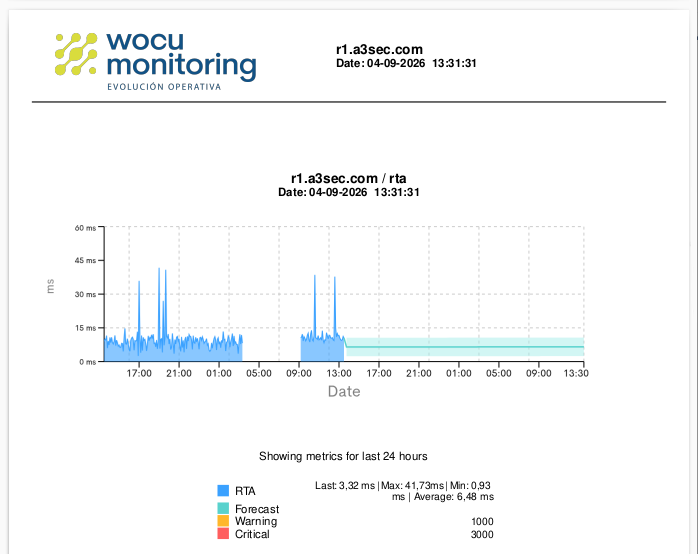
Figure 9: Exporting a metrics chart to PDF with Forecast enabled.
These improvements enable the predictive capabilities of Forecast to be integrated into both customised dashboards and exported reports, facilitating analysis, the anticipation of trends and the viewing of projected trends in the monitored metrics.
5. New integrations in Anomalies
New Anomalies view in Observability
The new view Anomalies has been added to the Observability, which centralises all anomalies detected in the selected country over the last 24 hours in a single table.
The view provides detailed information on each anomaly, including the date and time, score, host, service, metric, current value, typical value and deviation level. This information enables the rapid detection of unusual behaviour, prioritisation of the most significant anomalies according to their score, streamlining of incident analysis, and provision of a centralised view of deviations detected across the whole of the Realm.
In addition, the following is included for incident management:
Time range filter, with predefined periods and custom selection.
Filter by Score, to filter anomalies according to their level of significance. The score, which ranges from 0 to 100, quantifies the extent to which the observed value deviates from expected behaviour. The higher the score, the greater the significance of the anomaly.
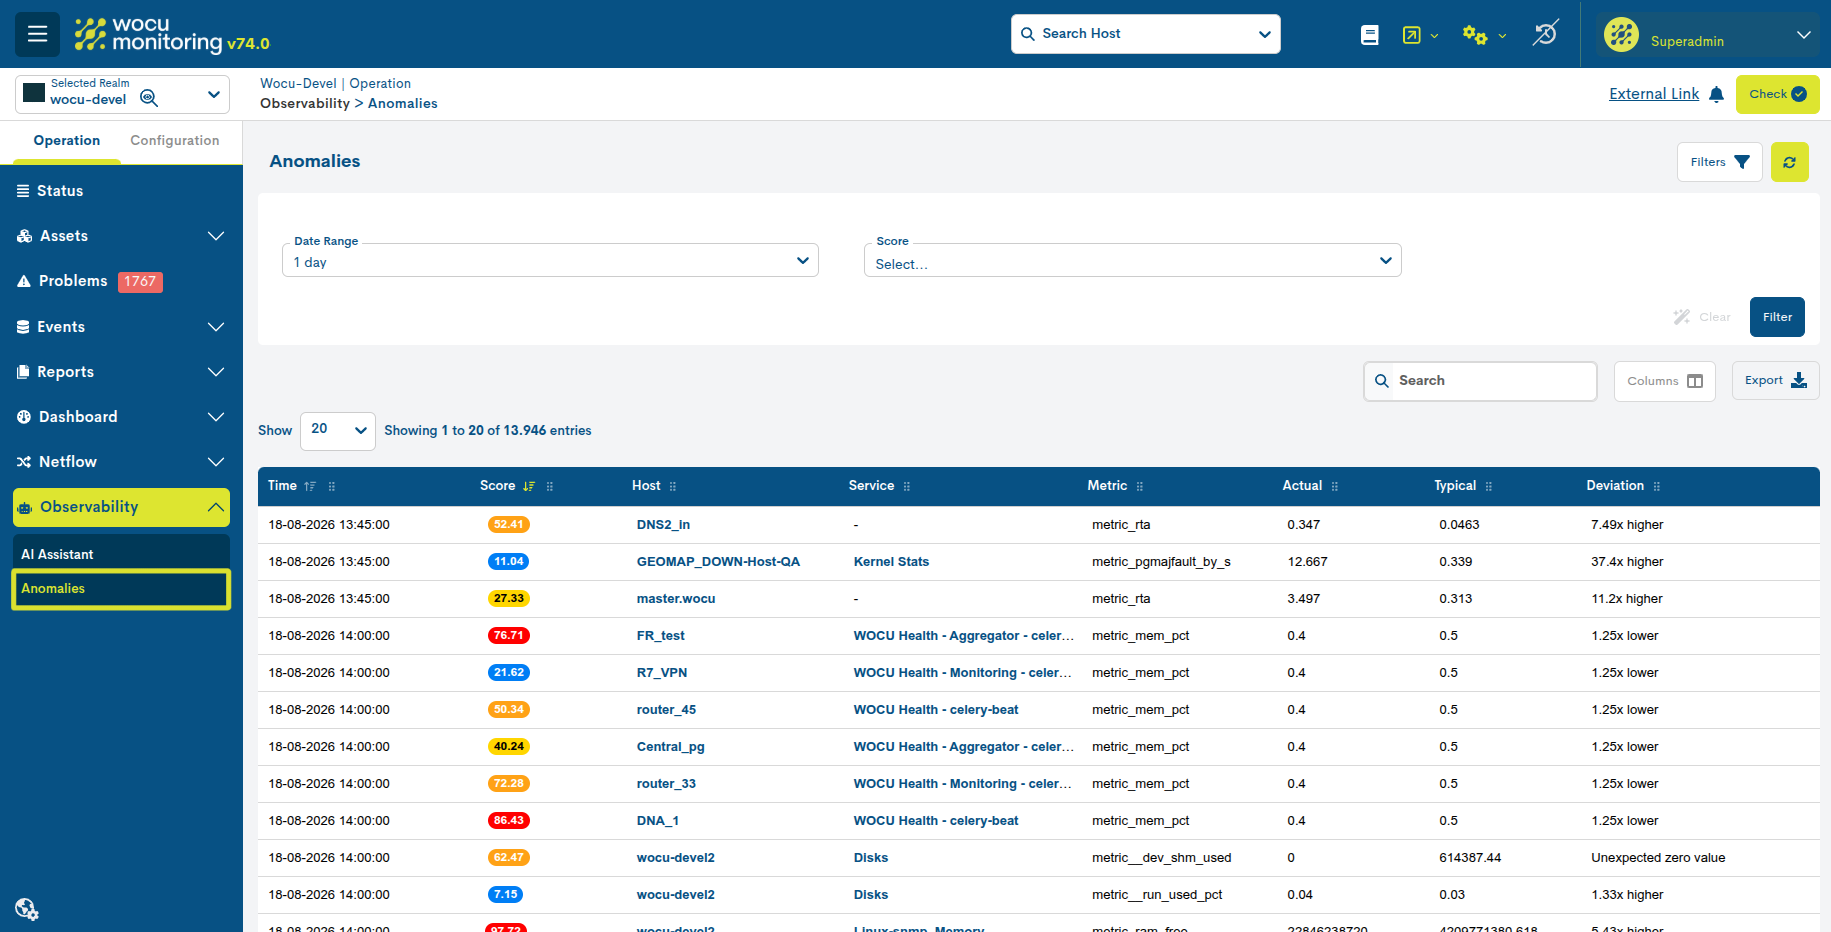
Figure 10. Overview of Anomalies in Observability, with filters by time range and score.
New Deviation column in the anomalies table
A new column, Deviation, has been added to the Device-level anomalies table, providing further context to enable a quick assessment of the magnitude of the detected deviations and to facilitate their operational analysis.
This new field makes it easier to interpret the anomalies detected by directly showing the difference between the actual value recorded (Actual) and the expected value (Typical). As well as indicating the extent of the deviation, it allows you to identify whether the observed value is above or below the usual behaviour.
For example, a value such as 3.42x higher indicates that the recorded value is approximately 3.42 times higher than the expected value.
The new Deviation column complements the information provided by Score. Whilst Score expresses the significance of the anomaly using a standardised score, Deviation provides a more intuitive indication of how far the observed value has deviated from its expected behaviour.
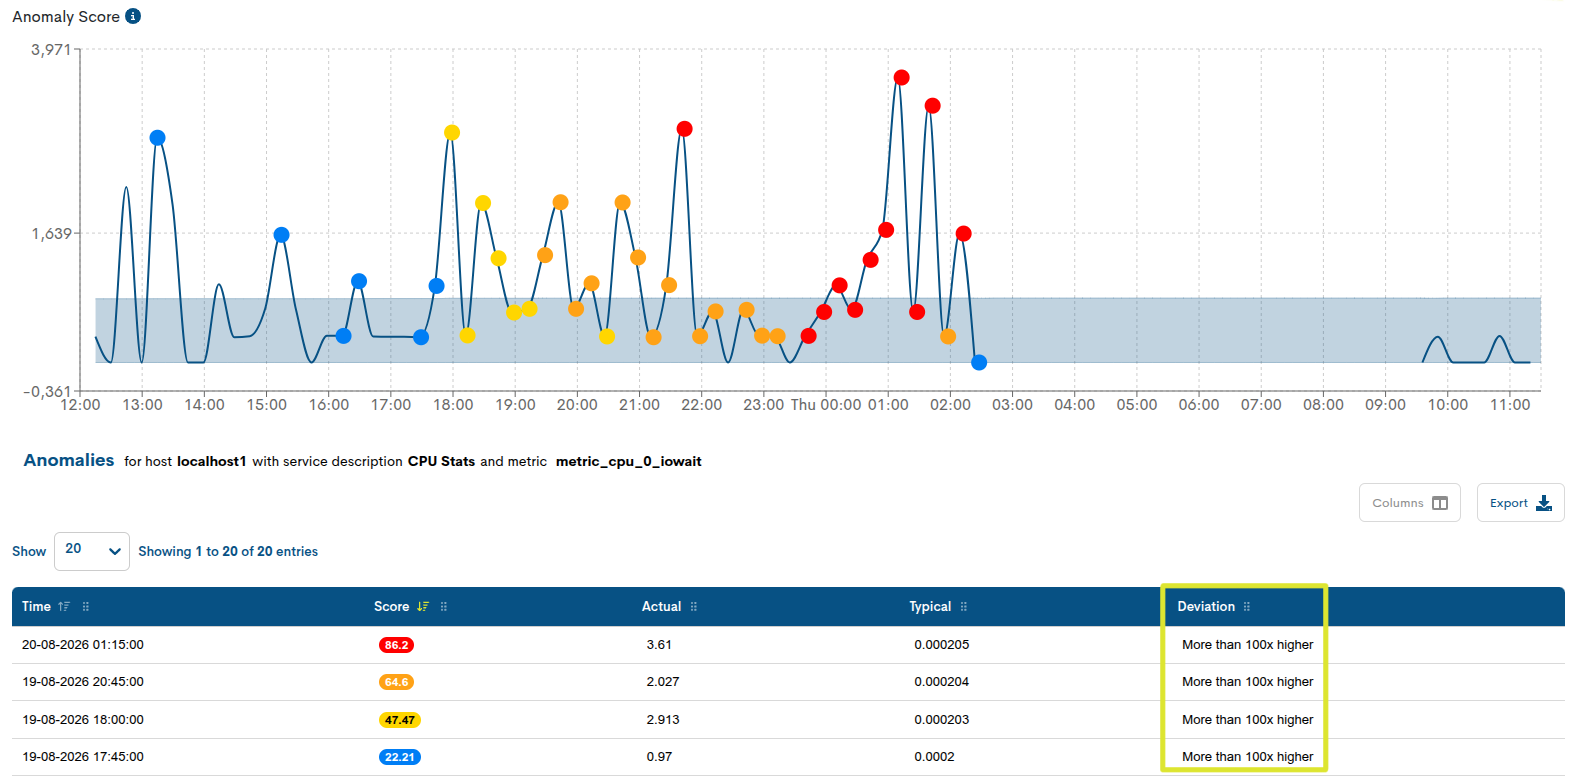
Imagen 11. Vista de anomalías a nivel de Dispositivo con la nueva columna Deviation.
New Score filter in the Hosts anomalies view
A new Score filter has been added to the Anomalies view for Hosts, designed to make it easier to identify and analyse anomalies according to their level of relevance.
The Score, which ranges from 0 to 100, quantifies the extent to which the observed value deviates from the expected behaviour. The higher the Score, the greater the significance of the anomaly.

Figure 12. View of the Score filter applied to a host’s anomaly analysis.
To make filtering easier, the results are grouped into four ranges:
5–25: low anomaly. The value shows a slight deviation from what is expected.
25–50: moderate anomaly. The deviation is starting to become significant.
50–75: high anomaly. The observed behaviour clearly deviates from the expected pattern.
75–100: very high anomaly. This represents the most significant or unusual deviations.
In this way, the user can narrow down the results and focus the analysis on those anomalies that exhibit a certain level of significance within the selected Service, Metric and time interval.
With this enhancement, the host anomalies view now includes more advanced filtering capabilities, enabling the most significant deviations to be identified and prioritised more quickly.
Anomaly overview available at service level
The Anomalies view has been expanded and is now also available for a specific service, allowing you to analyse the anomalies associated with its metrics directly.
With this enhancement, anomaly analysis is now available across the three main levels of WOCU-Monitoring: Realm, Host and Service, enabling more precise navigation from an overview down to the details of a specific service.
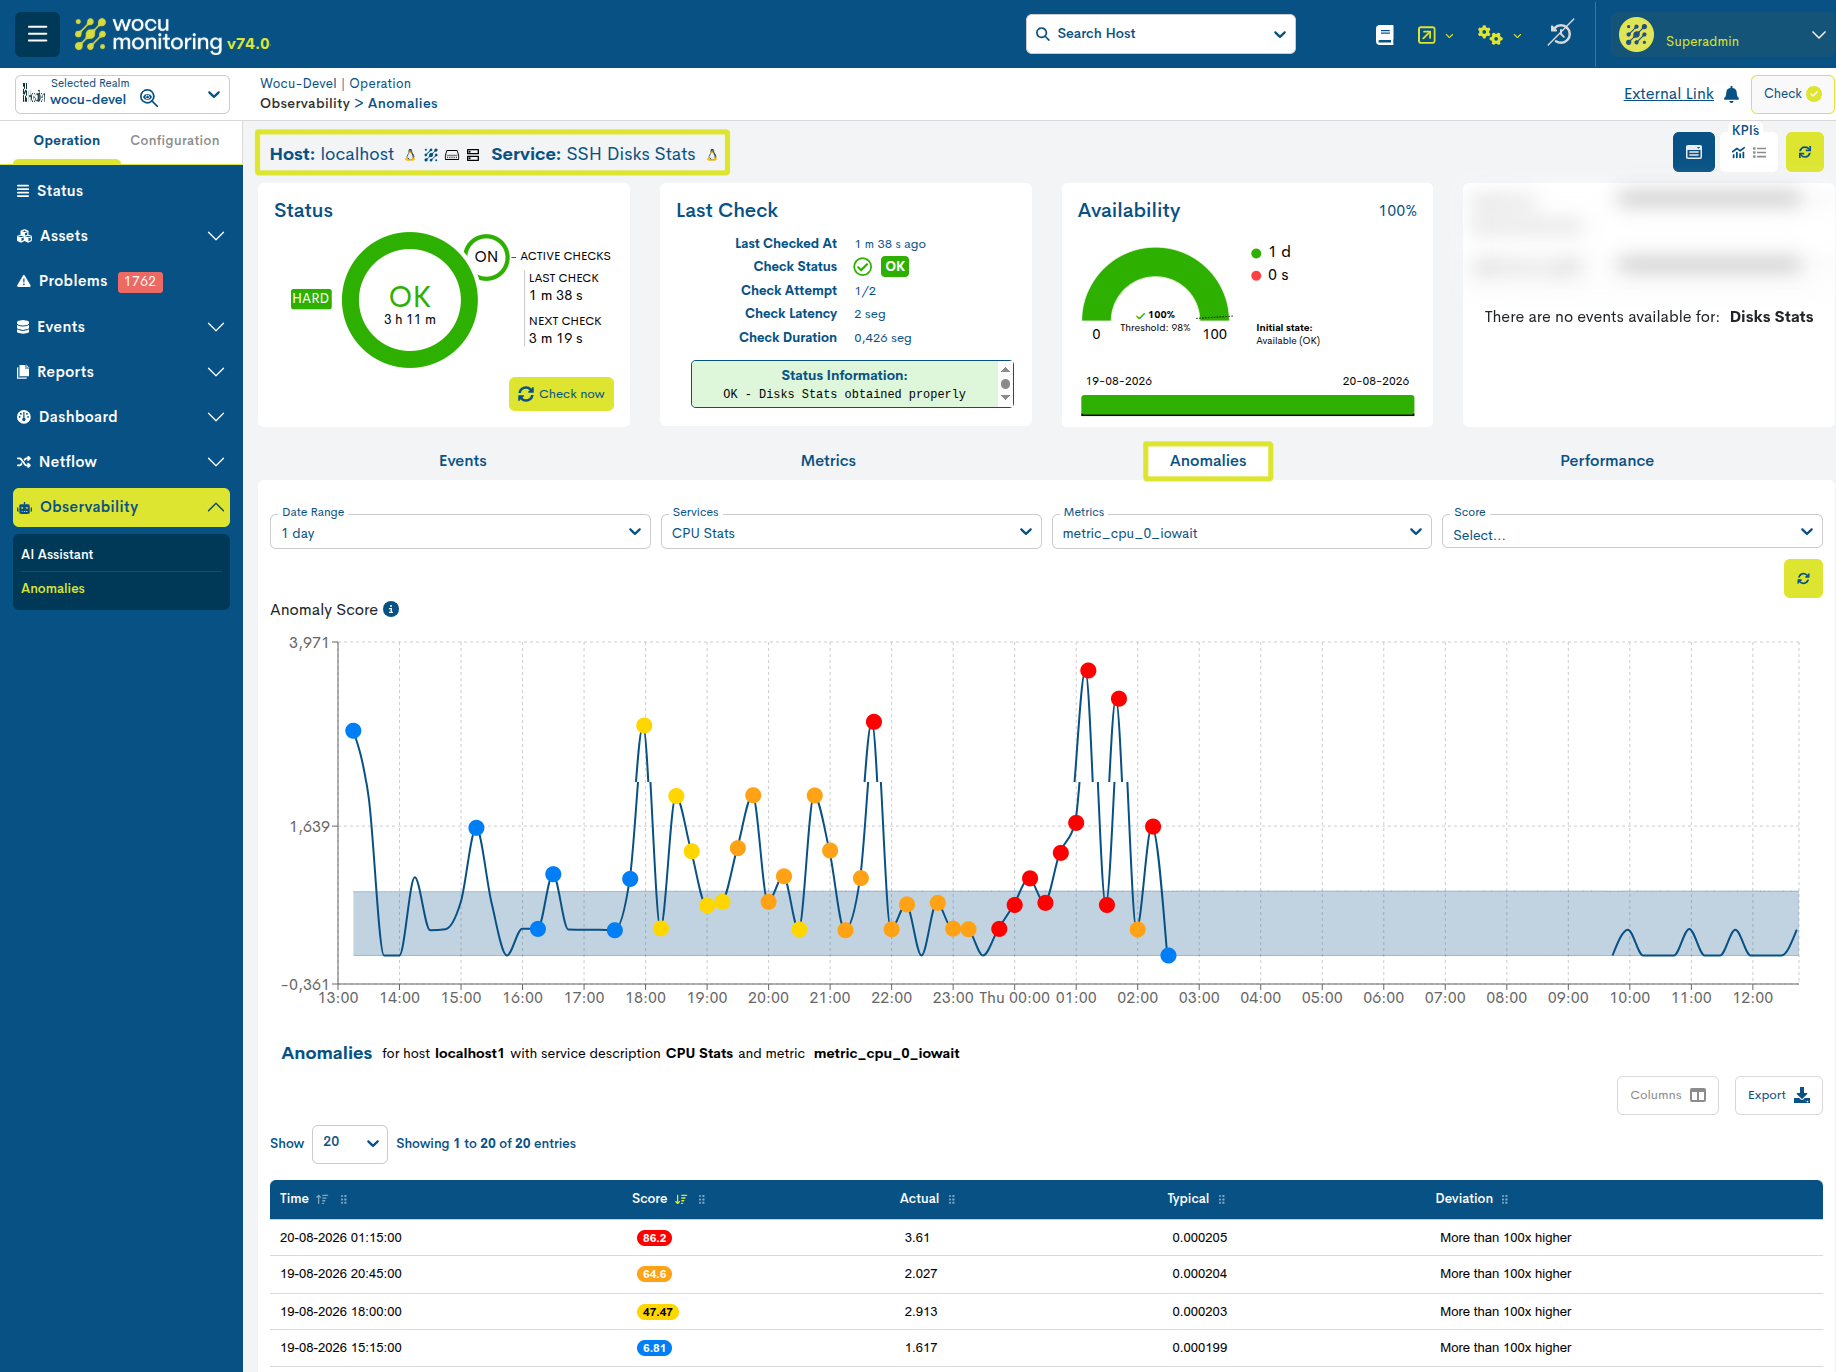
Figure 13. View of anomalies in the SSH Disks Stats service.
6. AI Assistant for Elastic Agent Builder
This version includes significant improvements to the IA Assistant in WOCU-Monitoring, both in terms of its integration with Elastic and the management and monitoring of its resource usage.
Migration from the AI Assistant to Elastic Agent Builder
WOCU-Monitoring’s IA Assistant is being migrated to the Elastic Agent Builder API, Elastic’s new conversational experience, replacing the previous Observability AI Assistant. With this change, the Assistant discusses the observability context for each Realm via its own agent, and conversations are now managed via the Agent Builder API rather than by directly accessing Elastic’s internal index.
Minimum requirements
This feature requires an Enterprise licence and, at a minimum, Elastic Stack 9.3. In Elastic Stack 9.3, Agent Builder is available as a preview feature and must be enabled manually. From version 9.4 onwards, it becomes the default experience, whilst in serverless environments it is enabled by default.
The API key configured for the Realm must include the privilege
feature_agentBuilder.all.
Full details of permissions, version requirements and the procedure for updating keys created prior to this migration are available in the section: Creating the API Key.
Monitoring and tracking of the AI Assistant’s usage
In addition, this version includes the AI Assistant’s consumption tracking and its management by Realm:
Metrics by Realm and per user: Inbound and outbound tokens, the number of model calls and agent executions are recorded in a monthly log via a recurring task that synchronises usage data from the Agent Builder API.
Usage limits: It is possible to set monthly token quotas per realm and sub-limits per user, as well as to enable or disable the Assistant for specific users.
Cost model: consumption is converted into cost based on model-specific prices (input and output) and the cost per execution, which can be configured via the administration panel, alongside a dashboard showing consumption and cost by Realm.
These capabilities enable us to roll out the AI Assistant in a controlled manner, monitoring each Realm’s usage at all times and limiting it where necessary.
7. Bulk configuration of dynamic thresholds
WOCU-Monitoring includes a new option to enable or disable dynamic thresholds in bulk across multiple hosts, simplifying their configuration when this functionality needs to be applied to a large number of assets.
Bulk configuration is available from: Monitored Assets > Hosts > Massive Configure > Dynamic Thresholds.
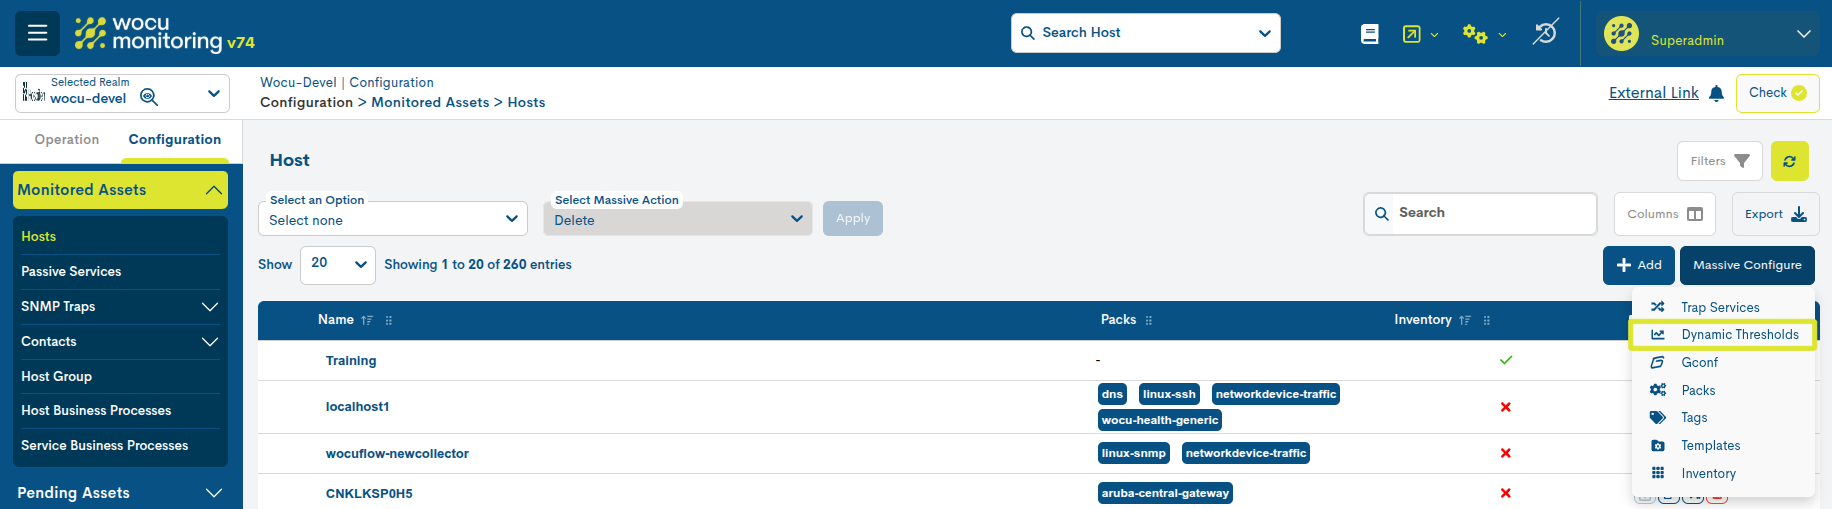
Figure 14: Accessing the bulk configuration of dynamic thresholds from the Hosts view.
Dynamic thresholds enable the assessment of specific metrics by taking into account their historical behaviour and the expected range of values, making it easier to detect deviations or anomalous behaviour that might not be identified using static thresholds.
When you select this option, a window appears containing the following fields:
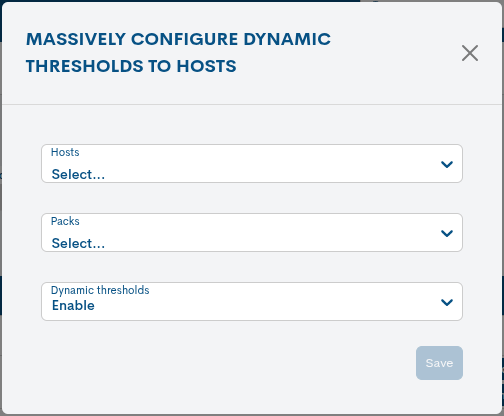
Imagen 15: Ventana de configuración masiva de umbrales dinámicos para Hosts.
Hosts: allows you to select the hosts to which the configuration will be applied.
Packs: displays the packs that are compatible with the dynamic threshold feature.
Dynamic thresholds: allows you to select Enable or Disable to enable or disable this feature for the selected items.
This new option makes it easier to manage environments with a large number of devices, as it allows settings to be applied in bulk, thereby avoiding the need for manual changes on a device-by-device basis.
For example, it is possible to select several devices that use the networkdevice-cpu package and enable dynamic thresholds for all of them in a single operation.
8. New notification channels: SMS and Microsoft Teams
WOCU-Monitoring is expanding its notification mechanisms with the addition of two new communication channels: SMS and Microsoft Teams.
These new integrations enable alerts relating to the status and events of monitored assets to be distributed via various channels, tailored to the operational requirements of each environment.
On the one hand, sending notifications via SMS allows users to receive them directly on their mobile devices, providing immediate access to relevant information about incidents or status changes. On the other hand, integration with Microsoft Teams makes it possible to centralise these notifications within the teams’ usual work channels via Webhook.
With this expansion, WOCU-Monitoring offers greater flexibility in configuring notifications, complementing the channels already available and facilitating more responsive communication in the event of incidents detected by the platform.
See the following example of notifications on both platforms:
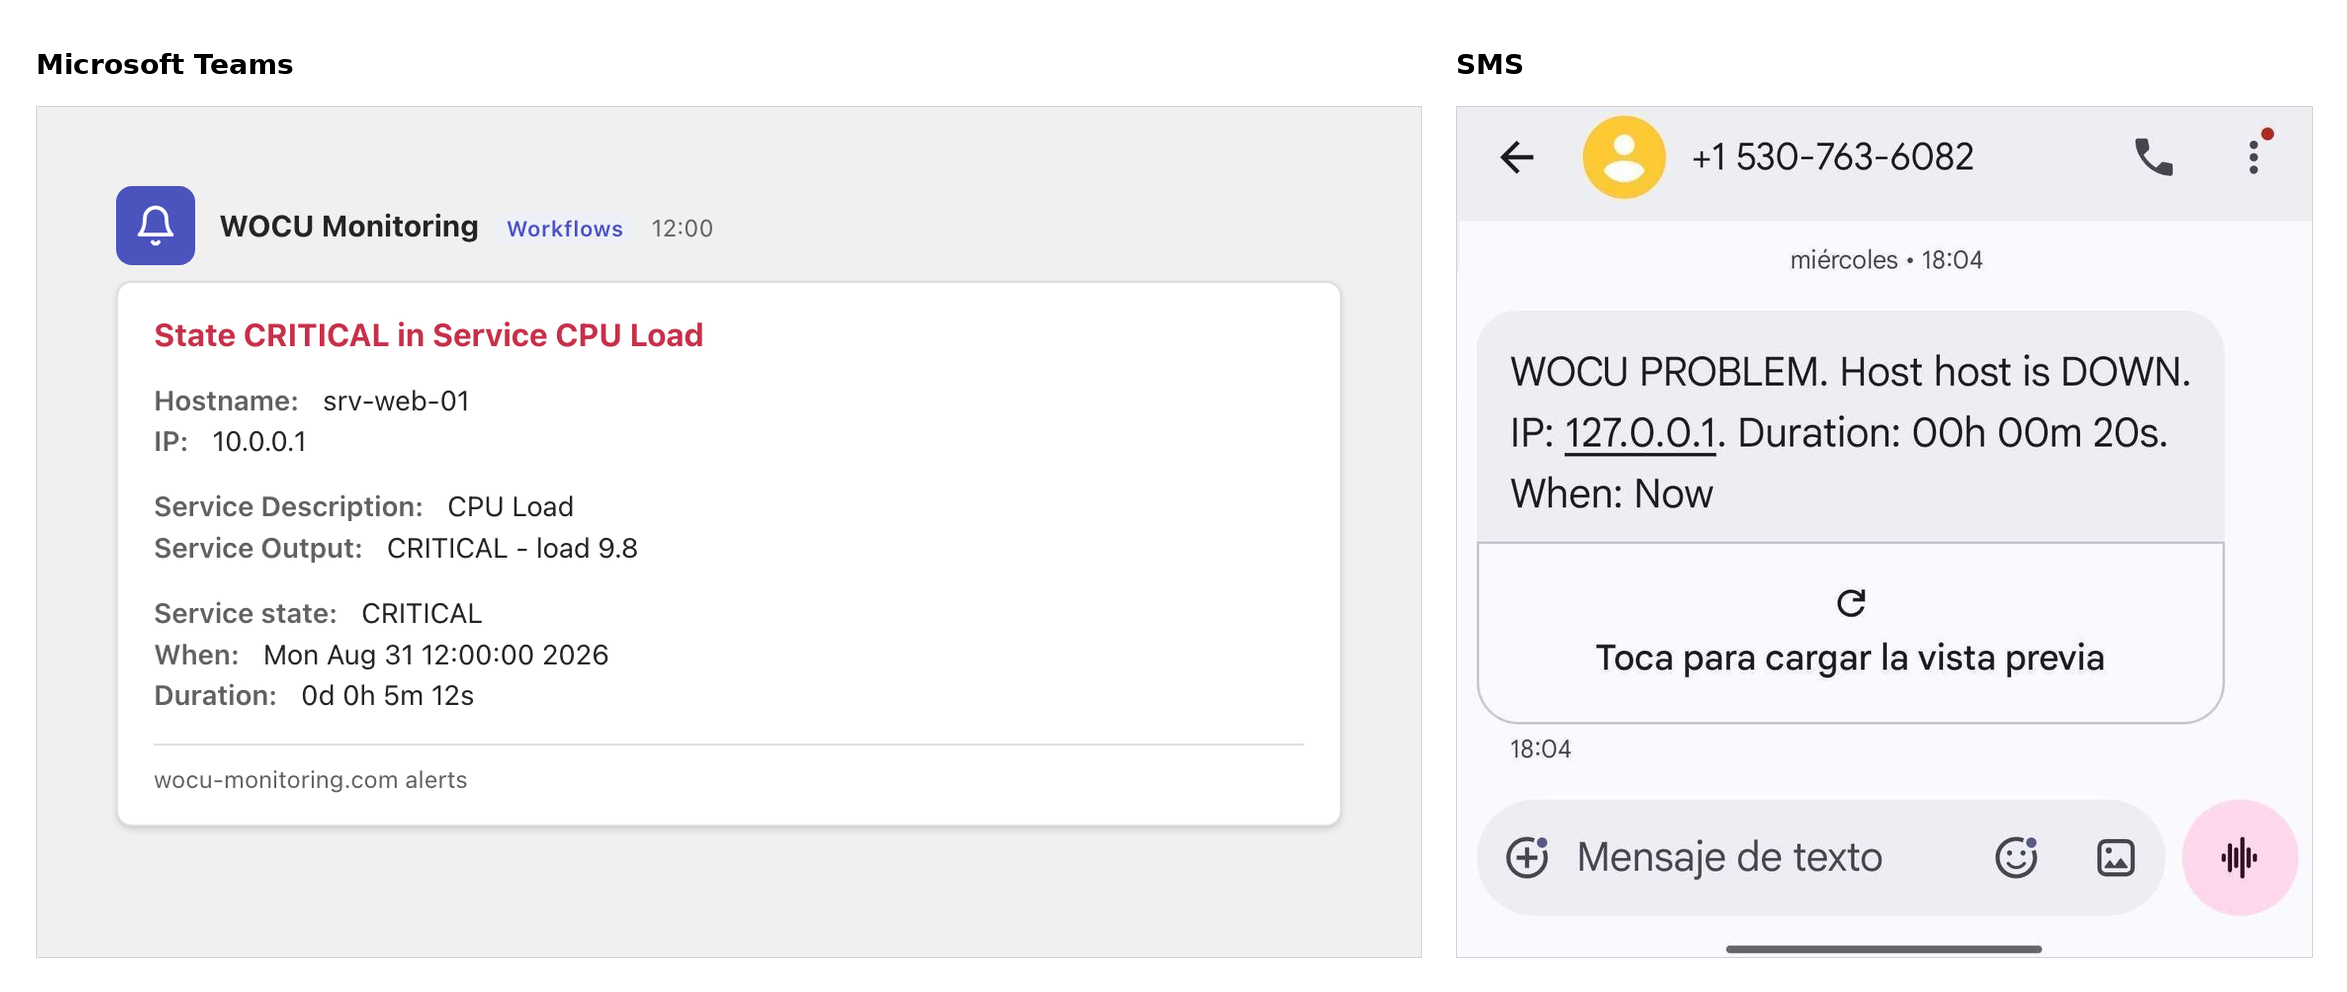
Figure 16: Example of notifications sent via Microsoft Teams and SMS.
Further information can be found at: Add Command.
9. New widget Host Groups by state
The new Host Groups by state widget has been added to the Status view. This new component provides a graphical overview of the status of Host Groups, using a colour-coded system based on the percentage of hosts in the Down or Unreachable state.
Each hexagon represents a Host Group and allows you to view, via a tooltip, its name and status distribution. Clicking on it takes you directly to the Host Group detail view.
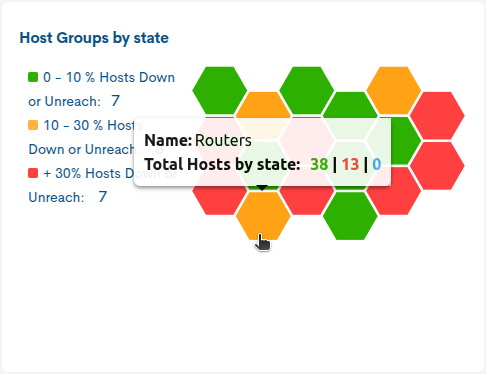
Figure 17: Viewing the status of Host Groups using the ‘Host Groups by state’ widget.
This new view speeds up the detection of degraded groups and simplifies the monitoring of infrastructures with a large number of hosts and host groups.
10. New widget duplication action
A new action has been added to Duplicate widgets individually from the Edition Mode of the dashboard (Status). From this version onwards, each widget includes a specific ‘duplicate’ option that allows you to create a copy of the selected item, whilst retaining its current settings.
This feature makes it easier to create dashboards, as it allows you to reuse existing widgets as a starting point for new visualisations, thereby avoiding the need to configure them manually from scratch. Once duplicated, the new widget can be edited independently to adjust its parameters, content or presentation according to the user’s needs.
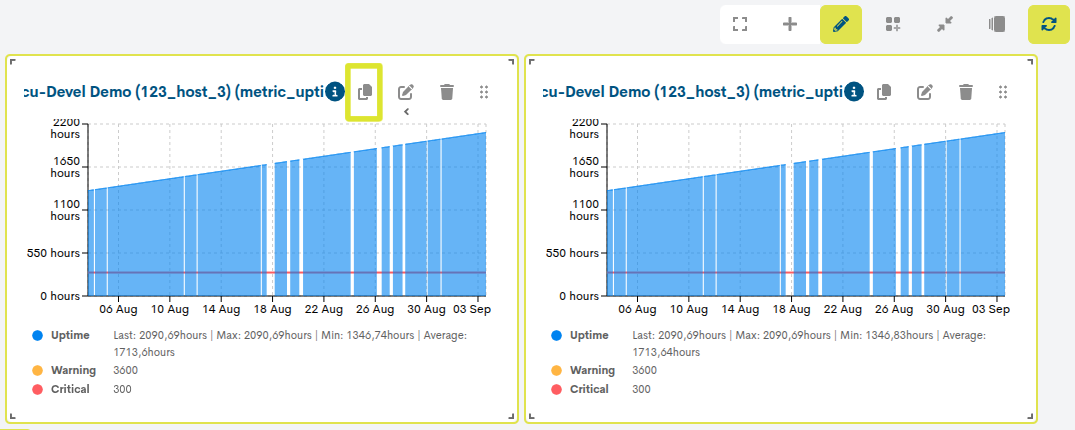
Imagen 18: Duplicado individual de un widget desde el Modo Edición del dashboard.
11. New Hosts and Services selectors in the detail view
New navigation selectors have been added to the detail views of Hosts and Services, making it easier to navigate between the various monitored items (devices and services) within the same realm.
In the detail view of a Host, the selector displays all devices belonging to the current Realm, allowing direct access to the details of the selected item. Similarly, in the detail view of a Service, a selector is added showing the monitoring services available for the current device, making it quicker to navigate between them.
Furthermore, each item in both selectors features a visual indicator in the form of a coloured dot, which represents its current monitoring status and allows it to be quickly identified before viewing its details.
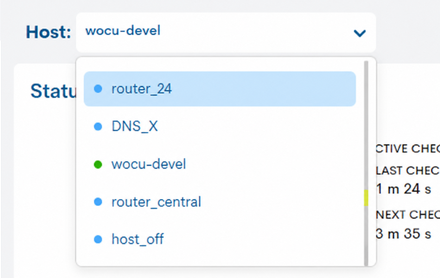
Figure 19. Host selector in the detail view for the host “wocu-devel”.
12. Packs de Monitorización
New Elasticsearch ML monitoring pack
The new Elasticsearch ML pack has been added, designed to monitor the operational status of the Machine Learning jobs associated with each Realm in Elasticsearch.
This monitoring pack brings together all the relevant information about the job and its datafeed into a single service, including its status, memory usage, limits, processing dates and execution statistics. Furthermore, it enables you to clearly identify anomalous situations using the availability statuses OK, WARNING, CRITICAL and UNKNOWN, making it easier to detect jobs that have stopped, are experiencing errors, lack recent data, or have access or configuration issues.
Optimization of performance and CPU usage in the Packs
A general optimization of the CPU consumption associated with the execution of the checks included in the WOCU-Monitoring packs has been carried out.
This improvement is based on three main lines:
Separation of lightweight and heavyweight dependencies, such that computationally expensive dependencies are only loaded when strictly necessary.
Deferred loading of the environment and SNMP dependencies, avoiding initializing them from the vendor check wrapper when the check itself does not require them.
compatible ones to run within the same process as the wrapper, avoiding the creation of additional processes.
Taken together, these changes make it possible to reduce resource consumption and improve the platform’s performance and response times, especially in environments with a large number of checks running concurrently.
Nuevo mecanismo Load_throttle para la gestión adaptativa de chequeos
Se incorpora una mejora en el procedimiento de polling de chequeos entre los Pollers y el Scheduler, con el objetivo de adaptar dinámicamente la carga de trabajo de cada Poller a su capacidad real de procesamiento.
La nueva funcionalidad, denominada load_throttle, introduce parámetros de configuración
que permiten ajustar el número máximo de chequeos solicitados al Scheduler en función
del uso actual de CPU del propio Poller.
De este modo, cuando un Poller presenta una carga elevada de CPU, deja de solicitar el máximo teórico de chequeos que podría procesar y reduce automáticamente el volumen de trabajo solicitado de acuerdo con los umbrales configurados.
Esta mejora permite evitar situaciones de sobrecarga, distribuir de forma más eficiente el trabajo de monitorización y mantener un comportamiento más estable del sistema en escenarios de alta demanda.
13. New observability features
New Home View
A new Home view is being added to the Status section, aimed at observability customers. This page consolidates the most relevant information regarding infrastructure status into a single dashboard and provides easy access to details for each host group.
The Home view includes four new widgets:
Host Status: displays the total number of hosts and their distribution by status: Up, Down, Unreach, and Filtered.
Service Status: summarizes services according to their status: OK, Critical, Warning, Unknown, and Filtered.
Geomap: displays the location of hosts on the map. It includes filters by status and host group to narrow down the information displayed.
Host groups by state: displays the groups in a honeycomb layout and uses colors to indicate the percentage of hosts that are down or inaccessible.
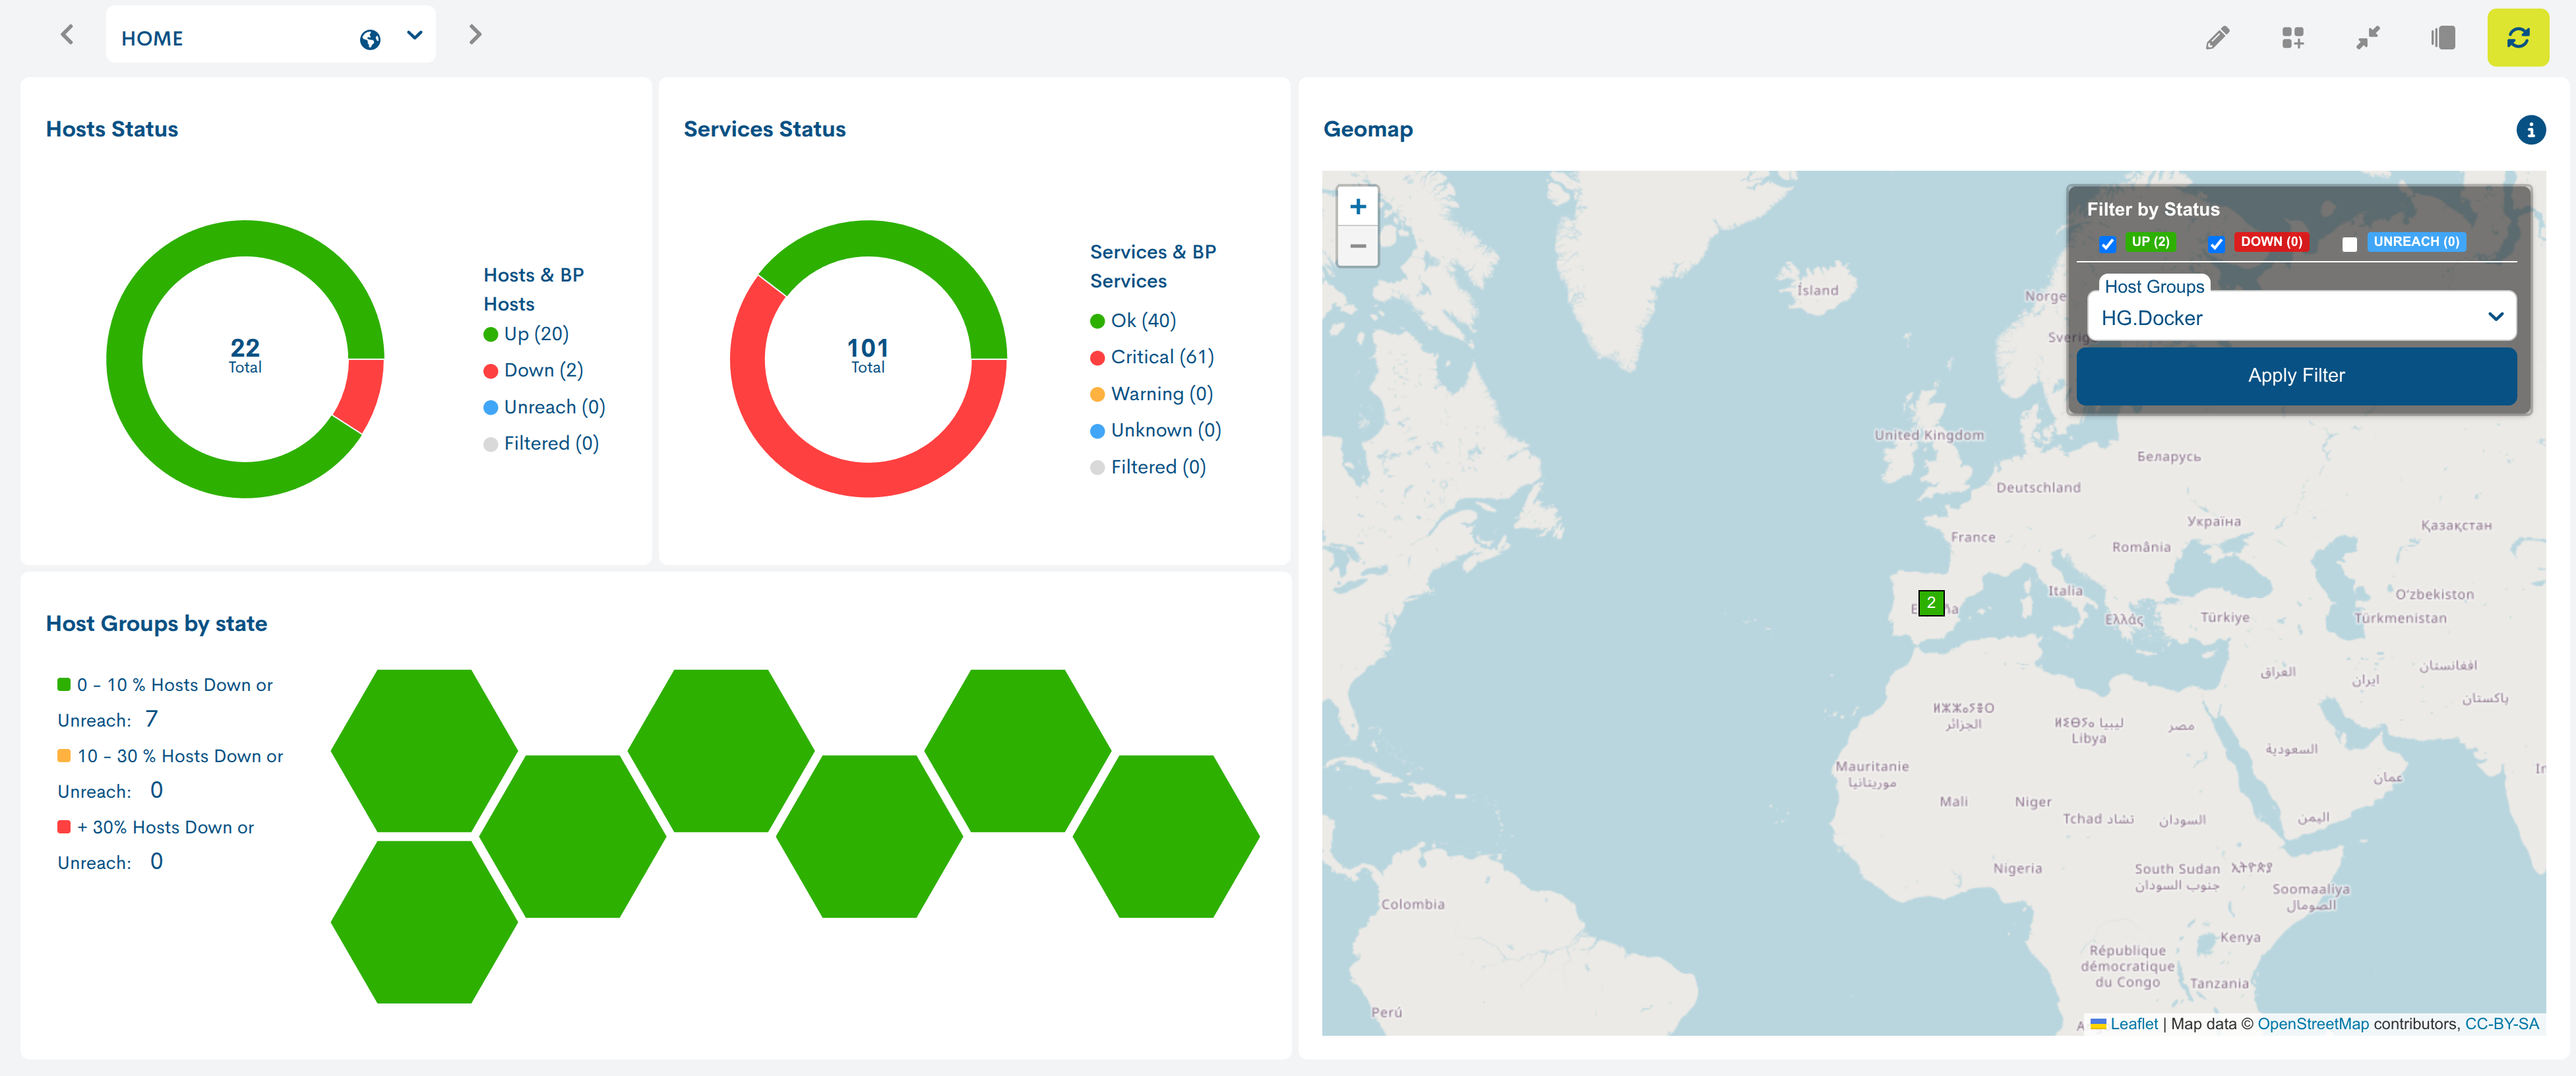
Figure 20. Home view with widgets for host status, service status, geomap, and host groups by status
Access to the summary of a group of host
The Host groups by status widget includes a link to the host groups (sites). Selecting one of the hexagons in the honeycomb opens the summary page for the corresponding group.
The host group summary incorporates the following improvements:
filter by host status
host dropdown selector to query its services;
Network Traffic widget; and
Network Traffic Forecast widget.
Traffic widgets display the following indicators for a 24-hour period:
average incoming traffic (In avg);
average outbound traffic (Out avg);
average total traffic (Total avg); and
traffic peak (Peak).
The Network Traffic Forecast widget provides the same indicators as estimates for the next 24 hours, enabling you to anticipate potential load increases and facilitate capacity planning.
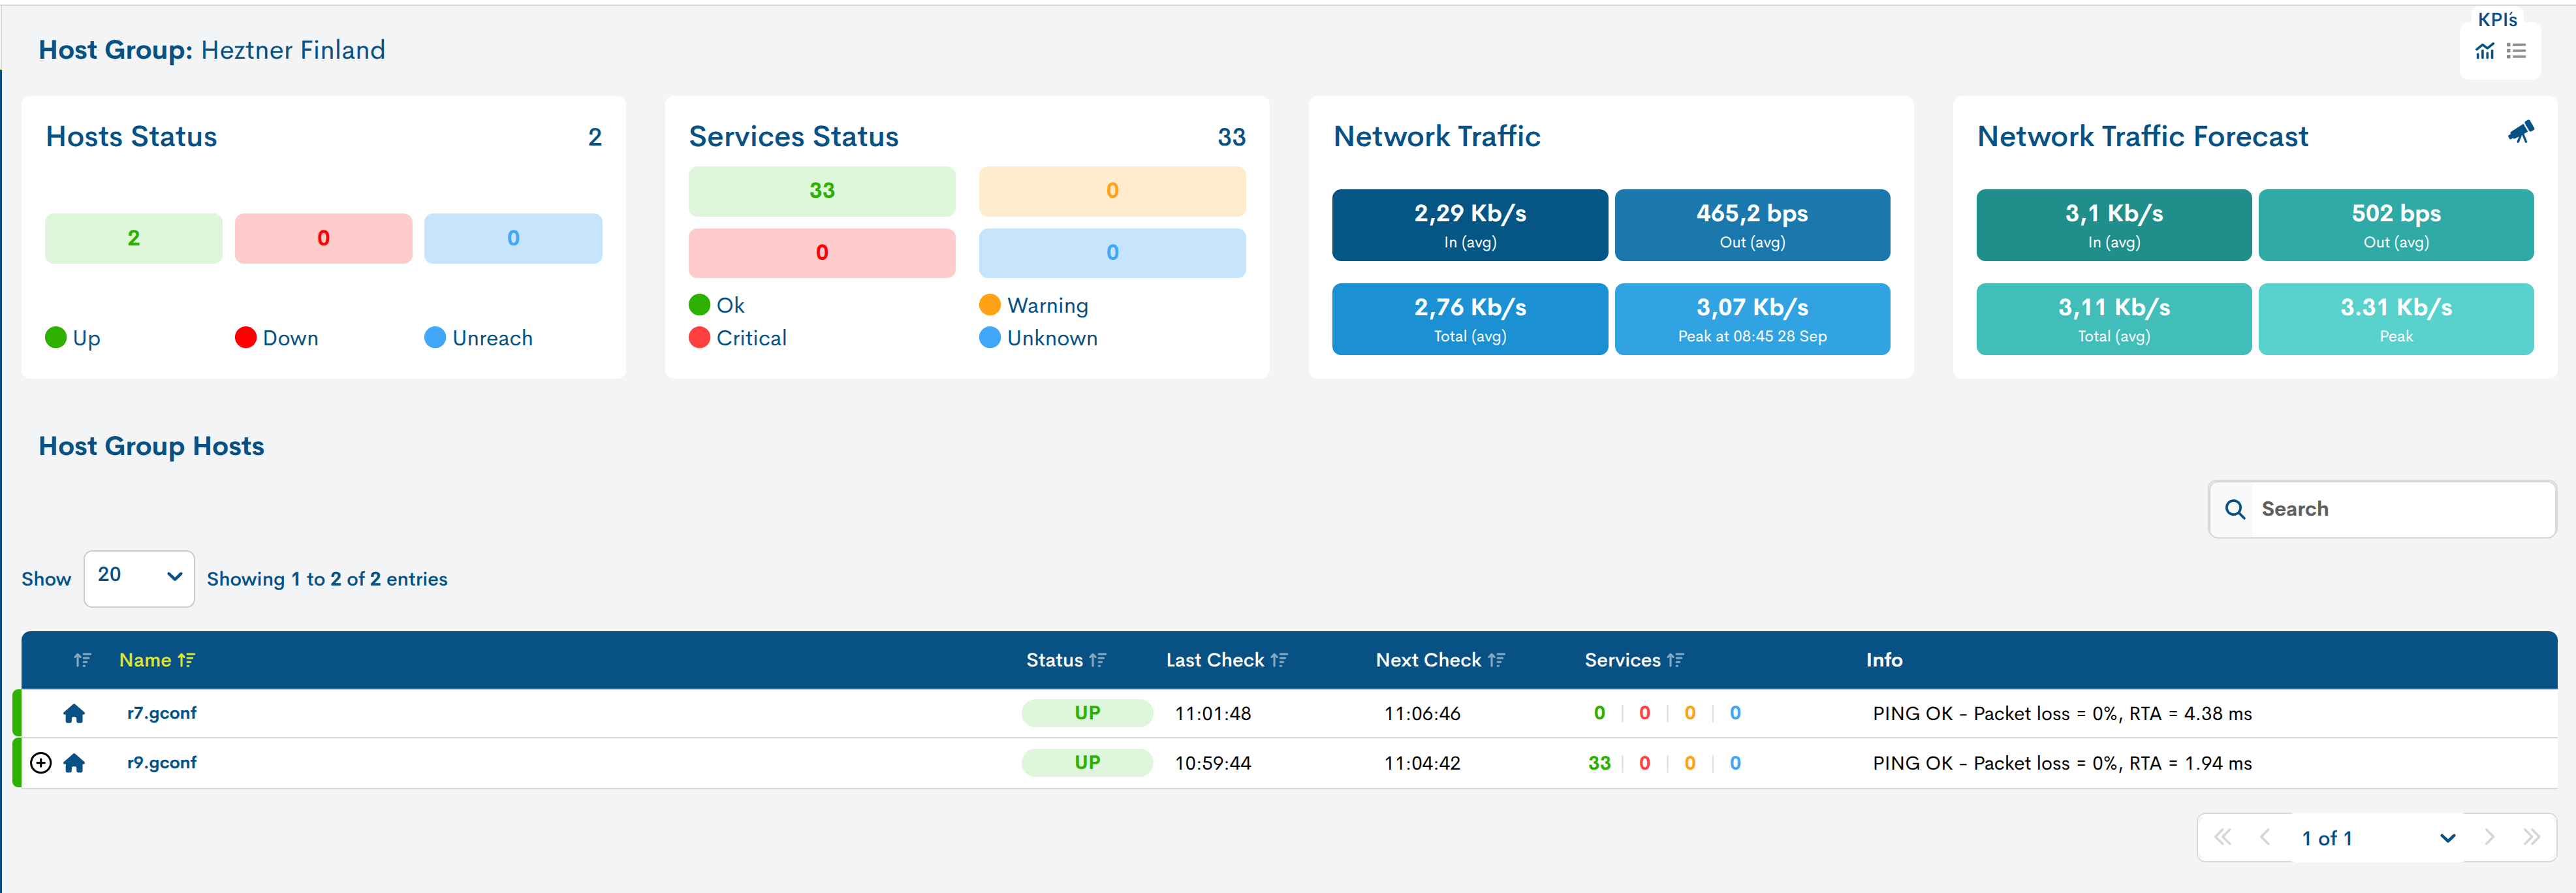
Figure 21. Summary of a group of hosts showing status, services, network traffic, and traffic forecasting
14. New Ingress data metric for ingestion control in Observability
WOCU-Monitoring incorporates a new feature for measuring the volume of data sent to the Observability platform (Elastic).
to track both daily consumption and the accumulated volume for the current month. This allows administrators to easily identify which environments generate the most data, analyze trends, and detect anomalous spikes in consumption.
he measurement covers the main observability data flows
Metrics: time series associated with the performance of hosts and services.
Monitoring events: state changes, alerts, and notifications.
Syslog: logs sent by devices to the platform.
The information is available from the administration panel within the Ingest metering block, where you can view consumption by Realm and Space, the allocated quota, the percentage used, the remaining volume, and any quota overages. A daily history is also included, accompanied by a graph showing consumption trends over the last 30 days.
This new capability provides greater visibility and transparency regarding actual platform usage, facilitates the early detection of unexpected increases in data ingestion, and offers an objective basis for right-sizing resources and establishing consumption models linked to data volume.
The measurement is performed automatically once a day and tracks the volume of data sent by the client, regardless of how Elasticsearch compresses or stores it internally. Realms with a configured Elasticsearch backend are automatically included, requiring no additional configuration by the user.
15. New management of monthly ingestion quotas by Realm and Space
WOCU-Monitoring introduces a new feature for managing monthly ingestion quotas, allowing you to define the maximum contracted data volume for each Realm and Space
When these elements are created, the platform assigns a default quota that can subsequently be adjusted by the administrator based on the conditions established for each client. In this way, the contracted volume is directly reflected in WOCU-Monitoring and can be compared with the actual consumption recorded during the current month.
Management is handled via the administration panel, where assigned quotas can be viewed and modified. For each Realm and Space, information such as accumulated consumption, available quota, percentage used, remaining volume, and status relative to the configured limit is displayed.
In the case of Spaces, the quota is assessed based on the aggregate consumption of all the constituent Realms, enabling the management of a global capacity pool for environments with multiple sites, facilities, or associated clients.
This feature facilitates the monitoring of potential consumption overages and provides a clear reference for reviewing contracted capacity or adjusting the configuration of environments generating a volume exceeding projections.
By default, quota values are configurable at the installation level, with an initial baseline of 1 TB per month per Realm and 10 TB per month per Space. In this version, the system reports and logs quota overages but does not enforce automatic restrictions on ingestion.
16. New endpoints for monitoring metrics and events
Endpoint for listing available metrics
This endpoint returns the existing metrics for a specific realm (such as CPU usage, latency or network traffic) and allows you to narrow down the search by specifying a particular device or service.
It is the ideal starting point if you do not know in advance the exact names of the metrics you wish to view later.
GET /api/metrics/realm/<realm_name>/measurements/
Example of a request:
curl -H "Authorization: Token abc123" \
  "https://<dominio>/api/metrics/realm/<realm_name>/measurements/?host=srv-web01"
Sample answer:
["cpu_usage_user", "disk_free", "network_in", "network_out", "memory_used"]
Endpoint for retrieving the values of a metric
This endpoint returns the actual data (the time series points) for one or more metrics for a specific realm, device or service within a particular time window.
GET /api/metrics/realm/<realm_name>/data/
Features designed to make it easier to use:
Readable date formats: You can enter dates in a standard format (for example,
24/07/2026or24/07/2026 14:30:00), without needing to use timestamps.Default range: If you do not specify a date, the information for the last hour will be displayed automatically.
Range limit: The maximum range permitted per query is 7 days.
Automatic metric detection: If you omit the metrics from the query, the system will detect them automatically (subject to a limit on the number of results returned).
Result filtering: You can limit and sort the number of results returned to suit your needs.
Example of a request:
curl -H "Authorization: Token abc123" \
  "https:///<dominio>/api/metrics/realm/<realm_name>/data/?host=srv-web01&measurements=cpu_usage_user,disk_free&time_from=24/07/2026%2000:00:00&time_to=24/07/2026%2023:59:00"
Sample answer:
{
  "data": [
    {
      "metric": "cpu_usage_user",
      "data": [
        { "time": "2026-07-24T10:00:00Z", "host_name": "srv-web01", "value": 42.1, "min": 38.0, "max": 55.3, "unit": "%" },
        { "time": "2026-07-24T11:00:00Z", "host_name": "srv-web01", "value": 39.7, "min": 35.2, "max": 48.9, "unit": "%" }
      ]
    }
  ],
  "total_count": 1
}
Endpoint for viewing event monitoring data
It allows you to view the event history for a Realm, such as device and service outages and recoveries, notifications sent, status changes, flapping events or external commands. It allows you to apply multiple filters (by host, event type, message text or status) and narrow down the search by date range, in the same way as the metrics endpoint.
GET /api/events/realms/<realm_name>/events/
Example of a request:
curl -H "Authorization: Token abc123" \
  "https:///<dominio>/api/events/realms/<realm_name>/events/?host=srv-web01&state_type=HARD&size=20"
Sample answer:
  {
  "data": [
    {
      "time": 1753349400,
      "host_name": "srv-web01",
      "type": "HOST ALERT",
      "state": 1,
      "state_type": "HARD",
      "message": "PING CRITICAL - Packet loss = 100%"
    }
  ],
  "total_count": 1
}
Endpoint for viewing syslog events
It allows you to search directly within a Realm’s syslog logs, filtering by device, severity, message, event type or identifier.
GET /api/events/realms/<realm_name>/events/syslogs/
Example of a request:
curl -H "Authorization: Token abc123" \
  "https:///<dominio>/api/events/realms/<realm_name>/events/syslogs/?host=srv-web01&severity=err"
Sample answer:
  {
  "data": [
    { "@timestamp": "2026-07-24T09:12:33Z", "host": "srv-web01", "severity": "err", "message": "disk quota exceeded" }
  ],
  "total_count": 1
}
Note
If the realm_name corresponds to a multi-realm, this endpoint automatically queries the syslog of all the realms that make it up and returns the combined results.
Other improvements and fixes
Every new version is packed with minor changes, fixes and optimisations that are worth briefly highlighting. Here is a list of the most notable ones in this version:
A new configuration option has been added to the Security Module which allows you to disable the CAPTCHA built into the login screen. Disabling the CAPTCHA only affects this validation mechanism and does not alter the other security controls included in the Security Module. Enabling or disabling the CAPTCHA is not available via the user interface. This setting is managed via internal settings variables. If this change is required, a request must be made to the relevant technical team.
The detail view of a Host Group now includes the option to display the monitoring services associated with each member host, making it easier to check their status and operational information directly from the group.
The configuration fields for the Geomap have been moved to the widget’s final view, where they now function as interactive filters by status and Host Group. This allows you to adjust the information displayed directly on the map, without having to enter edit mode.
From this version onwards, the Realms categories will be displayed in the interface in the same order as defined during configuration, thereby respecting the layout set by the user.
The
host display namefield has been added to the export file in CSV and JSON formats in the Events Monitoring<exportformat> table.The graphical representation of Metrics has been improved to make it easier to identify outliers between intervals with no data. From this version onwards, when a metric value is preceded and followed by null values, it will be displayed as a visible dot on the graph. This means that isolated values can be identified directly without having to hover the cursor over the graph to detect them.
The behaviour of the filter panel in Geomap has been corrected to prevent it from closing accidentally when the cursor is moved outside it. There is now a brief delay before it closes, allowing for a more stable and fluid user experience.
A display issue in Services Inventory has been fixed, which caused the columns to become misaligned when new fields were added to the table. The information is now correctly aligned.
A bug in the Problems table has been fixed which prevented the Business Impact column from remaining hidden. From this version onwards, when this column is hidden, the setting is retained correctly after the table is refreshed.
A new + button has been added next to the Logger Server field on the Creation of Realms form, allowing you to create a new logging server directly from here, without first having to go to Logger Resources.
A bug has been fixed which could cause the export of Multimetrics Reports to XLSX format to fail when a metric did not include the time field. From this version onwards, such cases are handled correctly, preventing the generation of invalid files.
A problem has been fixed in the Monitoring Events (Monitoring) tables which could cause the
host_nameto be displayed instead of the configuredDisplay Name.A visual issue on the Credits Penalties card has been fixed, which caused the progress bars to always be displayed in grey, even when data was present. In addition, the width of the text associated with the relevant asset has been adjusted so that it correctly fills the available space.
From this version onwards, certain macros will only be available when the Observability is enabled, thereby preventing the display of options that are not applicable in environments where this functionality is not active.
The functionality of Ask AI in Services has been improved, rectifying instances where requests might end without any visible results or remain loading indefinitely. In addition, the date and time of each request are now included in the conversation list, making it easier to identify and reopen them later. Error handling has also been improved, displaying clearer information when a request cannot be completed successfully.
A bug has been fixed in the information table for Packs which caused the progress bar to be displayed incorrectly when sorting the data from lowest to highest. From this version onwards, the values and their visual representation are updated correctly after sorting is applied.
The option to select a specific range within the Forecast area has been added to the metrics charts. This improvement allows you to narrow down the range of interest and analyse the forecast values within the selected period more accurately.
A bug has been fixed whereby the date filter in Event Correlator was sent empty by default. From this version onwards, the filter is automatically initialised with the range corresponding to the last 24 hours.
A bug has been fixed that caused Multimetrics Reports to fail when the
metric_valuefield received an empty array. From this version onwards, such cases are handled correctly, preventing the report from being interrupted.
Updated software
As ever, further software components have been added and updated in this new version of WOCU-Monitoring:
Software |
Previous version |
Current version |
Comments |
|---|---|---|---|
Graphana |
11.6.2 |
11.6.14+security-04 |
https://github.com/grafana/grafana/blob/main/CHANGELOG.md#11614security-04-2026-05-1 https://github.com/grafana/grafana/blob/main/CHANGELOG.md#11614security-04-2026-05-1 https://github.com/grafana/grafana/blob/main/CHANGELOG.md#11614security-04-2026-05-12 |
MongoDB |
4.4.30 |
4.4.31 |
https://www.mongodb.com/try/download/community-edition/releases |
mosquitto |
2.0.21-1 |
Newly implemented software. |
|
mosquitto-clients |
2.0.21-1 |
Newly implemented software. |
About WOCU-Monitoring
WOCU-Monitoring is a multi-purpose monitoring tool that integrates the latest open-source technologies for monitoring, visualisation, metric charting and log management, providing comprehensive visibility into the status and availability of network elements, servers, databases and workstations (among others) using bespoke Monitoring Packs.
In addition to the Free <https://www.wocu-monitoring.com/licenses/>, the version of WOCU-Monitoring <https://wocu-monitoring.com> known as Enterprise <https://www.wocu-monitoring.com/licenses/> enables the deployment of thousands of IP devices, in a distributed environment, with customisations tailored to each client’s infrastructure.