Release Notes 74
Publication date: 13/07/2026
This document provides a detailed summary of the new features, functionalities, improvements and bug fixes included in version 74 of WOCU-Monitoring. This update addresses our users’ requests and suggestions, whilst ensuring we remain in line with current market trends and requirements.
1. New advanced filter to identify and manage assets with notifications disabled
The Disabled Notifications filter has been added to the Advanced Filters block in the Hosts, Services and Problems lists. This option allows you to identify assets for which notifications have been disabled using the individual action Disable Notifications for…, available for monitored devices and services.
The new feature improves asset and alarm management by providing a clear overview of silenced items, reducing operational noise and making it easier to prioritise incidents that require attention.
It is very easy to use: tap the Disabled Notifications box several times to toggle between its different states and decide whether the relevant assets should be included or excluded from the list.
This filter can be combined with the other options available in Advanced Filters to produce more precise search results.
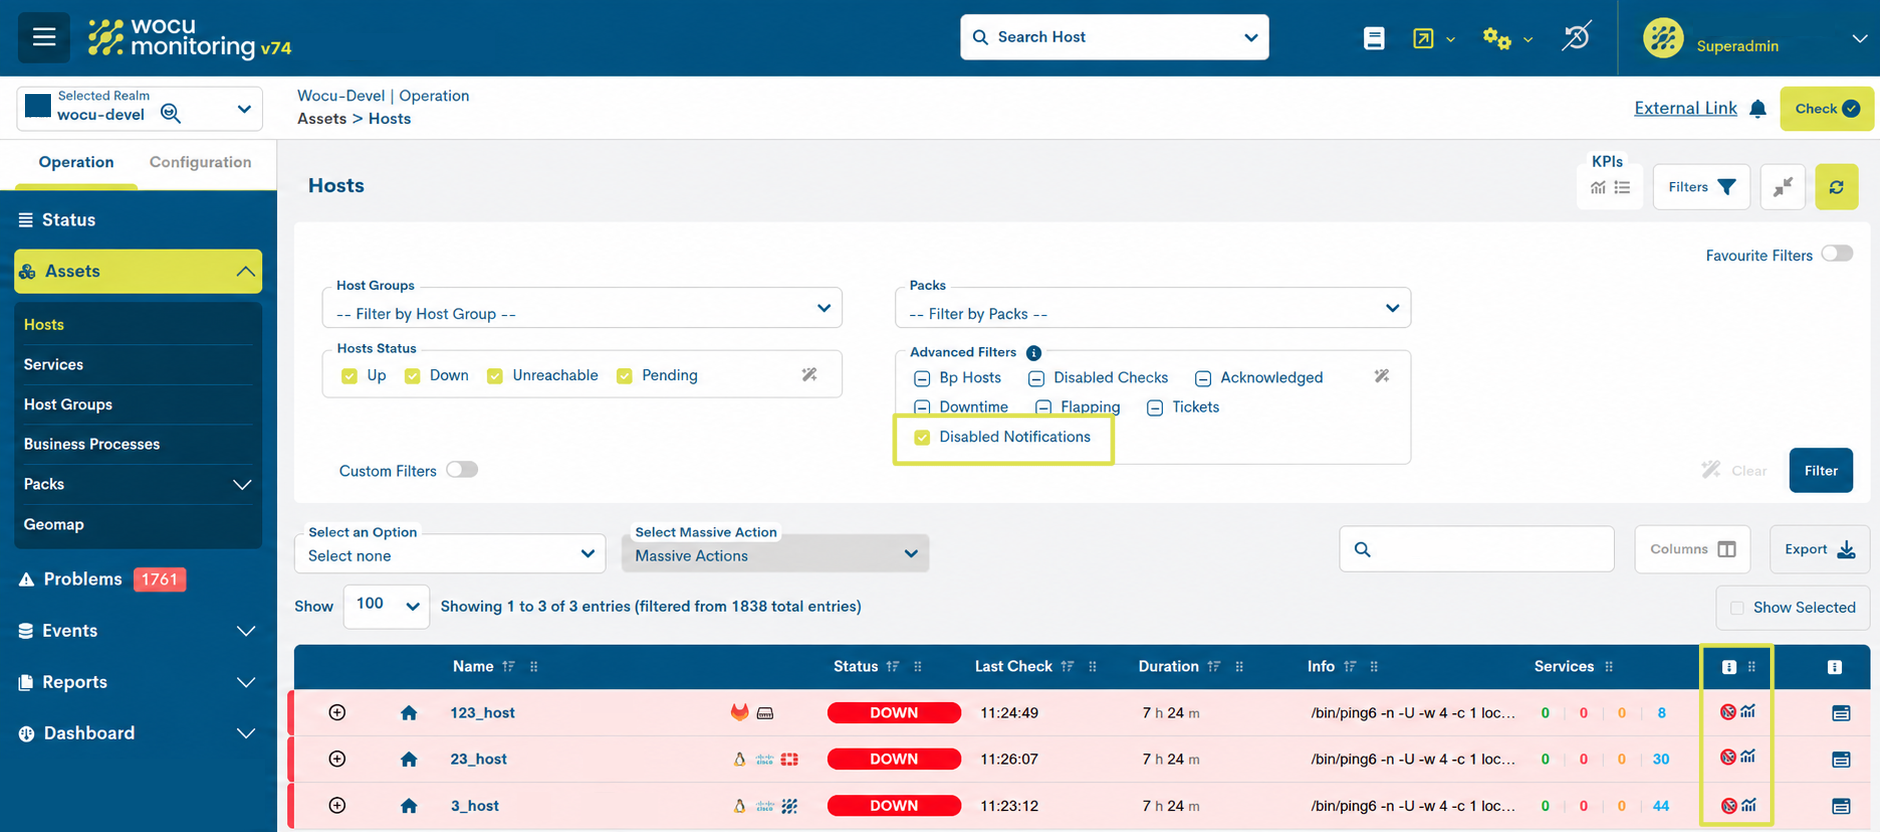
Figure 1: View of the Disabled Notifications filter in Advanced Filters(Host list).
2. New HTML and Markdown widgets in the Status view
The Status view in WOCU-Monitoring incorporates the new HTML and Markdown widgets, designed to add informative and customised content directly to the customisable dashboards. This gives users greater freedom to customise the views without having to develop new components.
These widgets can be used to include operating procedures, notices, instructions, to-do lists, links, images, network diagrams and information specific to each environment.
The HTML widget allows you to create content using validated HTML tags, whilst the Markdown widget offers a visual editor with formatting options, image insertion and keyboard shortcuts.
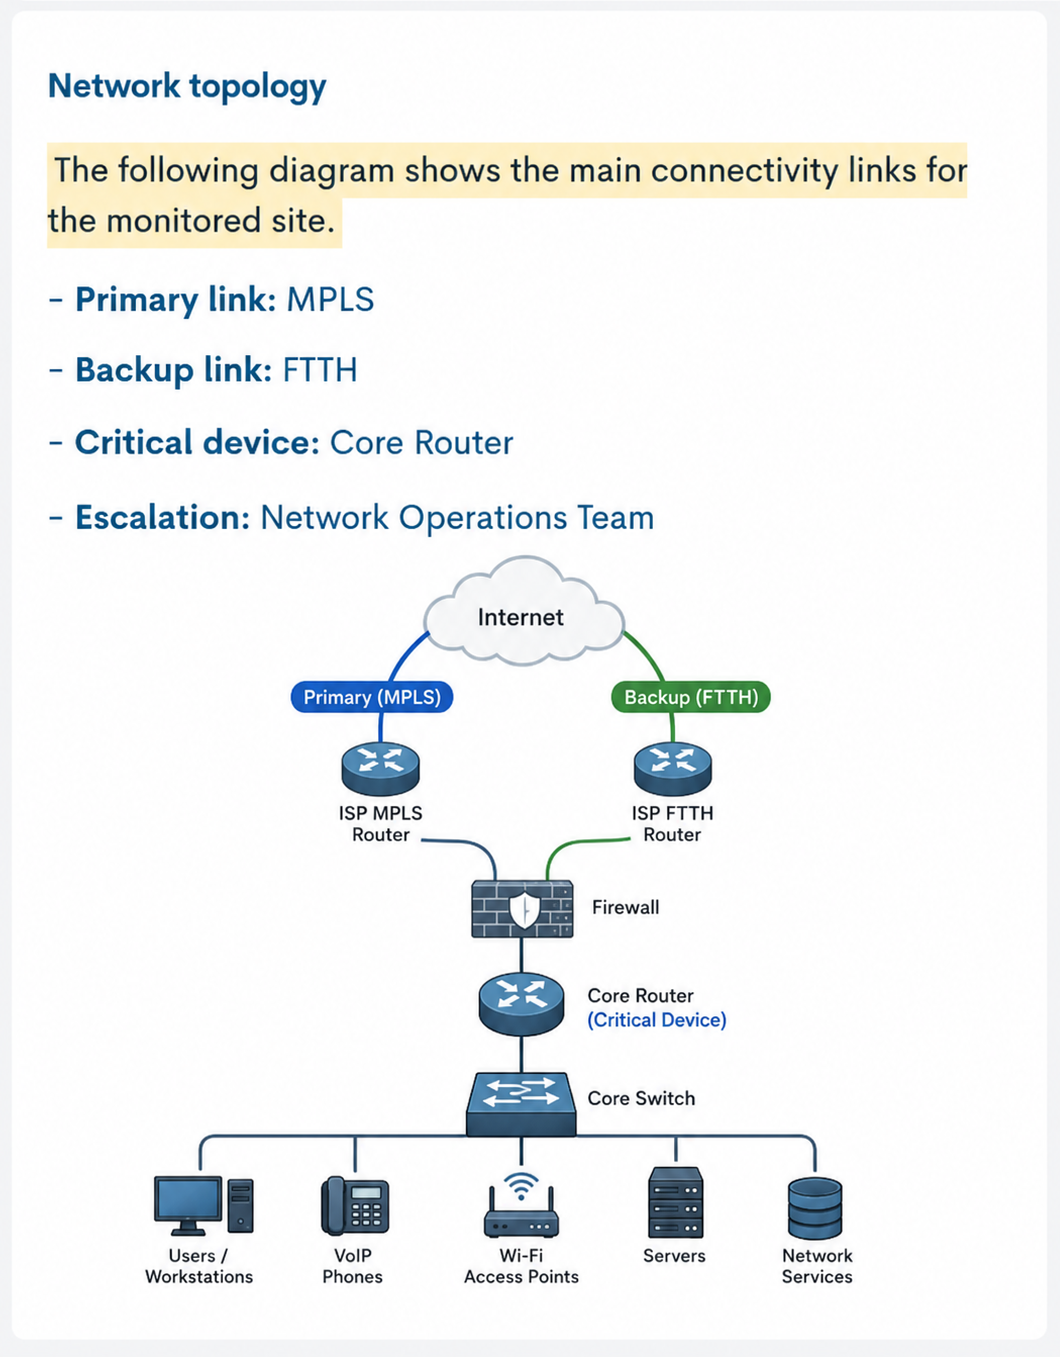
Figure 2: Markdown widget with formatted information and an integrated network topology diagram.
With these new components, it is possible to:
Creating dashboards that are more descriptive and tailored to each team or client.
Centralisation of operational information alongside monitored data.
Quick access to procedures, contact details or any other information of particular relevance to the user.
Inclusion of diagrams or other visual material and supporting documentation.
3. Metrics forecast
The new Forecast feature has been added to the Metrics view, allowing you to view the estimated trend of a metric for a future period of up to 1 day.
The forecast is shown in a specific colour and as a line distinct from the historical data. For metrics with multiple time series, you can select which of these you wish to display the forecast for.
This functionality makes it easier to anticipate potential trends or anomalous behaviour, enabling the early detection of approaches to critical thresholds and supporting more proactive management of the monitored resources.
The feature is activated via a new button marked with a telescope icon and is available only on Realms where the Observability module is enabled and Elasticsearch is used as the backend technology.
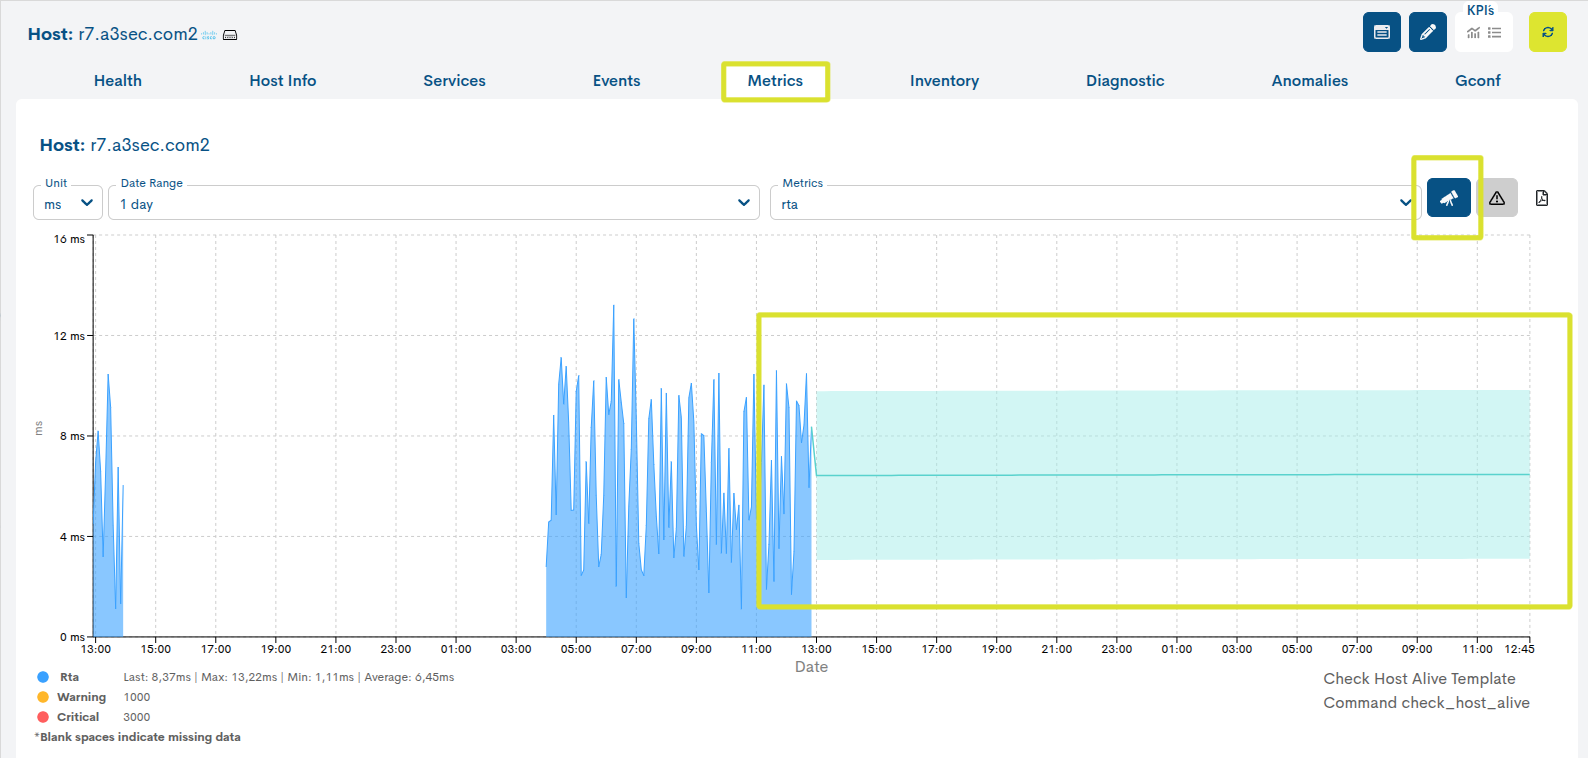
Figure 3: The Forecast view in Metrics, showing the predicted future trend for the metric.
4. New integrations in Anomalies
New view of Anomalies in Observability
The new view Anomalies is incorporated within the module Observability, which centralizes in a single table all anomalies detected in the selected Realm in the last 24 hours.
The view provides detailed information for each anomaly, including date and time, score, host, service, metric, current value, typical value, and deviation level. This information allows for the rapid detection of unusual behavior, prioritization of the most relevant anomalies based on their score, streamlined incident analysis, and a centralized view of detected deviations across the entire Realm.
Furthermore, the following is included for the management of anomalies:
Filter by time range, with predefined periods and selectionpersonalized.
Filter by Score, to filter anomalies according to their level of relevance. The score, between 0 and 100, quantifies the degree in which the observed value deviates from the expected behavior. How much The higher the Score, the greater the significance of the anomaly.
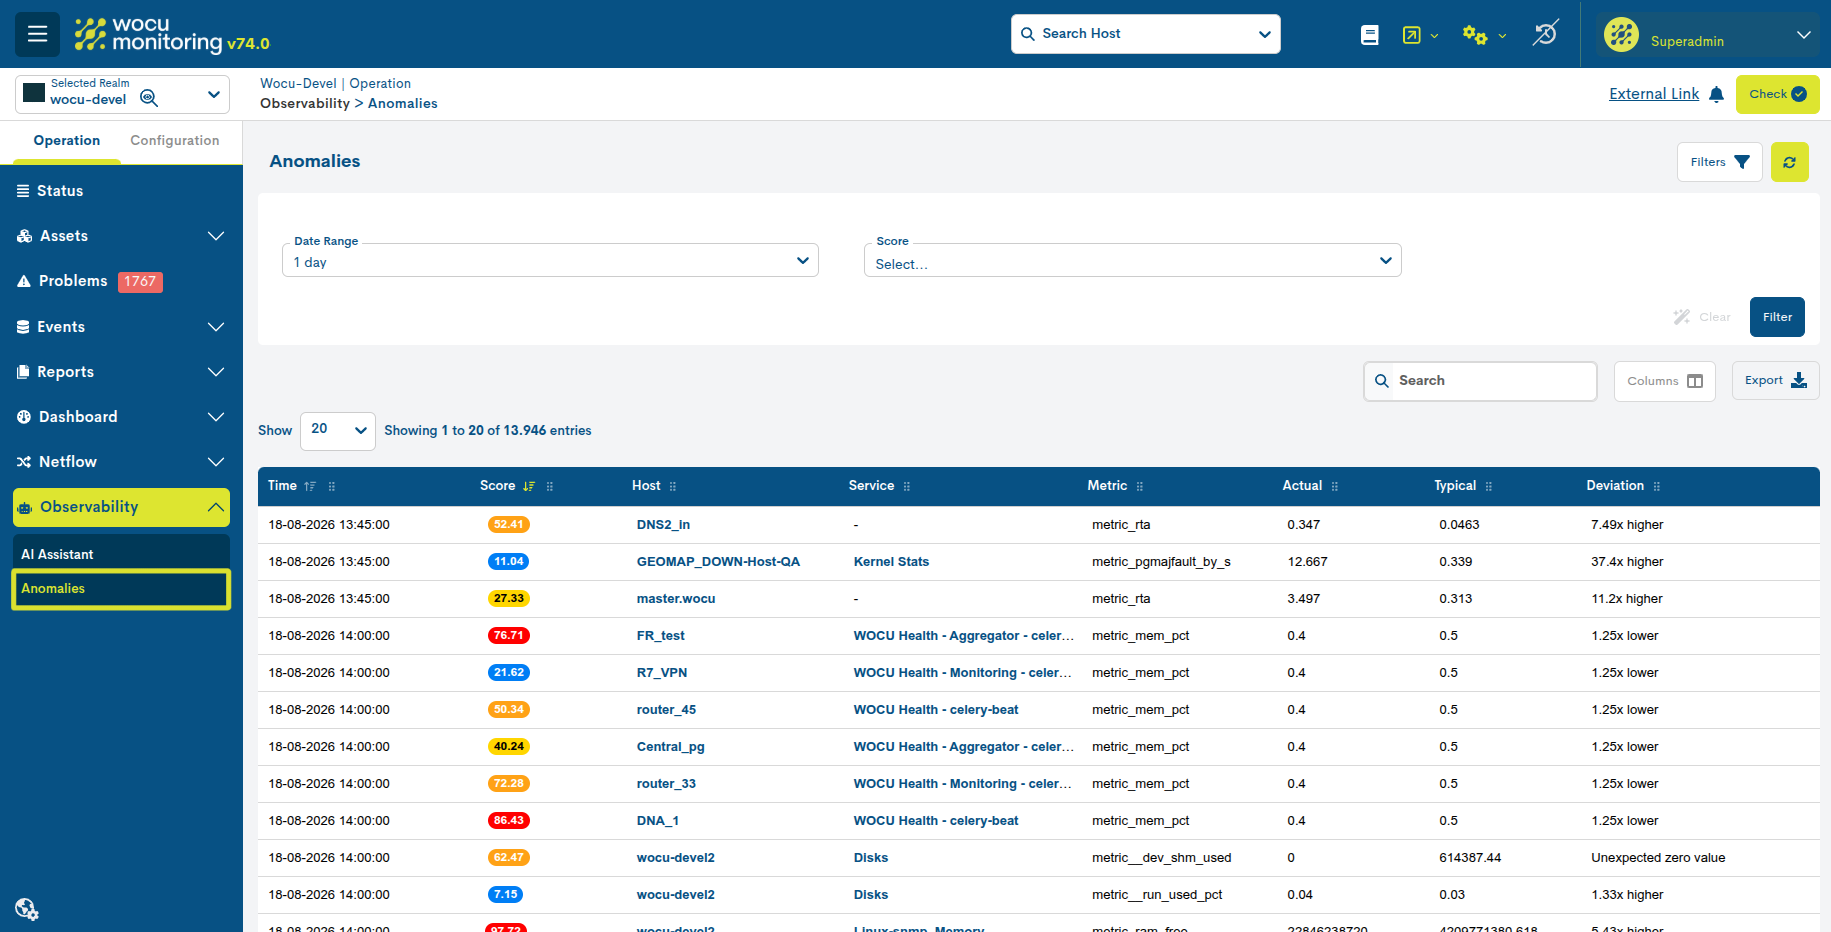
Figure 4. Overview of Anomalies in Observability with filters by time range and Score.
New Deviation column in the anomalies table
The new Deviation column is incorporated into the Device-level anomalies table, providing greater context for quickly assessing the magnitude of detected deviations and facilitating their operational analysis.
This new field facilitates the interpretation of detected anomalies by directly displaying the difference between the actual recorded value (Actual) and the expected value (Typical). In addition to indicating the magnitude of the deviation, it allows identification of whether the observed value is above or below the usual behavior.
For example, a value like 3.42x higher indicates that the recorded value is approximately 3.42 times higher than the expected value.
The new Deviation column complements the information provided by Score. While Score expresses the significance of the anomaly through a normalized score, Deviation offers a more intuitive reference point for how far the observed value has deviated from its expected behavior.
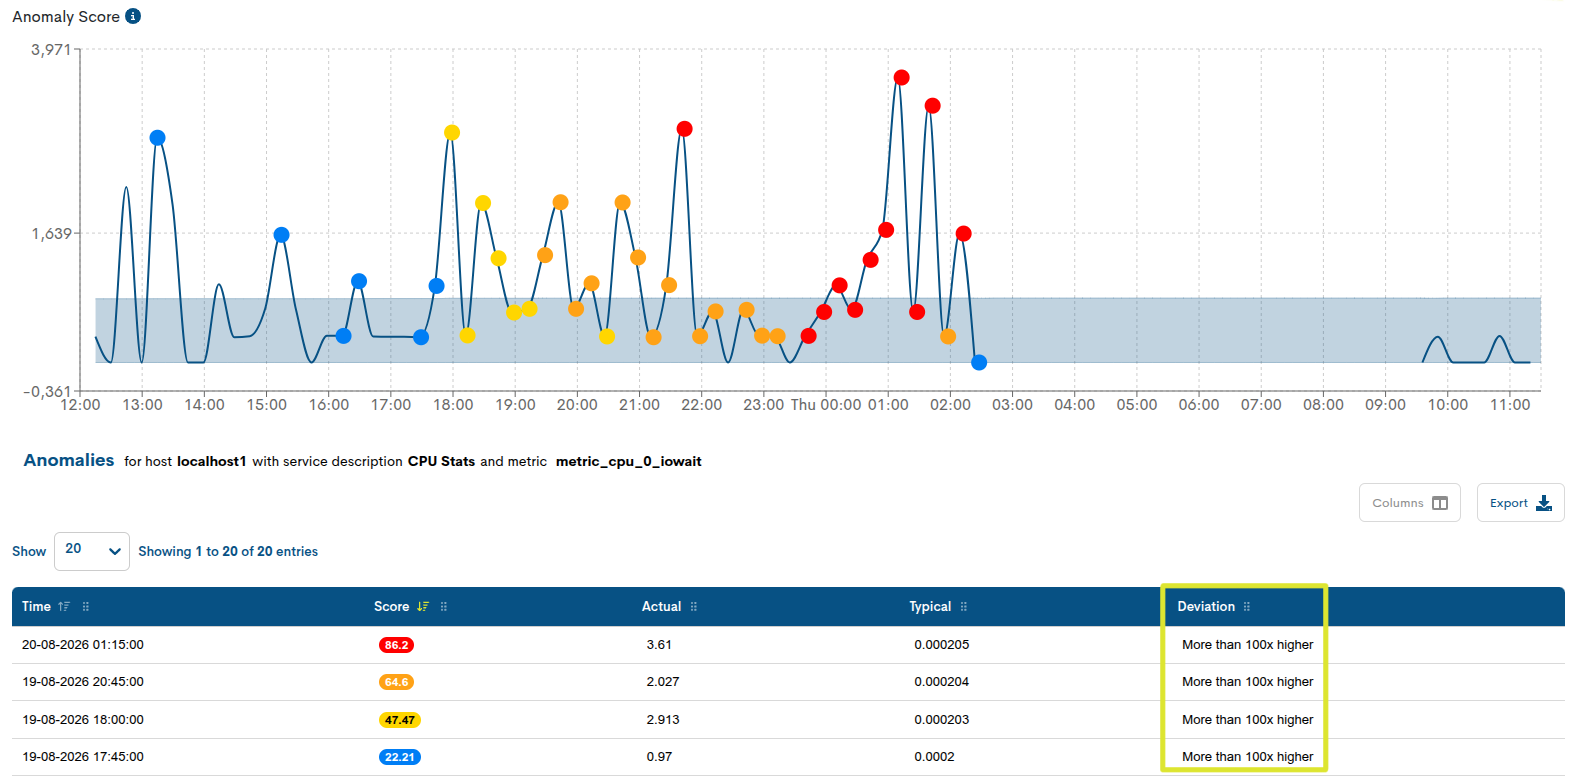
Figure 5. Device-level anomaly view with the new Deviation column.
New Score filter in the Hosts anomalies view
A new Score filter has been added to the Anomalies view of the Hosts, designed to facilitate the identification and analysis of anomalies according to their level of relevance.
The Score, ranging from 0 to 100, quantifies the degree to which the observed value deviates from the expected behaviorThe higher the Score, the greater the significance of the anomaly.

Figure 6. View of the Score filter applied to the anomaly analysis of a Host.
To facilitate filtering, the results are grouped into four ranges:
5 - 25: Low anomaly. The value shows a slight deviation from the expected value.
25 - 50: moderate anomaly. The deviation begins to be significant.
50 - 75: High anomaly. The observed behavior deviates clearly from the expected pattern.
75 - 100: very high anomaly. Represents the most relevant or unusual” deviations
In this way, the user can narrow down the results and focus the analysis on those anomalies that present a certain level of significance within the selected Service, Metric, and time interval.
With this improvement, the Host’s anomaly view incorporates greater filtering capabilities, allowing for faster location and prioritization of the most relevant deviations.
Service-level anomaly view
The Anomalies view is expanded and is now also available for a specific Service <anomalies_services>, allowing you to directly analyze the anomalies associated with its metrics.
With this improvement, anomaly analysis is now available at all three main levels of WOCU-Monitoring: Realm, Host and Service, facilitating more precise navigation from a global” view to the details of a specific service.
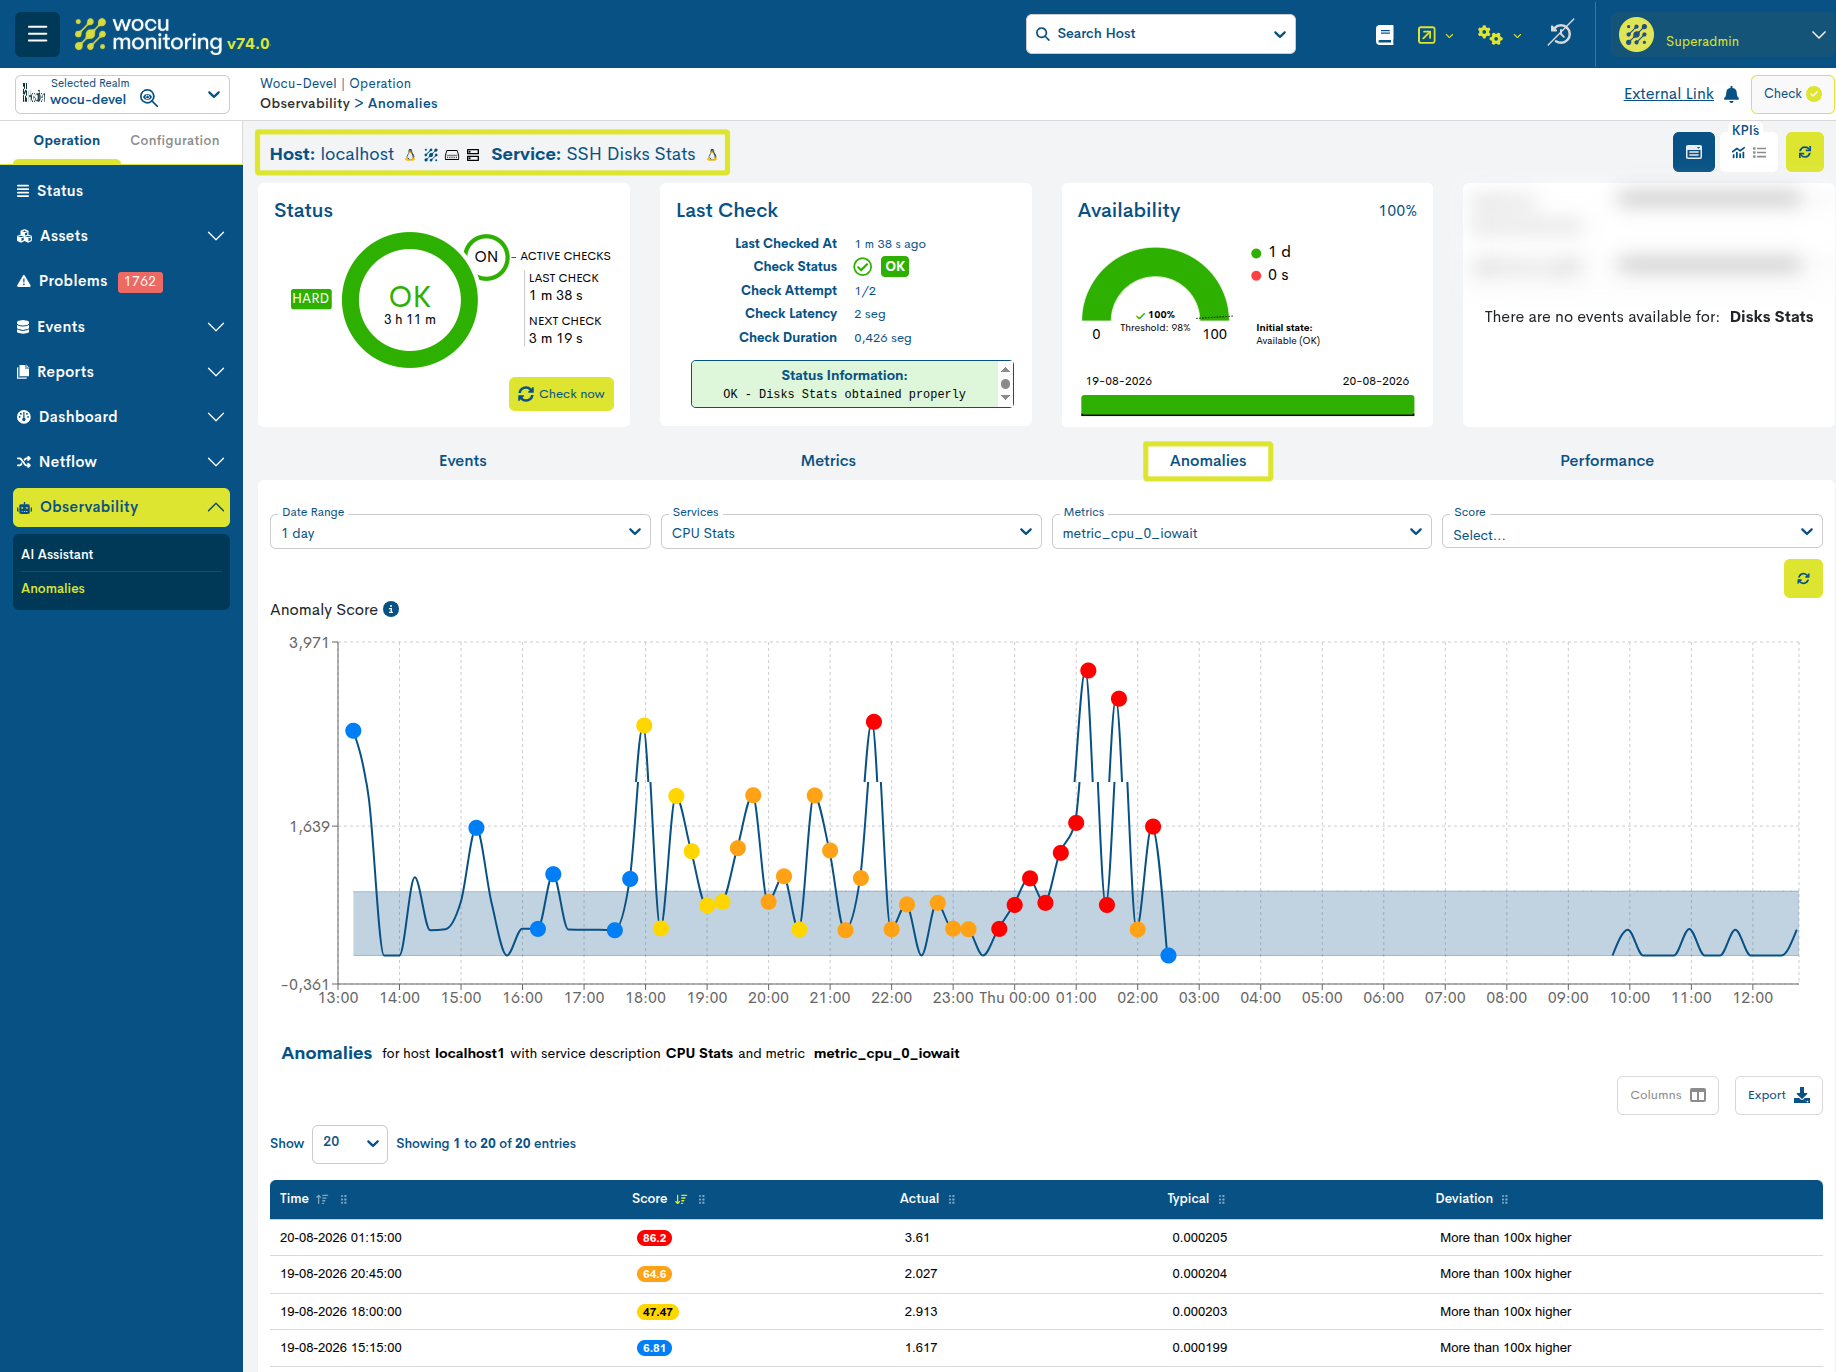
Figure 7. View of anomalies in the SSH Disks Stats service.
5. Bulk configuration of dynamic thresholds
WOCU-Monitoring incorporates a new option to enable or disable massive_dinamic_thresholds on a massive scale across multiple hosts, simplifying its configuration when this functionality needs to be applied to a large set of assets.
Bulk configuration is available from: MonitoredAssets > Hosts > Massive Configure > Dynamic Thresholds.
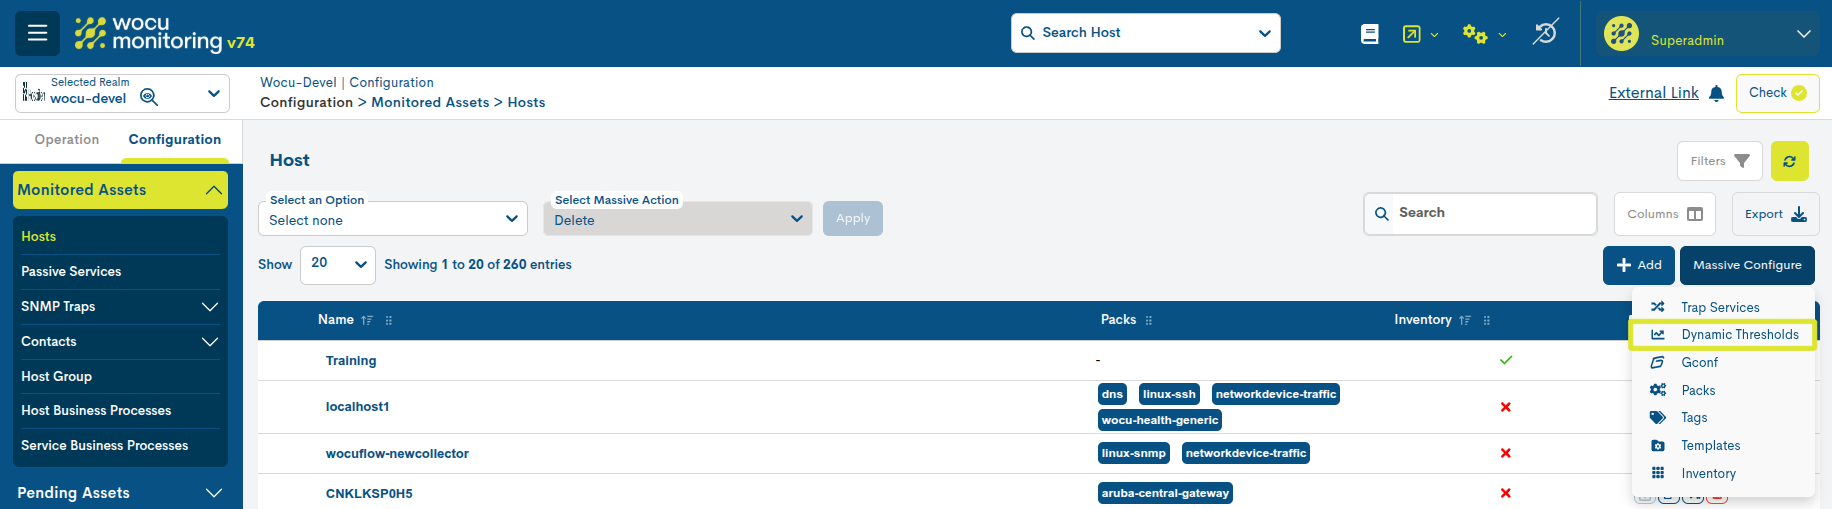
Dynamic thresholds allow for the evaluation of certain metrics taking into account their historical behavior and the range of expected values, facilitating the detection of deviations or anomalous behaviors that might not be identified using static thresholds.
When you select this option, a window appears containing the following fields:
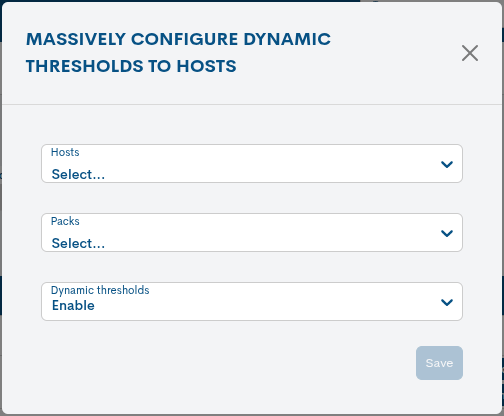
Hosts: allows you to select the hosts to which the configuration will be applied.
Packs: Displays the packs compatible with the dynamic threshold functionality.
Dynamic thresholds: Allows you to select Enable or Disable to enable or disable this functionality based on the selection made.
This action streamlines the management of environments with numerous devices, as it enables the functionality to be activated centrally and reduces the need to make manual changes to each asset.
For example, it is possible to select multiple devices that use the pack networkdevice-cpu and enable dynamic thresholds for all of them in a single operation.
6. New endpoints for monitoring Metrics and Events
Endpoint to list available metrics
This endpoint returns existing metrics for a specific realm(such as CPU usage, latency, or network traffic) and allows you to narrow the searchby specifying a particular device or service.
It’s the ideal starting point if the exact names of the metrics you want to consult later are not known beforehand.These metrics are not the only ones you want to consult later.
GET /api/metrics/realm/<realm_name>/measurements/
Example of a request:
curl -H "Authorization: Token abc123" \
  "https://<dominio>/api/metrics/realm/<realm_name>/measurements/?host=srv-web01"
Example response:
["cpu_usage_user", "disk_free", "network_in", "network_out", "memory_used"]
Endpoint to query the values of a metric
This endpoint returns the actual data (the time series points) of one or more metrics for a given realm, device, or servicewithin a specific time window.
GET /api/metrics/realm/<realm_name>/data/
Details to facilitate its use:
Readable Date Formats: You can specify dates in a standard format (e.g.,
24/07/2026or24/07/2026 14:30:00), without need to use timestamps*.Default range: If you do not specify a date, the information from the last hour will be displayed automatically.
Range limit: The maximum range allowed per query is 7 days.
Auto-discovery of metrics: If you omit metrics from the query, the system will automatically detect them (with a limit on the number of results returned).
Results Control: You can limit and sort the number of results received according to your needs.results
Example request:
curl -H "Authorization: Token abc123" \
  "https:///<dominio>/api/metrics/realm/<realm_name>/data/?host=srv-web01&measurements=cpu_usage_user,disk_free&time_from=24/07/2026%2000:00:00&time_to=24/07/2026%2023:59:00"
Example response:
{
  "data": [
    {
      "metric": "cpu_usage_user",
      "data": [
        { "time": "2026-07-24T10:00:00Z", "host_name": "srv-web01", "value": 42.1, "min": 38.0, "max": 55.3, "unit": "%" },
        { "time": "2026-07-24T11:00:00Z", "host_name": "srv-web01", "value": 39.7, "min": 35.2, "max": 48.9, "unit": "%" }
      ]
    }
  ],
  "total_count": 1
}
Endpoint for querying event monitoring
Allows you to view the event history of a Realm, such as device and service crashes and recoveries, sent notifications, status changes, flapping events, or external commands. Allows you to apply multiple filters (by host, event type, message text, or status) and narrow the search by date range, with the same functionality as the metrics endpoint.
GET /api/events/realms/<realm_name>/events/
Example request:
curl -H "Authorization: Token abc123" \
  "https:///<dominio>/api/events/realms/<realm_name>/events/?host=srv-web01&state_type=HARD&size=20"
Example response:
  {
  "data": [
    {
      "time": 1753349400,
      "host_name": "srv-web01",
      "type": "HOST ALERT",
      "state": 1,
      "state_type": "HARD",
      "message": "PING CRITICAL - Packet loss = 100%"
    }
  ],
  "total_count": 1
}
Endpoint to query syslog events
Allows you to search directly in the syslog logs of a Realm, filtering by device, severity, message, event type, or identifier.
GET /api/events/realms/<realm_name>/events/syslogs/
Example request:
curl -H "Authorization: Token abc123" \
  "https:///<dominio>/api/events/realms/<realm_name>/events/syslogs/?host=srv-web01&severity=err"
Example response:
  {
  "data": [
    { "@timestamp": "2026-07-24T09:12:33Z", "host": "srv-web01", "severity": "err", "message": "disk quota exceeded" }
  ],
  "total_count": 1
}
Note
If the realm_name corresponds to a Multirealm, this endpoint automatically queries the syslog of all the realms that comprise it and returns the combined results.
7. Bulk configuration of Inventory
WOCU-Monitoring introduces a new option to enable the bulk collection of inventory data across multiple hosts, simplifying configuration when this functionality needs to be applied to a large set of assets.
Bulk configuration is available starting from:
Monitored Assets > Hosts > Massive Configure > Inventory.
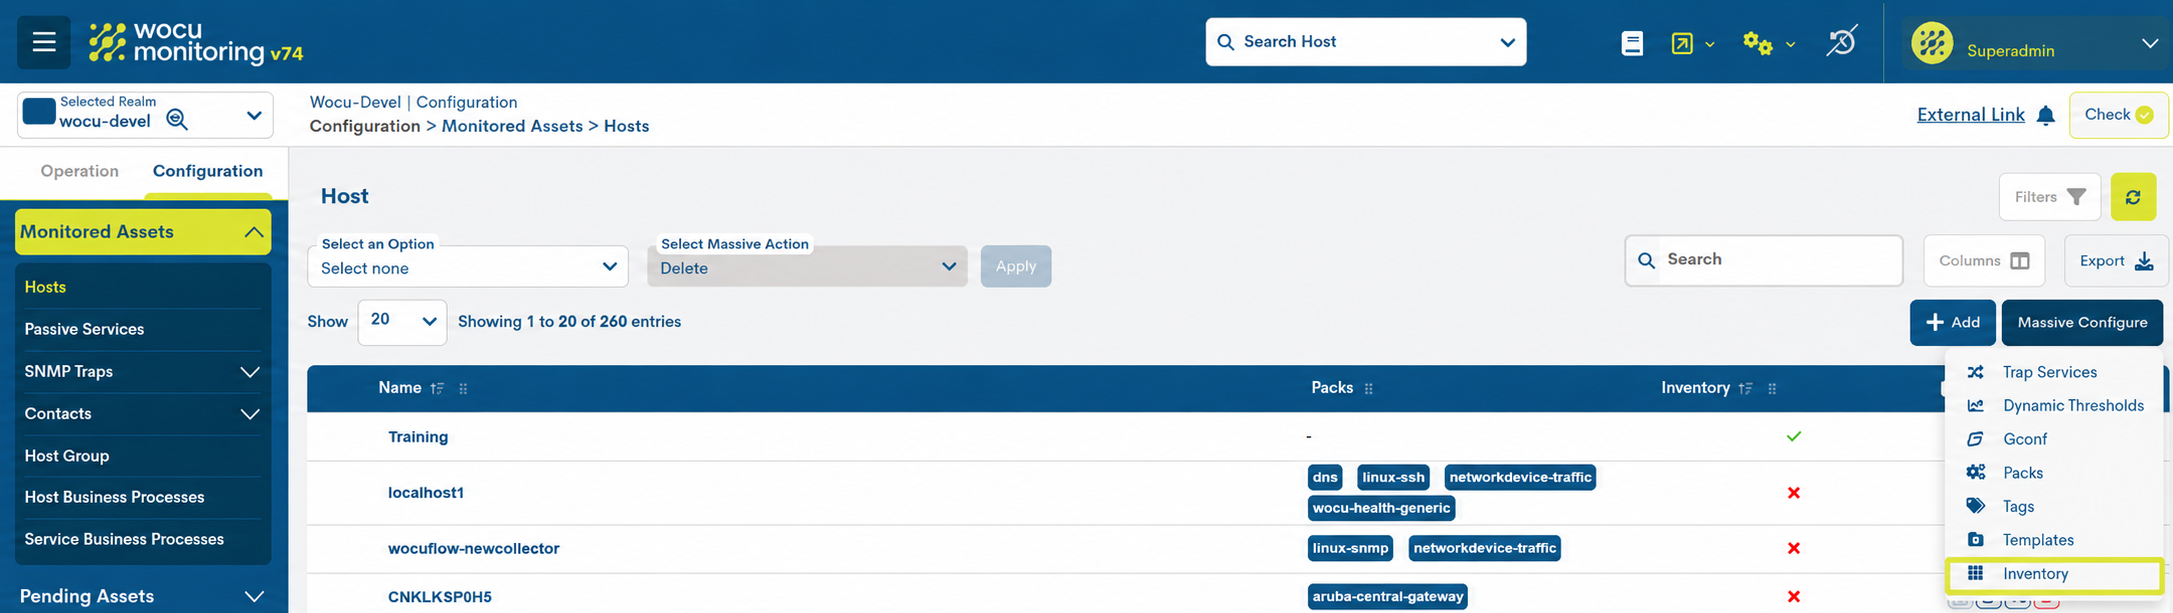
Figure 4: Access to the Inventory bulk action.
This action enables the Inventory functionality on the selected hosts, causing them to begin collecting inventory information associated with the monitored asset.
When you select this option, a window appears containing the following fields:
Hosts: allows you to select the hosts to which the configuration will be applied.
Inventory: enables the collection of inventory data for the selected items.
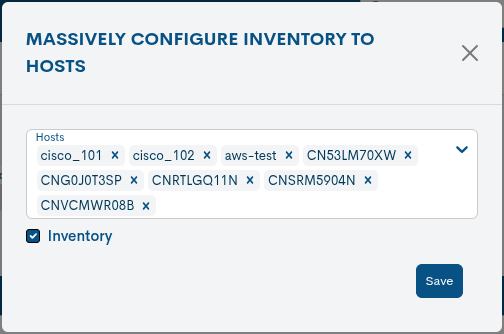
Figure 5: Configuration of the bulk Inventory action.
Once the configuration is applied, the selected devices will begin collecting inventory data, which will subsequently be available from the Inventory tab of the host detail view.
This action streamlines the management of environments with numerous devices, as it enables the functionality to be activated centrally and reduces the need to make manual changes to each asset.
8. WOCU Docker: Managing monitoring and observability realms
WOCU-Monitoring incorporates a new deployment model based on Docker to run and manage different monitoring and observability Realms on the same device. Each Realm operates as an independent environment, with its own configuration, Docker Compose resources, published ports, and backup path.
Deployment of Multiple Realms
The new model allows hosting multiple realms simultaneously without mixing their configuration or resources. To ensure this isolation, each instance features:
Dedicated deployment directory
Specific
wocu.conffileUnique
COMPOSE_PROJECT_NAMEvalueIts own published ports
Independent backup path
Centralized management with wocu-ctl
The wocu-ctl tool centralizes main operational tasks. Administrators can act on the current realm, target a specific one using --realm, or execute supported operations across all realms with --all-realms.
Available operations include:
Start, stop, restart, and update realms
Check their status and get a detailed summary
Validate services through health checks
Review assigned ports and resolved configuration
Check logs and CPU and memory usage statistics
Open a shell in specific services for diagnostic tasks
Key benefits
Isolation: each realm retains its own configuration and resources.
Operational scalability: a single device can run multiple monitoring and observability environments.
Unified administration:
wocu-ctlprovides a common interface for operational and diagnostic tasks.Secure customization: client overlays are applied without modifying the generic build and deployment base.
Simplified maintenance: images can be versioned using
WOCU_IMAGE_TAGand updated consistently across all services.
Other improvements and fixes
Every new version is packed with minor changes, fixes and optimisations that are worth mentioning briefly. Here is a list of the most notable ones in this version:
The Export function has been added to the lists for Contacts, BP Hosts and BP Services. This new option allows you to download the visible data in CSV and JSON formats, making it easier to analyse, process and integrate with other external tools.
A new feature has been added to the Single Metrics Graph widget, allowing you to select a specific time interval on the graph using the mouse in order to zoom in and analyse the data. Once you have made your selection, a new button appears, which allows you to quickly restore the time range originally defined in the widget’s settings.
A new magnifying glass icon featuring a stylised eye has been added to the Realm Selector; it appears next to the names of those realms where the Observability is enabled. This visual cue makes it quick and easy to recognise them.
The AI assistant in the Observability incorporates improvements to reliability and usability. Conversations now display the date and time of each query, allow you to pause ongoing responses, and resolve chat freezes or incomplete replies. Furthermore, errors are clearly displayed on screen, preventing silent failures.
From this version onwards, the Problems view will now display all reported issues, including those with the Acknowledged status, regardless of whether the user preference Filter acknowledged is enabled. However, this preference continues to behave as usual in the Summary views.
The Category selector in the Aggregator Summary section now applies an
ANDlogic when multiple categories are selected. This means that only realms assigned to all the selected categories are displayed, providing more accurate results. Searches with a single category retain the previous behaviour. This new behaviour is indicated in the new help message next to the selector (Results must match all selected categories).The Host creation endpoints in the public API include the new optional field
hostgroups, which allows one or more Host Groups to be associated during the registration process. The field accepts a list of strings, for example:"hostgroups": ["hostgroup1", "hostgroup2"]. If any of the specified Host Groups do not already exist, the endpoint itself will automatically create them.Fixed a bug in the Metrics Evolution reports which could cause the frontend to crash when a metric did not include any of the values
mean,minormax. The visualiser now correctly handles metrics with partial values, preventing errors when any of this data is unavailable.Updated the colour of help messages in Summary Category so that they match the selected theme (Light/Dark) correctly, improving their visibility and ensuring a consistent look and feel with the interface.
An information message has been added during the loading process when the Action Ask IA about a problem is executed, informing the user that the operation may take a few minutes whilst the response is being generated.
A bug has been fixed that could cause the Multimetric Report to fail when a metric was assigned an empty value. The report now handles these cases correctly and continues to display the available information.
The display of the Global Status widget has been improved in narrow spaces. When its width is less than
350 px, the headings are replaced by icons to optimise space and prevent text from spilling over.In the Single Metrics Graph widget, the configuration option Always Show thresholds has been renamed to Show fixed thresholds, providing a clearer description of its functionality and avoiding any potential confusion.
In the Metrics for a specific host, the magnifying glass icon used to adjust the focus of the Y-axis is replaced by a warning icon (a triangle with an exclamation mark), which more accurately reflects its function in relation to the display of thresholds.
Starting with this version, it is possible to view the creation date of a realm directly from the administration module interface. This improvement facilitates the tracking, auditing, and management of realm history on the platform.
About WOCU-Monitoring
WOCU-Monitoring is a multi-purpose monitoring tool that integrates the latest open-source technologies for monitoring, visualisation, metric charting and log management, providing comprehensive visibility into the status and availability of network elements, servers, databases and workstations (among others) using bespoke Monitoring Packs.
In addition to the Free version, the Enterprise version of WOCU-Monitoring allows the deployment of thousands of IP devices in a distributed environment, with customizations tailored to each client’s infrastructure.