Release Notes 69
Publication date: 16/04/2026
This document presents a detailed summary of the new features, functionalities, improvements, and fixes integrated into version 69 of WOCU-Monitoring. With this update, we are responding to the requests and suggestions of our users, while simultaneously aligning ourselves with current market trends and needs.

1. Evolution of the State view: view management and new control options
This version continues the evolution of the Status view, incorporating new features aimed at improving the configuration, organization, and display of information.
The main improvements are detailed below:
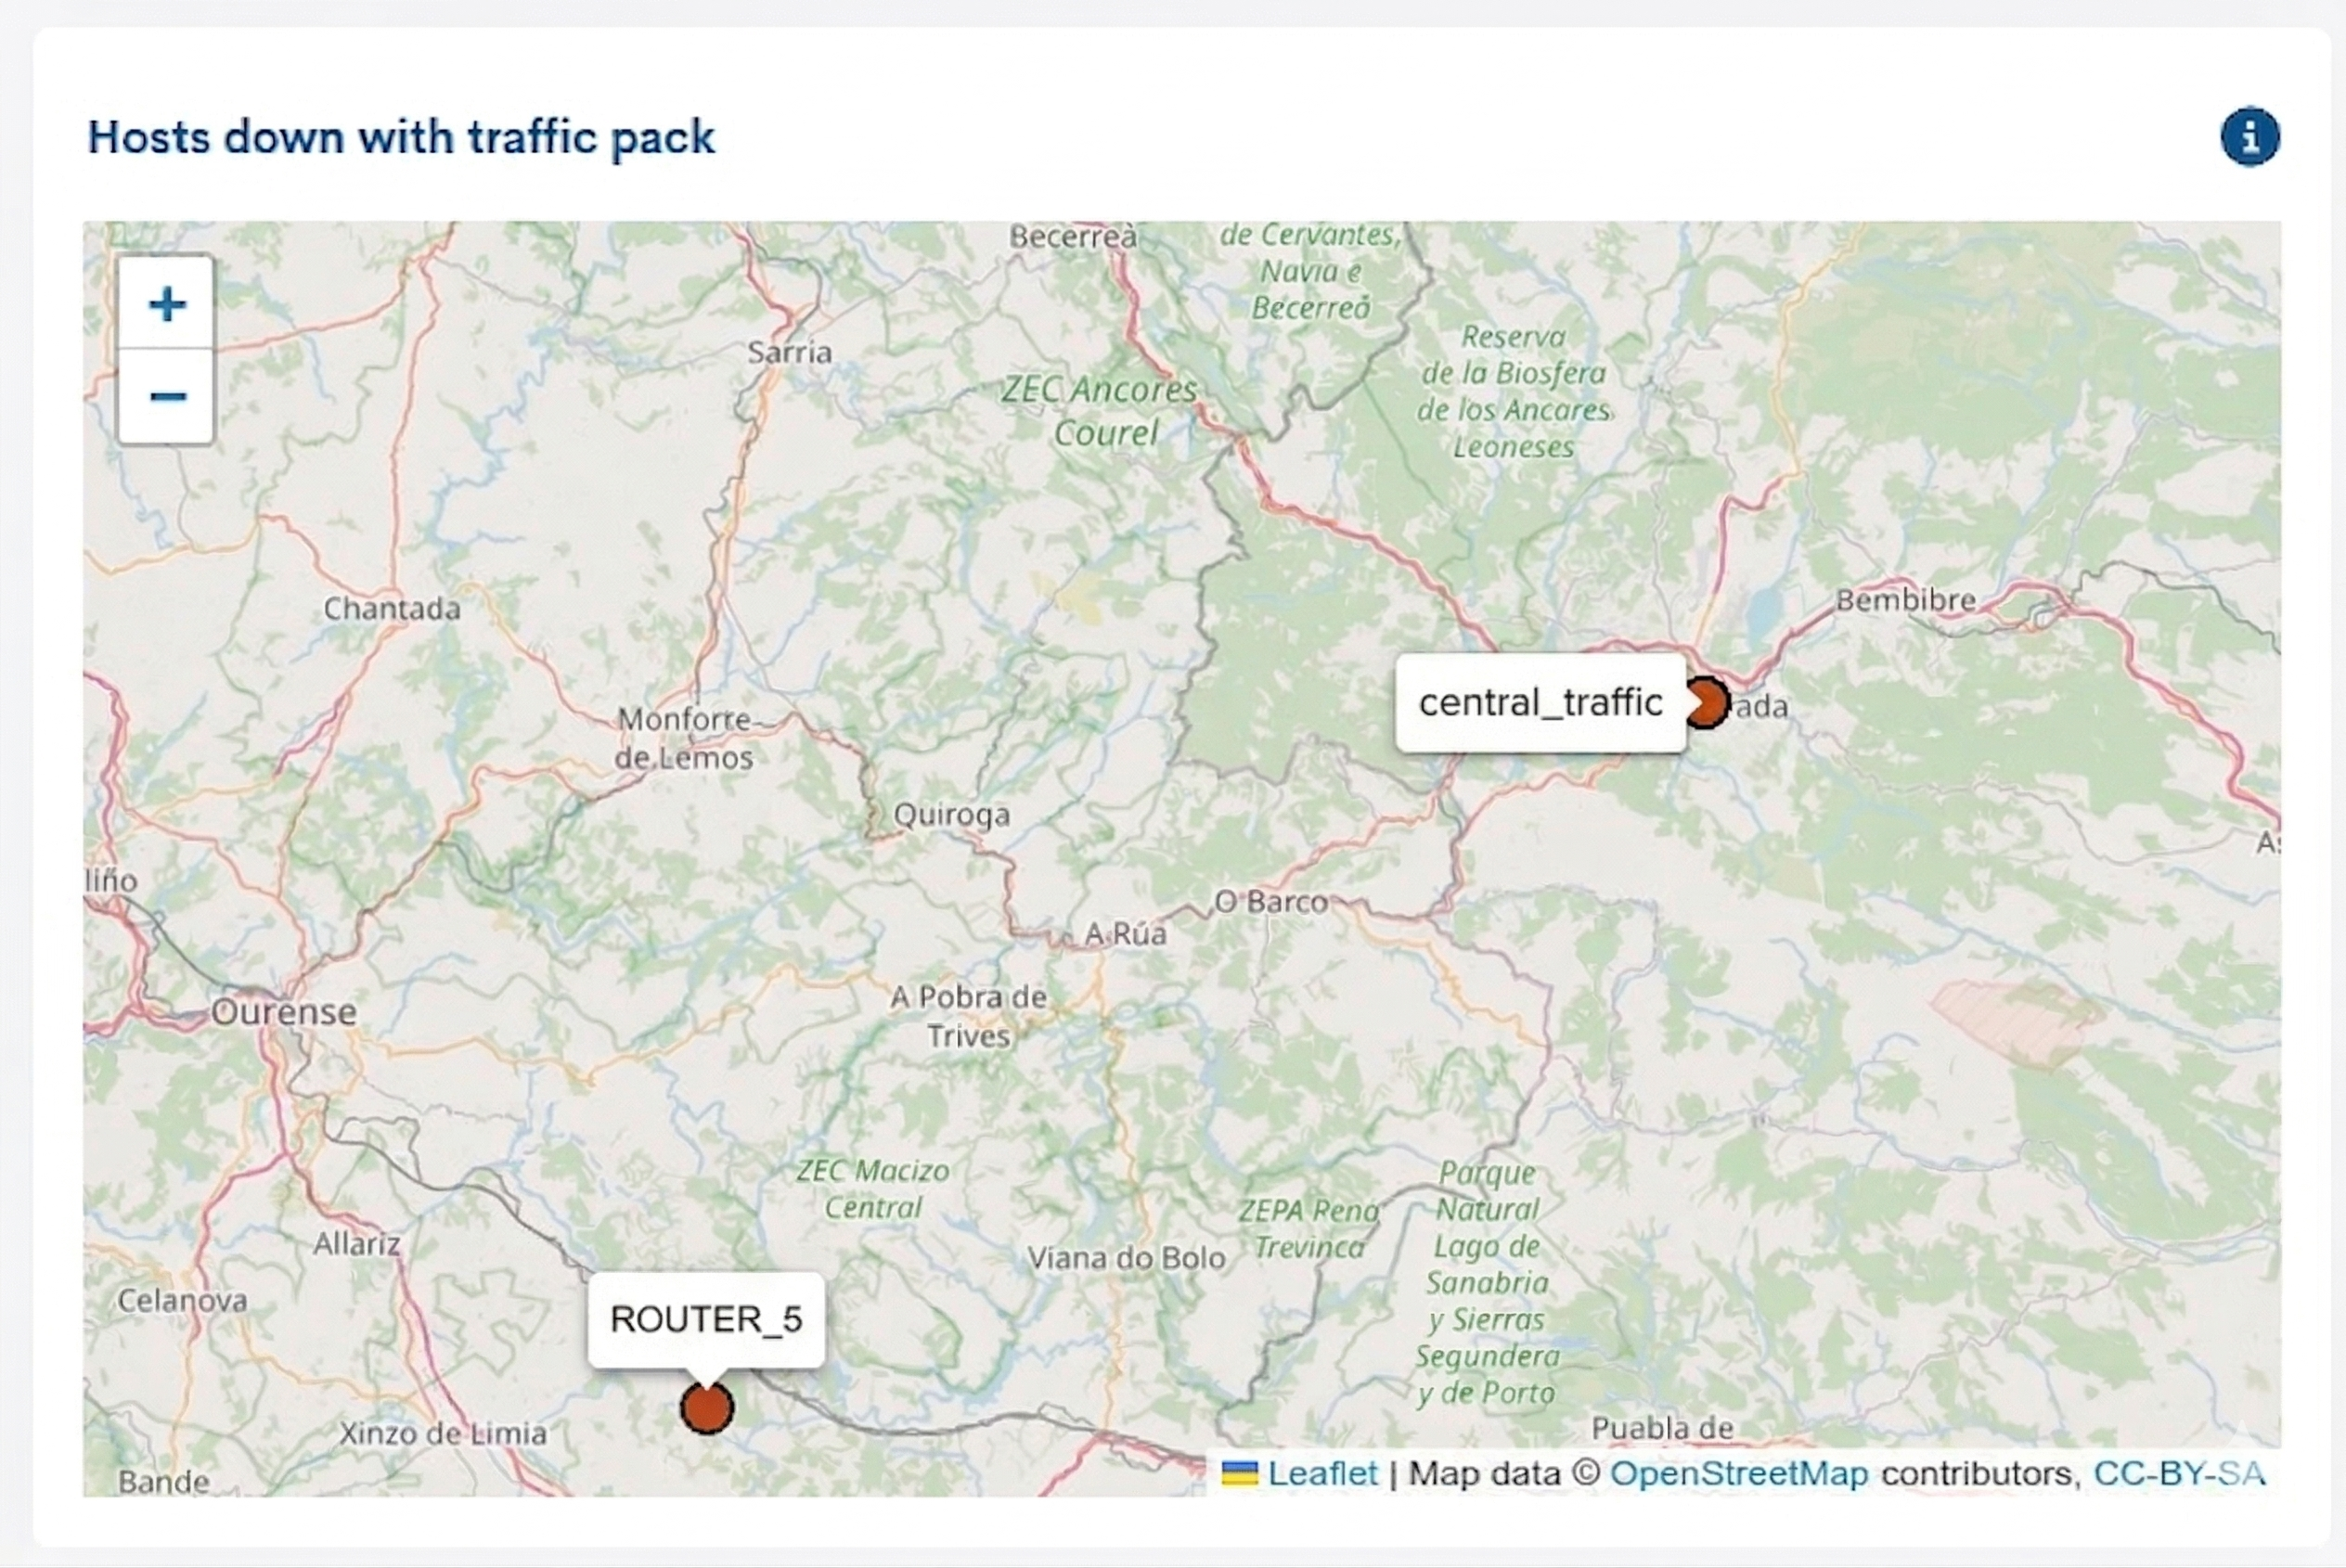
New Geomap widget
A new widget has been added that allows you to create custom geomaps.This facilitates the visualization of specific device groups,devices associated with certain monitoring packages or filteredaccording to their availability status.
For example, it is possible to configure a geomap that displays hosts in a non-operational (DOWN) state that have the Networkdevice-traffic monitoring pack assigned.
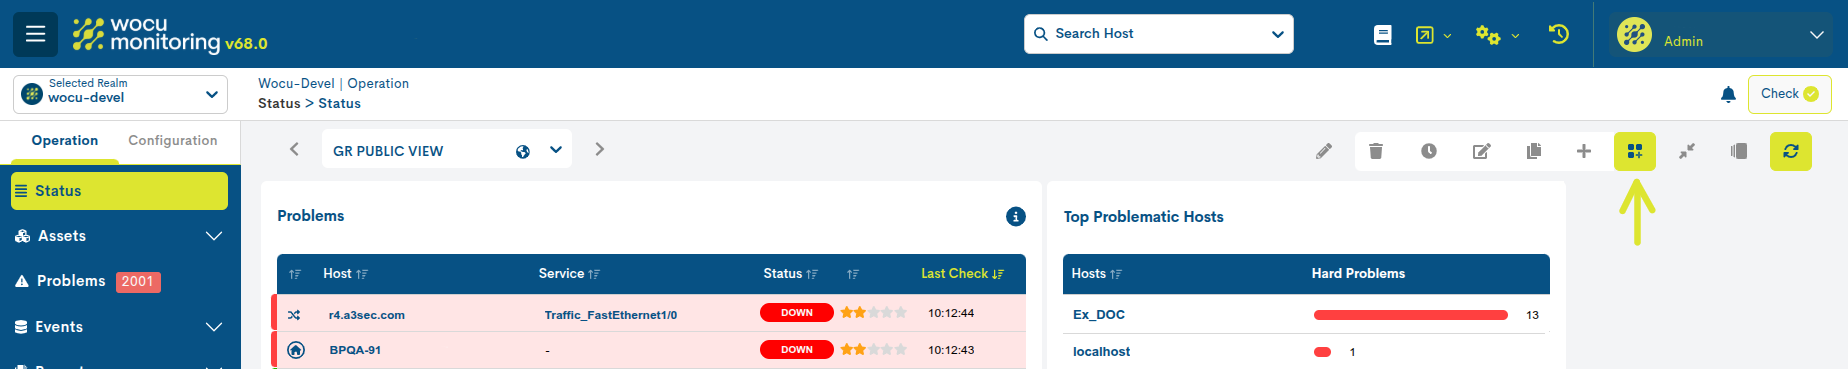
Configuration and management of widget views
The ability to create and manage multiple widget views has been added. Each view groups a specific set of widgets tailored to a particular need and can be defined as public or private.
Through the Setting views button, the user can perform various configuration actions, such as creating new views, duplicating them, editing or deleting them.
Additionally, the carousel functionality is incorporated which, when activated, allows the views to be displayed sequentially at a configurable interval(60 seconds by default).
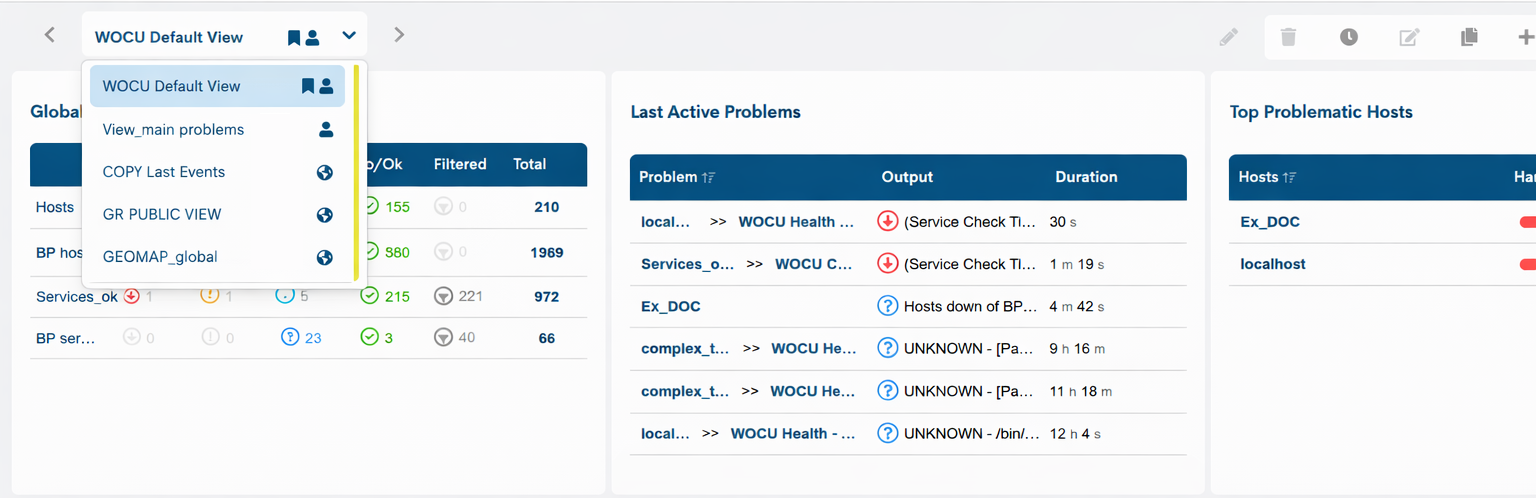
View selector
A view selector has been added to facilitate navigation between them. This indicator also shows whether the view is public or private, as well as whether it is set as the default in the system.
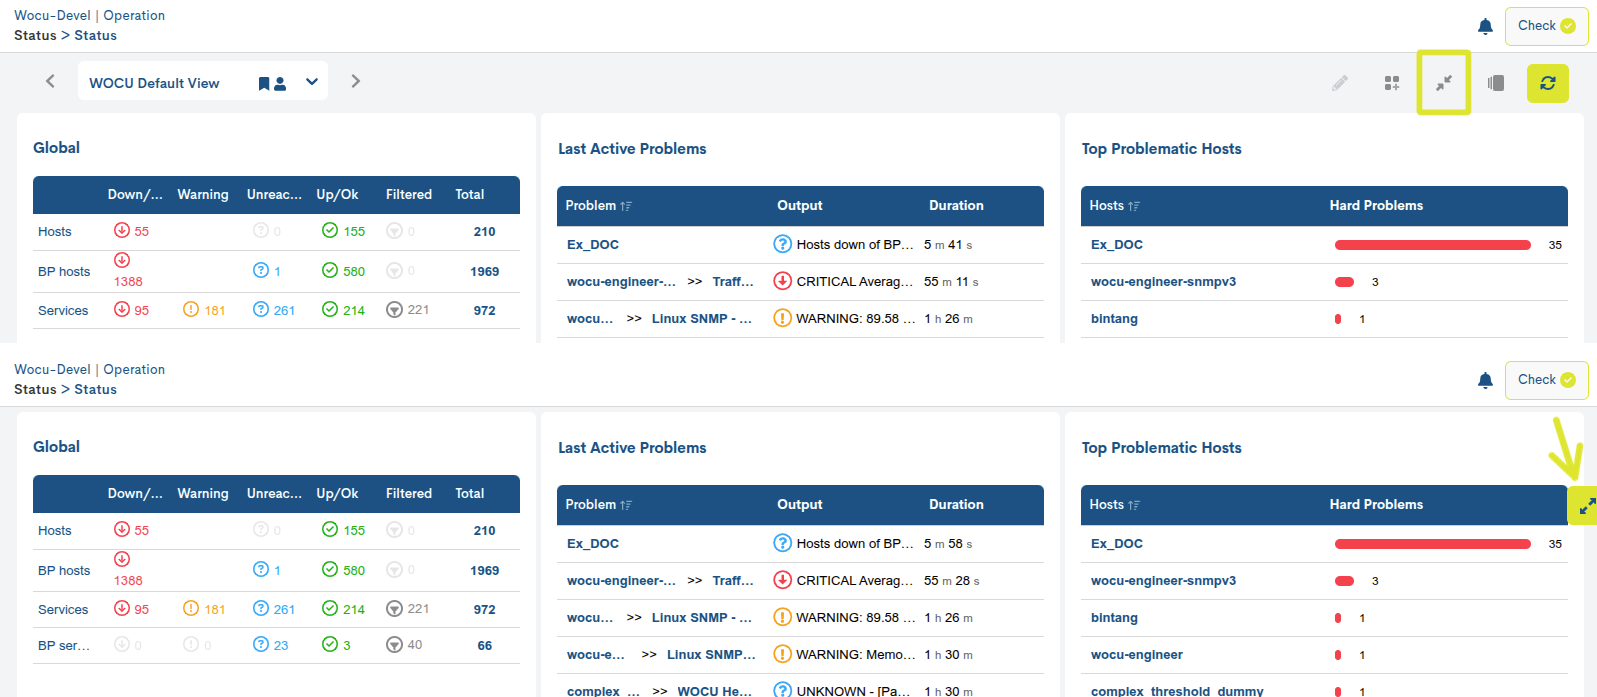
Hide and pin global controllers
The option to hide the global view controls and the view selector has been added, allowing you to optimize the available screen space. While the controls remain visible, they will stay fixed even on large dashboards, facilitating constant access while scrolling.
2. Incident logging in Hosts
This version expands operational management capabilities by incorporating a new feature that allows incidents to be recorded directly on monitored devices. Users can link tickets from external ticketing tools, centralizing all relevant information within the context of the affected device.
Through the action Add ticket to Host applicable to a Device, the following information associated with each incident can be recorded, among other data:
External ID: ticket reference in the source tool.
Author: person who records or reports the incident.
Message: detailed description of the problem, context, or actions taken.
Type: categorization of the incident (e.g., incident, maintenance, observation, etc.).maintenance, observation, etc.)
External URL: Direct link to the ticket on the ticketing platform original.
This functionality allows not only the documentation of incidents, but also enriching the device history with key operational information,facilitating monitoring, traceability, and collaboration between teams.
This improvement strengthens the integration between technical monitoring and incident management, providing a more complete and contextualized view of the infrastructure’s status.
3. Expanded information in multi-channel notification
From now on, notifications sent to Slack, Discord, Telegram and Demisto will no longer be basic alerts but will become more comprehensive notifications, matching the level of detail that was previously only available via email.
New fields have been added that can be incorporated into the body of the notification:
Notification message: Custom message to include in the notification. You can combine text and macros to provide detailed context for the alert.
Include service pack: Adds information about the associated monitoring service.
Include asset hostgroups: Includes groups of associated devices.
Include last asset events: displays the latest generated events.
Include asset realms: Indicate relevant realms.
Extra info: Additional information such as the Alias and Business Impact.
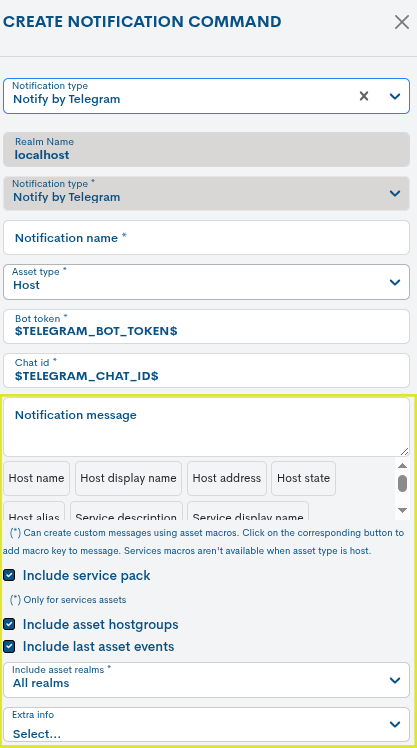
Thanks to this improvement, all notification channels offer a more complete and consistent level of detail, facilitating better analysis and response to events without relying exclusively on email.
4. Bulk sending of Devices to the Gconf Module from Monitored Assets
In this version, the functionality for bulk sending of Hosts to the configuration management module GConf is incorporated, from the Monitored Assets inventory > Hosts.
This new action expands upon the behavior already available for Packs, Templates, and Tags, allowing for the simultaneous sending of multiple devices to the GConf. Specifically, the selected devices will be automatically added to the Device Inventory, where they can be managed centrally within the configuration system.
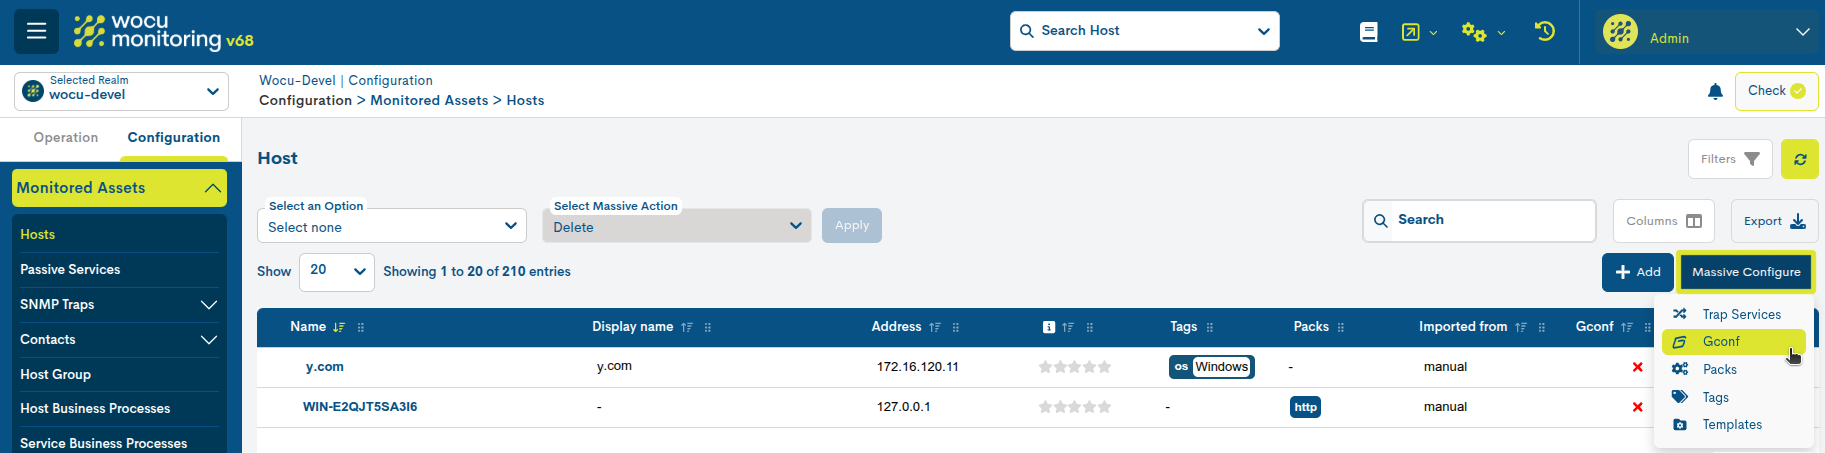
By selecting the Gconf option within the Massive Configuration dropdown, a new window will open for the user to select and submit device groups directly to the GConf module.
Once the action is completed, the devices will be registered in this new location, eliminating the need for manual registration and facilitating their subsequent configuration through templates and global policies.
5. New customizable information banner: Login Disclaimer
Starting with this version, WOCU-Monitoring incorporates a fully customizable information banner, also known as Login Disclaimer.
This component allows administrators to configure messages that will be automatically displayed immediately after a user successfully logs in. It is particularly useful for disseminating relevant information such as legal notices, security policies, operational notifications, or important announcements related to the platform.
Once the message content is configured, the system will display a pop-up window overlaid on the main interface after user authentication. This message is presented clearly and visibly, ensuring that the information does not go unnoticed.
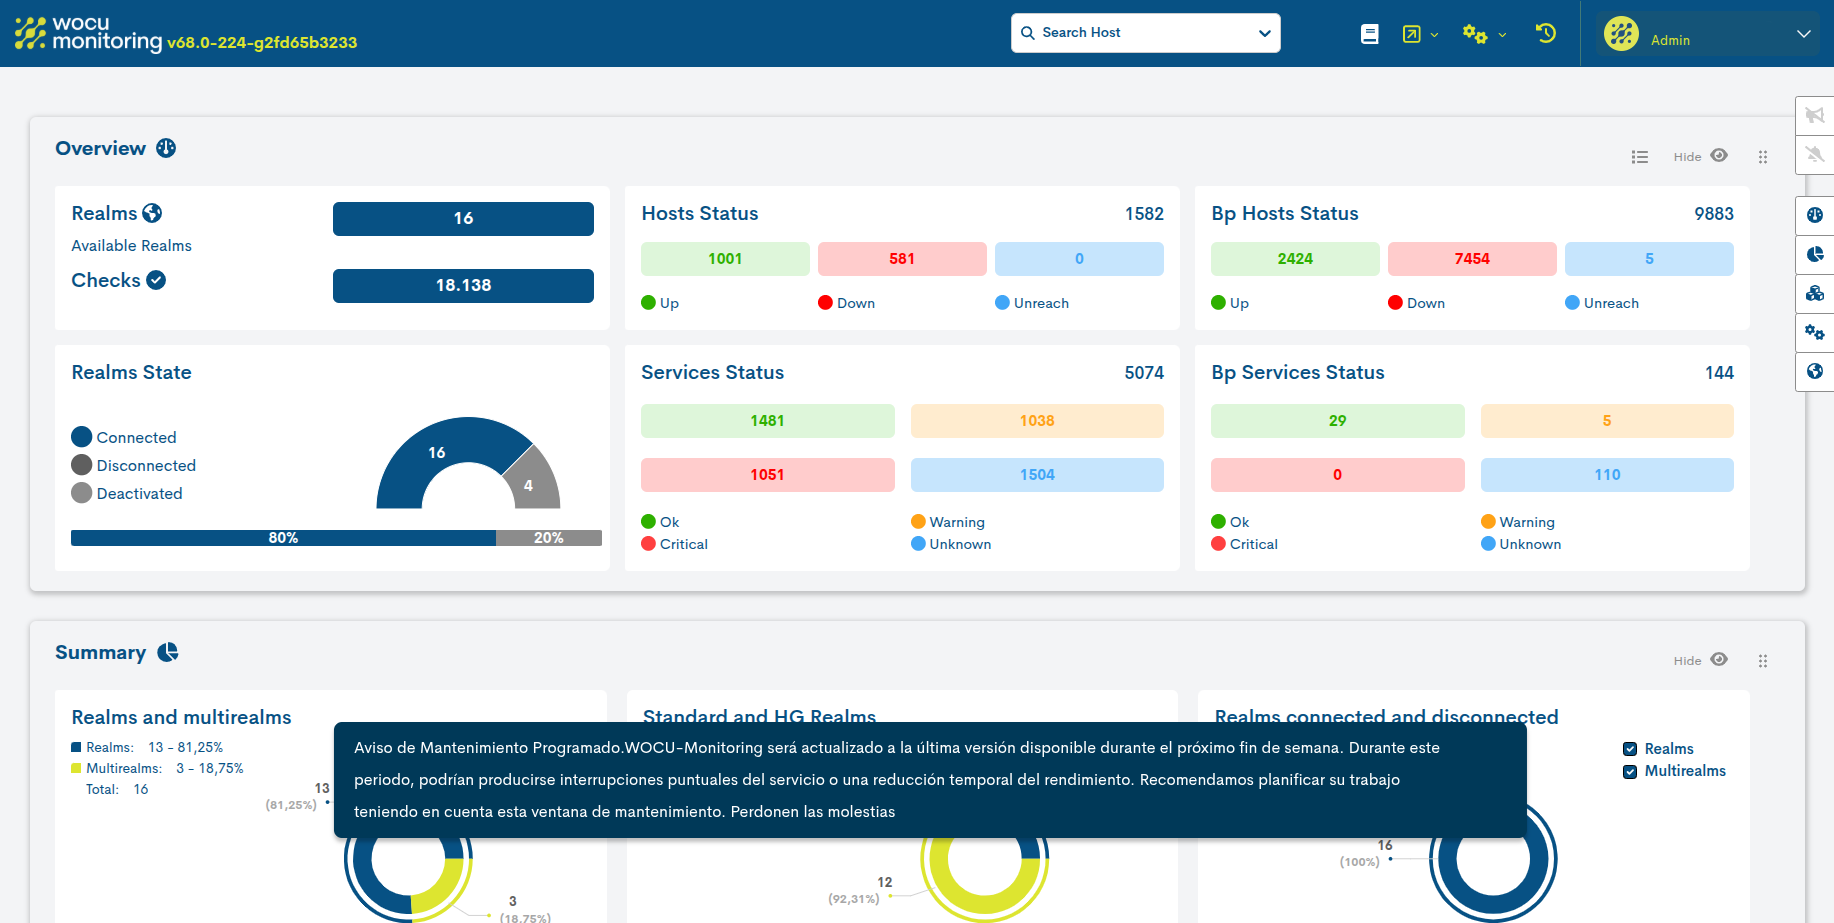
To continue using the platform normally, the user simply needs to click anywhere on the blue area surrounding the message (outside the main box), which will close the notification quickly and easily.
6. New endpoint for retrieving hosts and services from a Realm
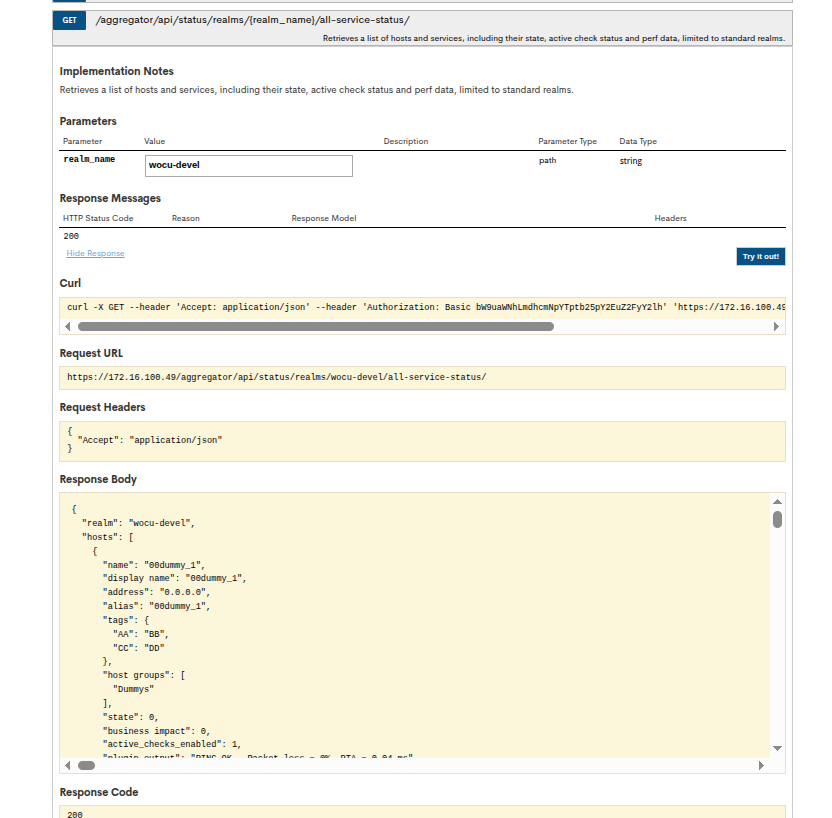
The Public API of WOCU-Monitoring has been updated with a new endpoint that allows querying the complete list of Hosts and Services associated with a specific Realm, providing a unified view of the status of the infrastructure monitored within it.
GET /aggregator/api/status/realms/{realm_name}/all-service-status/
New fields in Hosts
The information returned for each Host is expanded with the following attributes:
Alias
Display Name
Groups
Tags
Business Impact
Perf Data
Additional information in Services
The Services response has been enhanced by including performance data metrics, in addition to the information already available on status and active checks.
The result of querying this endpoint includes detailed informationfrom both Hosts and Services, incorporating new relevant fieldsto improve the visibility and contextualization of assets.
7. Scalable architecture improvement with MySQL cluster and distributed aggregator in high availability
This version introduces a significant improvement to the WOCU-Monitoring architecture, focused on horizontal scalability, high availability, and system resilience.
The following are the issues that have been addressed:
Database Architecture: MySQL Cluster
A single MySQL cluster is incorporated as the core for data persistence for the entire WOCU-Monitoring ecosystem, including data from the aggregator and monitoring systems.
The cluster is designed to provide:
High availability (HA) in the face of node failures.
Horizontal scalability, allowing the incorporation of new database nodes.
Load balancing, distributing queries among the available nodes to optimize performance and avoid bottlenecks.
Aggregator service: High availability and scalability
Furthermore, the WOCU-Monitoring aggregator service is evolving towards a distributed architecture, incorporating load balancing between active aggregator instances, ensuring efficient distribution of processing.
Integration of monitoring systems
Monitoring systems can also be part of the project and connect directly to the MySQL cluster, taking advantage of its high availability without changes to its operating logic.
8. Expanded filters in Gconf Scheduling Tasks
New fields have been added to the task creation action scheduled for the automated execution of backups (Add Scheduling Tasks), within the GConf.
The new fields available in the configuration form are:
Schedule Type: Allows you to select the type of scheduled task:
Backup: Creates backups of the selected devicesin the settings.
Bulk Push: Allows you to apply configurations in bulk by uploading a CSV file and selecting a template. The system will use this information to automatically apply the configuration to the devices according to the established schedule.
Model: Allows you to limit the execution of the task to devices of a specific model.
Technology: allows you to select devices based on the technology they use.
Version: Allows you to filter devices according to their software version.
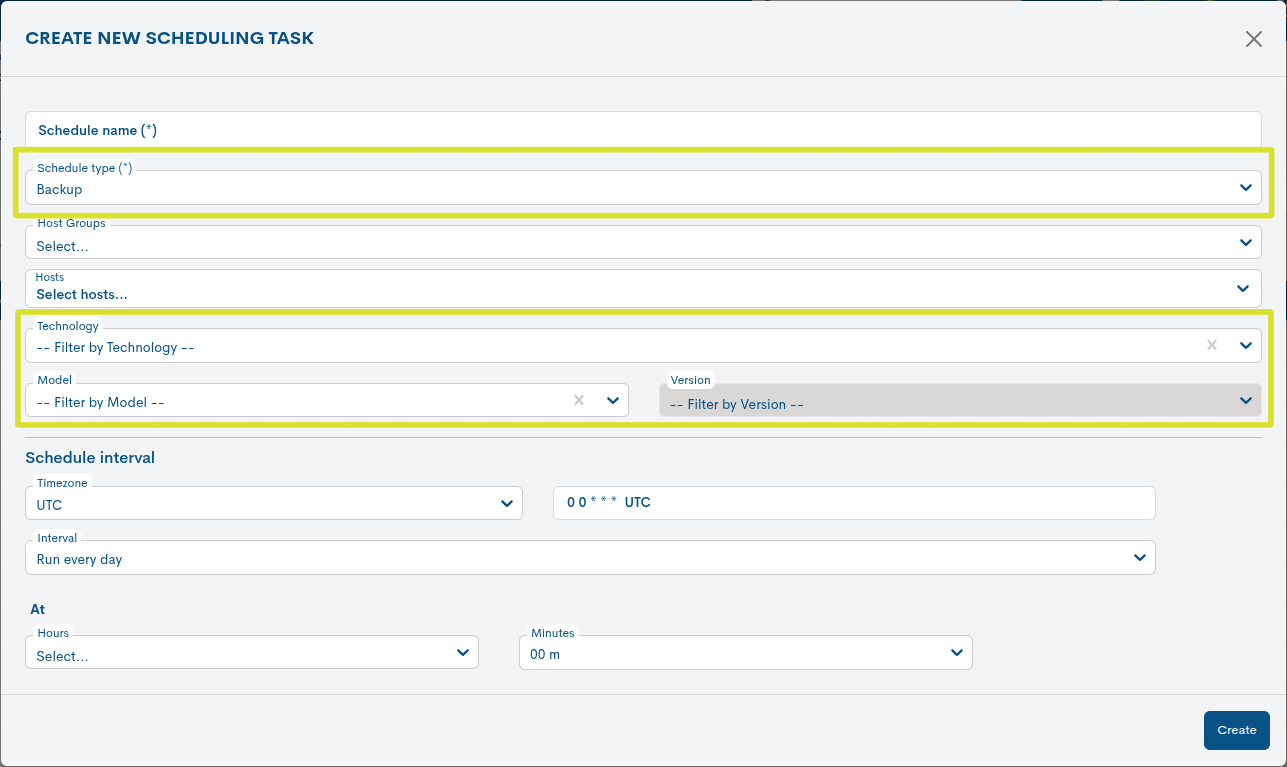
This enhancement improves filtering capabilities in scheduled backup tasks, facilitating a more precise selection of the devices on which the task will be performed.
Furthermore, the fields work cumulatively. For example, if a Hostgroup, a specific model, and a tag are configured, the task will be executed on the resulting set that meets these criteria in combination.
9. Security enhancement: JWT authentication
Authentication using JWT has been implemented in our public APIto ensure more secure and controlled access to resources.
Token Generation: A new endpoint has been added that allows you to generate a token using basic authentication.
Validity: Tokens are valid for 1 hour and must be renewed once they expire.
Authorization required: All API requests must include the header
Authorization: Bearer <token>.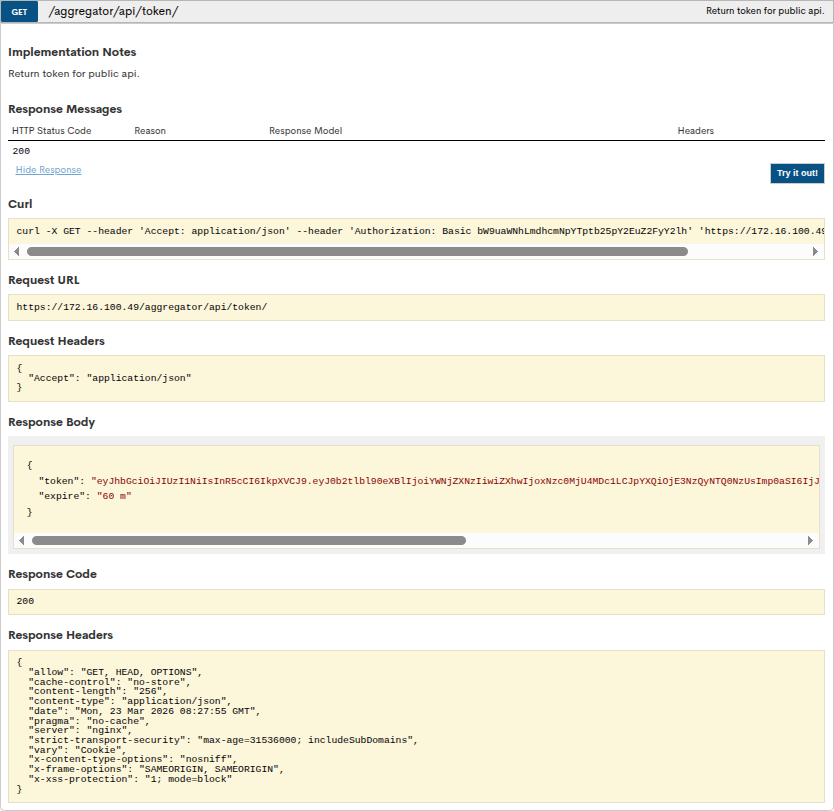
10. New Chatbot integrated into the WOCU-Monitoring user manual
A new intelligent chatbot has been incorporated into the WOCU-Monitoring user manual to facilitate access to information and improve the user experience.
This conversational assistant allows you to resolve doubts quickly and contextually, providing precise answers about how the platform works. It is available in the lower right corner of the screen, allowing you to access it at any time while consulting the manual.
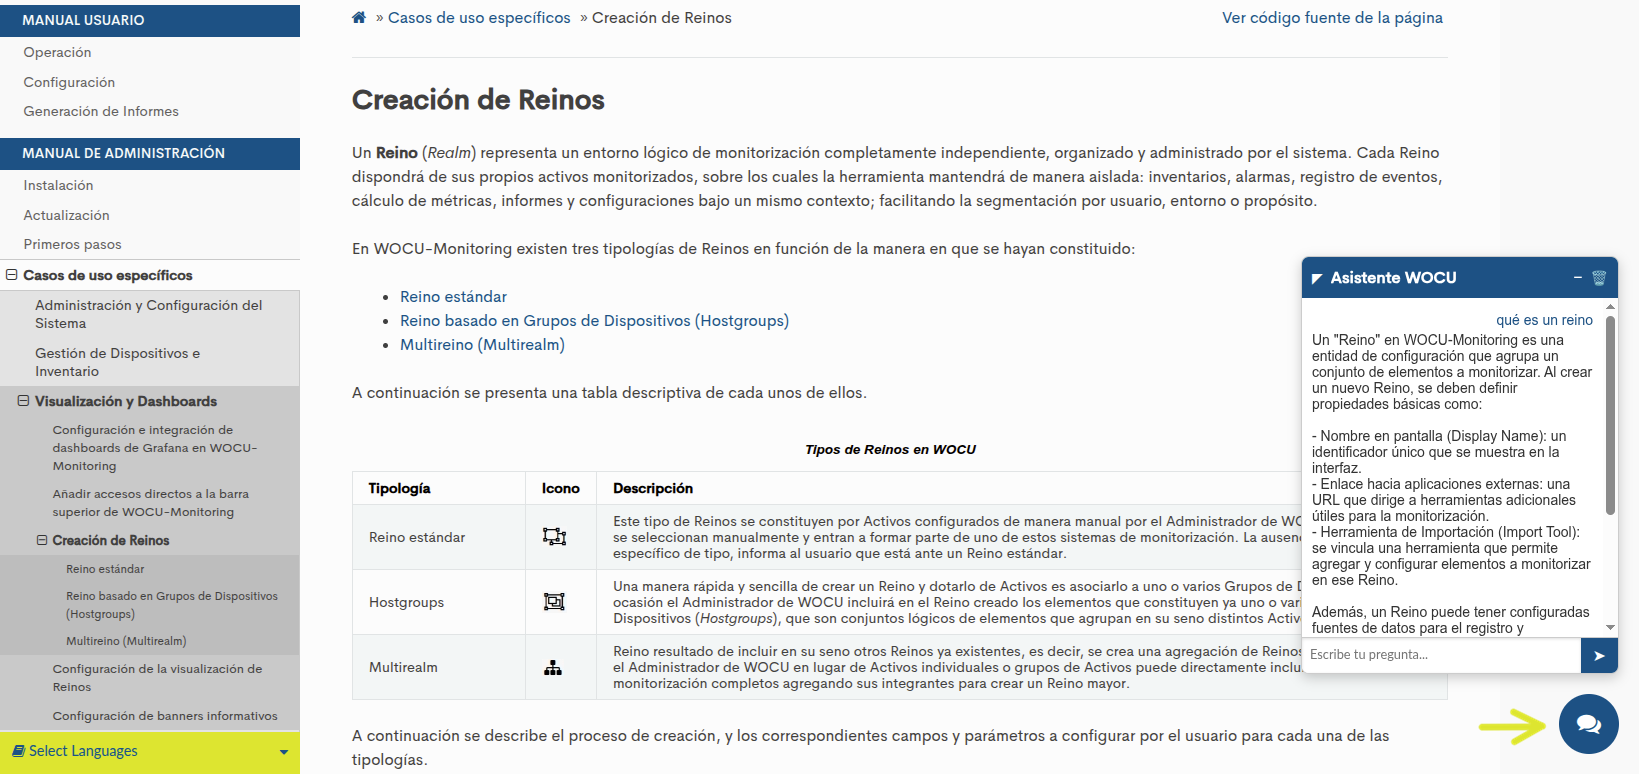
Being integrated directly into the manual eliminates the need to navigate through multiple sections to locate specific information, thus reducing search time and access to solutions.
We invite all users to explore this new feature and take full advantage of its benefits.Take full advantage of it.
11. New integrations in the Monitoring Packs Catalog
Check out our catalog of Monitoring Packages at the following link.
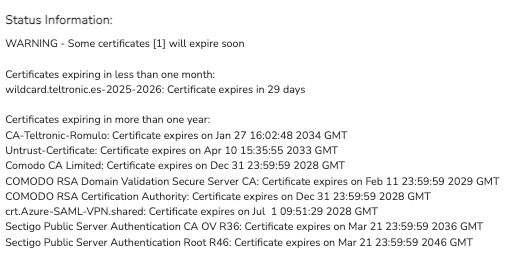
New Palo Alto Certificates package
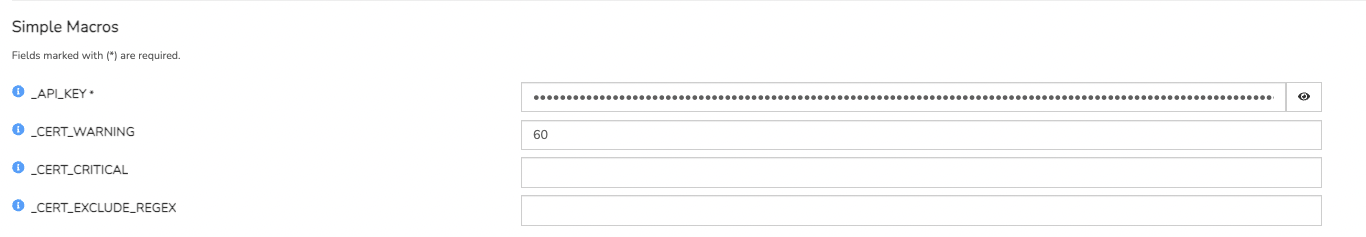
The new Palo Alto Certificates package has been created, designed specifically for monitoring certificates installed on a Palo Alto device. Through the device’s API, the system automatically detects installed certificates and generates alerts in case of imminent expiration or expiration.
Furthermore, it allows you to customize alert thresholds and use regular expressions via a macro to exclude specific certificates.
The package generates a single service with information from all the certificates:

The extended output of the service displays detailed information for each certificate:
This is the package configuration window:
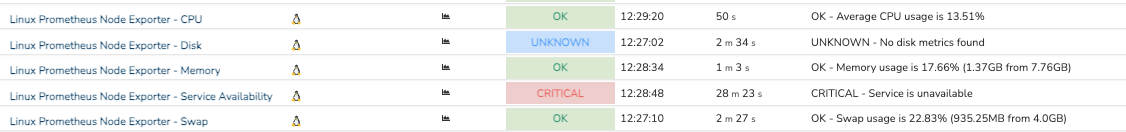
New Linux Prometheus Node Exporter pack
The new Linux Prometheus Node Exporter package has been created, which allows you to obtain health and performance metrics from Linux systems through the Prometheus node-exporter API.
The services currently included in the package are:
CPU
Memory
Swap
Disk
Service_availability
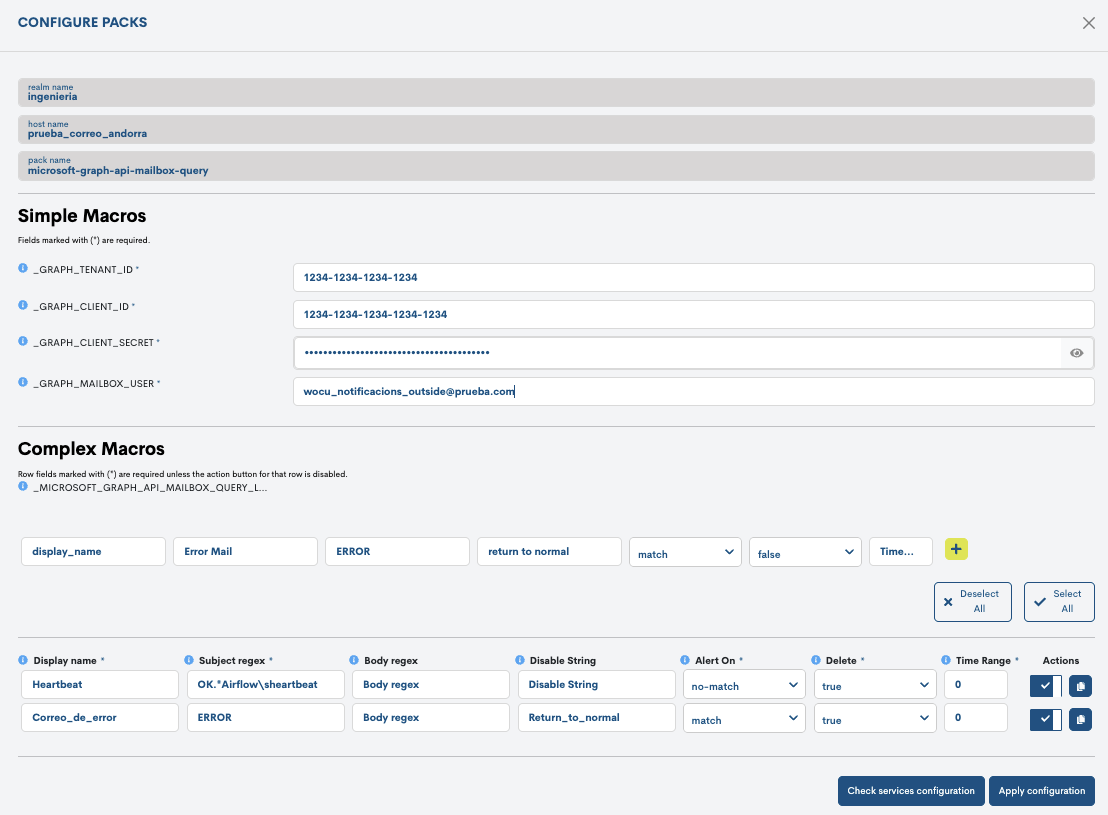
New Microsoft Graph Api Mailbox Query pack
The new Microsoft Graph API Mailbox Query package has been created designed for querying email mailboxes using the Microsoft Graph API.
This monitoring package allows you to configure search criteria based on the subject and/or body of messages, as well as the alert logic for each case, whether due to the presence or absence of emails. It also allows you to define whether the emails found should be deleted and to set the time range for the search.
This pack is especially suitable for scenarios such as:
Monitoring processes that notify via email.
Validation of receipt of critical emails.
Automation of alerts based on messaging events.
Alert management via control emails (clear/disable).
Pack configuration:
Services view:

Other improvements and repairs
Every new version is full of small changes, fixes, and optimizations that are worth briefly highlighting. We’ll now list the most notable ones in this version:
UI
The icons for host and service monitoring packs are now displayed in their own separate column, instead of being embedded in the asset name. This column can be reordered or hidden. It is already visible in:
Problems inventory.
The design of the buttons for running and importing Snapshots, as well as the edit configuration button for hosts, has been updated, unifying the aesthetics throughout the application.
Added the Host and Service names to the view header Metrics of their respective modal views to improve the traceability of the displayed data.
The column and field titles have been updated in various tables of the application. Specifically:
The Acts, Actions, Type columns and the pack icons monitoring column have been replaced by a single (ℹ) button.
The Protected column of the table Monitored Assets has also been replaced by the (ℹ) button.
The information fields Message, Status info and Services Info will now be called Info.
These changes aim to unify terminology and nomenclature, thus facilitating understanding. Furthermore, by reducing the space occupied by headings, table customization is improved, allowing for adding or removing columns and including a greater number of them.
Starting with this version, the metrics preview icon in global listings will display a maximum of two metrics. If more exist, a link will be enabled that redirects the user to the full metrics view to see the remaining ones.
An issue with the PDF export of Metrics Evolution Reports, which associated metrics with incorrect hosts, has been fixed. From now on, host-specific reports will display the corresponding data.
The export function in the inventory element tab of the gconf module has been optimized. Now, the system will only export manually selected equipment, but if no selection is active, it will automatically export the entire inventory.
An error in the editing of programming of a report has been fixed. This error occurred when modifying the Schedule interval parameter, which prevented the view from loading correctly and forced the user to restart the session.
The behavior of the metrics charts has been modified so that null values are no longer connected. From now on, missing data will be represented as empty spaces, ensuring a more accurate representation of the actual data. An informative legend has been added explaining this change.
A bug that prevented the correct display of names and labels for custom metrics has been fixed. Additionally, the system has been adjusted so that multiple charts load their structure without errors.
Table headers have been improved to adapt correctly to different screen sizes, preventing text from being cut off and improving overall display.
The recognition of macros (simple and complex) in Pending Assets has been optimized, allowing for more accurate and reliable identification of assets during inspection.
API / Backend
This fixes a problem introduced when implementing complex filters in the Assets views.
Security
TLS versions were restricted to the most secure ones, prioritizing TLS 1.3 and TLS 1.2. Additionally, the application of security headers was reinforced using the always modifier for HSTS, X-XSS Protection, X-Frame-Options, and X-Content-Type-Options, ensuring that they are consistently sent in all responses.
WOCU-Agents
It is now possible to define the logging level from the configuration file, making the
--debugparameter obsolete.An SQLite-based caching system is added to temporarily store data not sent to the API.
The
time_executionoption has been added to the plugin settings.A problem in the application of the log level has been corrected, ensuring thatit is set correctly according to the defined configuration.
WOCU-Packs
The ability to add advanced filters to the discover of complex macros in packs has been integrated through the
discover_argumentssection. The integration now automatically detects and displays any filter defined in the.packfile. This allows any new criteria added (e.g., Access Point) to appear in the discover without needing to modify the integration.The missing SNMPv3 protocols have been added to the available options in the packs.
The complex macro key in the networkdevice-traffic-cumulative package has been corrected.
The NTP service of the esx-host package is corrected by disabling the SSL certificate verification.
The
container_cpu_usageservice has been corrected and threshold macros have been added to the docker package.The interpretation of the interference metric obtained viaSNMP in the aruba-alcatel-wifi-controller package has been corrected.
Token generation for accessing the Pure1 API has been corrected in the pack purestorage.
The behavior of the wocu-latency package has been corrected when there are no services to account for.
Software updated
As always, other pieces of software have been incorporated and updatedin this new version of WOCU-Monitoring:
Software |
Previous version |
Current version |
Observations |
|---|---|---|---|
Nodejs |
20.19.4 |
22.16.0 |
|
Iconify/tools |
4.1.4 |
5.0.5 |
|
jest-environment-jsdom |
29.7.0 |
30.3.0 |
https://www.npmjs.com/package/jest-environment-jsdom/v/30.3.0 |
css-minimizer-webpack-plugin |
3.1.1 |
8.0.0 |
https://github.com/webpack/css-minimizer-webpack-plugin/blob/v8.0.0/CHANGELOG.md |
Leaflet |
1.6.0 |
1.9.4 |
About WOCU-Monitoring
WOCU-Monitoring is a multipurpose monitoring tool that integrates the latest Open Source technologies for monitoring, visualization, metric graphing, and log management, providing broad visibility into the status and availability of network elements, servers, databases, and workstations (among others) using custom Monitoring Packs.
In addition to the Free version, the Enterprise version of WOCU-Monitoring allows the deployment of thousands of IP devices in a distributed environment, with customizations tailored to each client’s infrastructure.