Release Notes 71
Date of publication: 10 June 2026
This document provides a detailed summary of the new features, functionalities, improvements and bug fixes included in version 71 of WOCU-Monitoring. This update addresses the requests and suggestions made by our users, whilst ensuring we remain in line with current market trends and requirements.
1. Integration of Elasticsearch 9 into WOCU-Monitoring
Support for Elasticsearch 9 has been added as a new backend technology in the Creation of Realms feature of WOCU-Monitoring.
From this version onwards, the Realms registration form includes the new Backend Technology selector, which allows you to choose between the traditional Livestatus & Influx model and the new Elasticsearch-based integration.
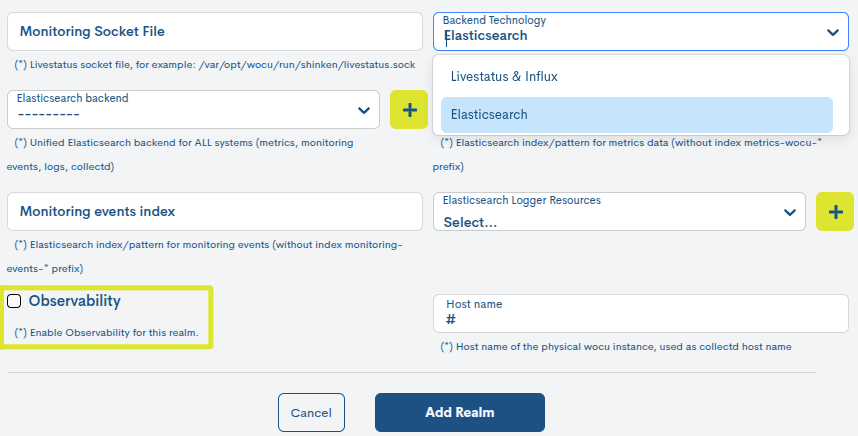
Figure 1: New Backend Technology selector.
By selecting Elasticsearch, Reino is set up to query and utilise the information stored in an instance of Elasticsearch 9, which acts as a centralised backend for metrics, monitoring events and, where applicable, observability-related data.
This integration enables:
Centralise the Realm’s operational information in Elastic.
To centralise the viewing of metrics and monitoring events.
To facilitate the use of historical data.
Preparing the Realm for advanced observability capabilities.
To reduce reliance on separate back-ends for different types of data.
In addition, new specific configuration fields have been added, such as the Elasticsearch backend, the metrics index, the monitoring events index and the option to enable the Observability module.
Important
At present, integration with Elasticsearch is limited to Elasticsearch 9.
2. Dynamic thresholds for network metrics
Support for dynamic thresholds has been added to the networkdevice-cpu, networkdevice-mem and networkdevice-traffic monitoring packs.
This improvement makes it possible to assess certain monitored metrics not only on the basis of static thresholds, but also by comparing the observed value with the expected values obtained. These expected values define a range of typical behaviour for each metric, calculated on the basis of available historical data.
When the current value deviates from the expected range, the check generates a WARNING status and displays a specific message in the output, indicating that the metric is behaving abnormally. For example, if CPU usage exceeds the expected range for that time by 10 per cent, WOCU-Monitoring will flag the situation as a significant deviation.
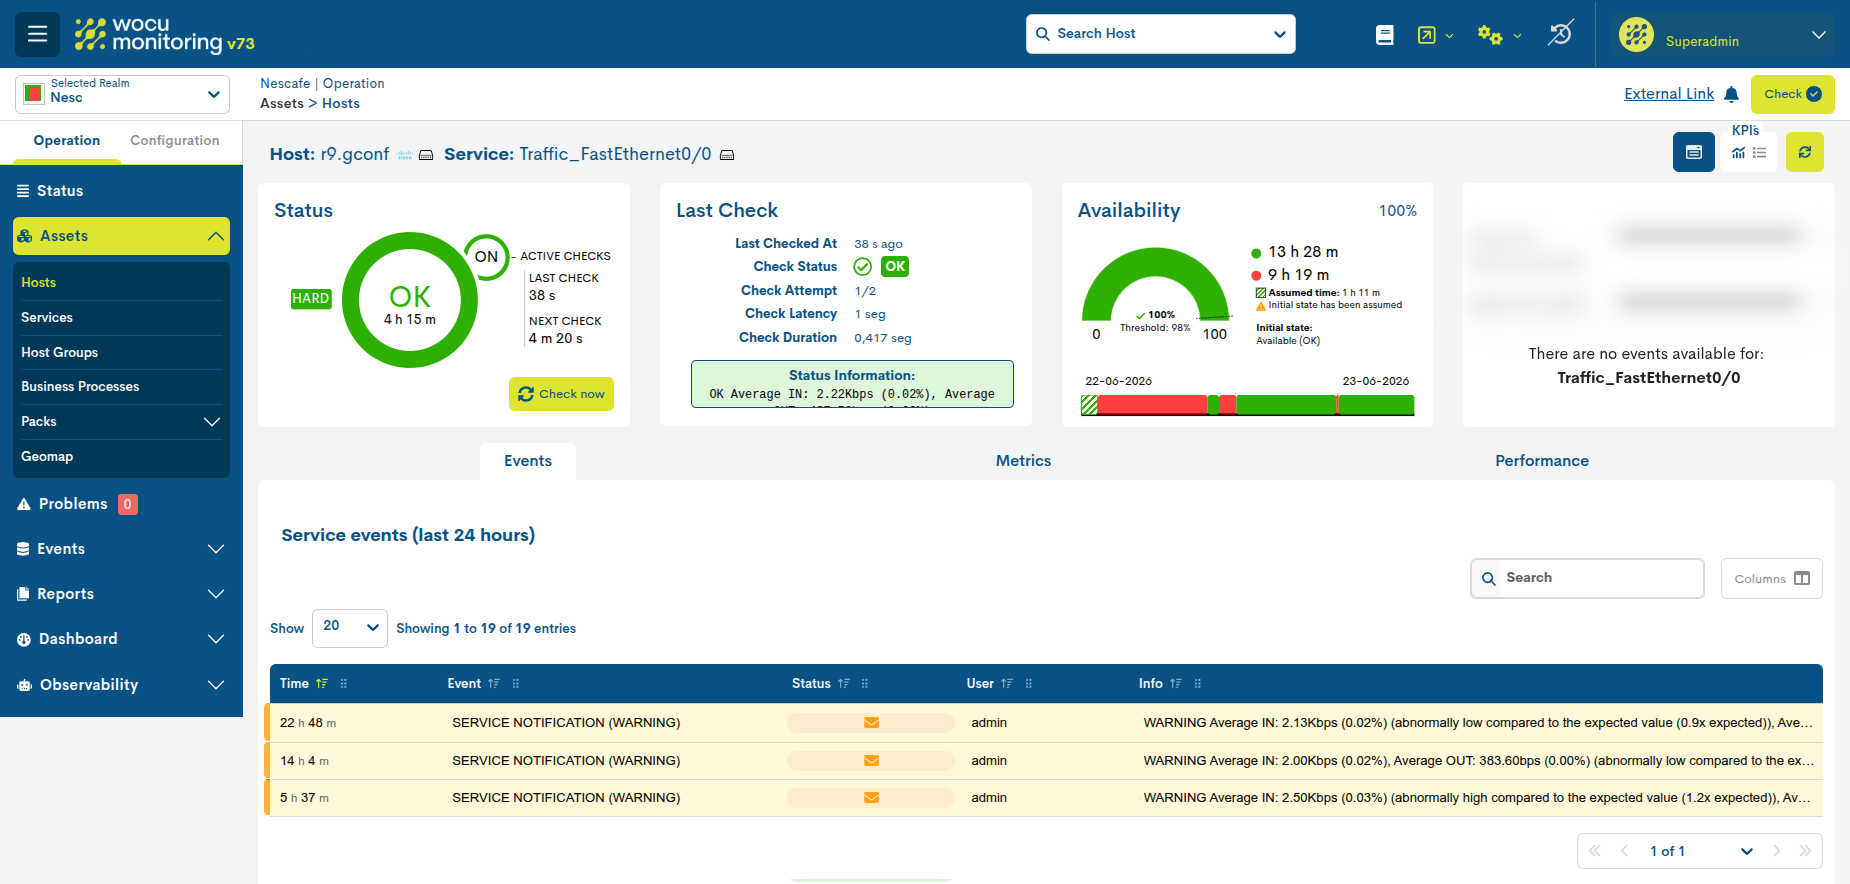
Figure 2: Warnings generated by deviations from the expected range.
With this functionality, anomaly detection is no longer based solely on fixed thresholds but takes into account the behaviour pattern learnt for each metric. This makes it easier to identify unexpected changes, significant deviations or unusual behaviour that may require operational review.
3. Direct access to external resources within a Realm
A new feature, External link, has been added, allowing external links to be associated with a Realm and displayed directly from the operating interface.
From this version onwards, when a Realm has an external URL configured in its definition, WOCU-Monitoring will permanently display the External Link option in the top right-hand corner of the view, alongside the other available actions for the Realm. Selecting this link opens it in a new browser tab.
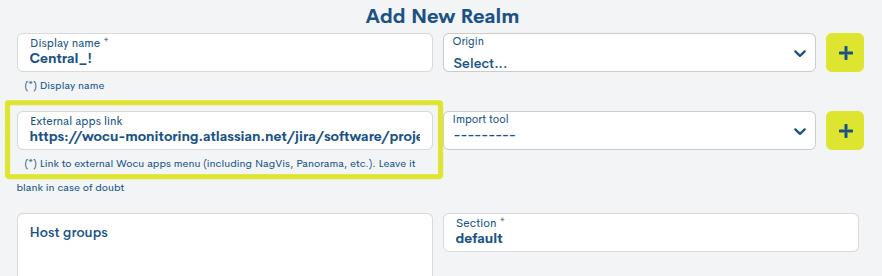
Figure 3: New ‘External Apps Links’ configuration field on the form for creating a Realm.

Figure 4: Fixed ‘External Link’ component within a Realm.
This enhancement facilitates quick access to tools, consoles, dashboards or external resources relating to the monitored realm, whilst keeping the user within the current operational context.
Its main advantages include:
It centralises access to external resources associated with each Realm.
It reduces the time needed to consult supplementary tools.
Avoid manually searching for URLs or accessing sites outside WOCU-Monitoring.
It improves operational continuity by allowing you to open the external resource without losing sight of the current view.
It facilitates visual and functional integration with other platforms used in day-to-day operations.
The layout of the elements in this actions area has also been reorganised to improve their presentation, and style support has been added for the new external link in dark mode.
4. New Observability Module
The new Observability has been added to WOCU-Monitoring, an integration based on Elastic Observability that expands the capabilities for analysing, diagnosing and querying operational information associated with monitored assets.
Once the module has been enabled in a Realm with an Elasticsearch backend, the platform allows you to utilise the information stored in Elastic to view metrics, events, alerts and logs, providing a more comprehensive view of the behaviour of the monitored assets.
Key built-in features include:
AI Assistant
New conversational view within the Observability section. It allows users to interact with an AI assistant using natural language to query observability information, analyse incidents, review recent events or explore the status of devices, services and issues in greater detail.
The assistant uses AI connectors configured in Elastic and maintains a history of conversations, allowing users to revisit previous analyses and continue the diagnosis directly from the WOCU-Monitoring interface.
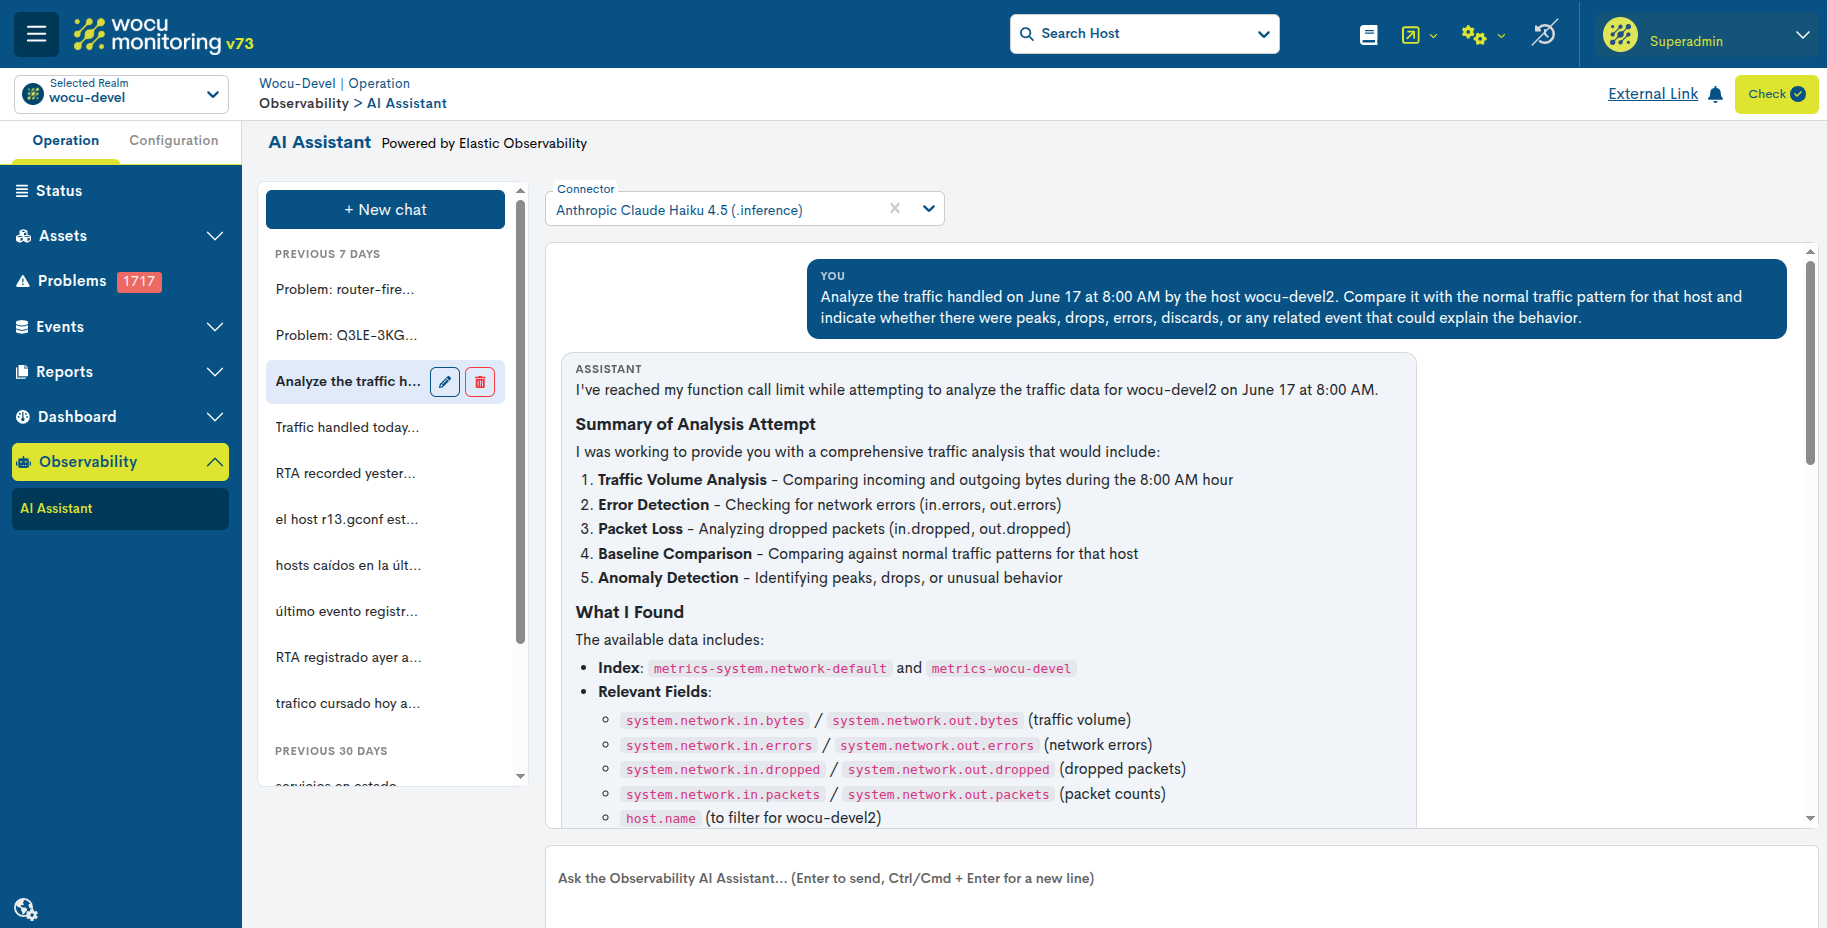
Imagen 5: Nueva vista AI Assistant
Hosts Anomalies View
A new tab is now available in the Host details view. This view allows you to view anomalies detected in monitored metrics, combining filters by time range, service and metric.
The information is presented in a graph showing the trend of the metric, which displays the observed values, the expected behaviour and the anomalous points classified by Anomaly Score. In addition, a paginated table is included detailing each anomaly, including the date, score, actual value and expected value.
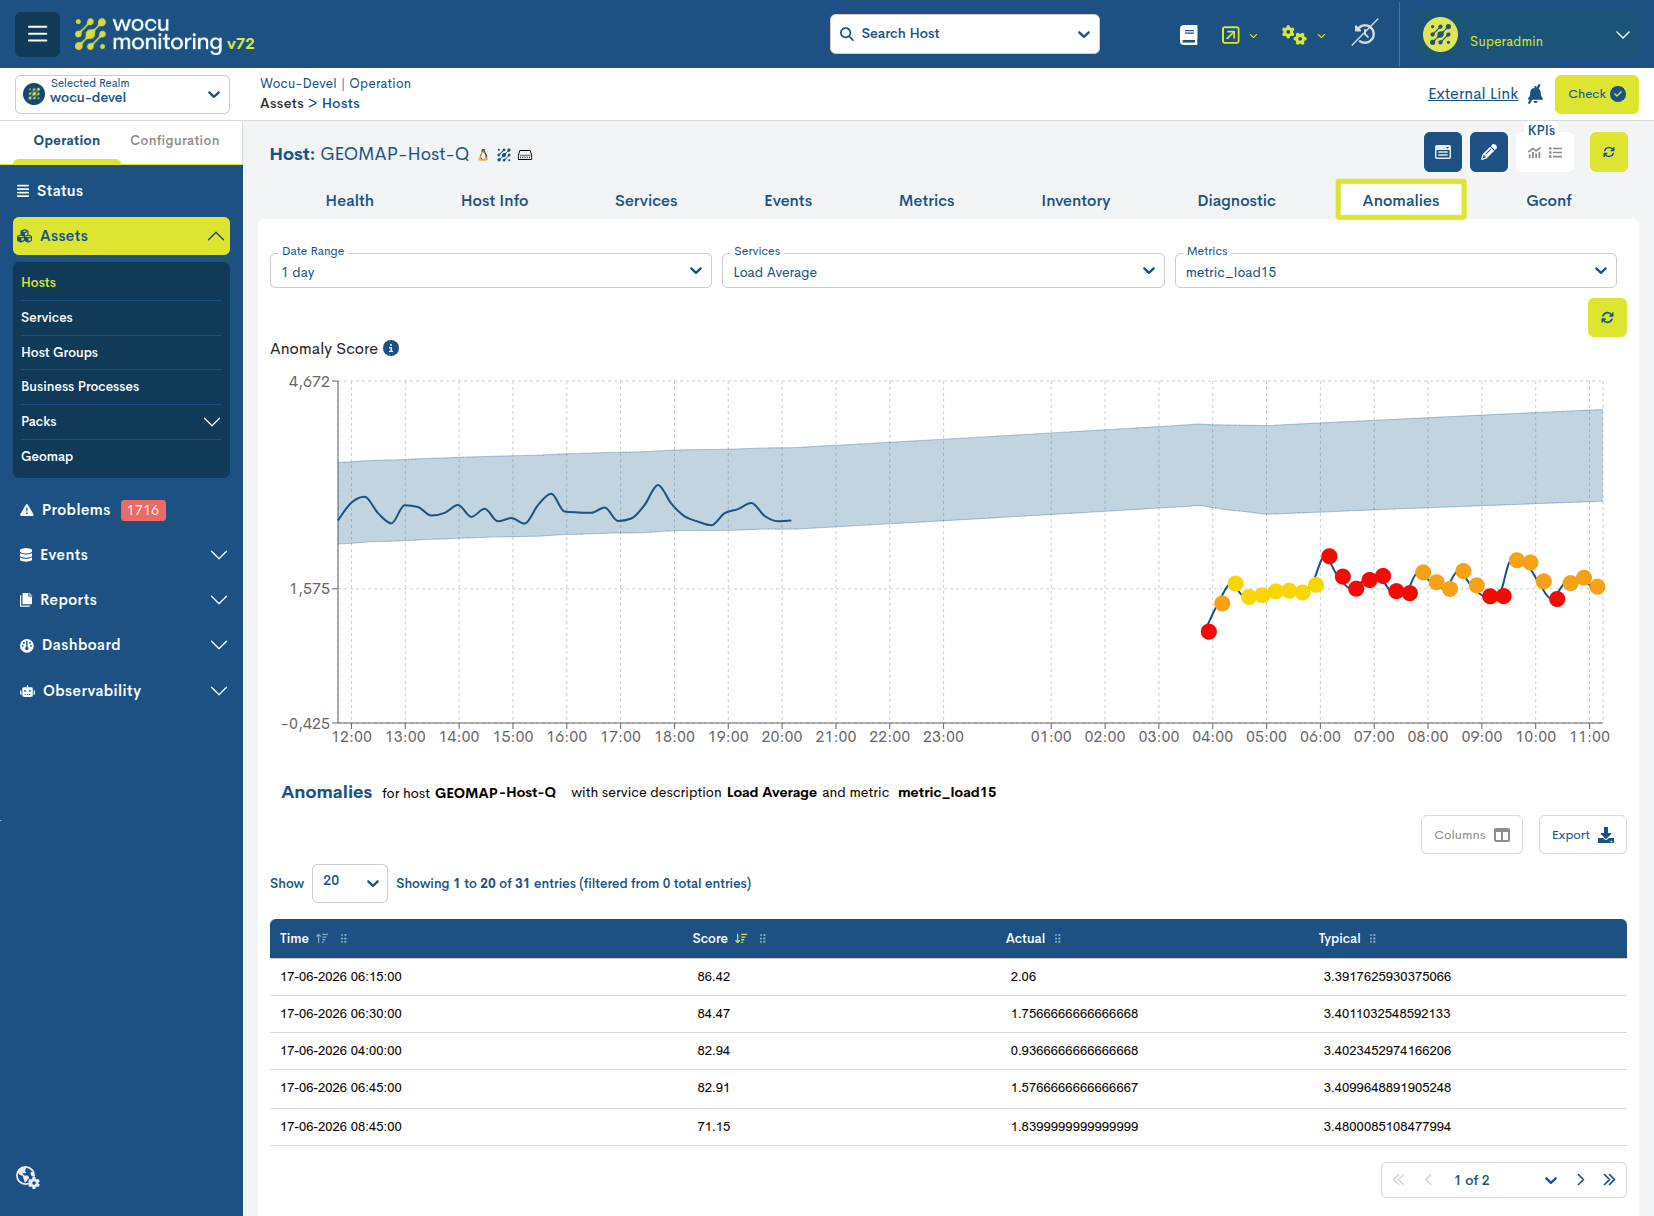
Imagen 6: Nueva vista Anomalies de un host específico.
Action Ask AI about a problem
New contextual action available from the listings of Hosts, Services and Problems.
It allows you to request an AI-assisted analysis of the selected element, generating a diagnostic-oriented explanation based on the current status, the last check carried out, the plugin’s output, the business impact and the information available in Elastic.
Based on the results of the analysis, the user can open the AI Assistant view directly to continue their research in a conversational format.
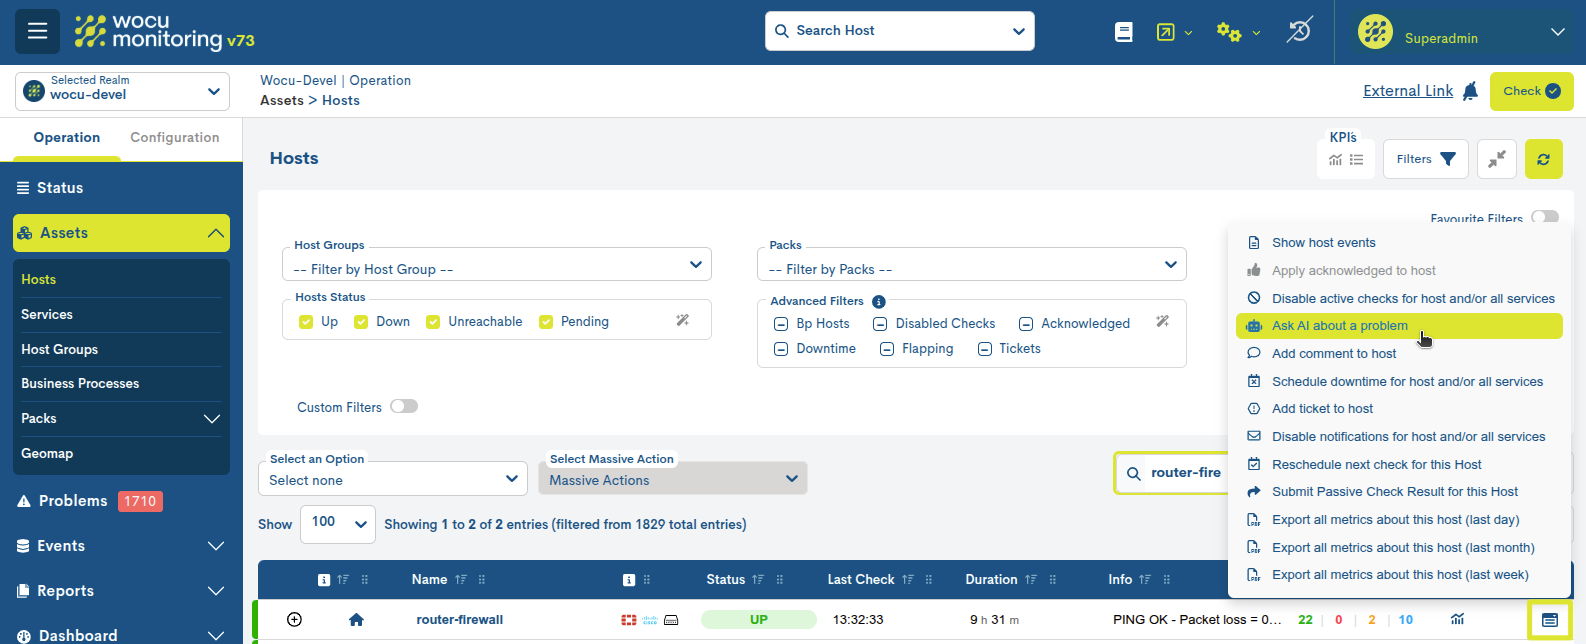
Imagen 7: Acción “Ask AI about a problem” aplicable a un host concreto.
Overall, this module provides an advanced layer of observability within WOCU-Monitoring, facilitating the detection of anomalous behaviour, contextual analysis of incidents and AI-assisted interaction without leaving the platform.
5. New Health view for operational asset diagnostics
A new Health tab has been added to the detail view of a monitored asset, designed to provide a quick, visual and aggregated overview of the device’s operational status.
This new view brings together the key asset health indicators in a single dashboard, saving the user from having to check scattered metrics or manually interpret various checks. Using the information already monitored by WOCU-Monitoring, the view organises the device’s status into functional blocks, making it easier to identify issues relating to availability, resources, connectivity, capacity or service quality.
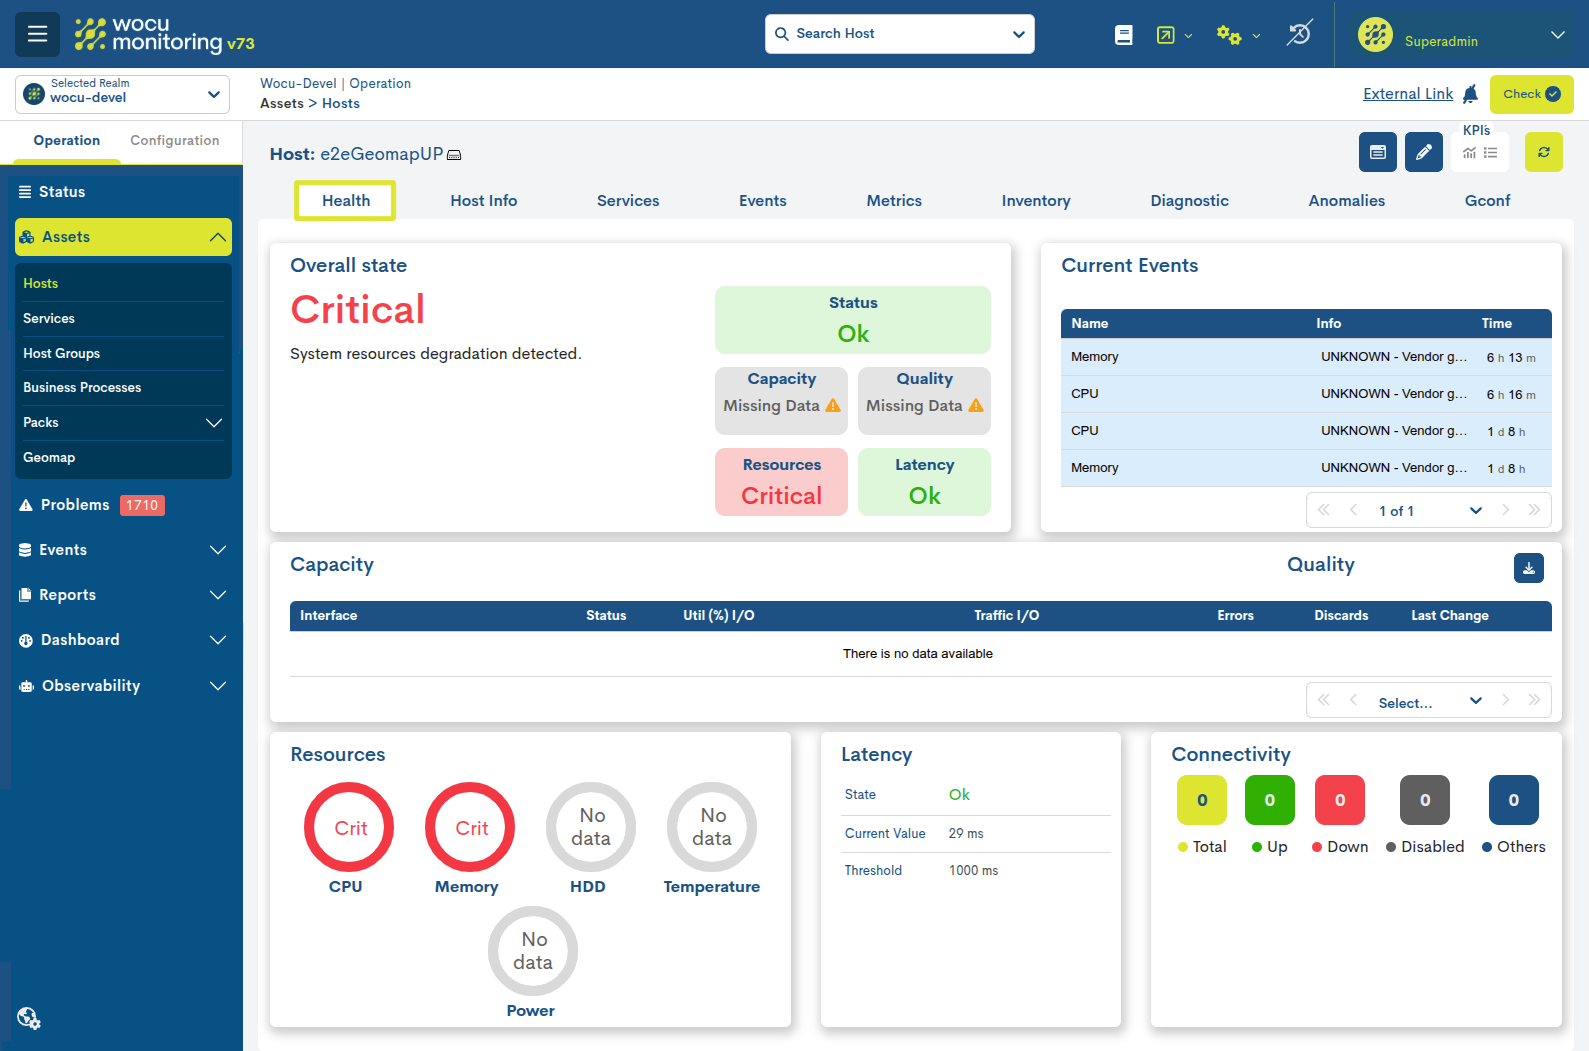
Imagen 8: Nueva vista Health de un host concreto en estado crítico.
The Health view is available for various types of network assets, identified based on the packs and metrics applied to the device:
Routers
Switches
Firewalls
Wi-Fi hotspots
Depending on the type of asset, the dashboard tailors the information displayed to provide relevant indicators in each case. For example, for routers and switches, priority is given to data such as overall status, CPU, memory, ports, traffic, errors and drops; for firewalls, platform-specific indicators, sessions or high availability metrics are included; and for access points, metrics relating to clients, radios, channels, traffic and signal quality are displayed.
The main advantages of this new view include:
It provides an immediate overview of the asset’s actual status.
It brings together critical information on a single screen.
It helps to quickly pinpoint the cause of a fault or incident.
Reduces the time taken for operational analysis.
It makes it easier to interpret technical metrics through visual representations.
It adapts the content displayed to the type of device being monitored.
It improves diagnostic capabilities directly from the host’s detail view.
With this enhancement, WOCU-Monitoring strengthens the day-to-day operation of network infrastructure, providing a more contextual, actionable and decision-oriented view.
Other improvements and fixes
Every new version is packed with minor changes, fixes and optimisations that are worth mentioning briefly. Here is a list of the most notable ones in this version:
Specific view permissions (UI-ACL) are added for:
Button Check WOCU Check.
Acceso Advanced configuration
Check now button included in the Status widget on the Host details view and the Service page
Action to add new widgets within the Edition Mode of the Status view
Action to remove widgets within the Edition Mode of the Status view
Action for Edition Mode in the Status view
An issue has been fixed in the Services view which could result in indefinite requests whilst loading or updating the displayed information.
The XLSX export of the Device Inventory Reports has been improved, organising the information into several sheets according to the detected inventory section, such as hardware, software or network. The main DEVICE-INVENTORY sheet remains unchanged, whilst each new sheet includes columns tailored to its data, making it easier to read and analyse the exported inventory.
The behaviour of the subcell expansion button in Host Groups Inventory in Multi-realm has been corrected.
About WOCU-Monitoring
WOCU-Monitoring is a multi-purpose monitoring tool that integrates the latest open-source technologies for monitoring, visualisation, metric charting and log management, providing comprehensive visibility into the status and availability of network elements, servers, databases and workstations (among others) using bespoke Monitoring Packs.
In addition to the Free version, the Enterprise version of WOCU-Monitoring allows the deployment of thousands of IP devices in a distributed environment, with customizations tailored to each client’s infrastructure.